

Submitted:
17 July 2026
Posted:
21 July 2026
You are already at the latest version
Abstract
Conventional image acquisition requires an electrically powered image sensor to be placed directly behind the camera lens, constraining camera placement. To overcome this issue, we introduce M3-RGB as an incoherent-light fiber imaging system in which a multi-core, multi-mode optical fiber passively relays lens images to a remotely located image sensor. Unlike conventional approaches, M3-RGB is designed to operate directly on incoherent light and requires no electrical power or active components at the sensing interface. Because propagation through the fiber yields spatially scrambled patterns, a neural network is used to reconstruct the original scene by exploiting the spatial locality preserved by the multi-core structure. In a controlled optical bench setup, where an LCD monitor displays road-scene images, we construct a paired dataset of scrambled and ground-truth images and quantitatively evaluate reconstruction performance across different fiber core counts, fiber lengths, and calibration settings, utilizing the peak signal-to-noise ratio and structural similarity index measure as performance metrics. By decoupling imaging electronics from the sensing point, this passive remote image relay approach may expand sensor placement options for potential applications such as all-around perception for mobile robots and autonomous vehicles, surveillance, and inspection in confined spaces. Evaluations in real outdoor environments remain targets for future work.
Keywords:
multi-core
; multi-mode optical fiber
; incoherent-light fiber imaging
; passive optical image relay
; fiber-based imaging
; image reconstruction
; computational imaging
; deep learning
; vision transformer
1. Introduction
Image acquisition conventionally requires an electrically powered image sensor to be positioned directly behind the lens, meaning imaging electronics must be co-located with the optical aperture. Such tight coupling constrains camera placement, as every sensing point requires power and data cabling, must dissipate heat, and must reserve physical space for the lens-and-sensor assembly. A passive optical relay that transports lens images to a remotely located image sensor, without any electronics or electrical power at the sensing interface, would substantially relax these constraints. In this study, we investigate incoherent-light fiber imaging through a multi-core, multi-mode optical fiber, where the fiber passively relays the scenes captured by the lens to a remote image sensor for computational reconstruction.
One important application domain motivating this study is multi-camera perception for autonomous mobile robots and self-driving vehicles. Such systems are becoming increasingly reliant on large numbers of cameras to achieve safe and comprehensive perception, which raises hardware costs and complicates power and data cabling, thermal management, and the physical placement of lenses and sensors on platforms. For example, the AutoVision project [1] employs 16 surround-view cameras, including RGB and near-infrared sensors, to achieve robust vehicle localization and dense 3D scene understanding, while the nuScenes dataset [2] relies on six synchronized surround-view cameras to provide full 360-degree coverage. These examples illustrate how the number and placement of image sensors directly drive system cost and integration complexity, motivating the development of sensing architectures that decouple imaging electronics from the optical sensing point.
Accordingly, we propose an imaging system called M3-RGB, where “M3” is derived from “multi-core, multi-mode,” referring to the optical fiber at the heart of our system. Unlike a conventional camera, M3-RGB does not project scene light directly onto the image sensor through a lens. Instead, the system first transfers the light captured by the lens into a multi-core, multi-mode optical fiber, transmits it over a distance, and then projects it onto a remotely located image sensor (see Figure 1). In this context, the term “passive” refers to the distal sensing interface and fiber link, which require no electrical power or active components. The image sensor itself resides remotely and receives electrical power, as in a conventional camera. Furthermore, we designed M3-RGB to operate directly on incoherent light, without any laser source or spatial light modulation. Section 2 presents detailed comparisons with coherent, laser-based fiber imaging approaches.
The image that emerges after multi-core, multi-mode fiber transmission appears as a scrambled pattern, as under incoherent scene light, each object point excites many guided modes, whose intensity contributions are added in the output. In our configuration, we interpret this distortion as intermodal dispersion and mode mixing, which broaden the point response within each core, while the discrete core structure segments incoming images across cores [6,11] (see Figure 2). Despite the presence of such distortion, the scrambled images retain partial information from the original optical signals. M3-RGB reconstructs original scenes from this optical channel using a neural network.
The main contributions of this study can be summarized as follows:
- We propose M3-RGB as an incoherent-light, passive remote image-relay system based on a multi-core, multi-mode optical fiber that requires neither an auxiliary laser source nor electrical power at the sensing interface.
- We construct a paired dataset of scrambled and ground-truth road-scene images, enabling supervised image reconstruction through the optical channel of a multi-core, multi-mode fiber.
- We quantitatively evaluate image reconstruction performance across different fiber core counts, fiber lengths, and calibration settings.
This study focuses on controlled optical bench characterization using LCD-displayed road-scene images and condition-specific reconstruction models. We leave real outdoor dynamic scenes and cross-configuration generalization for future work.
The remainder of this paper is organized as follows. Section 2 reviews related studies on multi-camera perception systems and fiber-based imaging. Section 3 details the M3-RGB sensor system. In Section 4, the proposed method is evaluated through quantitative experiments. Section 5 discusses the scope and limitations of this study. Section 6 presents envisioned application scenarios and directions for future research. Finally, Section 7 concludes the paper.
2. Related Work
2.1. Multi-Camera Perception Systems
As a motivating application domain, autonomous mobile robots and self-driving vehicles have become increasingly reliant on multiple image sensors for omnidirectional perception [3,4,5], amplifying the costs and integration constraints discussed in the previous section. By relaying lens images to a remotely located image sensor passively, M3-RGB decouples imaging electronics from the optical sensing point, thereby relaxing integration constraints, such as sensor placement and cable routing. However, we emphasize that such multi-camera perception is merely one representative application scenario, rather than the main focus of this study, the central contribution of which is incoherent-light image transmission and reconstruction through a multi-core, multi-mode optical fiber.
2.2. Fiber-Based Imaging
A number of previous studies have investigated imaging systems utilizing multi-mode fibers, fiber bundles, and disordered fibers. For example, Caramazza et al. [6] present a statistical approach for the high-quality imaging of arbitrary natural scenes transmitted through a multi-mode fiber. Using 50,000 ImageNet images, their model learns a single complex-valued inverse transmission matrix that maps output speckle patterns back to input images. This approach enables full-color, high-resolution video capture at 20 fps through fibers up to 10 m long, without requiring phase-sensitive measurements or deep neural networks. However, this method requires a continuous-wave laser, as a spatial light modulator (SLM) modulates image information onto the laser beam, and the setup then transfers the modulated light into a multi-mode optical fiber. Similarly, the configuration proposed by Liu et al. [7] also requires a laser source in conjunction with a multi-mode fiber. Furthermore, the imaging principle of their method differs fundamentally from ours, as the intermodal dispersion of a kilometer-long fiber driven by a pulsed laser converts spatial information into one-dimensional temporal waveforms, and their method recovers images from these waveforms, rather than from spatial intensity patterns captured by an image sensor. In contrast, our M3-RGB system does not require any laser source and operates solely based on incoherent scene light, directly capturing spatial intensity patterns at the fiber output.
Zheng et al. [8] introduce a neural-network-based method for the single-ended recovery of multi-mode optical fiber transmission matrices (TMs) using multi-wavelength reflection-mode measurements, thereby eliminating the need for distal-end access. Their work advances ultra-thin, high-speed endoscopic and remote imaging by enabling real-time TM estimation from a single fiber end. However, the goal of their work is to calibrate the fiber channel itself to recover its transmission matrix as a precursor to imaging, whereas M3-RGB performs end-to-end image reconstruction directly from captured fiber outputs, without estimating a transmission matrix.
Previous studies have also applied deep learning to image reconstruction based on other fiber-optic media. Hu et al. [9] demonstrate the unsupervised full-color image reconstruction of cellular specimens transmitted through a disordered optical fiber, successfully recovering high-fidelity images without paired training data. Shao et al. [10] enhance the resolution of fiber bundle (coherent multi-core bundles) imaging using a deep network that suppresses the honeycomb pixelation artifacts inherent to fiber bundles. Both methods target microscopy and endoscopy, where a dedicated, controlled light source illuminates the target. For example, active illumination lights the specimen in both the transmission and reflection imaging modes demonstrated in [9], while a dedicated white light-emitting diode source illuminates the target in [10]. Consequently, the captured signals depend on this purpose-built illumination, rather than on the light emanating from the scene naturally. In contrast, M3-RGB reconstructs road-scene image content acquired under controlled conditions, forming images from incoherent light from LCD-displayed road-scene images in the experiments presented here and, in principle, from real scenes, without requiring laser illumination, spatial light modulation, or a dedicated illumination unit at the fiber sensing interface. This distinction in illumination requirements, in combination with our use of a multi-core, multi-mode fiber, distinguishes our setting from previous illumination-dependent fiber imaging approaches.
Closely related to our setting, Fukushima et al. [11] propose a streamlined direct image-transmission system. Similar to M3-RGB, their system relies only on lenses, an optical fiber, an image sensor, and a reconstruction network, and operates on incoherent scene light without a laser source. However, their system uses a single-core (plastic) optical fiber, and they focus on the reconstruction of relatively simple content, such as handwritten characters and digits, as well as evaluations of robustness to fiber bending, twisting, and temperature variation. In contrast, M3-RGB employs a multi-core, multi-mode optical fiber and reconstructs general road-scene image content, which is a reconstruction problem with higher spatial complexity and natural image variability in terms of texture, color, and fine spatial detail. In short, Fukushima et al. demonstrate direct ambient-light image transmission through a single-core plastic fiber and its environmental robustness, whereas our focus lies on a multi-core, multi-mode fiber and the characterization of core count and length dependence for natural road-scene image reconstruction. These differences in fiber structure (single-core versus multi-core), target content (simple characters versus general scenes), and evaluation axis (feasibility and robustness demonstration versus systematic core count and length characterization) distinguish our work from this closely related study.
Table 1 summarizes the representative fiber-based imaging studies reviewed above and the relative position of M3-RGB. The proposed method differs from these studies in the following respects. First, unlike coherent approaches [6,7] and illumination-dependent approaches [8,9,10], M3-RGB operates solely on incoherent scene light, requiring neither a laser source, spatial light modulation, nor dedicated illumination at the sensing interface. Second, while previous studies have demonstrated incoherent-light transmission only with a single-core fiber and simple content [11], M3-RGB employs a multi-core, multi-mode fiber and reconstructs natural road-scene images. Third, in terms of evaluation axes, M3-RGB provides a systematic characterization of reconstruction performance across different core counts, fiber lengths, and calibration settings, which have not been addressed by any of the reviewed studies. Rather than claiming novelty based on the use of road-scene imagery alone, we define the contribution of this work as the combination of these aspects. To the best of our knowledge, no previous study on fiber-based image reconstruction has reported the combination of a passive incoherent display/scene light, multi-core, multi-mode plastic optical fiber (POF), natural road-scene content, and systematic core-count/length/calibration characterization. We consider road-scene content as one of the evaluation targets within this combination, rather than the primary contribution of our work.
3. M3-RGB
In this section, we introduce the proposed sensor system, called M3-RGB. We first present an overview of the system and the physical origin of the scrambled measurements captured by a multi-core, multi-mode optical fiber, and then present the reconstruction network architecture and evaluate its training loss.
3.1. Overview
This subsection presents an overview of M3-RGB (see Figure 1 and Figure 3). In conventional camera systems, the image sensor directly digitizes scene light passing through the lens. In contrast, M3-RGB first transfers the scene light transmitted through the lens into a multi-core, multi-mode optical fiber to extend the distance between the lens and image sensor. After the light propagates through the fiber, the image sensor digitizes the received light. This setup allows M3-RGB to capture light transmitted through a single fiber, as well as, in principle, light from multiple fibers, utilizing a single image sensor, although this study evaluates only a single fiber end face. Section 6 discusses the multi-fiber configuration as a topic for future work. Previous studies have primarily relied on single-core, multi-mode optical fibers. In this work, to improve image reconstruction performance, we employ multi-core, multi-mode optical fibers in addition to single-core fibers.
Images captured by the sensor appear as scrambled patterns, as illustrated in Figure 4. This scrambling is a result of multiple optical effects within the fiber, namely the excitation of many guided modes at the entrance face, followed by intermodal dispersion and mode coupling during propagation. In a single-core fiber, the transmitted content is virtually indiscernible to the human eye. However, as the number of cores increases from 217 to 7400, the transmitted scene gradually becomes recognizable to the human eye (see Figure 4) because the scrambling effect remains spatially confined to the region corresponding to each individual core.
Figure 5 presents a conceptual illustration of incoherent light propagation in a multi-mode optical fiber. Scene light from different sources enters the fiber at varying angles and positions, exciting multiple guided modes that travel along distinct paths and undergo repeated internal reflections within the fiber core. Because the incident scene light is incoherent, these excited modes do not form a stable coherent speckle pattern under the target broadband display illumination and camera exposure conditions. Instead, their intensity distributions are superimposed at the output. Therefore, we can interpret each object point as spreading over a broad output intensity distribution through intermodal (modal) dispersion, and the mode coupling induced by fiber bending and imperfections further enhances this spreading [6,11], strongly blurring the mapping between input positions and output intensities. In a multi-core fiber, discrete cores sample and segment images, effectively dividing spatial information across cores while smearing it within each core. As a result, transmission partially degrades, rather than completely destroys, the original spatial structure. In the single-core case, this degradation is severe, whereas the multi-core structure retains spatial locality at the core scale, and the output light forms a scrambled intensity pattern at the image sensor. This process highlights the complexity of multi-mode fiber transmission and the challenge of image reconstruction.
By reconstructing scrambled images using the neural network architecture described in the following subsection, the proposed system can approximate the functionality of a conventional camera for image acquisition.
3.2. Architecture
This subsection presents the architecture of our neural network, which is designed to reconstruct original images from their scrambled counterparts. Previous studies on multi-mode optical-fiber-based imaging have employed architectures such as U-Net and fully convolutional networks (e.g., [8]). In this study, we adopt a multi-stage vision transformer (ViT)-based design as the reconstruction backbone. We employ an attention mechanism and multiple positional embeddings to model the correspondence between distorted optical patterns and the original spatial structure of the target scene.
Figure 6 illustrates the proposed reconstruction architecture, which is implemented in M3-RGB. M3-RGB tokenizes a scrambled input image at two different patch sizes and processes it using two parallel ViT branches: one branch that operates on small patches to extract fine-grained local details and another that operates on larger patches to capture broader contextual information. Each branch has its own positional embeddings. An attention-based fusion block followed by a multi-layer perceptron (MLP) then integrates the token representations from the two branches and maps the fused features back into the image domain to reconstruct the original scene. The training loss function is described below.
In M3-RGB, we employ a channel-weighted reconstruction loss function (Equations (1) and (2)) for image reconstruction through multi-mode fibers. This formulation incorporates channel-wise weights to account for wavelength-dependent propagation losses. We apply these weights to the per-pixel error term, allowing the model to emphasize channels that experience stronger attenuation during transmission. In Equation (2), B denotes the batch size, C denotes the number of color channels (here ), and H and W denote the image height and width, respectively. and are the reconstructed and ground-truth pixel intensities, respectively, at channel c and spatial location in the b-th sample.
The weight vector in Equation (1) consists of three weights corresponding to the color channels, and in Equation (2) denotes the weight for channel c. In practice, multi-mode fibers exhibit higher propagation loss in the red wavelength region, while green and blue wavelengths experience comparatively lower losses. In all experiments, we used based on the propagation loss specification of the plastic multi-mode optical fiber, while accounting for the peak sensitivity wavelengths of the camera. Accordingly, the red channel, which experiences the strongest attenuation, receives the largest weight. We used the same weights for all fiber configurations, and this behavior is incorporated into our training process using the weighted formulation defined in Equation (2).
4. Experiments
To evaluate the proposed sensor system, we first constructed a paired dataset of ground-truth and scrambled road-scene images, and then conducted three experiments to assess the effects of the following factors on reconstruction performance:
- the number of fiber cores;
- fiber length;
- and rotation calibration.
The following subsections detail the dataset construction process and each of our experiments.
4.1. Dataset Construction and Experimental Setup
We first constructed a dataset consisting of paired scrambled images and their corresponding ground-truth images from road environments using the visible (RGB) frames of the Teledyne FLIR ADAS dataset [12]. To the best of our knowledge, there is no existing multi-core, multi-mode fiber imaging dataset targeting road environments. The FLIR ADAS dataset contains road-environment data acquired in Europe and the United States, and the subset used in this study consisted of 11,777 image samples. Figure 7 presents examples of ground-truth images from the constructed dataset. One can see that the dataset includes both daytime and nighttime data from typical road environments. For each of the ground-truth images, we created a corresponding scrambled image. For our experimental conditions, we set the lengths of the multi-core, multi-mode optical fibers to 1.0, 5.0, and 10.0. We also constructed datasets for fibers with different core counts, including single-core, 217-core, 613-core, 1300-core, and 7400-core configurations. Figure 4 presents the image data for each core count configuration.
We captured the scrambled images using an optical bench, as illustrated in Figure 3. An LCD monitor presents each ground-truth image and serves as the target scene. An objective lens collects the displayed image and transfers it into the multi-core, multi-mode optical fiber, which is a POF (core diameter mm, numerical aperture , and the term “POF” in Figure 3 refers to this same fiber), and a second objective lens and an achromatic doublet relay the fiber output onto the image sensor of a camera module. This monitor-based configuration supports a controlled and repeatable approach to obtaining a large number of precisely paired input and ground-truth images, which is essential for supervised training and isolating the effects of the fiber parameters (core count, fiber length, and calibration). Accordingly, the experiments described in this paper aim to characterize the basic imaging performance of M3-RGB under controlled conditions. Section 5 systematically discusses the limitations of this controlled, display-based setup.
We randomly partitioned the image pairs into training, validation, and testing sets at an 8:1:1 ratio. We used the training set solely for model optimization, the validation set for model selection (i.e., for choosing the best-performing checkpoint during training), and the held-out testing set exclusively for final evaluations. To ensure fair comparisons across all fiber configurations, we applied identical partitioning to every core count and fiber length condition, meaning a given scene always belonged to the same subset. We generated the split using a fixed random seed to guarantee reproducibility. Unless otherwise stated, all reported quantitative results were computed on the testing set.
For each experimental condition (i.e., each combination of core count, fiber length, and calibration setting), we trained an independent reconstruction model using the same architecture and hyperparameters. Accordingly, we evaluated condition-specific reconstruction performance, rather than generalizing a single model across all configurations. For reproducibility, Table 2 summarizes the training hyperparameters, which were identical for every fiber configuration.
Some of the experimental conditions involved rotation calibration of the scrambled images. In this study, we performed rotation calibration manually. Specifically for each fiber configuration, we estimated a single global rotation angle by visually inspecting the captured scrambled pattern, aligning it with an approximately front-aligned orientation, and then applying the same angle uniformly to all scrambled images of that configuration. Because we obtained this angle solely based on the appearance of the scrambled data and shared it across the training, validation, and testing splits, this calibration did not use the testing set ground-truth images. We applied calibration to the 217-core, 613-core, and 1300-core fibers. For the 7400-core fiber, the captured scrambled pattern already approximately matched the ground-truth orientation at the time of data acquisition (estimated rotation angle of approximately ), so we applied no rotation calibration. The single-core case was excluded because visual inspection cannot reliably judge the orientation of single-core scrambled data. Section 4.4 discusses the effect of this calibration on reconstruction performance.
4.2. Effect of Core Count on Reconstruction Performance
In our first experiment, we evaluated the effects of varying the number of cores in the multi-core fibers on image reconstruction performance. By using the aforementioned dataset, we conducted image reconstruction experiments and quantitatively assessed reconstruction performance. The evaluation metrics are peak signal-to-noise ratio (PSNR) and structural similarity index measure (SSIM). We report all quantitative results as the mean value over the testing set. The shaded regions in Figure 8, Figure 9, Figure 10, and Figure 11 indicate sample standard deviation across the testing images, and Table 3 likewise reports the mean ± one standard deviation. We compare M3-RGB against two baselines: the unprocessed scrambled image itself and a vanilla single-branch transformer. First, as a reference, we report a raw input baseline, where we compute the PSNR and SSIM directly between the scrambled input image (i.e., the raw image transmitted through the fiber, resized to the evaluation resolution) and the corresponding ground-truth image, without applying any reconstruction. This baseline corresponds to replacing the network output with the raw fiber-transmitted input, effectively quantifying the intrinsic difficulty of each fiber configuration and isolating the contribution of the reconstruction network. Second, to assess the contribution of the parallel two-branch design of M3-RGB, we report the results of a transformer baseline (denoted as “Baseline Trans” in the figures), where we replace the reconstruction network with a vanilla single-branch ViT using a single patch size and single positional embedding, without the parallel branches or attention-based fusion block of M3-RGB. We trained this baseline on the same dataset with the same data splits and training hyperparameters, using a standard (unweighted) L1 reconstruction loss. Figure 8 and Figure 9 present the results of the first experiment with the two baselines. We obtained all results in this experiment without rotation calibration, and the effects of calibration are evaluated separately in Section 4.4. One can see that both the PSNR and SSIM increase as the number of cores increases from the single-core configuration. This trend is attributable to the fact that, as the number of cores increases, the scrambling and associated loss of spatial information become increasingly localized. The results reveal that M3-RGB matches or outperforms the single-branch transformer baseline in terms of PSNR across all core counts, and the margin widens in the high-core-count regime, reaching 2.88 dB for the 7400-core configuration (Figure 8). In terms of SSIM, the difference between the two models is marginal (Figure 9), indicating that the benefit of the parallel two-branch design manifests primarily as a reduction in pixel-wise reconstruction error, rather than in structural similarity.
4.3. Effect of Fiber Length on Reconstruction Performance
In our second experiment, we evaluated the performance differences resulting from changes in the fiber length. The first experiment used a 1.0-m fiber. In this experiment, we extended the fiber length to 5.0 and 10.0 m. Figure 10 and Figure 11 plot the PSNR and SSIM as functions of the fiber length. One can see that even as the fiber length increases to 5.0 and 10.0 m, image reconstruction performance consistently improves as the number of cores increases. Additionally, Figure 12 presents examples of the input scrambled images and corresponding reconstructed images for each core count configuration.
4.4. Effect of Calibration on Reconstruction Performance
In our third experiment, we evaluated the performance differences resulting from calibration. Specifically, we evaluated image reconstruction performance when using the scrambled data shown in Figure 4 directly and when reconstructing images after calibrating the rotation of the scrambled data, following the manual calibration procedure described in Section 4.1. Table 3 presents representative quantitative results for the 1.0-m fiber, with and without calibration where applicable. All results presented in Figure 8 and Figure 9 were obtained without calibration. The evaluation results reveal that calibration provides a consistent, albeit modest, performance improvement.
5. Discussion and Limitations
The experiments reported above established the basic imaging performance of M3-RGB under controlled optical bench conditions. In this section, we first clarify the nature of the target reconstruction problem in relation to general image restoration and super-resolution, and then summarize the limitations of this study systematically.
5.1. Relationship with Image Restoration and Super-Resolution
As shown in Section 3, increasing the number of cores makes the transmitted scene progressively more recognizable, because the scrambling and associated spatial information loss become localized in the regions of individual cores. A natural question is whether the task solved here is genuinely a fiber channel inversion or actually a form of low-resolution or rotated image restoration or super-resolution. The proposed reconstruction problem is not a purely blind inversion of fully randomized speckle patterns. In high-core-count configurations, the multi-core structure preserves partial spatial correspondence between the scene and captured pattern, meaning the target task lies between fiber channel inversion and image restoration/super-resolution. This partial preservation of spatial locality is not regarded as a confounding factor but as a design feature of the proposed sensing architecture. By employing a multi-core, multi-mode fiber, M3-RGB deliberately trades the fully scrambled, single-core speckle regime for a regime retaining spatial locality, which makes reconstruction tractable. In the single-core limit, where no such locality is available, the problem is reduced to a genuinely blind speckle inversion, and reconstruction quality degrades accordingly, consistent with the core count dependence observed in our experiments.
5.2. Limitations
The following limitations should be considered when interpreting the results presented above.
Display-based target and controlled conditions. Because the targets in this study were images displayed on an LCD monitor, rather than a real outdoor three-dimensional scene, the properties of the display, including luminance, spectral characteristics, gamma, refresh rate, polarization, and viewing angle, remained fixed. Consequently, our setup did not reproduce effects specific to natural scenes, including scene depth, object motion, actual nighttime and low-light illumination levels (as opposed to displayed nighttime imagery), backlighting, and high-dynamic-range conditions. Therefore, the reported performance measures characterize the fiber-based imaging channel under controlled conditions and do not represent an evaluation in real-world driving environments.
Condition-specific reconstruction models. As noted in Section 4, we trained an independent reconstruction model for each experimental condition (i.e., each combination of core count, fiber length, and calibration setting), utilizing the same architecture and hyperparameters. Therefore, our evaluations targeted condition-specific reconstruction, rather than a single model generalized across configurations. Accordingly, we did not assess the generalization of a particular model to unseen fiber lengths, core counts, or calibration states.
Scope of the sensing configuration. Our evaluations used a single image sensor to capture a single fiber end face, and we quantified reconstruction quality based on PSNR and SSIM values on the held-out testing set. Multi-end-face acquisition, task-level perception metrics, and robustness to fiber bending, coupling misalignment, and temperature variation are outside the scope of this work. Fukushima et al. [11] have demonstrated a certain level of environmental robustness for a single-core POF, suggesting that a comparable level of robustness may be attainable in our setting. We leave establishing such robustness specifically for the multi-core configuration for future work.
Manual rotation calibration. As described in Section 4, we performed rotation calibration manually, estimating a single global rotation angle for each fiber configuration through a visual inspection of the scrambled pattern. This manual procedure is difficult to apply to the single-core case, where visual inspection cannot reliably judge the orientation, and it does not scale reasonably to a large number of configurations. We leave automating the estimation of the rotation angle, which will allow calibration to proceed without visual inspection and extend to the single-core regime, for future work. In particular, we plan to replace the current visual inspection method with an automatic estimation scheme, potentially based on a checkerboard or fiducial-marker target or on phase-correlation alignment between the captured and reference patterns.
These limitations do not affect the findings reported for controlled conditions, but they specify the conditions under which the results hold and directly motivate the directions outlined below.
6. Future Work
We envision several application scenarios for M3-RGB (see Figure 13). First, M3-RGB can support all-around visual sensing for mobile robots by enabling flexible sensor placement and reducing the number of image sensors required on platforms. Second, the proposed system is well-suited to replacing conventional surveillance cameras, as its passive fiber-based image relay allows imaging electronics to reside remotely from the sensing interface. Third, M3-RGB can support inspection tasks in confined or hard-to-access environments, such as pipelines or narrow industrial spaces, where compact sensing interfaces and remote image transmission are advantageous. We envision these application scenarios as promising future developments, but did not evaluate them experimentally in this study.
Regarding fiber selection in these scenarios, the experiments described in this paper clarified the relationship between the number of fiber cores and reconstruction performance. However, fiber cost increases with the core count. Therefore, in future deployments, we plan to select an appropriate fiber type for each application by weighing the cost that an application allows against the reconstruction performance it requires.
Realizing these scenarios will require extending the current controlled optical bench characterization to real-world operation. Future work will focus on further improving the proposed system and conducting comprehensive performance evaluations across diverse, application-specific use cases, including real outdoor dynamic scenes and cross-configuration generalization. For example, in this study, we used a single image sensor to capture only one fiber end face. As a next step, we plan to extend M3-RGB to a system in which a single image sensor can simultaneously capture multiple fiber end faces, enabling the comprehensive acquisition of the surrounding environment in a single shot.
7. Conclusions
In this paper, we introduced M3-RGB as an incoherent-light fiber imaging system that passively relays lens images to a remotely located image sensor through a multi-core, multi-mode optical fiber and reconstructs captured scenes using a neural reconstruction network and rotation calibration. Under controlled optical bench conditions, where road-scene images displayed on an LCD monitor served as the targets, we constructed a paired dataset of scrambled and ground-truth images and quantitatively characterized reconstruction performance across different fiber core counts, fiber lengths, and calibration settings. Our findings remain limited to this controlled optical bench characterization, and we leave validation on real outdoor scenes for future work. Ultimately, we aim to advance the development of next-generation camera systems that are capable of high-fidelity imaging through complex optical channels.
References
- Heng, L.; Choi, B.; Cui, Z.; Geppert, M.; Hu, S.; Kuan, B.; Liu, P.; Nguyen, R.; Yeo, Y.C.; Geiger, A.; et al. Project AutoVision: Localization and 3D Scene Perception for an Autonomous Vehicle with a Multi-Camera System. In Proceedings of the IEEE International Conference on Robotics and Automation (ICRA), Montreal, QC, Canada, 20–24 May 2019; pp. 4695–4702. [Google Scholar] [CrossRef]
- Caesar, H.; Bankiti, V.; Lang, A.H.; Vora, S.; Liong, V.E.; Xu, Q.; Krishnan, A.; Pan, Y.; Baldan, G.; Beijbom, O. nuScenes: A Multimodal Dataset for Autonomous Driving. In Proceedings of the IEEE/CVF Conference on Computer Vision and Pattern Recognition (CVPR), Seattle, WA, USA, 13–19 June 2020; pp. 11618–11628. [Google Scholar] [CrossRef]
- Sun, P.; Kretzschmar, H.; Dotiwalla, X.; Chouard, A.; Patnaik, V.; Tsui, P.; Guo, J.; Zhou, Y.; Chai, Y.; Caine, B.; et al. Scalability in Perception for Autonomous Driving: Waymo Open Dataset. In Proceedings of the IEEE/CVF Conference on Computer Vision and Pattern Recognition (CVPR), Seattle, WA, USA, 13–19 June 2020; pp. 2443–2451. [Google Scholar] [CrossRef]
- NVIDIA. Physical AI for Autonomous Vehicles, 2024. Available online: https://huggingface.co/datasets/nvidia/PhysicalAI-Autonomous-Vehicles (accessed on 26 January 2026).
- Wilson, B.; Qi, W.; Agarwal, T.; Lambert, J.; Singh, J.; Khandelwal, S.; Pan, B.; Kumar, R.; Hartnett, A.; Pontes, J.K.; et al. Argoverse 2: Next Generation Datasets for Self-driving Perception and Forecasting. In Proceedings of the Neural Information Processing Systems Track on Datasets and Benchmarks (NeurIPS Datasets and Benchmarks), 2021; Available online: https://arxiv.org/abs/2301.00493 (accessed on 3 July 2026).
- Caramazza, P.; Moran, O.; Murray-Smith, R.; Faccio, D. Transmission of natural scene images through a multimode fibre. Nat. Commun. 2019, 10, 2029. [Google Scholar] [CrossRef] [PubMed]
- Liu, Z.; Wang, L.; Meng, Y.; He, T.; He, S.; Yang, Y.; Wang, L.; Tian, J.; Li, D.; Yan, P.; et al. All-fiber high-speed image detection enabled by deep learning. Nat. Commun. 2022, 13, 1433. [Google Scholar] [CrossRef] [PubMed]
- Zheng, Y.; Wright, T.; Wen, Z.; Yang, Q.; Gordon, G.S.D. Single-ended recovery of optical fiber transmission matrices using neural networks. Commun. Phys. 2023, 6, 306. [Google Scholar] [CrossRef]
- Hu, X.; Zhao, J.; Antonio-Lopez, J.E.; Amezcua Correa, R.; Schülzgen, A. Unsupervised full-color cellular image reconstruction through disordered optical fiber. Light Sci. Appl. 2023, 12, 125. [Google Scholar] [CrossRef] [PubMed]
- Shao, J.; Zhang, J.; Liang, R.; Barnard, K. Fiber bundle imaging resolution enhancement using deep learning. Opt. Express 2019, 27, 15880–15890. [Google Scholar] [CrossRef] [PubMed]
- Fukushima, H.; Takai, I.; Ichikawa, T.; Matsubara, H. Streamlined Direct Image Transmission via Plastic Optical Fiber for Automotive Applications. IEEE Access 2025, 13, 187262–187272. [Google Scholar] [CrossRef]
- Teledyne FLIR. Free Teledyne FLIR Thermal Dataset for Algorithm Training (ADAS Dataset); Teledyne FLIR: Wilsonville, OR, USA, 2019; Available online: https://www.flir.com/oem/adas/adas-dataset-form/ (accessed on 30 June 2026).
Figure 1.
(Upper) Conventional camera system. (Lower) Overview of the M3-RGB architecture. The M3-RGB system employs multi-core, multi-mode optical fibers, enabling image transmission with an extended distance between the lens and image sensor, without electrical power along the fiber link.
Figure 1.
(Upper) Conventional camera system. (Lower) Overview of the M3-RGB architecture. The M3-RGB system employs multi-core, multi-mode optical fibers, enabling image transmission with an extended distance between the lens and image sensor, without electrical power along the fiber link.
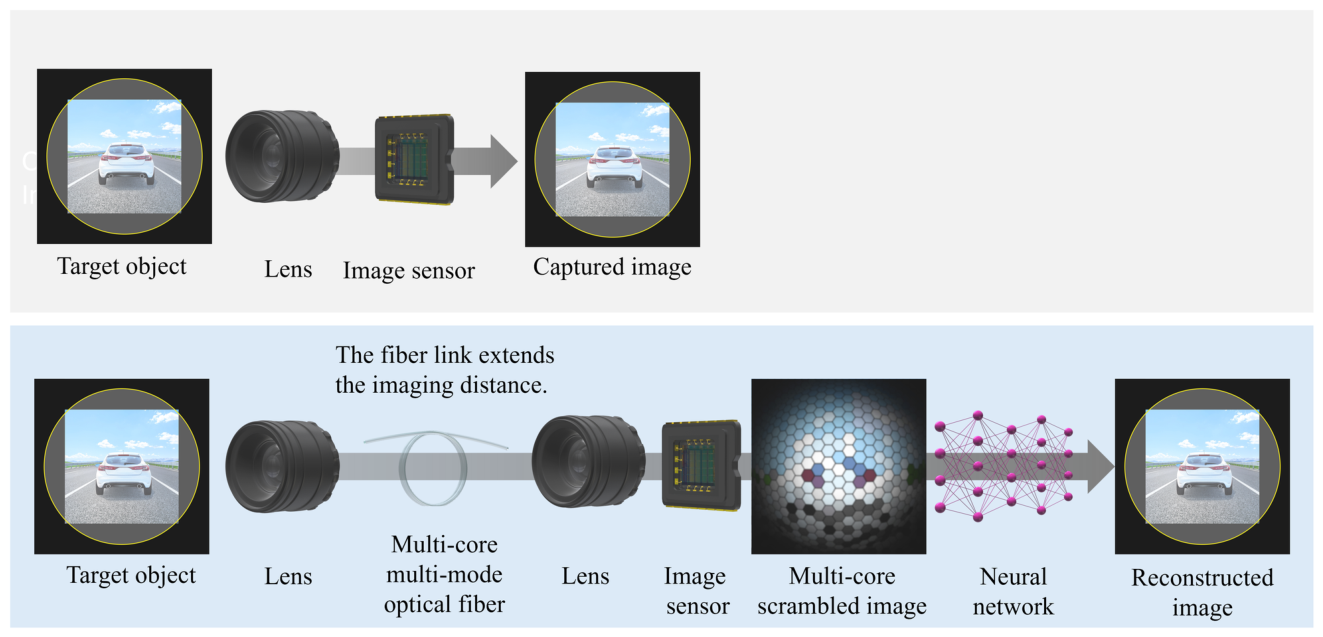
Figure 2.
Examples of input, reconstructed, and ground-truth images obtained with the M3-RGB system. A larger number of fiber cores consistently enhances reconstruction fidelity.
Figure 2.
Examples of input, reconstructed, and ground-truth images obtained with the M3-RGB system. A larger number of fiber cores consistently enhances reconstruction fidelity.

Figure 3.
System overview of M3-RGB, illustrating the complete sensing pipeline, including the optical configuration.
Figure 3.
System overview of M3-RGB, illustrating the complete sensing pipeline, including the optical configuration.

Figure 4.
Example of a ground-truth image (upper left) and its scrambled counterparts captured through fibers with varying core counts: 1 core (upper center), 217 cores (upper right), 613 cores (lower left), 1300 cores (lower center), and 7400 cores (lower right).
Figure 4.
Example of a ground-truth image (upper left) and its scrambled counterparts captured through fibers with varying core counts: 1 core (upper center), 217 cores (upper right), 613 cores (lower left), 1300 cores (lower center), and 7400 cores (lower right).

Figure 5.
Conceptual illustration of incoherent light propagation in a single-core, multi-mode fiber. Light entering at different angles excites multiple guided modes, and because the light is incoherent, these modes superimpose their intensity values, rather than forming a stable coherent speckle pattern under broadband illumination. Intermodal dispersion in combination with mode coupling spreads each object point over a broad output distribution, yielding a scrambled intensity pattern at the sensor. Multi-core, multi-mode fibers embed several isolated cores within a shared cladding, enabling parallel multi-mode propagation while segmenting images across cores.
Figure 5.
Conceptual illustration of incoherent light propagation in a single-core, multi-mode fiber. Light entering at different angles excites multiple guided modes, and because the light is incoherent, these modes superimpose their intensity values, rather than forming a stable coherent speckle pattern under broadband illumination. Intermodal dispersion in combination with mode coupling spreads each object point over a broad output distribution, yielding a scrambled intensity pattern at the sensor. Multi-core, multi-mode fibers embed several isolated cores within a shared cladding, enabling parallel multi-mode propagation while segmenting images across cores.

Figure 6.
Network architecture of M3-RGB for image reconstruction using a ViT with different positional embeddings. The network tokenizes a scrambled image into both small and large patch sizes and processes it through separate ViT branches. An attention block fuses the outputs, and an MLP refines them to reconstruct the original image.
Figure 6.
Network architecture of M3-RGB for image reconstruction using a ViT with different positional embeddings. The network tokenizes a scrambled image into both small and large patch sizes and processes it through separate ViT branches. An attention block fuses the outputs, and an MLP refines them to reconstruct the original image.
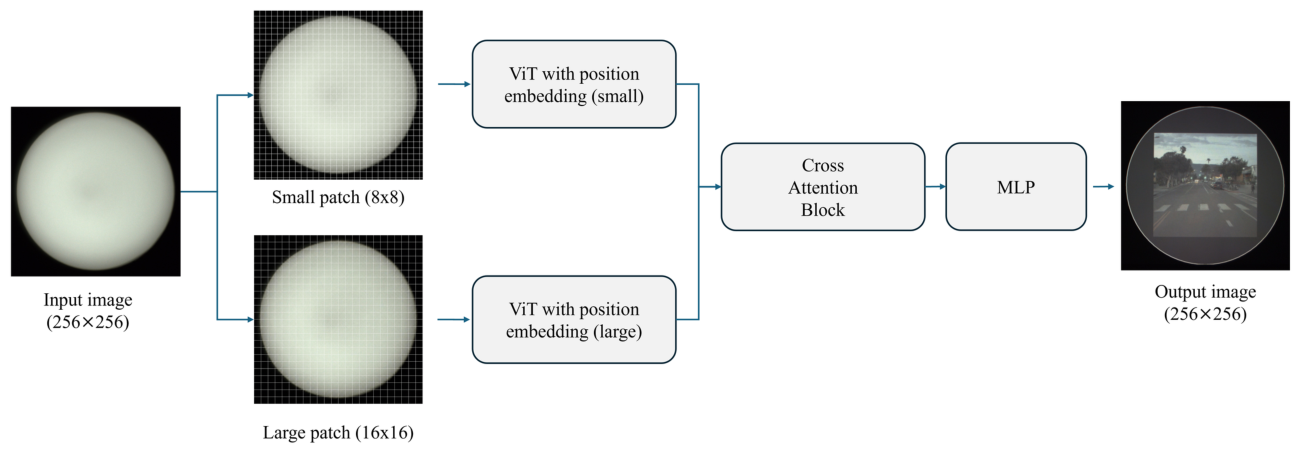
Figure 7.
Example ground-truth images in our dataset. Original images come from [12].
Figure 7.
Example ground-truth images in our dataset. Original images come from [12].

Figure 8.
PSNR evaluation across different numbers of cores using a 1.0-m multi-core, multi-mode fiber. We obtained all results without rotation calibration. This figure compares M3-RGB with the single-branch transformer baseline (Baseline Trans) and raw-input baseline (Baseline raw). Curves represent the mean over the testing set, and the shaded regions indicate standard deviation.
Figure 8.
PSNR evaluation across different numbers of cores using a 1.0-m multi-core, multi-mode fiber. We obtained all results without rotation calibration. This figure compares M3-RGB with the single-branch transformer baseline (Baseline Trans) and raw-input baseline (Baseline raw). Curves represent the mean over the testing set, and the shaded regions indicate standard deviation.
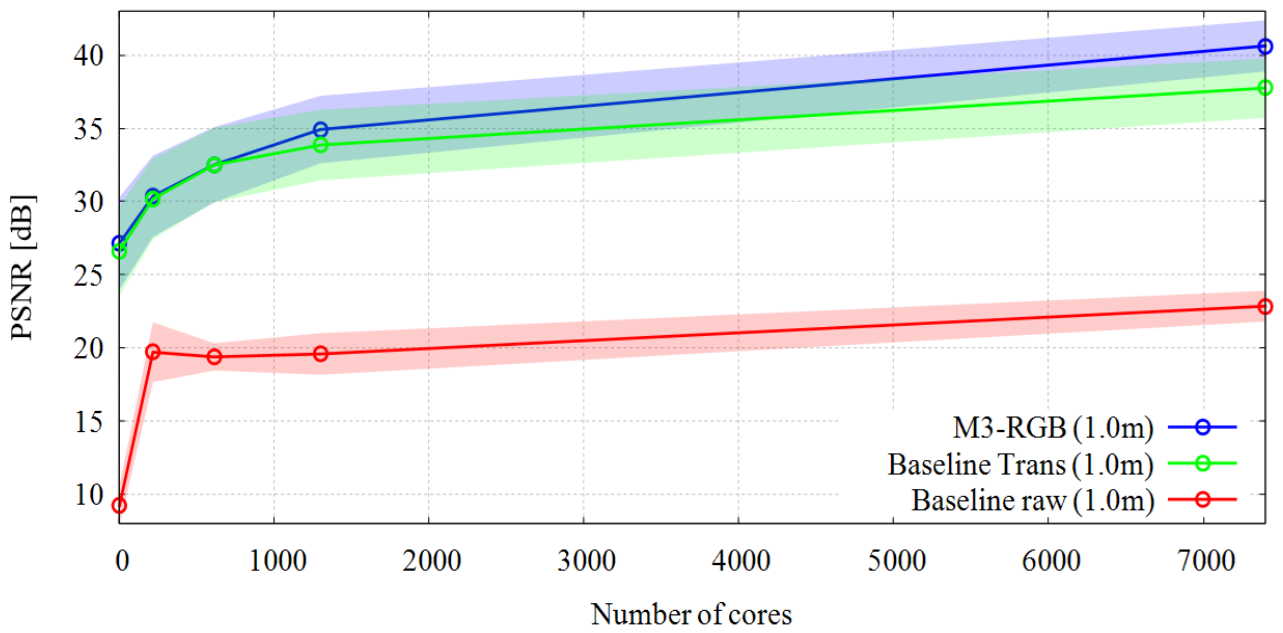
Figure 9.
SSIM evaluation across different numbers of cores using a 1.0-m multi-core, multi-mode fiber. We obtained all results without rotation calibration. The figure compares M3-RGB with the single-branch transformer baseline (Baseline Trans) and raw-input baseline (Baseline raw). Curves represent the mean over the testing set, and the shaded regions indicate standard deviation.
Figure 9.
SSIM evaluation across different numbers of cores using a 1.0-m multi-core, multi-mode fiber. We obtained all results without rotation calibration. The figure compares M3-RGB with the single-branch transformer baseline (Baseline Trans) and raw-input baseline (Baseline raw). Curves represent the mean over the testing set, and the shaded regions indicate standard deviation.
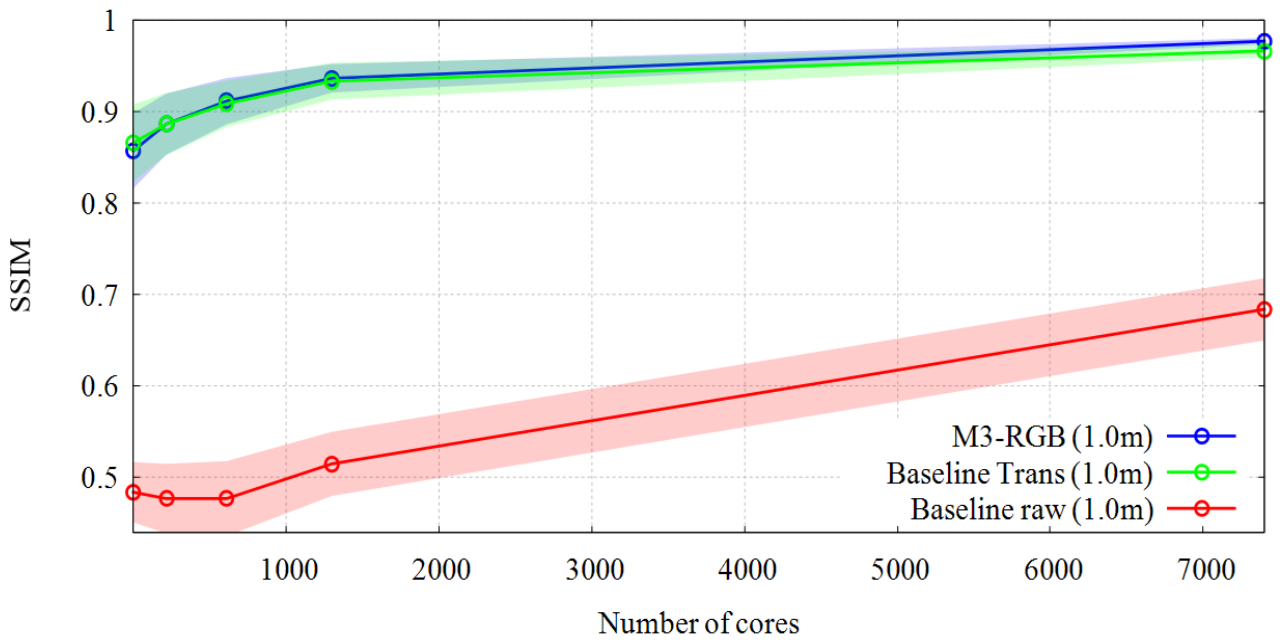
Figure 10.
PSNR evaluation across different fiber lengths (1.0, 5.0, and 10.0 m) of the multi-core, multi-mode fiber. Curves represent the mean over the testing set, and the shaded regions indicate standard deviation.
Figure 10.
PSNR evaluation across different fiber lengths (1.0, 5.0, and 10.0 m) of the multi-core, multi-mode fiber. Curves represent the mean over the testing set, and the shaded regions indicate standard deviation.
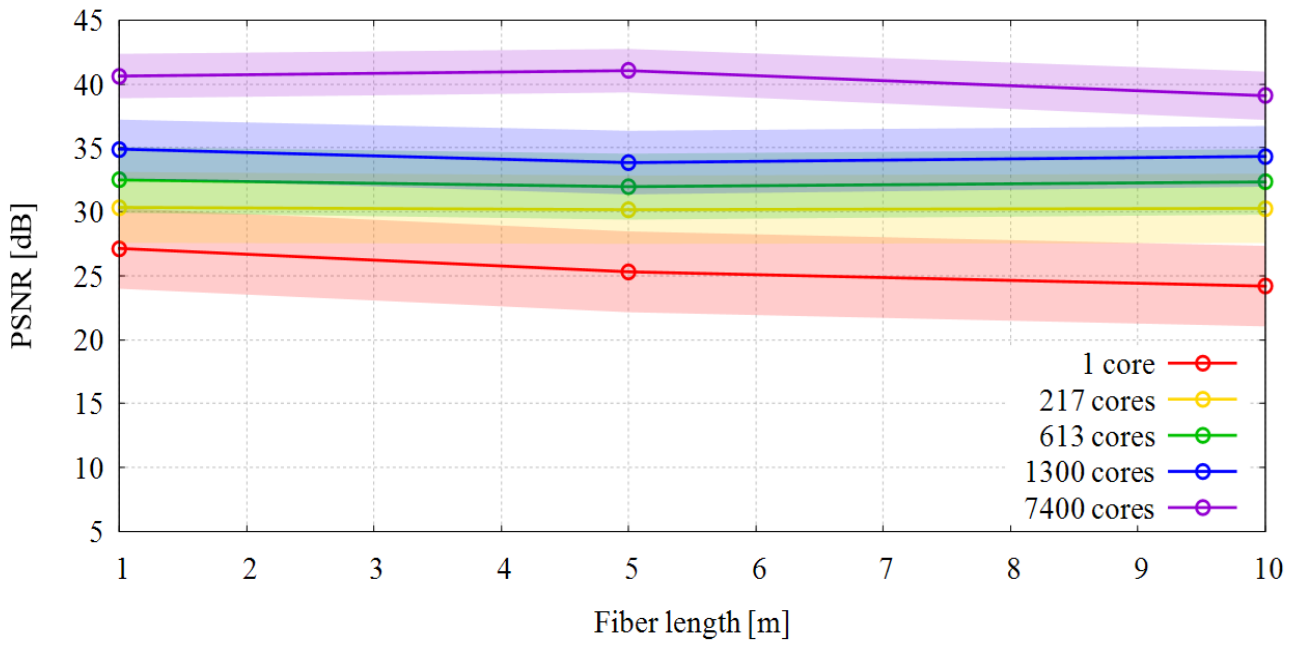
Figure 11.
SSIM evaluation across different fiber lengths (1.0, 5.0, and 10.0 m) of the multi-core, multi-mode fiber. Curves represent the mean over the testing set, and the shaded regions indicate standard deviation.
Figure 11.
SSIM evaluation across different fiber lengths (1.0, 5.0, and 10.0 m) of the multi-core, multi-mode fiber. Curves represent the mean over the testing set, and the shaded regions indicate standard deviation.

Figure 12.
Examples of input, reconstructed, and ground-truth images for different core counts. The upper block represents a daytime scene, while the lower block represents a nighttime scene. In each block, the top row shows the scrambled input for each core count, and in the bottom row, the leftmost image is the ground truth, while the remaining columns show the corresponding reconstructions for each core count.
Figure 12.
Examples of input, reconstructed, and ground-truth images for different core counts. The upper block represents a daytime scene, while the lower block represents a nighttime scene. In each block, the top row shows the scrambled input for each core count, and in the bottom row, the leftmost image is the ground truth, while the remaining columns show the corresponding reconstructions for each core count.

Figure 13.
Illustrative applications envisioned for M3-RGB, including peripheral sensing for autonomous forklifts, substitution for conventional cameras in urban surveillance systems, and inspection tasks within narrow environments, such as pipelines. These scenarios represent envisioned directions, and we did not evaluate them experimentally in this study.
Figure 13.
Illustrative applications envisioned for M3-RGB, including peripheral sensing for autonomous forklifts, substitution for conventional cameras in urban surveillance systems, and inspection tasks within narrow environments, such as pipelines. These scenarios represent envisioned directions, and we did not evaluate them experimentally in this study.


Table 1.
Positioning of M3-RGB relative to representative fiber-based imaging studies. “Incoherent scene light” indicates operation on incoherent light from a displayed or real scene (demonstrated here with LCD-displayed scenes), without a laser source, spatial light modulation, or a dedicated illumination unit at the fiber sensing interface.
Table 1.
Positioning of M3-RGB relative to representative fiber-based imaging studies. “Incoherent scene light” indicates operation on incoherent light from a displayed or real scene (demonstrated here with LCD-displayed scenes), without a laser source, spatial light modulation, or a dedicated illumination unit at the fiber sensing interface.
| Method | Light Source | Fiber Type | Target Content |
|---|---|---|---|
| Caramazza et al. [6] | Laser + SLM | Single-core, multi-mode | Natural scenes (ImageNet) |
| Liu et al. [7] | Pulsed laser | Single-core, multi-mode | Handwritten digits, letters |
| Zheng et al. [8] | Active multi-wavelength probing | Multi-mode | Transmission-matrix recovery |
| Hu et al. [9] | Dedicated illumination | Disordered fiber | Cellular specimens |
| Shao et al. [10] | Dedicated illumination | Fiber bundle | Microscopy targets |
| Fukushima et al. [11] | Incoherent scene light | Single-core plastic | Handwritten characters, digits |
| M3-RGB (ours) | Incoherent scene light | Multi-core, multi-mode plastic | Road-scene natural images |
Table 2.
Training hyperparameters of M3-RGB. We used identical settings for all fiber configurations. Only the fiber parameters (core count, fiber length, and calibration state) differed across experiments.
Table 2.
Training hyperparameters of M3-RGB. We used identical settings for all fiber configurations. Only the fiber parameters (core count, fiber length, and calibration state) differed across experiments.
| Parameter | Value |
|---|---|
| Optimizer | Adam |
| Learning rate | |
| Batch size | 20 |
| Epochs | 200 |
| Loss | channel-weighted reconstruction loss |
| Channel weights (R, G, B) |
Table 3.
Representative image reconstruction performance of M3-RGB with the 1.0-m fiber across different core counts and calibration settings. Mean ± standard deviation over the testing dataset. PSNR denotes the improvement obtained by calibration relative to the corresponding uncalibrated configuration. Calibrated angle denotes the manually estimated global rotation angle applied to the scrambled images (positive angles are counterclockwise; Section 4.1). Figure 8 and Figure 9 illustrate the corresponding core count trends without calibration, while this table summarizes representative quantitative results with and without calibration where applicable. We do not apply calibration to the single-core case, and we omit the calibrated row for the 7400-core fiber because its captured pattern already approximately matched the ground-truth orientation at the time of data acquisition (Section 4.1).
Table 3.
Representative image reconstruction performance of M3-RGB with the 1.0-m fiber across different core counts and calibration settings. Mean ± standard deviation over the testing dataset. PSNR denotes the improvement obtained by calibration relative to the corresponding uncalibrated configuration. Calibrated angle denotes the manually estimated global rotation angle applied to the scrambled images (positive angles are counterclockwise; Section 4.1). Figure 8 and Figure 9 illustrate the corresponding core count trends without calibration, while this table summarizes representative quantitative results with and without calibration where applicable. We do not apply calibration to the single-core case, and we omit the calibrated row for the 7400-core fiber because its captured pattern already approximately matched the ground-truth orientation at the time of data acquisition (Section 4.1).
| Cores | Calibration | Calibrated angle [deg] | PSNR ↑ [dB] | PSNR [dB] |
|---|---|---|---|---|
| 1 | – | – | 27.15 ± 3.15 | – |
| 217 | – | – | 30.36 ± 2.77 | – |
| 217 | 30.50 ± 2.76 | +0.14 | ||
| 613 | – | – | 32.51 ± 2.37 | – |
| 613 | 32.83 ± 2.59 | +0.32 | ||
| 1300 | – | – | 34.92 ± 2.30 | – |
| 1300 | 35.22 ± 2.36 | +0.30 | ||
| 7400 | – | – | 40.63 ± 1.74 | – |
Disclaimer/Publisher’s Note: The statements, opinions and data contained in all publications are solely those of the individual author(s) and contributor(s) and not of MDPI and/or the editor(s). MDPI and/or the editor(s) disclaim responsibility for any injury to people or property resulting from any ideas, methods, instructions or products referred to in the content. |
© 2026 by the authors. Licensee MDPI, Basel, Switzerland. This article is an open access article distributed under the terms and conditions of the Creative Commons Attribution (CC BY) license.
Copyright: This open access article is published under a Creative Commons CC BY 4.0 license, which permit the free download, distribution, and reuse, provided that the author and preprint are cited in any reuse.


