

Submitted:
16 July 2026
Posted:
20 July 2026
You are already at the latest version
Abstract
Background/Objectives: Assessment of Internet Gaming Disorder (IGD) relies largely on retrospective self-report and clinical interviews, which may be affected by recall bias, social desirability bias, and limited sensitivity to within-person behavioral change. This study evaluated an AI-enabled, privacy-preserving digital phenotyping framework for personalized IGD risk stratification under controlled simulation assumptions. Methods: A reproducible synthetic dataset of 1,000 virtual user profiles was generated; 20% were assigned to an elevated-risk class, and 5% balanced stochastic label noise was introduced to approximate imperfect ground truth. Four aggregated telemetry features were modeled: average session duration, sessions per week, Late-Night Index, and application-switching rate. Random Forest, Logistic Regression, and Gradient Boosting classifiers were evaluated against playtime-only baselines using a stratified 80:20 train–test split. Results: In the primary Random Forest model, accuracy was 0.880, balanced accuracy was 0.850, sensitivity was 0.800, specificity was 0.900, area under the receiver operating characteristic curve (ROC-AUC) was 0.909, area under the precision–recall curve (PR-AUC) was 0.779, and the Brier score was 0.089. All-feature models substantially outperformed playtime-only baselines. Feature-importance analyses recovered the known signal hierarchy encoded in the synthetic data-generating process, with application-switching rate and Late-Night Index showing the largest Gini-based and permutation-importance values. Performance degraded progressively as label noise increased from 0% to 20%. Conclusions: The framework demonstrates the methodological feasibility of transforming aggregated, privacy-preserving behavioral telemetry into interpretable simulated risk signals for IGD. The findings are hypothesis-generating and do not establish clinical validity or diagnostic performance. Longitudinal validation in clinically characterized cohorts using validated psychometric instruments and person-level calibration is required before practical deployment.
Keywords:
internet gaming disorder
; gaming disorder
; privacy-preserving digital phenotyping
; behavioral telemetry
; artificial intelligence
; machine learning
; personalized medicine
; risk stratification
; synthetic data
; explainable AI
1. Introduction
Digital gaming has become a widespread form of entertainment, social interaction, and competition across age groups. For most individuals, gaming is recreational and may be associated with social, cognitive, or motivational benefits. However, a smaller subgroup of players develops persistent and impairing patterns of gaming behavior characterized by impaired control, increasing priority given to gaming over other activities, and continuation despite negative consequences. Reflecting this clinical relevance, Internet Gaming Disorder (IGD) was included in Section III of the Diagnostic and Statistical Manual of Mental Disorders, Fifth Edition (DSM-5) as a condition requiring further study, while Gaming Disorder was formally recognized in the International Classification of Diseases, Eleventh Revision (ICD-11) [1,2]. Epidemiological evidence suggests that gaming disorder affects only a minority of players, highlighting the need to distinguish clinically relevant dysregulation from high but non-problematic engagement [3]. Contextual factors may also influence gaming behavior. For example, a Greek case study conducted during the COVID-19 lockdown reported that 4.7% of participants met criteria consistent with internet gaming addiction and that the proportion of participants reporting more than four hours of gaming per day increased during lockdown, illustrating how social restriction and psychological stress may intensify gaming activity in vulnerable subgroups [4].
Despite growing clinical and research interest, the assessment of problematic gaming remains challenging. Current approaches rely largely on clinical interviews and retrospective self-report instruments, such as the Internet Gaming Disorder Scale–Short Form (IGDS9-SF) [5]. These tools remain important for structured assessment, but they are also limited by recall bias, social desirability bias, and limited sensitivity to dynamic changes in behavior over time. In digital media research more broadly, self-reported estimates of screen use often diverge from objectively logged behavior, raising concerns about the exclusive reliance on retrospective self-report measures [6]. This limitation is especially relevant for personalized mental health care, where risk may fluctuate across days, contexts, sleep patterns, stress levels, and individual routines.
Digital phenotyping offers a potential way to complement traditional assessment by quantifying behavior in situ through data generated during everyday interaction with digital devices [7]. In mental health research, passive sensing and behavioral telemetry have been proposed as tools for identifying person-specific patterns that may support earlier detection, longitudinal monitoring, and more individualized care pathways [8]. In the context of IGD, potentially informative signals may include not only total gaming duration, but also temporal regularity, late-night activity, session fragmentation, and interaction dynamics. Such features may help distinguish high recreational engagement from behavioral patterns that are more consistent with dysregulation, sleep disruption, attentional preoccupation, or difficulty disengaging.
However, the use of passive telemetry in mental health also raises substantial ethical, privacy, and governance concerns. Continuous monitoring can become intrusive if it involves raw keystrokes, screen capture, message content, browsing content, or other sensitive forms of personal data. For this reason, privacy-preserving approaches are essential if digital phenotyping is to become acceptable in personalized mental health care. A clinically plausible system should follow data-minimization principles, prioritize local or client-side processing where possible, and restrict analysis to aggregated behavioral indicators that are proportionate to the intended screening or monitoring purpose [9]. This is particularly important in behavioral-addiction research, where inappropriate measurement or interpretation may contribute to the over-pathologization of everyday digital activities [10].
Recent empirical work has begun to explore digital phenotypes for the early detection of IGD using passive sensor data, supporting the broader feasibility of behavioral digital markers in this field [11]. In parallel, recent work has begun to examine the potential role of large language models (LLMs) in IGD assessment and care. Kranas and Verykios argued that LLMs may support prevention, assessment, treatment support, and research in IGD, but emphasized that current evidence remains preliminary, that no IGD-specific LLM therapeutic trials have yet established efficacy, and that privacy, governance, bias, and safety remain central concerns. These observations reinforce the need for transparent, privacy-preserving, and clinically cautious AI frameworks in IGD research [12]. Nevertheless, there remains a need for transparent methodological frameworks that specifically address privacy-preserving feature extraction, interpretable machine learning, and personalized risk stratification. This need is especially relevant because real-world behavioral telemetry studies involving gaming behavior are difficult to conduct at scale due to ethical, regulatory, technical, and consent-related barriers.
Machine learning may be useful in this context because behavioral risk patterns are unlikely to be captured by any single variable, such as total hours played. Instead, risk may emerge from combinations of temporal, interactional, and contextual features. Theoretical models of addictive behaviors, including the Interaction of Person-Affect-Cognition-Execution (I-PACE) model, emphasize that dysregulated digital behavior involves interactions among affective, cognitive, executive-control, and contextual processes rather than simple exposure duration alone [13]. Interpretable AI models may therefore help identify candidate behavioral signatures while maintaining transparency about which features contribute to risk estimates. At the same time, AI-based systems in mental health must be framed cautiously: they should support screening, monitoring, and clinical decision-making rather than function as autonomous diagnostic tools.
The present study proposes a privacy-preserving, AI-enabled digital phenotyping framework for personalized risk stratification in IGD. As an early-stage methodological proof of concept, we use a reproducible synthetic dataset of virtual user profiles to evaluate whether aggregated interactional and temporal telemetry features can be transformed into interpretable risk signals under controlled simulation assumptions. The framework focuses on four candidate features: average session duration, weekly session frequency, late-night gaming activity, and application-switching frequency. Multiple machine-learning models are evaluated, including Random Forest, Logistic Regression, and Gradient Boosting classifiers, with playtime-only models used as baselines.
The aim of this study is not to establish clinical validity or deployable diagnostic performance. Rather, the objective is to demonstrate the methodological feasibility of a privacy-preserving analytic pipeline and to generate hypotheses about which types of behavioral telemetry may be most relevant for future real-world validation. Specifically, this study aims to: (i) describe a non-intrusive architecture for privacy-preserving behavioral telemetry extraction; (ii) evaluate, in simulation, whether aggregated interactional and temporal features can support elevated-risk versus lower-risk stratification; (iii) compare all-feature models with playtime-only baselines; (iv) examine whether complementary explainability analyses recover the known signal hierarchy encoded in the synthetic data-generating process; and (v) assess robustness under increasing levels of stochastic label noise. By positioning passive telemetry as a complementary layer rather than a replacement for clinical assessment, this work contributes to the development of privacy-aware, interpretable, and personalized approaches to digital mental health.
2. Materials and Methods
This section describes the simulation design, privacy-preserving telemetry architecture, candidate behavioral features, synthetic data-generation procedure, machine-learning models, evaluation metrics, explainability analyses, and robustness checks. Because the study used only synthetic virtual user profiles, the methodological framework was designed to support reproducibility, interpretability, and cautious simulation-based inference rather than clinical validation.
2.1. Study Design
This study was designed as a simulation-based methodological proof of concept for privacy-preserving, AI-enabled digital phenotyping in Internet Gaming Disorder (IGD). The aim was not to validate a diagnostic model or estimate real-world clinical performance, but to evaluate whether aggregated temporal and interactional telemetry features could be transformed into interpretable risk-stratification signals under controlled simulation assumptions.
A reproducible synthetic dataset of 1,000 virtual user profiles was generated using a fixed random seed of 42. The simulation was used to test the feasibility of the proposed analytic pipeline while avoiding the ethical and privacy challenges associated with continuous system-level monitoring of real users. The overall workflow consisted of: (i) privacy-preserving feature specification; (ii) synthetic user-profile generation; (iii) stochastic label-noise injection; (iv) supervised machine-learning classification; (v) comparative evaluation against baseline models; (vi) feature-importance analysis; and (vii) sensitivity analysis across increasing levels of label noise. The overall methodological workflow of the proposed privacy-preserving digital phenotyping pipeline is summarized in Figure 1.
Because no real human participants, patient records, or identifiable behavioral logs were used, the present study should be interpreted as a computational simulation rather than a clinical validation study.
2.2. Privacy-Preserving Digital Phenotyping Architecture
The proposed system architecture is conceptualized as a lightweight client-side telemetry layer that extracts only aggregated temporal and interactional metadata from gaming-related activity. The architecture follows a Privacy-by-Design approach by excluding raw keystroke content, screenshots, screen recordings, message content, browsing content, voice data, and other content-level information. This design is aligned with the Privacy-by-Design principle that privacy safeguards should be embedded into the technical architecture of a system from the outset rather than added retrospectively [14].
Accordingly, the framework restricts data capture to low-dimensional behavioral summaries that are relevant to risk stratification while minimizing the collection of sensitive personal information. All primary feature extraction is designed to occur locally at the client level before any risk score is generated. In a real-world implementation, such a design would allow the system to transmit only derived behavioral indicators or risk summaries rather than raw behavioral streams.
This privacy-preserving structure is important because behavioral telemetry in mental health may reveal sensitive information even when content-level data are not collected. Therefore, the proposed architecture emphasizes data minimization, proportionality, local processing, transparency, and clear separation between behavioral monitoring and clinical diagnosis.
2.3. Candidate Behavioral Telemetry Features
Four candidate features were specified to represent temporal and interactional aspects of gaming behavior. These features were selected because they are interpretable, technically feasible to derive from aggregated metadata, and theoretically relevant to behavioral dysregulation. Table 1 summarizes the four candidate telemetry features, their notation, operational definition, and theoretical relevance.
Each virtual user was represented by the feature vector:
where to corresponded to the following telemetry indicators:
where is the average duration of uninterrupted gaming sessions, expressed in hours.
where is the number of gaming sessions initiated within a seven-day period.
where is the Late-Night Index, defined as the proportion of total gaming time occurring between 00:00 and 06:00.
where is the application-switching rate, defined as the number of application-switching events per active gaming hour.
The rationale for including and was to capture general engagement intensity. However, these variables were not assumed to be sufficient indicators of disorder, because high gaming duration or frequency may also reflect recreational, social, or competitive engagement. The feature was included to capture potential circadian disruption and persistence of gaming during sleep-relevant hours. The feature was included as an exploratory interactional marker that may reflect fragmented attention, repeated task switching, or difficulty disengaging from gaming-related activity.
2.4. Synthetic Data Generation
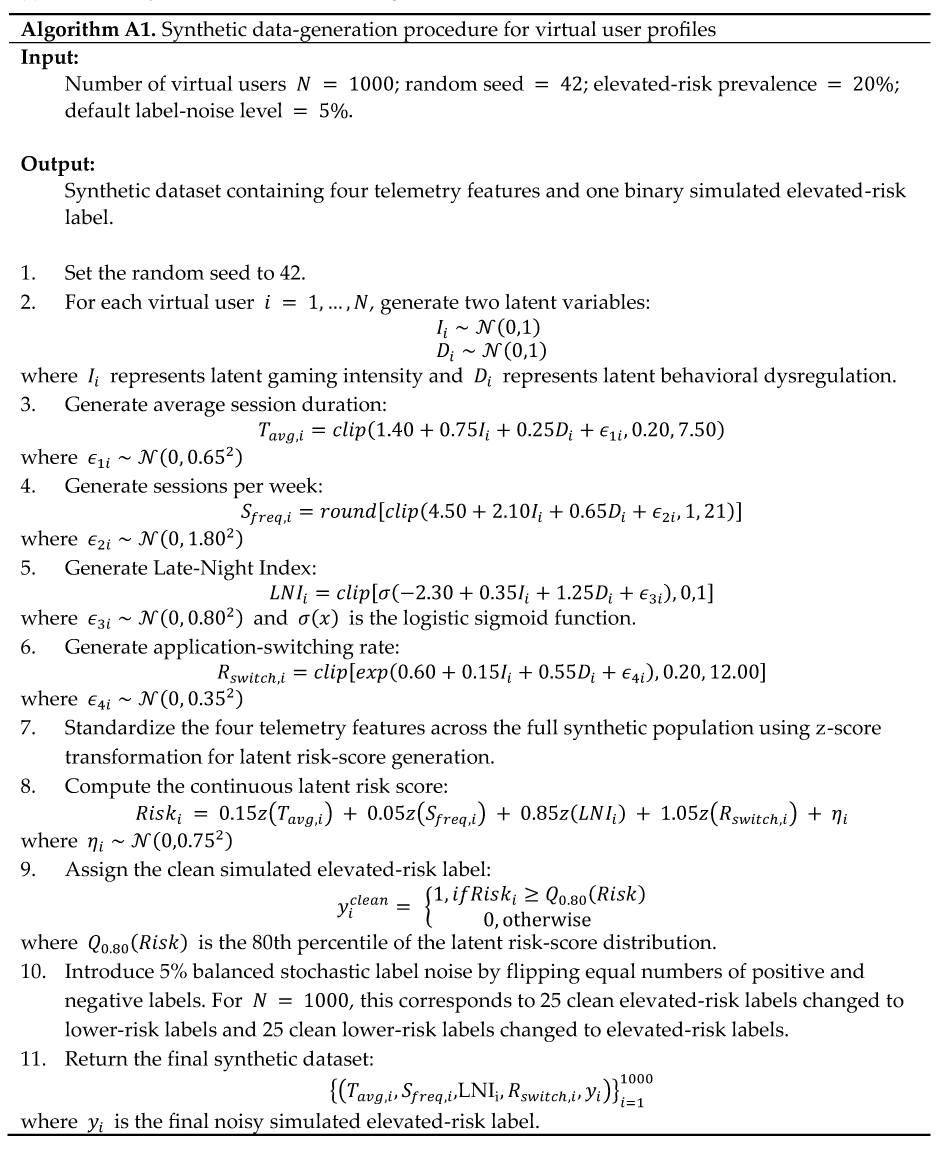
A reproducible synthetic dataset of 1,000 virtual user profiles was generated to represent plausible variation in gaming-related behavioral patterns. The purpose of the simulation was not to reproduce the full complexity of real gaming behavior, but to create a transparent and controlled test environment for evaluating the proposed privacy-preserving analytic pipeline.
Two unobserved latent variables were generated for each virtual user: latent gaming intensity and latent behavioral dysregulation. These latent variables were sampled from standard normal distributions and were used only to generate correlated behavioral patterns. They were not included as predictors in the machine-learning models.
where denotes latent gaming intensity and denotes latent behavioral dysregulation for virtual user .
Four observable telemetry features were then generated from these latent variables. Average session duration and sessions per week were designed to reflect general engagement intensity, whereas Late-Night Index and application-switching rate were designed to represent temporal and interactional dysregulation. Values were bounded to avoid implausible observations, such as negative session durations or proportions outside the interval .
Average session duration was generated as:
where .
Sessions per week were generated as:
where .
The Late-Night Index was generated as:
where and is the logistic sigmoid function.
Application-switching rate was generated as:
where .
The four observed features were standardized and used to calculate a continuous latent risk score:
where . Larger weights were assigned to and than to or , reflecting the study’s hypothesis that temporal and interactional features may be more informative than playtime alone. The transformation was computed across all 1,000 synthetic profiles during the data-generation stage to define the simulated latent risk score; it was not a model-preprocessing step fitted during evaluation. The additive noise term was included as an irreducible simulation-noise floor, meaning that the clean-label condition was not expected to be perfectly separable even when stochastic label flipping was set to . The full synthetic data-generation parameterization is provided in Supplementary Table S1, and the stepwise procedure is described in Algorithm A1.
The top 20% of virtual users according to the latent risk score were assigned to the clean elevated-risk class. To approximate imperfect ground truth, 5% balanced stochastic label noise was then introduced by flipping equal numbers of positive and negative labels. Specifically, 25 clean elevated-risk labels were changed to lower-risk labels and 25 clean lower-risk labels were changed to elevated-risk labels. This preserved the elevated-risk prevalence at 20%.
The final binary outcome was coded as 0 for lower-risk and 1 for elevated-risk. This outcome represents simulated elevated-risk status and should not be interpreted as clinically diagnosed IGD.
2.5. Machine-Learning Models
A supervised binary-classification approach was used to estimate simulated elevated-risk status from the candidate telemetry features. The Random Forest classifier was selected as the primary illustrative model because tree-based ensemble methods can model non-linear feature relationships and interactions while also providing intuitive feature-importance estimates [15].
The Random Forest classifier was implemented in Python using the scikit-learn machine-learning library [16]. The model was specified with 100 decision trees, a maximum depth of 5, a fixed random seed of 42, and class weighting set to balanced. The constrained maximum depth was used to reduce the likelihood of overfitting to simulation noise and to preserve interpretability.
To evaluate whether the full telemetry feature set provided additional information beyond playtime duration alone, two additional all-feature classifiers were also trained: Logistic Regression and Gradient Boosting [17]. Logistic Regression was implemented using a scikit-learn Pipeline in which the StandardScaler was fitted only on the training data and subsequently applied to the hold-out test data. The Logistic Regression classifier used maximum iterations set to 1,000, class weighting set to balanced, and a fixed random seed of 42. Gradient Boosting was implemented with 100 estimators, maximum tree depth of 3, and a fixed random seed of 42. The evaluated model families, feature sets, and comparison purposes are summarized in Supplementary Table S2.
Two playtime-only baseline models were also evaluated. These models used only average session duration as the predictor and were implemented using Random Forest and Logistic Regression. The purpose of these baseline models was to assess whether interactional and temporal features improved performance beyond playtime duration alone.
The dataset was divided into training and testing sets using an 80:20 stratified hold-out split. Stratification preserved the lower-risk and elevated-risk class distribution across the training and test sets. The final test set included 200 virtual profiles, with 160 lower-risk profiles and 40 elevated-risk profiles.
2.6. Model Evaluation
Model performance was evaluated on the unseen 20% hold-out test set. Because the purpose of the model was risk stratification rather than diagnosis, performance was assessed using multiple complementary metrics rather than overall accuracy alone.
The following metrics were calculated: overall accuracy, balanced accuracy, sensitivity/recall for the elevated-risk class, specificity for the lower-risk class, precision/positive predictive value, negative predictive value, F1-score, area under the receiver operating characteristic curve, area under the precision-recall curve, Brier score, and confusion matrix. Discrimination was assessed using ROC-AUC and PR-AUC, which summarize model performance across classification thresholds [18,19]. The Brier score was included as a measure of probabilistic prediction error, complementing discrimination metrics by evaluating the accuracy of predicted probabilities [20].
Accuracy was retained for comparability with standard classification reporting, but greater emphasis was placed on sensitivity, specificity, precision, discrimination, and calibration because these metrics are more informative for potential screening-support applications. In a future clinical setting, false positives could contribute to over-pathologization of high recreational engagement, whereas false negatives could fail to identify users who may require further assessment. Therefore, the evaluation was interpreted as a simulation-based assessment of methodological feasibility rather than evidence of clinical performance.
2.7. Feature-Importance and Explainability Analysis
Model interpretability was examined using two complementary feature-importance methods applied to the primary Random Forest model. Because the simulated outcome was generated from a known weighted latent risk function, feature-importance analysis was interpreted as a positive-control analysis rather than as empirical marker discovery. The aim was to evaluate whether the model-inspection procedures recovered the known signal hierarchy encoded in the synthetic data-generating process.
First, impurity-based Random Forest feature importance was used to estimate the contribution of each telemetry feature to the model’s classification decisions. Second, permutation feature importance was evaluated on the hold-out test set using ROC-AUC as the scoring metric. Permutation importance was calculated using 50 repeated permutations for each feature. This complementary analysis was included because impurity-based feature importance can be sensitive to feature scale, distribution, and correlation structure, whereas permutation importance evaluates the decrease in predictive performance after feature perturbation on held-out data [15,21].
Feature-importance results were interpreted as simulation-derived indicators of internal consistency within the synthetic framework. They were not interpreted as validated clinical biomarkers or empirically discovered IGD predictors. The purpose of the feature-importance analysis was therefore to assess whether the pipeline behaved consistently with the known synthetic data-generating structure, not to establish clinically valid digital markers.
2.8. Sensitivity and Robustness Analyses
To evaluate whether the simulated findings were robust to assumptions about imperfect ground truth, a known challenge in supervised classification with noisy labels, sensitivity analyses were conducted using different levels of stochastic label noise [22]. Specifically, the Random Forest model was re-estimated under label-noise conditions of 0%, 5%, 10%, 15%, and 20%.
For each label-noise condition, the same synthetic data-generation procedure was applied using the fixed random seed of 42. Balanced label flipping was used so that the elevated-risk prevalence remained 20% across all conditions. Model performance was then compared across label-noise levels using the same evaluation metrics described above. Feature-ranking stability was also examined by identifying the top feature according to impurity-based Random Forest importance and permutation importance within each label-noise condition.
This robustness analysis was important because the current study relies on simulated labels rather than clinically confirmed IGD diagnoses. Stable feature rankings across increasing label-noise conditions would support the methodological robustness of the proposed pipeline under imperfect measurement conditions. Conversely, unstable rankings would indicate that the findings are highly dependent on the assumptions used during synthetic data generation.
2.9. Reporting and Reproducibility
The study was reported as a simulation-based proof of concept and not as a clinical prediction-model validation study. Nevertheless, relevant principles from prediction-model reporting guidance, including transparent description of predictors, outcome definition, model specification, evaluation procedures, and reproducibility, were followed where applicable [23].
All synthetic data-generation parameters, model specifications, train–test split settings, label-noise conditions, and evaluation metrics are reported in this manuscript to support reproducibility. The complete Python analysis code, the synthetic dataset generated with the fixed random seed of 42, and the output tables are openly available in Zenodo at https://doi.org/10.5281/zenodo.21116632. Because all records are synthetically generated, the repository contains no real participant data, patient records, identifiable behavioral logs, or sensitive personal information. Detailed pseudocode for the synthetic data-generation procedure and the model-evaluation pipeline is provided in Appendix A.
3. Results
This section reports the synthetic cohort composition, primary Random Forest performance, comparative model results, feature-importance analyses, and label-noise sensitivity analyses. All findings refer to simulated elevated-risk status and should therefore be interpreted as proof-of-concept evidence of methodological feasibility rather than as estimates of real-world clinical performance.
3.1. Synthetic Cohort and Evaluation Sample
The reproducible simulation generated 1,000 virtual user profiles. After balanced stochastic label-noise injection, 800 profiles were assigned to the lower-risk class and 200 profiles were assigned to the elevated-risk class, corresponding to an elevated-risk prevalence of 20%. The dataset was divided into training and test sets using an 80:20 stratified split. The hold-out test set included 200 virtual profiles, consisting of 160 lower-risk profiles and 40 elevated-risk profiles.
All model results reported below refer to performance on the unseen hold-out test set. Because the dataset was synthetically generated, the results should be interpreted as simulation-based evidence of methodological feasibility rather than as clinical validation or deployable diagnostic performance.
3.2. Primary Random Forest Classification Performance
The primary Random Forest classifier was trained using all four candidate telemetry features: average session duration, sessions per week, Late-Night Index, and application-switching rate. On the hold-out test set, the model achieved an overall accuracy of 0.880 and a balanced accuracy of 0.850. Sensitivity for the elevated-risk class was 0.800, indicating that the model correctly identified 80.0% of simulated elevated-risk profiles. Specificity was 0.900, indicating that 90.0% of lower-risk profiles were correctly classified.
Precision for the elevated-risk class was 0.667, while the negative predictive value was 0.947. The F1-score for the elevated-risk class was 0.727. Discrimination performance was strong, with an ROC-AUC of 0.909 and a PR-AUC of 0.779. The Brier score was 0.089, indicating acceptable probabilistic performance under the assumptions of the simulation.
The confusion matrix showed 144 true negatives, 16 false positives, 8 false negatives, and 32 true positives. Thus, the model showed stronger performance in ruling out lower-risk profiles than in confirming elevated-risk profiles, as reflected by the higher negative predictive value compared with the positive predictive value. This pattern is consistent with the intended role of the proposed framework as a screening-support and risk-stratification approach rather than as a stand-alone diagnostic system. Detailed metrics for the primary Random Forest model, including confusion-matrix counts, are provided in Supplementary Table S3.
3.3. Comparative Model Performance and Playtime-Only Baselines
To examine whether the full telemetry feature set provided additional information beyond gaming duration alone, the primary Random Forest model was compared with alternative classifiers and playtime-only baseline models. The all-feature models consistently outperformed the playtime-only models across most discrimination and classification metrics.
Among the all-feature models, Gradient Boosting achieved the highest overall accuracy (0.900), specificity (0.962), precision (0.812), and lowest Brier score (0.073), but it showed lower sensitivity for the elevated-risk class (0.650). Logistic Regression achieved the highest sensitivity (0.850), ROC-AUC (0.920), and PR-AUC (0.832), indicating strong discrimination despite its simpler linear structure. The Random Forest model showed a balanced performance profile, with accuracy of 0.880, sensitivity of 0.800, specificity of 0.900, ROC-AUC of 0.909, and PR-AUC of 0.779.
In contrast, the playtime-only models showed substantially weaker performance. The Random Forest model using only average session duration achieved an ROC-AUC of 0.686 and a PR-AUC of 0.497, while the Logistic Regression playtime-only model achieved an ROC-AUC of 0.724 and a PR-AUC of 0.547. These results suggest that, under the assumptions of the simulation, average session duration alone was insufficient for reliable elevated-risk stratification.
The comparison supports the central methodological assumption of the framework: interactional and temporal behavioral features provide more informative simulated risk signals than playtime duration alone. In particular, the improvement in ROC-AUC and PR-AUC from the playtime-only models to the all-feature models indicates that the additional pre-specified temporal and interactional variables collectively contributed information beyond average session duration under the assumptions of the simulation. Table 2 summarizes the comparative performance of the all-feature models and playtime-only baseline models on the hold-out test set.
3.4. Feature-Importance and Explainability Analysis
Feature-importance analysis was conducted as a positive-control analysis to examine whether the model-inspection procedures recovered the known hierarchy of signal strength encoded in the synthetic data-generating process. In the latent risk score, application-switching rate and Late-Night Index were assigned the largest weights, followed by average session duration and sessions per week. Therefore, the feature-importance analysis was not intended to discover empirical IGD markers, but to evaluate whether the proposed pipeline behaved consistently with the known simulation structure.
Impurity-based Random Forest importance recovered the expected ordering of simulated signal strength. Application-switching rate, which had the largest pre-specified weight in the latent risk-score function, showed the highest Gini-based importance value, accounting for 44.36% of total feature importance. The Late-Night Index, which had the second-largest pre-specified weight, ranked second and accounted for 40.52%. Average session duration contributed 12.21%, while sessions per week contributed 2.91%. Together, application-switching rate and Late-Night Index accounted for approximately 85% of total impurity-based importance, consistent with the pre-specified latent risk-score structure.
Permutation importance produced a similar feature hierarchy. Application-switching rate had the largest mean decrease in ROC-AUC when permuted, with a mean importance of 0.0877. The Late-Night Index ranked second, with a mean importance of 0.0806. Average session duration showed a smaller contribution, with a mean importance of 0.0273, while sessions per week had near-zero permutation importance, with a mean value of −0.0008. The near-zero or slightly negative permutation value for sessions per week suggests that this feature did not add meaningful independent discriminatory information in the hold-out test set under the simulation assumptions.
These results should be interpreted as evidence of internal consistency within the simulation framework. They do not demonstrate that application-switching rate or late-night gaming are validated clinical biomarkers or empirically established predictors of IGD. Rather, they show that, under the controlled assumptions of the simulation, the model and interpretability procedures recover the expected pre-specified signal hierarchy. Real-world longitudinal studies are required to test whether analogous temporal or interactional telemetry features have clinical relevance.
Table 3 reports the impurity-based and permutation-based feature-importance estimates for the primary Random Forest model.
3.5. Sensitivity Analysis Across Label-Noise Conditions
A sensitivity analysis was conducted to evaluate whether model performance remained stable under increasing levels of stochastic label noise. The Random Forest model was re-estimated under five label-noise conditions: 0%, 5%, 10%, 15%, and 20%. Elevated-risk prevalence was held constant at 20% across all conditions through balanced label flipping.
As expected, model performance declined progressively as label noise increased. In the no-noise condition, the model achieved strong performance, with accuracy of 0.925, balanced accuracy of 0.944, sensitivity of 0.975, specificity of 0.913, ROC-AUC of 0.990, and PR-AUC of 0.966. Under the primary 5% label-noise condition, performance remained strong, with accuracy of 0.880, balanced accuracy of 0.850, sensitivity of 0.800, specificity of 0.900, ROC-AUC of 0.909, and PR-AUC of 0.779.
At higher levels of label noise, performance decreased more substantially. With 10% label noise, ROC-AUC declined to 0.816 and PR-AUC to 0.570. With 15% label noise, ROC-AUC further decreased to 0.750 and PR-AUC to 0.481. At 20% label noise, performance was weakest, with balanced accuracy of 0.650, sensitivity of 0.425, ROC-AUC of 0.670, and PR-AUC of 0.392. The Brier score also worsened progressively, increasing from 0.051 in the no-noise condition to 0.184 in the 20% label-noise condition.
Across all label-noise conditions, application-switching rate remained the top feature according to impurity-based Random Forest importance. The top permutation-importance feature was also application-switching rate in most conditions, although the Late-Night Index ranked highest under the 10% label-noise condition. Overall, the sensitivity analysis suggests that the proposed simulation pipeline behaves plausibly under increasing label uncertainty: discrimination and calibration deteriorate as ground-truth noise increases, while the relative importance of interactional and temporal features remains broadly stable. Table 4 summarizes Random Forest performance and feature-ranking stability across increasing label-noise conditions.
4. Discussion
This section interprets the simulation findings in relation to privacy-preserving digital phenotyping, personalized risk stratification, and responsible AI in mental health. The discussion emphasizes the methodological implications of the results while distinguishing simulation-derived performance from clinical validity, diagnostic accuracy, or practical deployability.
4.1. Principal Findings
This study presented a privacy-preserving, AI-enabled digital phenotyping framework for personalized risk stratification in Internet Gaming Disorder (IGD). Using a reproducible synthetic simulation, we evaluated whether aggregated temporal and interactional telemetry features could support simulated elevated-risk classification while avoiding content-level data capture. The main finding was that models using the full feature set substantially outperformed playtime-only baselines. In the primary 5% label-noise condition, the Random Forest classifier achieved an accuracy of 0.880, balanced accuracy of 0.850, sensitivity of 0.800, specificity of 0.900, ROC-AUC of 0.909, and PR-AUC of 0.779 on the hold-out test set.
These findings should be interpreted as methodological and hypothesis-generating rather than clinical. Because the dataset was synthetically generated, the results do not establish diagnostic validity, clinical utility, or real-world deployability. Instead, they demonstrate that, under transparent simulation assumptions, privacy-preserving behavioral features can be transformed into interpretable risk signals. This supports the feasibility of the proposed analytic pipeline and provides a rationale for future empirical validation in real-world longitudinal cohorts.
4.2. Interactional and Temporal Features Beyond Playtime
A central implication of the simulation is that gaming duration alone was insufficient for reliable elevated-risk stratification. The playtime-only Random Forest model achieved substantially weaker discrimination than all-feature models, with ROC-AUC of 0.686 and PR-AUC of 0.497. Similarly, the playtime-only Logistic Regression model achieved ROC-AUC of 0.724 and PR-AUC of 0.547. In contrast, all-feature models achieved ROC-AUC values above 0.90 and PR-AUC values between 0.779 and 0.832.
This pattern supports the view that risk-relevant gaming behavior may be better represented by the structure, timing, and interactional context of play rather than by total duration alone. This is consistent with clinical concerns about over-pathologizing high engagement. Many individuals may spend substantial time gaming for recreational, social, competitive, or occupational reasons without experiencing clinically meaningful impairment. Therefore, risk-stratification systems should not rely exclusively on exposure duration. Features such as nocturnal gaming, irregular interaction patterns, and difficulty disengaging may provide more specific candidate signals of behavioral dysregulation, although this remains to be tested empirically.
From a personalized-medicine perspective, this distinction is important. A uniform threshold based on gaming duration cannot adequately capture individual differences in routines, sleep schedules, obligations, coping patterns, or functional consequences. A privacy-preserving digital phenotyping approach could instead support individualized monitoring by identifying deviations in a person’s own behavioral patterns over time. Such a system would be most useful not as a diagnostic substitute, but as a complementary layer that helps decide when further assessment may be warranted.
4.3. Interpretability and Candidate Digital Markers
Under the pre-specified assumptions of the synthetic data-generating process, the feature-importance analyses recovered the expected ordering of simulated signal strength. Application-switching rate and Late-Night Index, which were assigned the largest weights in the latent risk score, also showed the largest impurity-based and permutation-importance values. Average session duration contributed more modestly, and sessions per week showed minimal independent contribution.
This result should be interpreted as a positive-control finding rather than as empirical marker discovery. In other words, the feature-importance analysis demonstrates that the proposed pipeline can recover the known structure embedded in the synthetic generator. It does not show that application-switching behavior or late-night gaming are established clinical predictors of IGD in real-world populations.
Nevertheless, the pre-specified feature classes remain theoretically plausible targets for future empirical evaluation. Application-switching behavior may be conceptualized as a possible indicator of fragmented attention, repeated task shifting, or difficulty disengaging from gaming-related activity. Late-night gaming may be conceptualized as a possible indicator of circadian disruption, persistence of gaming during sleep-relevant hours, or displacement of restorative routines. These interpretations are conceptually compatible with models of problematic digital behavior that emphasize impaired control, preoccupation, affective regulation, and executive-function processes rather than exposure time alone [13].
Therefore, the feature hierarchy should be understood as a structured simulation assumption that is successfully recovered by the pipeline, not as evidence of validated biomarkers. Real-world studies are needed to determine whether application switching, nocturnal activity, or other interactional features predict validated IGD symptoms, functional impairment, sleep disruption, or treatment-relevant outcomes.
4.4. Robustness Under Label Noise
The sensitivity analysis across label-noise conditions provides an important methodological contribution. Performance declined progressively as stochastic label noise increased from 0% to 20%. In the no-noise condition, ROC-AUC was 0.990 and PR-AUC was 0.966. Under the primary 5% noise condition, ROC-AUC remained strong at 0.909 and PR-AUC at 0.779. At 20% label noise, however, ROC-AUC declined to 0.670 and PR-AUC to 0.392.
This pattern is plausible and desirable from a simulation-validity perspective. A model that remained nearly perfect under high label noise would raise concerns about circularity or unrealistic separability. Instead, the observed degradation suggests that the pipeline is sensitive to increasing uncertainty in the outcome label. This is relevant to behavioral-health research because clinical and self-report-derived labels may be affected by recall bias, social desirability, incomplete clinical information, and threshold ambiguity, thereby creating noisy outcome labels in supervised classification [6,22].
At the same time, the robustness analysis reinforces the need for caution. The model’s performance depends strongly on the quality of the target label. In real-world deployment, a telemetry-based system would require validated outcome definitions, careful calibration, and repeated external validation across populations. Inaccurate labels could lead to biased or unstable models, particularly when distinguishing high recreational engagement from clinically impairing gaming behavior.
4.5. Comparison Across Algorithms
The model-comparison analysis showed that the all-feature set performed well across different algorithms under the assumptions of the synthetic simulation. Logistic Regression achieved the highest ROC-AUC and PR-AUC, while Gradient Boosting achieved the highest accuracy, specificity, precision, and lowest Brier score. The Random Forest model was retained as the primary illustrative model because it provided a balanced performance profile and intuitive feature-importance outputs.
These algorithmic differences should be interpreted cautiously. The strong performance of Logistic Regression should be understood in light of the additive structure of the simulated latent risk score. Therefore, the algorithm comparison should be viewed as a pipeline-comparison exercise under controlled assumptions, not as evidence that linear models will necessarily perform better in real-world IGD telemetry data.
The most robust conclusion is that, within this simulation, models using the full pre-specified feature set outperformed playtime-only baselines. This supports the methodological value of evaluating temporal and interactional feature representations beyond gaming duration alone. Future empirical studies should compare interpretable linear and non-linear models using real-world longitudinal data, clinically validated outcomes, calibration analyses, and external validation before drawing conclusions about the best modeling approach for practical deployment.
4.6. Ethical, Privacy, and Governance Considerations
The proposed architecture was intentionally designed around data minimization. It excludes raw keystrokes, screenshots, screen recordings, message content, browsing content, and other content-level data. Instead, it focuses on aggregated temporal and interactional metadata processed at the client level. This design is central to the translational plausibility of the framework because digital phenotyping in mental health can easily become intrusive if it relies on continuous raw monitoring.
Nevertheless, metadata are not ethically neutral. Even without content capture, behavioral timing, switching patterns, and nocturnal activity may reveal sensitive information about routines, sleep, work, stress, social life, or mental health. Any future implementation would therefore require transparent informed consent, strict data-governance procedures, secure storage, clear limits on secondary use, and user control over monitoring. It would also require careful definition of who can access risk outputs and how those outputs may be used. Future real-world implementation would also need to comply with applicable data-protection frameworks, including requirements for lawful processing, data minimization, transparency, and user rights under the General Data Protection Regulation [24].
This is particularly important in IGD and behavioral-addiction research, where over-pathologization remains a concern [10]. A privacy-preserving AI system should not label high engagement as disorder in isolation. Instead, it should support stepped assessment by identifying patterns that may warrant further psychometric screening, sleep assessment, or clinician review. The ethical value of such a system depends not only on technical privacy protections, but also on proportionality, transparency, interpretability, and appropriate clinical governance.
4.7. Implications for Personalized Mental Health Care
The proposed framework is relevant to personalized medicine because it shifts the focus from static, one-time assessment toward individualized behavioral monitoring. In principle, aggregated telemetry could help establish a person-specific baseline and detect meaningful deviations over time. Such deviations could then inform adaptive screening intensity, targeted psychoeducation, sleep-focused assessment, or clinician follow-up.
However, the framework should be understood as a decision-support layer rather than a diagnostic tool. The most appropriate use case would be a stepped-care pathway in which telemetry-based risk signals trigger further assessment rather than directly assign a diagnosis. For example, an elevated risk score could prompt completion of a validated IGD instrument, review of sleep patterns, assessment of functional impairment, or referral to a clinician when clinically appropriate.
This layered approach aligns better with personalized mental health care than a binary diagnostic classifier operating in isolation. It allows behavioral telemetry to contribute objective, ecologically valid information while preserving the central role of validated clinical assessment, patient context, and professional judgment.
4.8. Limitations
The main limitation of this study is the use of synthetic data. Although simulation is useful for early-stage development and reproducibility, synthetic profiles cannot capture the full complexity of real gaming behavior, psychiatric comorbidity, social context, game genre, motivation, occupational gaming, cultural variation, sleep schedules, or functional impairment. Therefore, the reported performance metrics should not be interpreted as evidence of clinical effectiveness.
A second limitation is that the synthetic outcome label was generated from assumptions related to the same features used for prediction. This creates a risk of circularity. The model may partly recover the structure imposed during data generation rather than discover naturally occurring behavioral markers of IGD. To reduce this concern, the study used stochastic label noise, model comparison, playtime-only baselines, and sensitivity analyses. However, only real-world validation can determine whether the candidate features generalize beyond the simulation.
A third limitation concerns the cross-sectional structure of the simulation. Personalized medicine requires longitudinal modeling of within-person change, not only between-person classification. Future studies should evaluate whether telemetry features can identify deviations from an individual’s own baseline and whether these deviations predict clinically meaningful outcomes.
A fourth limitation is that the current framework includes only four candidate features. Real-world risk stratification would likely require richer behavioral, contextual, and clinical information, including sleep, mood, stress, functional impairment, comorbid symptoms, and patient-reported outcomes. However, adding more features must be balanced against privacy and interpretability considerations.
Finally, the current study did not evaluate fairness, subgroup performance, or calibration across demographic groups. Future validation studies should examine whether model performance differs by age, gender, cultural background, gaming genre, device type, and baseline gaming intensity. This is essential before any use in real-world screening or care pathways.
4.9. Future Directions
Future research should proceed in several stages. First, the proposed simulation framework should be replicated using open code and alternative assumptions about prevalence, feature distributions, label noise, and behavioral heterogeneity. Second, real-world observational studies should collect privacy-preserving telemetry alongside validated IGD scales, sleep measures, functional-impairment indicators, and clinical interviews where feasible. Future studies may also examine whether privacy-preserving telemetry can be combined with complementary AI modalities, including LLM-assisted screening or psychoeducation, while maintaining human oversight, transparent governance, and rigorous clinical validation. Third, longitudinal models should be developed to examine within-person change rather than only cross-sectional classification. Fourth, calibration and decision-curve analyses should be used to determine whether risk scores provide clinically meaningful information at specific screening thresholds. Finally, implementation studies should evaluate acceptability, consent, governance, and user trust. Consistent with broader concerns about translating healthcare AI from technical development into clinical practice, future validation should evaluate not only discrimination performance but also calibration, workflow integration, safety, acceptability, governance, and clinical utility [25].
The long-term goal should not be an autonomous AI diagnostic system. Rather, the goal should be a privacy-aware, interpretable, and clinically governed digital phenotyping layer that supports personalized monitoring and timely assessment while minimizing surveillance risk.
5. Conclusions
This study presents a privacy-preserving, AI-enabled digital phenotyping framework for personalized risk stratification in Internet Gaming Disorder. Using a reproducible synthetic simulation, the proposed pipeline shows that aggregated temporal and interactional telemetry features can be transformed into interpretable simulated risk signals under controlled assumptions. Models using the full pre-specified feature set substantially outperform playtime-only baselines, supporting the methodological value of evaluating behavioral structure beyond gaming duration alone.
The findings do not establish clinical validity or diagnostic performance. Because the dataset is synthetically generated, the results represent methodological feasibility and internal-consistency testing rather than real-world validation. The feature-importance results show that the pipeline can recover the pre-specified signal hierarchy encoded in the synthetic generator. They do not identify validated digital markers; rather, they indicate which pre-specified telemetry feature classes may be treated as hypotheses for independent empirical testing.
From a personalized-medicine perspective, the main contribution of this work is methodological. It demonstrates a privacy-aware and interpretable framework for transforming passive behavioral metadata into individualized risk-stratification signals while avoiding content-level monitoring. Future research needs to validate this approach using real-world, ethically governed telemetry data and examine whether person-level changes in behavioral patterns can support timely screening, stepped assessment, and personalized mental health care pathways.
Supplementary Materials
The following supporting information can be downloaded at the website of this paper posted on Preprints.org, Table S1, synthetic data-generation parameters; Table S2, machine-learning model specifications and baseline feature sets; Table S3, detailed primary Random Forest performance metrics and confusion-matrix counts. The same Zenodo record also contains the complete Python code, the synthetic dataset generated with the fixed random seed of 42, and the output tables used to support reproducibility.
Author Contributions
Conceptualization, A.K., and V.V.; methodology, A.K., C.K. and E.P.; software, A.K. and I.B.; validation, A.K., V.V., G.F., E.P., I.B., C.K. and P.K.; formal analysis, V.V., E.P., G.F. and A.K.; investigation, A.K., I.B., C.K. and P.K.; resources, V.V., C.K. and P.K.; data curation, I.B. and A.K.; writing—original draft preparation, A.K. and G.F.; writing—review and editing, E.P., I.B., C.K., P.K., V.V. and G.F.; visualization, A.K., I.B. and E.P.; supervision, V.V. and G.F. All authors have read and agreed to the published version of the manuscript.
Funding
This research received no external funding.
Institutional Review Board Statement
Not applicable. Ethical review and approval were not required because the study used only synthetically generated virtual user profiles and did not involve human participants, patient records, identifiable behavioral logs, or animal subjects.
Informed Consent Statement
Not applicable.
Data Availability Statement
The synthetic dataset generated with the fixed random seed of 42, together with the complete Python code used for synthetic data generation, model training, feature-importance analysis, and label-noise sensitivity analysis, is openly available at https://doi.org/10.5281/zenodo.21116632. No real participant data, patient records, identifiable behavioral logs, or content-level behavioral data were used in this study.
Conflicts of Interest
The authors declare no conflicts of interest.
Abbreviations
The following abbreviations are used in this manuscript:
| Acc. | Accuracy |
| AI | Artificial intelligence |
| Bal. acc. | Balanced accuracy |
| COVID-19 | Coronavirus disease 2019 |
| DSM-5 | Diagnostic and Statistical Manual of Mental Disorders, Fifth Edition |
| F1 | F1-score |
| ICD-11 | International Classification of Diseases, Eleventh Revision |
| IGD | Internet Gaming Disorder |
| IGDS9-SF | Internet Gaming Disorder Scale–Short Form |
| I-PACE | Interaction of Person-Affect-Cognition-Execution |
| LLM | Large language model |
| LNI | Late-Night Index |
| PPV | Positive predictive value |
| PR-AUC | Area under the precision–recall curve |
| ROC-AUC | Area under the receiver operating characteristic curve |
| SD | Standard deviation |
| Sens. | Sensitivity |
| Spec. | Specificity |
Appendix A Algorithms
Appendix A.1. Synthetic Data-Generation Algorithm
Appendix A.2. Model Evaluation Pipeline

References
- American Psychiatric Association. Diagnostic and Statistical Manual of Mental Disorders, 5th ed.; American Psychiatric Association: Arlington, VA, USA, 2013. [Google Scholar] [CrossRef]
- World Health Organization. International Classification of Diseases, Eleventh Revision (ICD-11); World Health Organization: Geneva, Switzerland, 2019; Available online: https://icd.who.int/browse11 (accessed on 4 July 2026).
- Stevens, M.W.R.; Dorstyn, D.; Delfabbro, P.H.; King, D.L. Global prevalence of gaming disorder: A systematic review and meta-analysis. Aust. N. Z. J. Psychiatry 2021, 55, 553–568. [Google Scholar] [CrossRef] [PubMed]
- Kranas, A.; Koutras, V.; Vassilakopoulos, M.; Verykios, V.S. Problematic Video Gaming During the Covid-19 Pandemic: A Case Study of Greece. In Proceedings of the 2025 16th International Conference on Information, Intelligence, Systems and Applications (IISA), Mytilene, Greece, 10–12 July 2025; pp. 1–4. [Google Scholar] [CrossRef]
- Pontes, H.M.; Griffiths, M.D. Measuring DSM-5 internet gaming disorder: Development and validation of a short psychometric scale. Comput. Hum. Behav. 2015, 45, 137–143. [Google Scholar] [CrossRef]
- Parry, D.A.; Davidson, B.I.; Sewall, C.J.R.; Fisher, J.T.; Mieczkowski, H.; Quintana, D.S. A systematic review and meta-analysis of discrepancies between logged and self-reported digital media use. Nat. Hum. Behav. 2021, 5, 1535–1547. [Google Scholar] [CrossRef] [PubMed]
- Onnela, J.-P.; Rauch, S.L. Harnessing smartphone-based digital phenotyping to enhance behavioral and mental health. Neuropsychopharmacology 2016, 41, 1691–1696. [Google Scholar] [CrossRef] [PubMed]
- Torous, J.; Bucci, S.; Bell, I.H.; Kessing, L.V.; Faurholt-Jepsen, M.; Whelan, P.; Carvalho, A.F.; Keshavan, M.; Linardon, J.; Firth, J. The growing field of digital psychiatry: Current evidence and the future of apps, social media, chatbots, and virtual reality. World Psychiatry 2021, 20, 318–335. [Google Scholar] [CrossRef] [PubMed]
- Montag, C.; Sindermann, C.; Baumeister, H. Digital phenotyping in psychological and medical sciences: A reflection about necessary prerequisites to reduce harm and increase benefits. Curr. Opin. Psychol. 2020, 36, 19–24. [Google Scholar] [CrossRef] [PubMed]
- Billieux, J.; Schimmenti, A.; Khazaal, Y.; Maurage, P.; Heeren, A. Are we overpathologizing everyday life? A tenable blueprint for behavioral addiction research. J. Behav. Addict. 2015, 4, 119–123. [Google Scholar] [CrossRef] [PubMed]
- Cho, K.; Kim, M.; Cho, Y.; Hur, J.-W.; Kim, D.H.; Park, S.; Park, S.; Jang, M.; Lee, C.-G.; Kwon, J.S. Digital phenotypes for early detection of Internet Gaming Disorder in adolescent students: Explorative data-driven study. JMIR Ment. Health 2024, 11, e50259. [Google Scholar] [CrossRef] [PubMed]
- Kranas, A.; Verykios, V.S. Large Language Models in the Assessment and Care of Internet Gaming Disorder. AI Med. 2026, 1, 6. [Google Scholar] [CrossRef]
- Brand, M.; Wegmann, E.; Stark, R.; Müller, A.; Wölfling, K.; Robbins, T.W.; Potenza, M.N. The Interaction of Person-Affect-Cognition-Execution (I-PACE) model for addictive behaviors: Update, generalization to addictive behaviors beyond Internet-use disorders, and specification of the process character of addictive behaviors. Neurosci. Biobehav. Rev. 2019, 104, 1–10. [Google Scholar] [CrossRef] [PubMed]
- Cavoukian, A. Privacy by Design: The 7 Foundational Principles; Information and Privacy Commissioner of Ontario: Toronto, ON, Canada, 2009. [Google Scholar]
- Breiman, L. Random forests. Mach. Learn. 2001, 45, 5–32. [Google Scholar] [CrossRef]
- Pedregosa, F.; Varoquaux, G.; Gramfort, A.; Michel, V.; Thirion, B.; Grisel, O.; Blondel, M.; Prettenhofer, P.; Weiss, R.; Dubourg, V.; et al. Scikit-learn: Machine learning in Python. J. Mach. Learn. Res. 2011, 12, 2825–2830. [Google Scholar]
- Friedman, J.H. Greedy function approximation: A gradient boosting machine. Ann. Stat. 2001, 29, 1189–1232. [Google Scholar] [CrossRef]
- Fawcett, T. An introduction to ROC analysis. Pattern Recognit. Lett. 2006, 27, 861–874. [Google Scholar] [CrossRef]
- Saito, T.; Rehmsmeier, M. The precision-recall plot is more informative than the ROC plot when evaluating binary classifiers on imbalanced datasets. PLoS ONE 2015, 10, e0118432. [Google Scholar] [CrossRef] [PubMed]
- Brier, G.W. Verification of forecasts expressed in terms of probability. Mon. Weather Rev. 1950, 78, 1–3. [Google Scholar]
- Altmann, A.; Toloşi, L.; Sander, O.; Lengauer, T. Permutation importance: A corrected feature importance measure. Bioinformatics 2010, 26, 1340–1347. [Google Scholar] [CrossRef] [PubMed]
- Frénay, B.; Verleysen, M. Classification in the presence of label noise: A survey. IEEE Trans. Neural Netw. Learn. Syst. 2014, 25, 845–869. [Google Scholar] [CrossRef] [PubMed]
- Collins, G.S.; Moons, K.G.M.; Dhiman, P.; Riley, R.D.; Beam, A.L.; Van Calster, B.; Ghassemi, M.; Liu, X.; Reitsma, J.B.; van Smeden, M.; et al. TRIPOD+AI statement: Updated guidance for reporting clinical prediction models that use regression or machine learning methods. BMJ 2024, 385, e078378. [Google Scholar] [CrossRef] [PubMed]
- European Parliament; Council of the European Union. Regulation (EU) 2016/679 of the European Parliament and of the Council of 27 April 2016 on the protection of natural persons with regard to the processing of personal data and on the free movement of such data, and repealing Directive 95/46/EC. Off. J. Eur. Union 2016, L119, 1–88. [Google Scholar]
- Kelly, C.J.; Karthikesalingam, A.; Suleyman, M.; Corrado, G.; King, D. Key challenges for delivering clinical impact with artificial intelligence. BMC Med. 2019, 17, 195. [Google Scholar] [CrossRef] [PubMed]
Figure 1.
Methodological workflow of the proposed privacy-preserving, AI-enabled digital phenotyping simulation pipeline. Aggregated metadata are used to generate synthetic user profiles, train and compare machine-learning models, evaluate feature importance, assess robustness under increasing label-noise conditions, and define the requirements for future validation in real-world clinically characterized cohorts.
Figure 1.
Methodological workflow of the proposed privacy-preserving, AI-enabled digital phenotyping simulation pipeline. Aggregated metadata are used to generate synthetic user profiles, train and compare machine-learning models, evaluate feature importance, assess robustness under increasing label-noise conditions, and define the requirements for future validation in real-world clinically characterized cohorts.
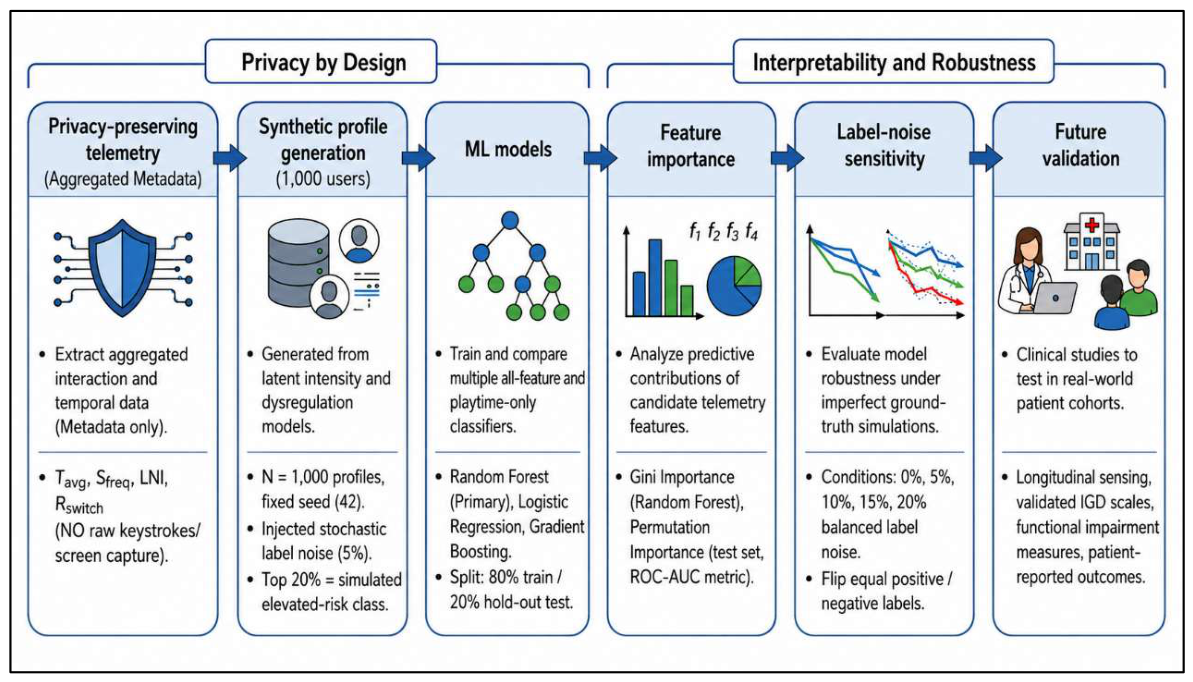

Table 1.
Candidate behavioral telemetry features.
| Feature | Variable | Description | Theoretical relevance |
| Average session duration | Mean duration of uninterrupted gaming sessions | General engagement intensity | |
| Sessions per week | Number of sessions initiated within a seven-day period | Repetitive gaming pattern | |
| Late-Night Index | Proportion of gaming time between 00:00 and 06:00 | Circadian disruption and persistence despite potential consequences | |
| Application-switching rate | Number of application-switching events per active gaming hour | Interactional instability, attentional preoccupation, or difficulty disengaging |
Table 2.
Comparative model performance on the hold-out test set.
| Model | Acc. | Bal. acc. | Sens. | Spec. | PPV | F1 | ROC-AUC | PR-AUC | Brier |
| Random Forest — all features | 0.880 | 0.850 | 0.800 | 0.900 | 0.667 | 0.727 | 0.909 | 0.779 | 0.089 |
| Logistic Regression — all features | 0.860 | 0.856 | 0.850 | 0.862 | 0.607 | 0.708 | 0.920 | 0.832 | 0.106 |
| Gradient Boosting — all features | 0.900 | 0.806 | 0.650 | 0.962 | 0.812 | 0.722 | 0.907 | 0.805 | 0.073 |
| Random Forest — playtime only | 0.725 | 0.622 | 0.450 | 0.794 | 0.353 | 0.396 | 0.686 | 0.497 | 0.189 |
| Logistic Regression — playtime only | 0.660 | 0.656 | 0.650 | 0.662 | 0.325 | 0.433 | 0.724 | 0.547 | 0.210 |
Table 3.
Feature-importance analysis for the Random Forest model.
| Feature | Feature label | Gini importance | Permutation importance, mean ROC-AUC decrease | Permutation importance SD |
| Application-switching rate | 0.444 | 0.0877 | 0.0267 | |
| Late-Night Index | 0.405 | 0.0806 | 0.0232 | |
| Average session duration | 0.122 | 0.0273 | 0.0145 | |
| Sessions per week | 0.029 | −0.0008 | 0.0026 |
Table 4.
Random Forest sensitivity analysis across label-noise conditions.1.
| Label noise | Acc. | Bal. acc. | Sens. | Spec. | PPV | F1 | ROC-AUC | PR-AUC | Brier |
| 0% | 0.925 | 0.944 | 0.975 | 0.913 | 0.736 | 0.839 | 0.990 | 0.966 | 0.051 |
| 5% | 0.880 | 0.850 | 0.800 | 0.900 | 0.667 | 0.727 | 0.909 | 0.779 | 0.089 |
| 10% | 0.825 | 0.731 | 0.575 | 0.888 | 0.561 | 0.568 | 0.816 | 0.570 | 0.132 |
| 15% | 0.800 | 0.716 | 0.575 | 0.856 | 0.500 | 0.535 | 0.750 | 0.481 | 0.158 |
| 20% | 0.785 | 0.650 | 0.425 | 0.875 | 0.459 | 0.442 | 0.670 | 0.392 | 0.184 |
Disclaimer/Publisher’s Note: The statements, opinions and data contained in all publications are solely those of the individual author(s) and contributor(s) and not of MDPI and/or the editor(s). MDPI and/or the editor(s) disclaim responsibility for any injury to people or property resulting from any ideas, methods, instructions or products referred to in the content. |
© 2026 by the authors. Licensee MDPI, Basel, Switzerland. This article is an open access article distributed under the terms and conditions of the Creative Commons Attribution (CC BY) license.
Copyright: This open access article is published under a Creative Commons CC BY 4.0 license, which permit the free download, distribution, and reuse, provided that the author and preprint are cited in any reuse.


