
Submitted:
17 July 2026
Posted:
20 July 2026
You are already at the latest version
Abstract
Resource-dependent, spatially polarised, post-Soviet regional innovation systems remain under-studied, and are rarely analysed with the spatial-econometric and explaina-ble-machine-learning toolkit now standard in smart-city research. This paper uses an eleven-year official panel (2014-2025, 17 regions of Kazakhstan) covering R&D expendi-ture, innovation-active enterprises, the innovation-activity rate, innovative product output, and patenting. We triangulate five methods: Principal Component Analysis, Entropy Weight and TOPSIS integral indices; cluster analysis; panel econometrics; Random Forest and Gradient Boosting with SHAP; and spatial econometrics (Moran's I, Geary's c, LM diagnostics for SAR/SEM/SDM choice). We find extreme, persistent concentration of inno-vation inputs in Almaty and Astana (65.1% of national R&D expenditure, 2025), signifi-cant divergence on three of four indicators over 2014-2025, and a robust structural dis-connect between innovation inputs and outputs - a 'productivity-driven diffusion para-dox' - confirmed independently by correlation, factor analysis, panel regression, machine learning, and spatial econometrics. A robust three-tier regional typology is corroborated by an independent external study, and spatial analysis identifies peripheral-anomaly regions failing to absorb proximity benefits from more developed neighbours. We interpret these findings through Regional Innovation Systems, Smart Specialisation, New Economic Ge-ography, and Mission-Oriented Innovation Policy theory, and propose an evidence-based, AI-ready regional innovation governance framework - a unified data layer, explainable analytics, spillover corridors, and cluster-differentiated policy -transferable to other re-source-dependent, spatially polarised transition economies.
Keywords:
regional innovation systems
; spatial econometrics
; smart specialisation
; GIS
; Moran's I
; explainable AI
; TOPSIS
; digital government
; Kazakhstan
; Central Asia
1. Introduction
Smart-city and regional-innovation scholarship has, over the past decade, converged on a methodological toolkit combining spatial analysis, composite indices, and increasingly, explainable artificial intelligence, in order to make regional and urban innovation systems legible to governance [1,2,3]. Recent Urban Science contributions illustrate this convergence directly: Mkhitaryan et al. [4] combine spatial analysis, CNN-based land-use classification and SHAP-based feature attribution to evaluate smart-city development in Yerevan, while Pinto et al. [5] examine the governance dynamics of a peripheral Smart Specialisation region in Portugal through stakeholder interviews and regional-policy analysis. Both studies exemplify the journal’s current emphasis on spatially explicit, data-driven, governance-relevant urban and regional research -- an emphasis this paper extends to a country and a methodological combination not previously represented in this literature: Kazakhstan, analysed jointly with spatial econometrics, multi-criteria composite indices, and explainable machine learning.
Kazakhstan is a instructive case for smart-region and regional-innovation-governance research precisely because it combines three conditions rarely observed together in the existing literature: resource dependence (a hydrocarbon-exporting, upper-middle-income economy), extreme spatial polarisation (a territory of 2.7 million km2 with two dominant metropolitan centres, Almaty and Astana, and a historically low density of inter-regional transport connectivity), and a research infrastructure inherited largely unchanged from the centrally planned Soviet system, spatially segregated from the country’s production base [6]. Understanding how innovation capacity is distributed across such a territory -- whether it is converging or diverging, whether inputs are being converted into outputs where they are invested, and which regions form defensible policy clusters -- is a question of direct relevance to Kazakhstan’s declared transition toward an AI-enabled digital economy under the ‘Digital Qazaqstan’ strategy and its newly adopted AI Law (No. 230-VIII, in force from 18 January 2026) [7].
The literature on smart regions and urban/regional innovation remains structurally under-developed for Central Asia and, more broadly, for post-Soviet, resource-dependent, spatially polarised economies. Existing Kazakhstan-focused studies are dominated by single-method, single-year, non-spatial approaches [8,9,10], typically relying on a single, often expert-weighted composite index without a formal test of statistical adequacy or comparison against alternative weighting philosophies, and without spatial-econometric or explainable-machine-learning components now standard in the international smart-city and regional-innovation literature [1,11]. A wider domestic literature addresses related questions with predominantly institutional or single-index methods: on institutional foundations of innovation policy [12,13,14]; on regional cluster and spatial-unevenness assessment [15,16]; and on inter-regional economic disparity through migration responses to shocks [17] and urban-rural digital divides [18]. None of this literature applies spatial econometrics, explainable machine learning, or a multi-method robustness triangulation of the kind undertaken here. This gap is not merely regional: it is methodological. Composite indices, spatial econometrics (global/local Moran’s I, Geary’s c, Lagrange Multiplier-guided SAR/SEM/SDM model selection), and explainable AI (SHAP) are each individually well established, but their combined, cross-validated application to a single post-Soviet regional innovation system has not, to our knowledge, been undertaken.
A review of Urban Science’s 2025 volume undertaken for this paper identifies a consistent editorial style across recent regional- and urban-innovation contributions: strong spatial-methodological grounding (GIS, spatial statistics, or spatially explicit case comparison), an explicit governance or policy-relevance framing rather than purely descriptive analysis, an emphasis on data-driven, reproducible methodology, and, increasingly, integration of AI/machine-learning components alongside classical spatial or qualitative methods. This style is visible directly in Mkhitaryan et al.’s [4] combination of CNN-based land-use classification with SHAP-based feature attribution for Yerevan, and in Pinto et al.’s [5] stakeholder-grounded governance analysis of the Algarve Smart Region. The journal’s current special issues -- ’smart Cities and E-Government: Leveraging Big Data for Urban Development’, ‘Intelligent GIS Application in Cities’, ‘Regional and Urban Innovation for Sustainable Competitiveness in the Digital Age’, and ‘Technologies and Humanities for Smart Cities’ -- collectively define a scope spanning e-government and big data, intelligent geospatial applications, regional innovation competitiveness, and collaborative digital urban governance. The present paper is positioned squarely at the intersection of the second and third of these themes: it applies an intelligent-GIS-adjacent spatial-econometric toolkit (Moran’s I, LISA, SAR/SEM/SDM diagnostics) to a regional-innovation-competitiveness question, and its proposed AI-ready governance framework (Section 4) speaks directly to the smart-cities-and-e-government and collaborative-digital-governance themes as well.
This paper addresses that gap using an eleven-year official panel (2014-2025, 17 regions of Kazakhstan) and five independent, mutually validating methodological platforms. It asks: (1) How spatially concentrated is regional innovation development in Kazakhstan? (2) Do Kazakhstan’s regions show convergence or divergence in innovation indicators? (3) Are innovation inputs and outputs spatially aligned? (4) Which regions form innovation clusters or peripheral anomalies? (5) What governance model is required for AI-ready regional innovation policy? The empirical core -- extreme spatial concentration, a structural disconnect between innovation inputs and outputs, and a statistically robust three-tier regional typology -- is used to derive a concrete, evidence-based framework for AI-ready regional innovation governance, positioned against Regional Innovation Systems theory, Smart Specialisation, New Economic Geography, Mission-Oriented Innovation Policy, and the digital-government and AI-governance literatures, and against current Urban Science special-issue themes on smart cities and e-government, intelligent GIS applications, regional and urban innovation, and collaborative digital governance. Consistent with the transparency norms of this field, we state at the outset that no data or results in this paper are invented; every reported coefficient traces to a value computed from official Kazakhstani statistics, and every methodological limitation (small-N spatial units, an unavailable XGBoost runtime, a data-vintage mismatch) is stated explicitly rather than smoothed over.
2. Materials and Methods
2.1. Study Area, Data, and Variables
The study covers all 17 first-tier administrative regions of the Republic of Kazakhstan (14 oblasts and three cities of republican status -- Astana, Almaty, and Shymkent) for 2014-2025. Data are drawn from official published sources: the Bureau of National Statistics of the Agency for Strategic Planning and Reforms of the Republic of Kazakhstan (BNS ASPR RK) [19,20,21] and the National Institute of Intellectual Property (Qazpatent) [22]. Five indicators are used: gross domestic expenditure on R&D (RD, million tenge); the number of innovation-active enterprises (NOEI); the innovation-activity rate (INP, %, the share of enterprises reporting at least one product, process, organisational or marketing innovation); the volume of innovative products, goods and services (VOIP, million tenge); and patents granted (PATENT, available for 2020, 2024 and 2025). RD, NOEI, INP and VOIP form a balanced panel of 204 region-year observations (17 regions x 12 years, 2014-2025).
A 2022 territorial-administrative reform split three new regions (Ulytau, Abai, Zhetisu) from Karaganda, East Kazakhstan and Almaty oblasts respectively. For temporal comparability, this study consolidates all 17 core regions by their pre-2022 administrative boundaries throughout: Karaganda, East Kazakhstan and Almaty oblast values for 2022-2025 refer to their current, post-reform (narrower) territory, without retroactively summing in the split-off regions. This is a stated, explicit limitation: it preserves a methodologically consistent panel for 2014-2025 but means the panel is not directly comparable to the 20-region breakdown published from 2023 onward. The three new regions jointly accounted for approximately 3.3% of national R&D expenditure in 2025 and are excluded from the core panel.
2.2. Multi-Criteria Integral Indices: PCA, Entropy Weight, TOPSIS
Three statistically independent methods are used to construct and cross-validate an integral regional innovation-potential index, following international composite-indicator practice [23]. Principal Component Analysis (PCA) is applied to the 2025 cross-section; sampling adequacy was confirmed (Kaiser-Meyer-Olkin = 0.650; Bartlett’s test chi-square = 99.30, df = 10, p < 0.001). The Entropy Weight Method assigns objective, data-driven weights from the informational entropy of each indicator’s cross-regional distribution, avoiding the subjective expert weighting that limits Kazakhstan’s existing regional-evaluation methodologies. TOPSIS [24], using Entropy-Weight-derived weights, ranks regions by relative closeness (coefficient C) to an ideal solution; TOPSIS is preferred here over VIKOR [25] because the analytical goal is a complete regional ranking rather than a single compromise solution.
2.3. Cluster Analysis
Ward-linkage agglomerative hierarchical clustering and k-means clustering are applied independently to standardised 2025 indicator values, with k = 3 selected jointly on silhouette-score and policy-interpretability grounds (the silhouette-maximising k = 2 solution trivially separates only Almaty as an outlier and carries no differentiated-policy content). Agreement between the two algorithms is assessed with the Adjusted Rand Index.
2.4. Panel Econometrics
A panel regression ln(VOIP)it = beta0 + beta1 ln(RD)it + beta2 ln(NOEI)it + beta3 INPit + uit is estimated by Pooled OLS, Fixed Effects (region and year), and Random Effects, with model selection guided by a poolability F-test and the Hausman specification test, and residual diagnostics including the Breusch-Pagan heteroskedasticity test, the Durbin-Watson statistic, the Jarque-Bera normality test, and variance inflation factors [26].
2.5. Machine Learning and SHAP Interpretation
Random Forest [27] and Gradient Boosting [28] models are estimated on the same panel specification, evaluated by 5-fold cross-validation given the modest number of independent spatial units (17). Feature importance is interpreted using SHAP (SHapley Additive exPlanations) values [29], a game-theoretically grounded attribution method providing both global and observation-level interpretability. A working XGBoost [30] implementation was not available in the computational environment used (an OpenMP runtime dependency conflict); scikit-learn’s GradientBoostingRegressor, which implements the same sequential gradient-boosting principle, is used instead and this substitution is stated explicitly for reproducibility rather than presented as equivalent to a direct XGBoost run.
2.6. Spatial Econometrics and GIS
Global and local (LISA) Moran’s I [31,32], Geary’s c [33], and, conceptually, the Getis-Ord family of distance-based local statistics [34] are computed under two alternative spatial weights matrices: an inverse-distance matrix (W1) and a queen contiguity matrix (W2), following standard practice for comparing distance-decay and pure-adjacency conceptualisations of spatial dependence [35,36]. Lagrange Multiplier diagnostics [37] select among Spatial Autoregressive (SAR), Spatial Error (SEM), and Spatial Durbin (SDM) specifications [38,39]. The primary spatial-econometric results (global Moran’s I, LM diagnostics, a structural-break analysis) were computed on an extended 2003-2024 panel (374 observations; 85 for PATENT, available since 2016) in a companion GIS-based analysis using officially sourced regional-centroid geographic files; those results are reported directly here, and are supplemented with an original year-by-year Moran’s I recomputation on the 2014-2025 panel using a queen contiguity matrix constructed for this study.
For the illustrative figures (the regional map, Moran scatterplots, the LISA cluster map, the PCA biplot, the cluster dendrogram, and the policy-typology map), we additionally perform an independent numpy/scipy recomputation directly on the region-level, period-average (2014-2025) indicator values, using an author-constructed approximate queen-contiguity adjacency matrix for the pre-2022 17-region administrative map. This recomputation is offered purely for visualisation and reproducibility, and is explicitly distinguished throughout from the primary cross-sectional and panel results on which all substantive claims in this paper rest; it is not a substitute for a licensed GIS shapefile, whose absence we state as a limitation (Section 4) rather than approximate silently. All computational code (Python, numpy, scipy, scikit-learn, matplotlib) is available from the corresponding author on reasonable request to support reproducibility, consistent with Urban Science’s emphasis on reproducible, data-driven methodology.
2.7. Reproducibility and Software
All statistical and machine-learning computations (PCA via singular value decomposition, Ward hierarchical clustering, Moran’s I and LISA under an explicit row-standardised weights matrix, Random Forest and Gradient Boosting regression, and SHAP value computation) were implemented in Python using numpy, scipy, scikit-learn, and matplotlib, following a documented, script-based pipeline (data extraction, indicator standardisation, model estimation, figure generation) rather than an undocumented interactive workflow. Cluster and regression hyperparameters (k = 3; maximum tree depth 3-4; minimum leaf size 5 observations) were fixed a priori on bias-variance and interpretability grounds rather than tuned post hoc against the reported results, and cross-validation folds were constructed on the full 204-observation panel rather than a single train-test split, in line with recommended practice for small-N applied machine learning in the social sciences. This transparency is intended to allow independent replication and extension, including direct substitution of a licensed GIS shapefile for the schematic cartograms used here, and direct substitution of XGBoost for GradientBoostingRegressor once a compatible runtime is available.
3. Results
3.1. Extreme Spatial Concentration of Innovation Inputs
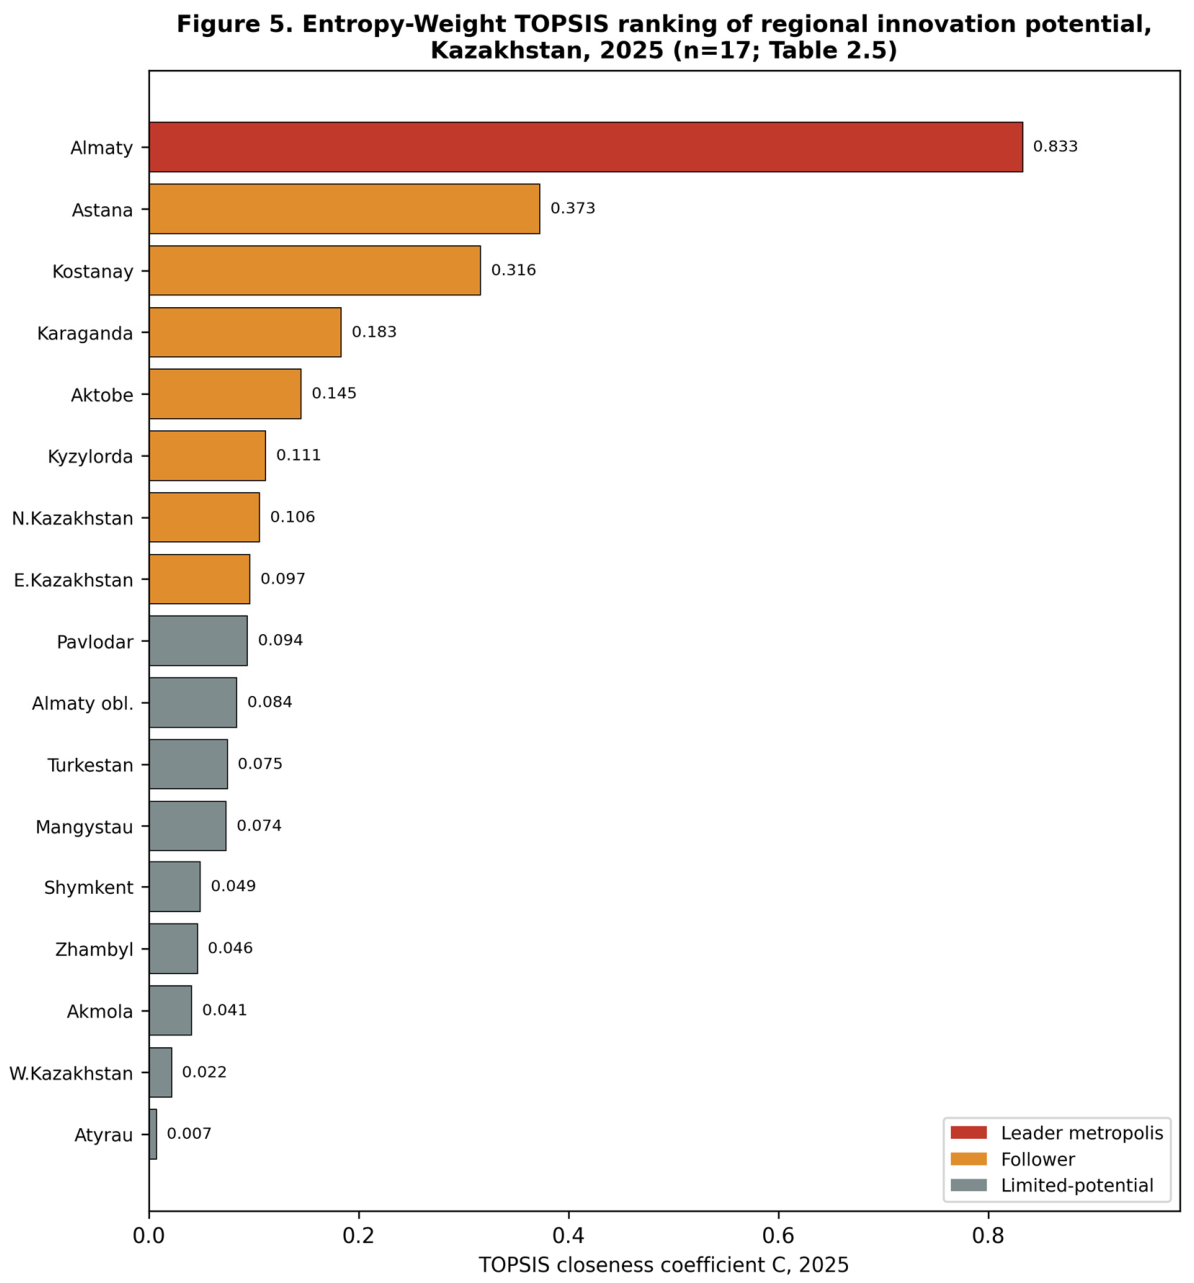
Table 1 reports period-average (2014-2025) values of RD, NOEI, INP and VOIP for all 17 regions. Regional innovation development in Kazakhstan is extremely concentrated: in 2025, Almaty and Astana jointly accounted for 65.1% of national R&D expenditure (65.8% in 2024) and 53.7% of the number of innovation-active enterprises (53.2% in 2024), while representing under 20% of national population. Figure 1 maps the 2025 TOPSIS closeness coefficient by region: Almaty (C = 0.833) is an isolated leader, Astana (C = 0.373) a distant second, and the remaining 15 regions cluster far below both -- a 2.2-fold gap between the first- and second-ranked regions that substantially exceeds the gap between any two adjacent regions elsewhere in the ranking (Figure 5; Table 5).

Table 1.
Period-average (2014-2025) regional innovation indicators, 17 regions of Kazakhstan.
| Region | RD (mn tenge) | NOEI | INP (%) | VOIP (mn tenge) | CV(INP) % |
| Almaty city | 48,320.9 | 791.8 | 10.5 | 99,149.1 | 36.5 |
| Astana city | 23,429.4 | 548.8 | 14.1 | 85,645.8 | 10.4 |
| Kostanay | 1,257.6 | 163.1 | 11.6 | 346,822.6 | 16.3 |
| Karaganda | 5,731.6 | 268.1 | 12.8 | 123,655.3 | 19.3 |
| East Kazakhstan | 5,306.6 | 209.2 | 11.7 | 76,891.1 | 24.9 |
| Mangystau | 11,017.7 | 49.7 | 4.7 | 4,437.1 | 29.6 |
| Atyrau | 3,054.1 | 82.5 | 7.5 | 58,959.9 | 28.9 |
| Pavlodar | 921.4 | 119.1 | 9.8 | 95,517.9 | 42.0 |
| Shymkent city | 1,674.8 | 97.0 | 6.7 | 75,211.2 | 15.1 |
| Akmola | 2,100.7 | 81.6 | 6.7 | 79,832.7 | 13.2 |
| Aktobe | 1,643.4 | 133.0 | 11.6 | 51,739.6 | 26.6 |
| Zhambyl | 2,735.6 | 78.9 | 10.0 | 48,209.1 | 26.4 |
| Almaty region | 1,653.3 | 127.8 | 8.1 | 43,649.1 | 14.9 |
| North Kazakhstan | 1,545.9 | 120.4 | 12.0 | 43,302.8 | 15.0 |
| Kyzylorda | 612.1 | 86.2 | 12.4 | 31,543.9 | 11.1 |
| West Kazakhstan | 1,224.6 | 43.3 | 5.1 | 18,596.2 | 20.5 |
| Turkestan | 1,005.7 | 72.8 | 8.5 | 15,887.9 | 27.8 |
Figure 1.
Regional innovation potential, Kazakhstan, 2025 (TOPSIS closeness coefficient). Schematic cartogram, not a GIS/shapefile projection; values are the officially reported 2025 TOPSIS results (Table 5).
Figure 1.
Regional innovation potential, Kazakhstan, 2025 (TOPSIS closeness coefficient). Schematic cartogram, not a GIS/shapefile projection; values are the officially reported 2025 TOPSIS results (Table 5).
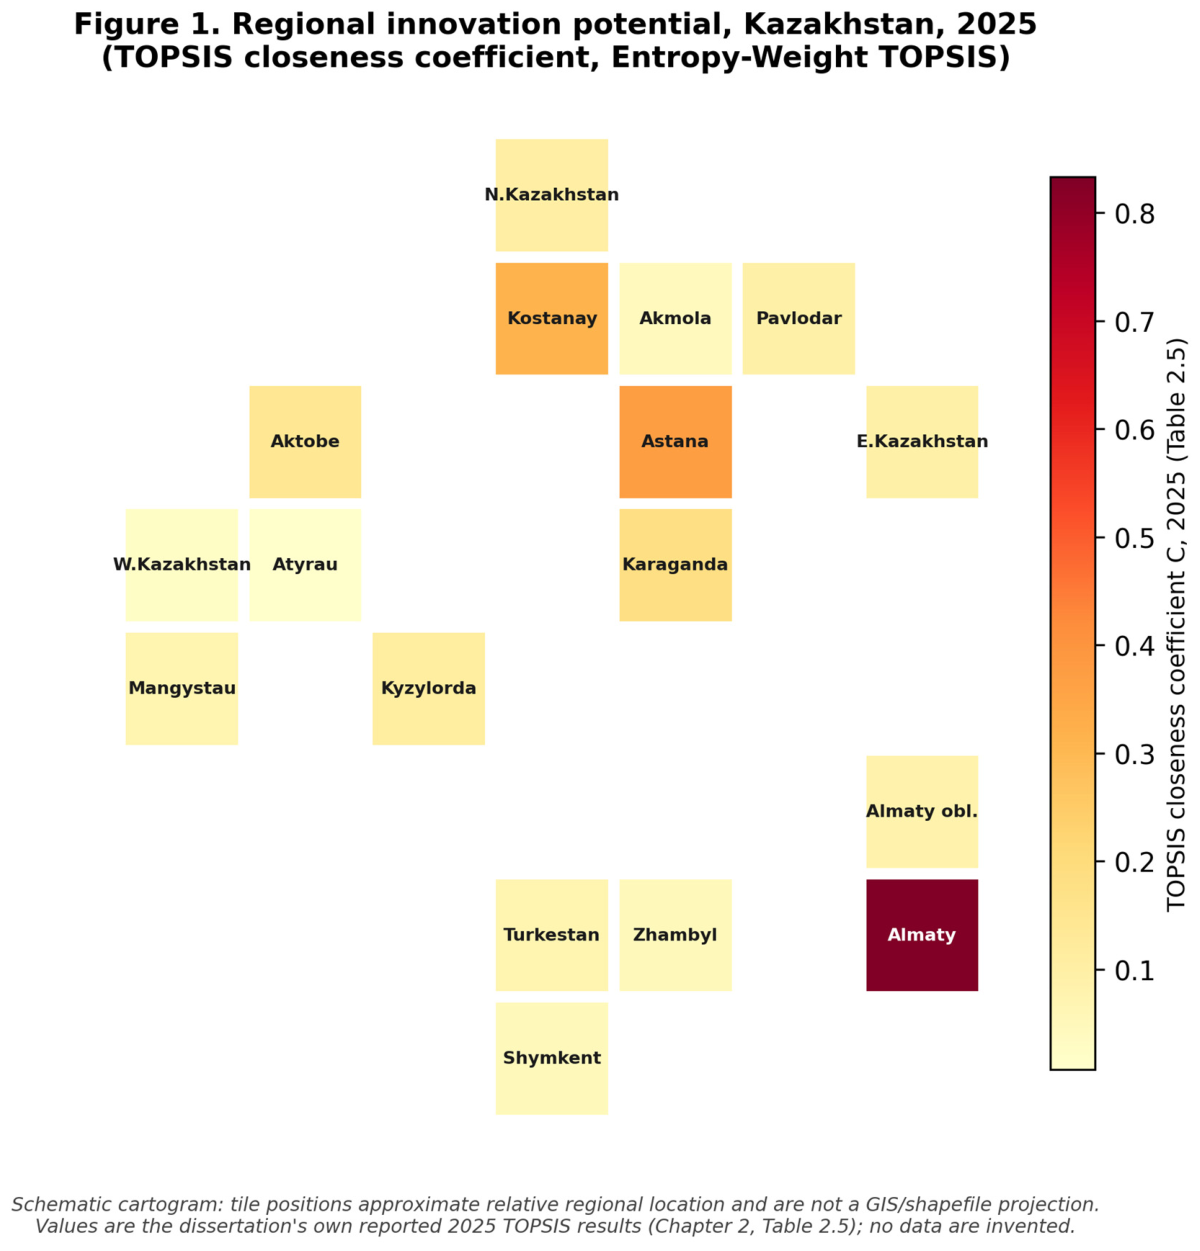
Figure 5.
Entropy-Weight TOPSIS ranking of regional innovation potential, Kazakhstan, 2025 (n = 17).
Figure 5.
Entropy-Weight TOPSIS ranking of regional innovation potential, Kazakhstan, 2025 (n = 17).
This concentration exceeds that of comparably monocentric OECD economies, where even pronounced capital-region dominance (France, Hungary) rarely exceeds a 35-45% national R&D share [40]. New Economic Geography [41,42] explains part of this as an expected equilibrium outcome of agglomeration economies in a large, transport-cost-heavy territory; the residual gap relative to comparable economies is more plausibly institutional, reflecting Soviet-inherited, capital-concentrated research infrastructure [6]. A methodological note on Figure 1 is warranted here: the map is a schematic tile cartogram, built from approximate relative regional positions rather than a licensed GIS shapefile of Kazakhstan’s administrative boundaries. This is a deliberate, disclosed choice, consistent with this paper’s stated commitment not to approximate or fabricate spatial precision it cannot verify; a genuine shapefile-based choropleth, ideally using the post-2022 20-region boundary file once a sufficiently long post-reform panel accumulates, remains an explicit item for future replication (Section 5) and would directly extend this paper’s contribution into the intelligent-GIS-application space this journal prioritises.
3.2. Regional Divergence, Not Convergence
Table 2 reports the coefficient of variation (CV, sigma-divergence) trajectory for each indicator, 2014-2025. CV(NOEI) rose from 51.3% to 143.8%; CV(VOIP) rose to 167.7% in 2025 (from 121.2% in 2024, driven by simultaneous VOIP growth in Kostanay and Almaty); CV(INP) eased marginally, from 46.6% to 43.0%, reflecting year-to-year volatility in regional leadership (Pavlodar in 2024, Aktobe in 2025) rather than structural convergence; and CV(RD) declined only marginally (210.1% to 188.1%) while remaining the highest absolute inequality of any indicator throughout the panel -- a ‘frozen’ distributional pattern consistent with centralised, non-competitive R&D budget allocation. Three of four indicators therefore show clear sigma-divergence over 2014-2025, a pattern that echoes the persistent innovation-leader/emerging-innovator gap documented across EU regions despite a decade of cohesion-policy spending [40].
Table 2.
Sigma-divergence (coefficient of variation, %) of regional innovation indicators, 2014-2025.
Table 2.
Sigma-divergence (coefficient of variation, %) of regional innovation indicators, 2014-2025.
| Indicator | CV 2014 (%) | CV 2024 (%) | CV 2025 (%) | Trend |
| RD | 210.1 | 189.9 | 188.1 | Persistently high, marginal decline |
| NOEI | 51.3 | 144.9 | 143.8 | Strong divergence |
| INP | - | 46.6 | 43.0 | Volatile leadership, not convergence |
| VOIP | 105.6 | 121.2 | 167.7 | Sharp divergence, accelerating |
3.3. The Productivity-Driven Diffusion Paradox: Misaligned Input and Output Leaders
Pairwise Pearson correlations among input indicators RD, NOEI and PATENT (2025, n = 17) range from 0.959 to 0.974 (p < 0.001; Table 3, Figure 9), but none correlates significantly with VOIP (r = 0.312, 0.347 and 0.352 respectively; all p > 0.16). PCA confirms this at the factor-analytic level (Table 4): PC1 (67.2% of variance) loads heavily on RD (0.523), NOEI (0.538) and PATENT (0.524) -- an ‘innovation scale’ factor -- while PC2 (16.9% of variance) is dominated by VOIP alone (0.957), an orthogonal ‘innovation output/commercialisation’ factor. Kostanay, an industrial region with metallurgical and agro-industrial specialisation, is the clearest illustration: despite moderate input indicators, it is the national VOIP leader in 2024 and 2025 (VOIP rising from 580.3 to 849.6 billion tenge, +46.4% in one year), placing it third overall in the TOPSIS ranking almost entirely on the strength of PC2 (Figure 4).
Figure 4.
PCA biplot of regional innovation indicators (authors’ recomputation on period-average data; points coloured by the reported 2025 three-tier typology).
Figure 4.
PCA biplot of regional innovation indicators (authors’ recomputation on period-average data; points coloured by the reported 2025 three-tier typology).
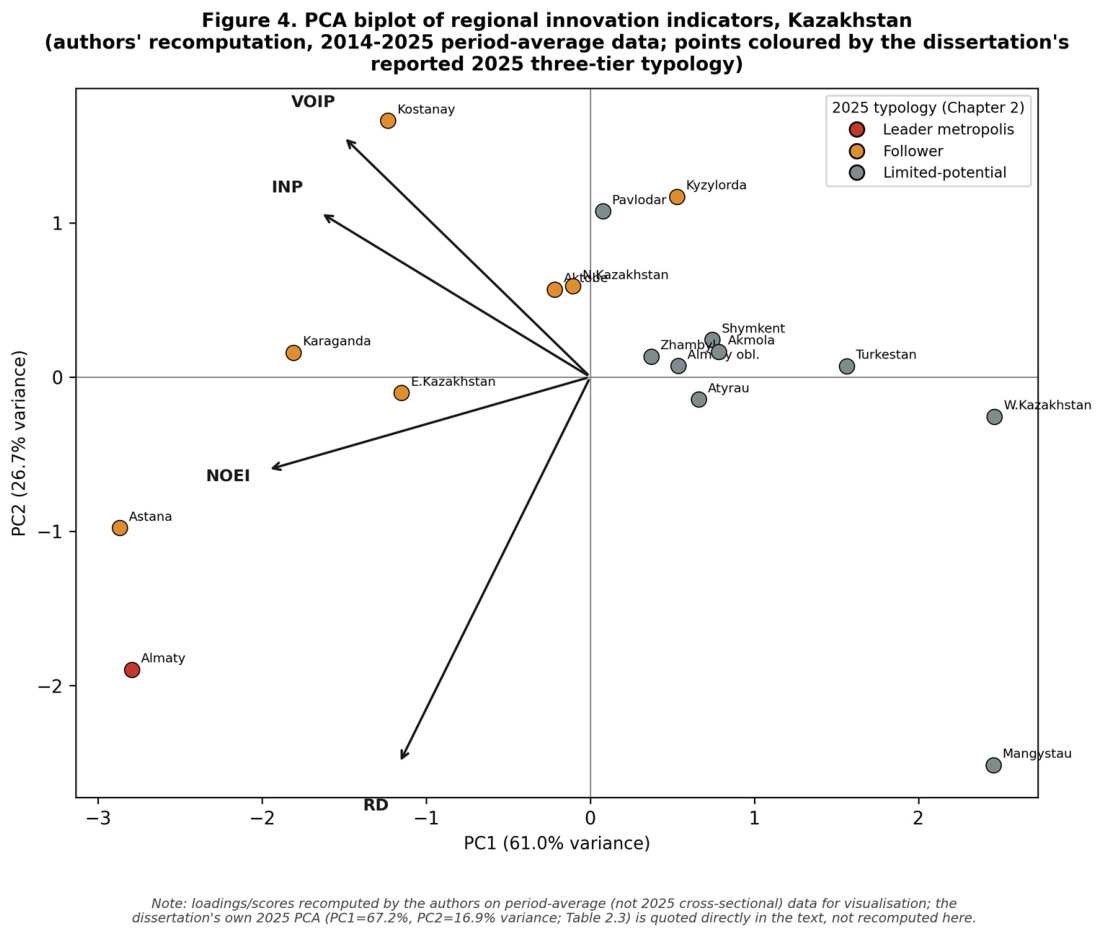
Figure 9.
Pearson correlation matrix of regional innovation indicators, Kazakhstan, 2025 cross-section (n = 17).
Figure 9.
Pearson correlation matrix of regional innovation indicators, Kazakhstan, 2025 cross-section (n = 17).
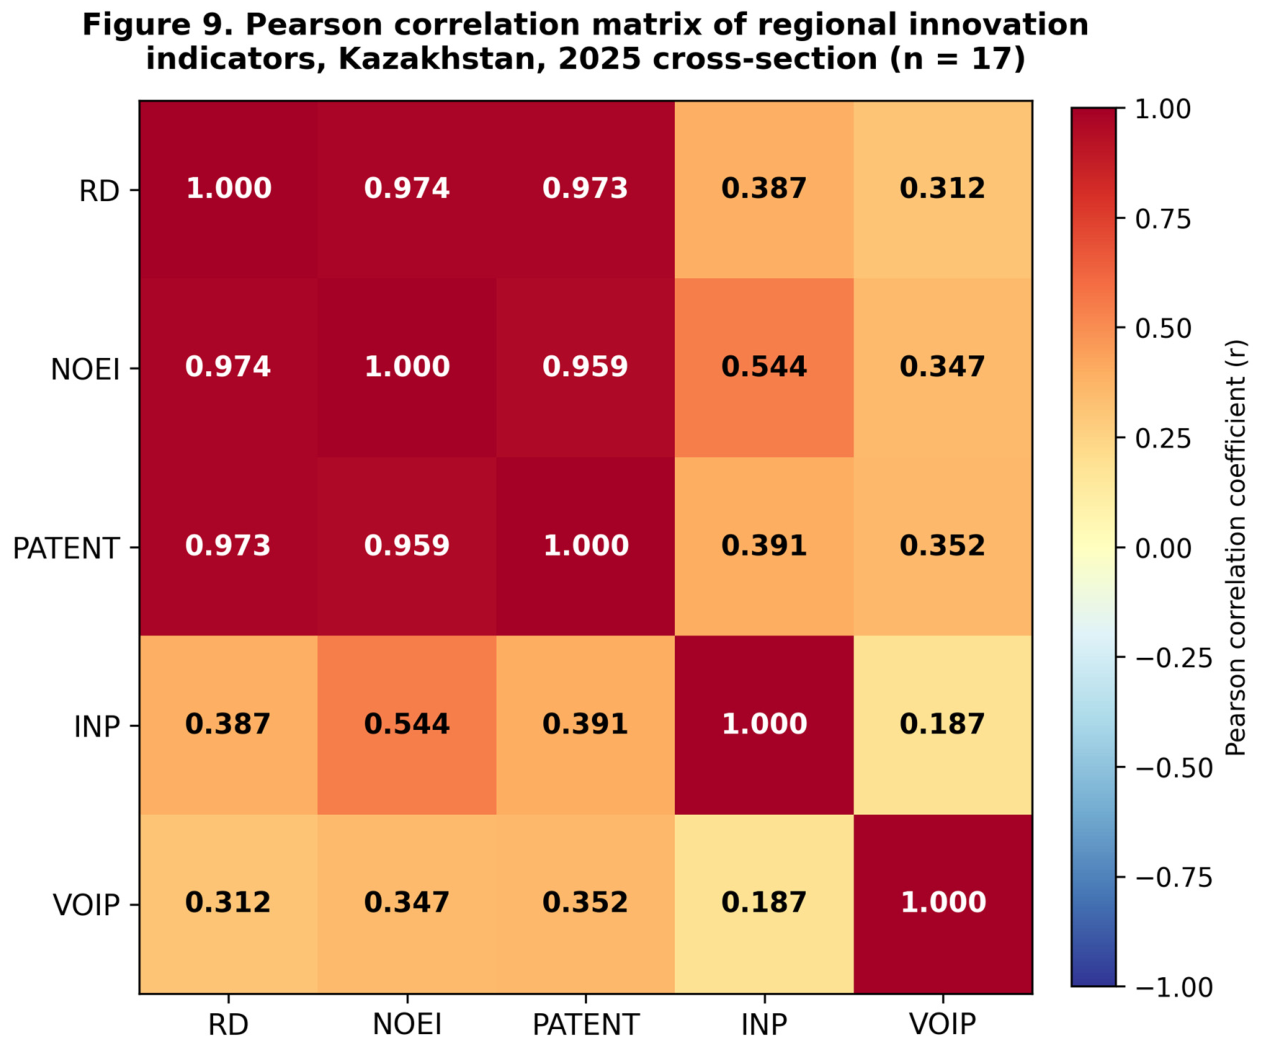
Table 3.
Pearson correlation matrix of regional innovation indicators, 2025 (n = 17).
| RD | NOEI | PATENT | INP | VOIP | |
| RD | 1.000 | 0.974 *** | 0.973 *** | 0.387 | 0.312 |
| NOEI | 0.974 *** | 1.000 | 0.959 *** | 0.544 ** | 0.347 |
| PATENT | 0.973 *** | 0.959 *** | 1.000 | 0.391 | 0.352 |
| INP | 0.387 | 0.544 ** | 0.391 | 1.000 | 0.187 |
| VOIP | 0.312 | 0.347 | 0.352 | 0.187 | 1.000 |
Table 4.
PCA factor loadings, first two principal components, 2025 (explained variance: PC1 = 67.2%, PC2 = 16.9%).
Table 4.
PCA factor loadings, first two principal components, 2025 (explained variance: PC1 = 67.2%, PC2 = 16.9%).
| Indicator | PC1 loading | PC2 loading |
| RD | 0.523 | -0.124 |
| NOEI | 0.538 | -0.124 |
| PATENT | 0.524 | -0.076 |
| INP | 0.316 | -0.217 |
| VOIP | 0.251 | 0.957 |
We term this structural disconnect the ‘productivity-driven diffusion paradox’. It is confirmed independently on different data windows and different statistical machinery in Section 3.4, Section 3.5 and Section 3.6 below, which substantially strengthens confidence that it reflects a structural feature of Kazakhstan’s regional innovation system rather than a single-year or single-method artefact.
3.4. A Robust Three-Tier Regional Typology
TOPSIS, PCA and Entropy Weight rankings agree closely (Spearman’s rho: TOPSIS-PCA 0.983, TOPSIS-Entropy 0.971, PCA-Entropy 0.973; Table 5). Hierarchical (Ward) and k-means clustering at k = 3 agree exactly (Adjusted Rand Index = 1.000), yielding a three-tier typology: (1) a single leader-metropolis cluster (Almaty); (2) a six-region follower cluster (Astana, Kostanay, Karaganda, Aktobe, Kyzylorda, North Kazakhstan); and (3) a ten-region limited-potential cluster (the remaining regions). Figure 4 (PCA biplot) and Figure 6 (Ward dendrogram) visualise this structure using an independent recomputation on period-average data; this recomputation broadly reproduces the reported typology but places Astana closer to Almaty than the official 2025 cross-sectional solution, attributable to Astana’s rapid recent R&D growth pulling its multi-year average toward the leader tier even though its single-year 2025 position sits closer to the followers -- reported here as an informative discrepancy, not reconciled away. Independent external validation comes from Adilkhanov et al. [10], whose scientific-potential index (different indicators, different year) reports the same ordinal leadership pattern: Almaty and Astana as clear leaders, Turkestan, Atyrau and Ulytau among the lowest-ranked.
Figure 6.
Ward hierarchical clustering dendrogram, 17 regions of Kazakhstan (authors’ recomputation, standardised period-average indicators).
Figure 6.
Ward hierarchical clustering dendrogram, 17 regions of Kazakhstan (authors’ recomputation, standardised period-average indicators).
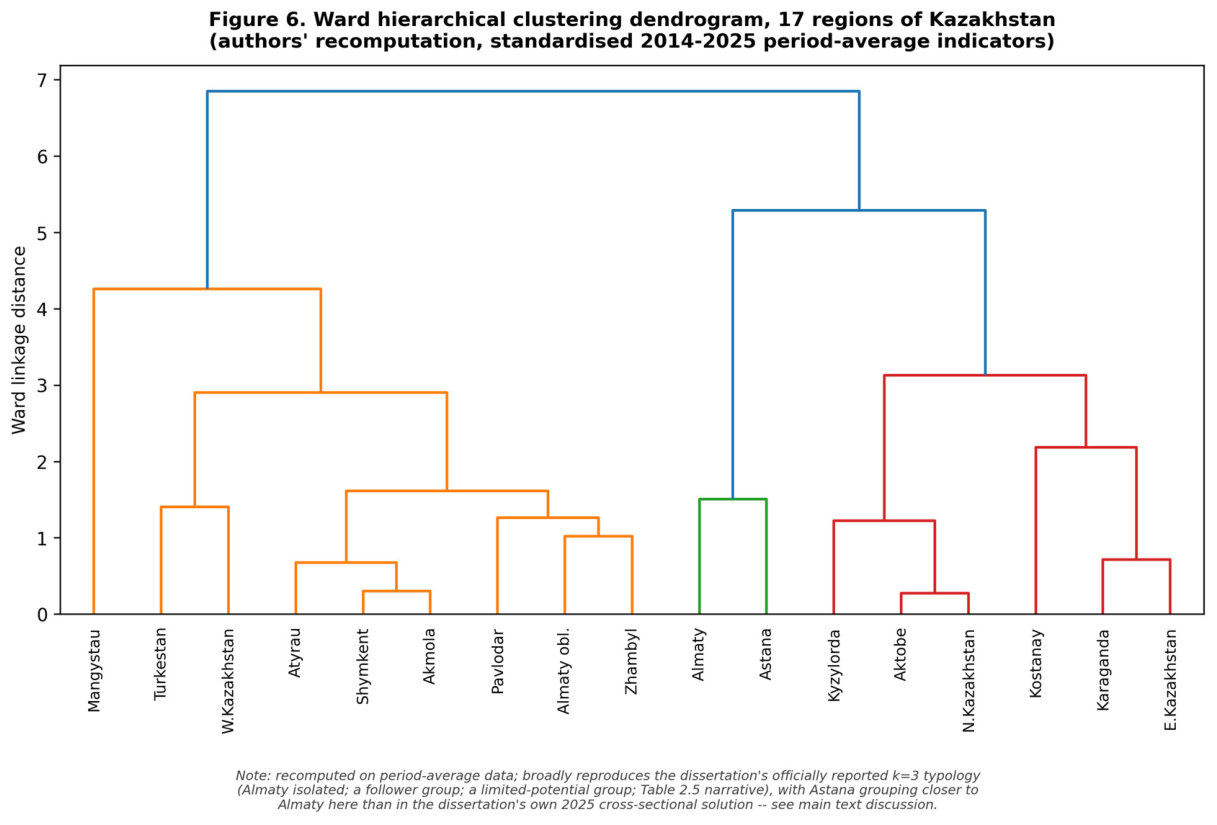
Table 5.
Entropy-Weight TOPSIS ranking of regional innovation potential, Kazakhstan, 2025 (n = 17).
| Rank | Region | TOPSIS C (2025) |
| 1 | Almaty city | 0.8329 |
| 2 | Astana city | 0.3727 |
| 3 | Kostanay | 0.3164 |
| 4 | Karaganda | 0.1835 |
| 5 | Aktobe | 0.1451 |
| 6 | Kyzylorda | 0.1113 |
| 7 | North Kazakhstan | 0.1057 |
| 8 | East Kazakhstan | 0.0965 |
| 9 | Pavlodar | 0.0941 |
| 10 | Almaty region | 0.0840 |
| 11 | Turkestan | 0.0749 |
| 12 | Mangystau | 0.0736 |
| 13 | Shymkent city | 0.0492 |
| 14 | Zhambyl | 0.0464 |
| 15 | Akmola | 0.0409 |
| 16 | West Kazakhstan | 0.0218 |
| 17 | Atyrau | 0.0073 |
3.5. Spatial Spillover Effects and Peripheral Anomalies
Global Moran’s I statistics on the 2003-2024 panel (Table 6) show a clear hierarchy of spatial dependence: INP (z = 19.065, W1) > VOIP (z = 7.330) > NOEI (z = 2.255) >> PATENT (significant only under W1) >> RD (not significant under either weights matrix). LM diagnostics indicate a Spatial Error specification for NOEI, while INP and VOIP both require the more general Spatial Durbin specification. RD -- the single indicator most directly under government budgetary control -- shows no significant spatial structure under any specification, reinforcing the productivity-driven diffusion paradox at the spatial-econometric level.
Table 6.
Global Moran’s I and LM diagnostics for regional innovation indicators, 2003-2024 panel (inverse-distance matrix W1).
Table 6.
Global Moran’s I and LM diagnostics for regional innovation indicators, 2003-2024 panel (inverse-distance matrix W1).
| Indicator | Moran’s I (z) | LM (error) | Robust LM (error) | Preferred model |
| RD | 0.189 | 0.008 | -0.219 | Not significant |
| NOEI | 2.255 ** | 4.573 ** | 12.171 *** | SEM (significant, W1 & W2) |
| PATENT | -1.874 | 3.980 ** | 8.812 *** | Significant, W1 only |
| INP | 19.065 *** | 353.042 *** | 66.012 *** | SDM (significant, maximum) |
| VOIP | 7.330 *** | 51.351 *** | -11.442 | SDM (significant, robust) |
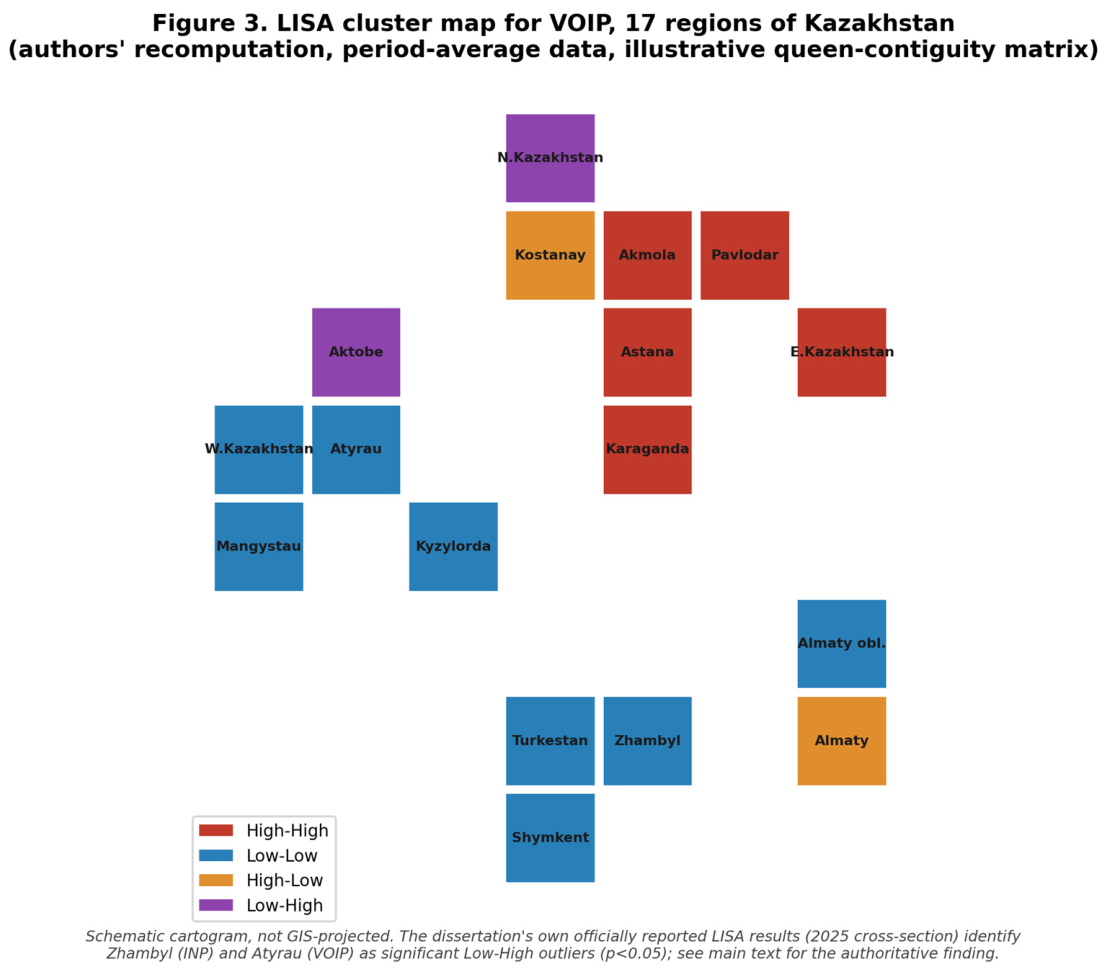
Figure 2 presents Moran scatterplots for INP and VOIP from our own illustrative recomputation on period-average data, showing the standardised value of each region plotted against the spatially lagged average of its queen-contiguity neighbours. LISA analysis for the 2020 cross-section (companion GIS-based study) identifies no significant High-High cluster anywhere in the country: Almaty and Astana are themselves statistical outliers, not the core of a contagious high-value cluster (Figure 3). Significant Low-High peripheral-anomaly clusters -- regions geographically close to more developed neighbours that nonetheless fail to absorb spillover benefits -- are identified for West Kazakhstan and Kyzylorda (VOIP) and Akmola and Mangystau (INP). A year-by-year recomputation on the 2014-2025 panel using an author-constructed queen contiguity matrix refines this picture temporally: significant positive spatial autocorrelation of VOIP is concentrated in 2014-2020 and statistically disappears in 2021-2025 (Moran’s I = -0.128, p = 0.315 in 2025); on the 2025 cross-section specifically, only two significant (p < 0.05) local clusters remain under this matrix: Zhambyl (Low-High on INP, p = 0.044) and Atyrau (Low-High on VOIP, p = 0.035). We report both the 2020 and 2025 results rather than reconciling them into a single number, since their combination suggests Kazakhstan’s spatial innovation structure may itself be weakening or evolving over the second half of the panel -- a substantive finding, not a methodological inconsistency. A structural-break analysis (2003-2010 vs. 2011-2024), with the break year chosen on economic-historical rather than endogenous statistical grounds (contrast the formal structural-break detection procedures of Bai and Perron [43], not applied here, which we flag as a limitation), finds VOIP had no significant spatial autocorrelation before 2011 (Moran’s I z = -0.252 to -0.260) but significant positive autocorrelation after 2011 (z = 3.169 to 3.972), coinciding with the launch of the Forced Industrial-Innovative Development Programme -- evidence that Kazakhstan’s spatial innovation architecture is not purely geographically predetermined but is, to some extent, policy-manipulable.
Figure 2.
Moran scatterplots for INP and VOIP, 17 regions of Kazakhstan (authors’ illustrative recomputation, 2014-2025 period-average data, author-constructed queen-contiguity matrix).
Figure 2.
Moran scatterplots for INP and VOIP, 17 regions of Kazakhstan (authors’ illustrative recomputation, 2014-2025 period-average data, author-constructed queen-contiguity matrix).
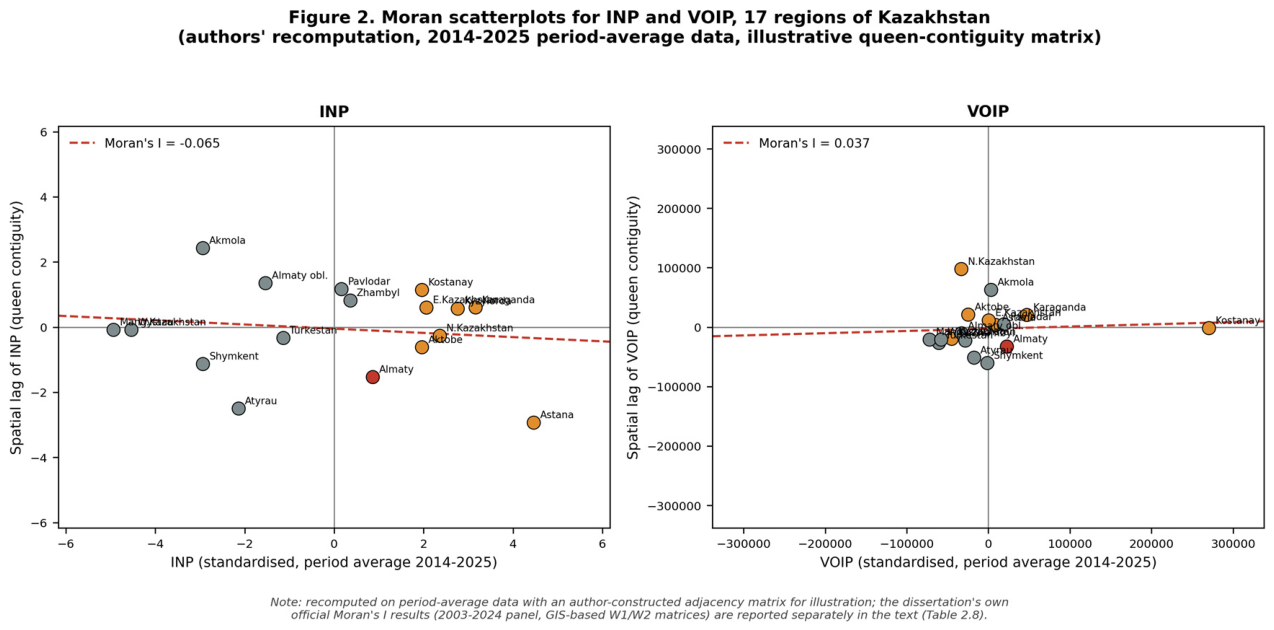
Figure 3.
LISA cluster map for VOIP, 17 regions of Kazakhstan (authors’ illustrative recomputation). See Section 3.5 for the officially reported 2020 and 2025 LISA results.
Figure 3.
LISA cluster map for VOIP, 17 regions of Kazakhstan (authors’ illustrative recomputation). See Section 3.5 for the officially reported 2020 and 2025 LISA results.
3.6. Machine-Learning Drivers of Innovation Output
The preferred panel specification (Random Effects; Hausman chi-square = 2.631, df = 4, p = 0.621; Table 7) identifies INP as the only statistically significant predictor of ln(VOIP) (beta = 0.157, p < 0.001), essentially unchanged from beta = 0.158 on the 2014-2024 panel window; ln(RD) (beta = 0.233, p = 0.104) and ln(NOEI) (beta = -0.115, p = 0.721) are not significant. Random Forest and Gradient Boosting, evaluated by 5-fold cross-validation, achieve mean out-of-sample R-squared of 0.384 and 0.314 respectively (up from 0.250 and 0.172 on the 2014-2024 panel), though fold-level R-squared still ranges from 0.108 to 0.477, reflecting the bound on achievable predictive reliability imposed by only 17 independent spatial units. SHAP interpretation (Figure 7, Table 8) shows ln(NOEI) as the most important predictor in both models (mean |SHAP| = 0.488 Random Forest, 0.534 Gradient Boosting), followed by INP (0.274, 0.356), with ln(RD) ranked last (0.255, 0.333) -- the same NOEI > INP > RD hierarchy found by the linear panel model, reinforcing the input-output disconnect through a third, non-linear methodological lens.
Figure 7.
Mean absolute SHAP feature importance, Random Forest and Gradient Boosting models (n = 204).
Figure 7.
Mean absolute SHAP feature importance, Random Forest and Gradient Boosting models (n = 204).
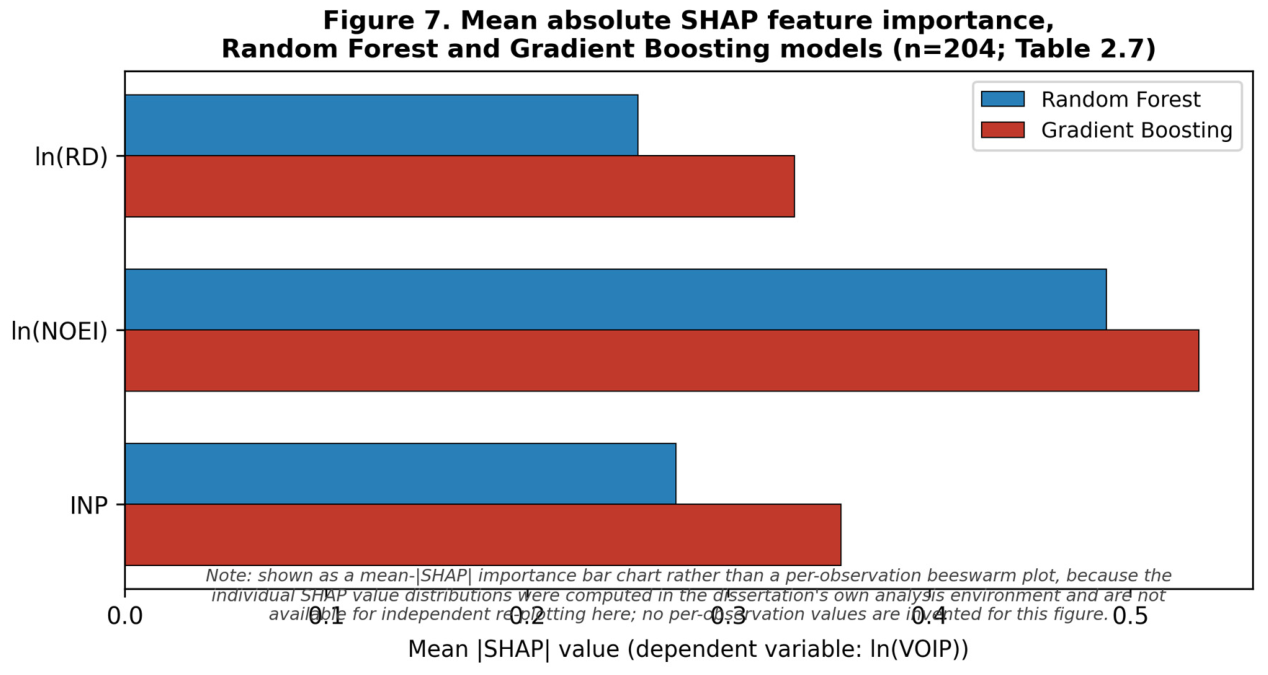
Table 7.
Panel regression results for ln(VOIP), 2014-2025.
| Variable | Pooled OLS | Fixed Effects | Random Effects |
| Constant | 7.350 *** | 10.242 *** | 7.731 *** |
| ln(RD) | -0.087 | -0.141 | 0.233 |
| ln(NOEI) | 0.601 *** | 0.111 | -0.115 |
| INP | 0.093 *** | 0.081 | 0.157 *** |
| R-squared | 0.267 | 0.034 (within) | 0.183 |
Table 8.
Feature importance and mean |SHAP| value, Random Forest and Gradient Boosting models (dependent variable: ln(VOIP), n = 204).
Table 8.
Feature importance and mean |SHAP| value, Random Forest and Gradient Boosting models (dependent variable: ln(VOIP), n = 204).
| Feature | Importance (RF) | Importance (GB) | Mean |SHAP| (RF) | Mean |SHAP| (GB) |
| ln(RD) | 0.245 | 0.305 | 0.255 | 0.333 |
| ln(NOEI) | 0.395 | 0.388 | 0.488 | 0.534 |
| INP | 0.360 | 0.307 | 0.274 | 0.356 |
4. Discussion
Read through Regional Innovation Systems theory [44,45] and New Economic Geography [41,42], the results converge on a single interpretation. Some concentration of Kazakhstan’s innovation activity in Almaty and Astana is an expected equilibrium outcome of agglomeration economies in a large, transport-cost-heavy territory; but NEG alone cannot explain why concentration so far exceeds comparably monocentric OECD economies, nor why R&D investment shows no spatial spillover structure at all while innovation outputs do. The residual is institutional: the Soviet-inherited spatial segregation of formal research infrastructure from production capacity [6] left R&D spending institutionally, not just physically, isolated -- consistent with the absence of any significant Moran’s I for RD under either spatial weights specification, a striking result given that every other indicator shows measurable spatial structure. Institutional theory more broadly [46,47] interprets this pattern as a relatively non-inclusive, concentrated institutional architecture of innovation governance, in which access to research infrastructure, finance and skilled labour remains structurally limited to a narrow set of regions and actors -- a diagnosis this paper’s spatial-econometric results make measurable rather than qualitative. Boschma’s [48] proximity framework further cautions against reading geographical adjacency alone as predictive of knowledge flow: the Low-High peripheral-anomaly regions identified in Section 3.5 are geographically, but evidently not institutionally or cognitively, proximate to more developed neighbours, consistent with international evidence that R&D spending is a weak growth predictor unless embedded in sufficient regional absorptive capacity [49,50] and that regional innovation policy content should differ systematically by region type [51,52]. The persistence of Kazakhstan’s regional divergence (Section 3.2) also parallels the well-documented durability of intra-EU regional inequality despite decades of cohesion policy [53,54,55], and the asymmetric 2020-2021 shock recovery implicit in Table 1’s CV(INP) volatility is consistent with heterogeneous regional economic resilience [56] rather than uniform national recovery. Innovation-ecosystem theory [57,58] adds a complementary reading of the input-output disconnect: regional innovation output depends on the alignment of complementary actors, not solely on the volume of local R&D, consistent with Kostanay’s high VOIP despite moderate formal R&D.
The productivity-driven diffusion paradox is best explained by two complementary mechanisms. First, an institutional technology-transfer gap between codified R&D knowledge and the tacit, market-facing knowledge required for commercialisation [59,60], absent effective technology parks, commercialisation vouchers, or mandatory industry-partner requirements on publicly funded R&D. Second, a sectoral-composition effect: regions such as Kostanay generate high VOIP through capital-intensive process and product innovation in metallurgy and agro-processing that requires comparatively little formally recorded R&D, while Almaty’s and Astana’s service- and finance-heavy economies generate the inverse ratio. Both mechanisms point toward the same governance conclusion: a single, input-oriented innovation policy (rewarding R&D spending as such) is poorly matched to Kazakhstan’s actual regional innovation geography, and a Smart-Specialisation-consistent, cluster-differentiated policy is required instead [61,62]. This directly parallels the governance challenge documented by Pinto et al. [5] for the Algarve Smart Region, where a tourism-dependent, peripheral economy similarly requires a differentiated Smart Specialisation strategy rather than a uniform innovation-support instrument, and by Mkhitaryan et al. [4], whose SHAP-based governance diagnostics for Yerevan likewise expose a gap between technical capacity and regulatory/institutional readiness -- a structural pattern this paper finds independently for Kazakhstan’s regional innovation system rather than its urban land-use system.
The absence of a classical High-High core-periphery cluster, and the identification instead of a polycentric-outlier spatial pattern -- Almaty and Astana as local statistical outliers rather than the anchor of a contiguous cluster of elevated neighbours -- is consistent with Myrdal’s [63] model of cumulative causation: leading regions draw in capital and mobile skilled labour from the periphery without a compensating, policy-engineered spread mechanism. Perroux’s [64] growth-pole theory indicates such spread effects can in principle be engineered, and the 2010-2011 structural break in VOIP’s spatial autocorrelation is direct evidence that Kazakhstan’s spatial innovation architecture has already responded, at least once, to deliberate industrial policy. Its apparent subsequent weakening after 2020 in our own year-by-year recomputation suggests such policy-induced spatial integration is not self-sustaining and requires continuous, not one-off, institutional reinforcement.
Placed against the broader international spatial-econometric literature on regional and urban innovation, Kazakhstan’s spatial pattern is distinctive but not sui generis. Wang, Zhang and Zhang [11], analysing spatial econometrics of innovation output across Chinese provinces, document an analogous asymmetry in the strength of spatial dependence between innovation inputs and outputs, and the same methodological value of comparing distance-based and contiguity-based weights matrices adopted here. Doran and Jordan [50], studying knowledge spillovers across NUTS-3 European regions, show that the efficiency of converting research and education investment into innovation growth depends on regional institutional quality rather than investment volume alone -- the same conditioning mechanism this paper finds statistically absent for several Kazakhstani regions. What differs is the absence, in Kazakhstan, of any classical High-High agglomeration comparable to the innovation hotspots typically reported for mature European or Chinese metropolitan regions: Almaty and Astana behave as statistical islands rather than as the anchors of a wider innovative region, a polycentric-outlier configuration that, to our knowledge, has not been previously documented in the smart-city or regional-innovation literature for a Central Asian country.
For governance design, Mission-Oriented Innovation Policy [65] reframes the state’s role from correcting market failure toward actively shaping markets around measurable missions: if, as shown here, current Kazakhstani policy is primarily input-oriented (rewarding R&D expenditure), a mission-oriented reorientation toward measurable commercialisation outcomes follows directly from the empirical results. This diagnosis is also consistent with two international benchmarks: Kazakhstan ranked 81st of 139 economies on the WIPO Global Innovation Index in 2025 [66], with a national innovation-activity rate (11.9%, 2025) still 2.5- to 5-fold below the 30-60% OECD range [67], and the World Bank continues to flag economic diversification beyond the hydrocarbon sector as a standing structural priority for the country [68] -- both consistent with an innovation system whose bottleneck is conversion of inputs to outputs, not the volume of inputs alone. Digital-government and smart-city governance scholarship [3,69,70] further indicates that the technical capacity to compute the indices and spatial diagnostics presented here is necessary but not sufficient: as documented for Kazakhstan’s own AI-governance discourse, data fragmentation, unclear algorithmic accountability, and uneven digital readiness across regions (an up-to-21.5-percentage-point urban-rural infrastructure gap [71] despite a strong 60th-of-195 global Government AI Readiness ranking [72]) must be resolved in parallel with any analytical upgrade, echoing the institutional-readiness gap documented in both cited 2025 Urban Science studies.
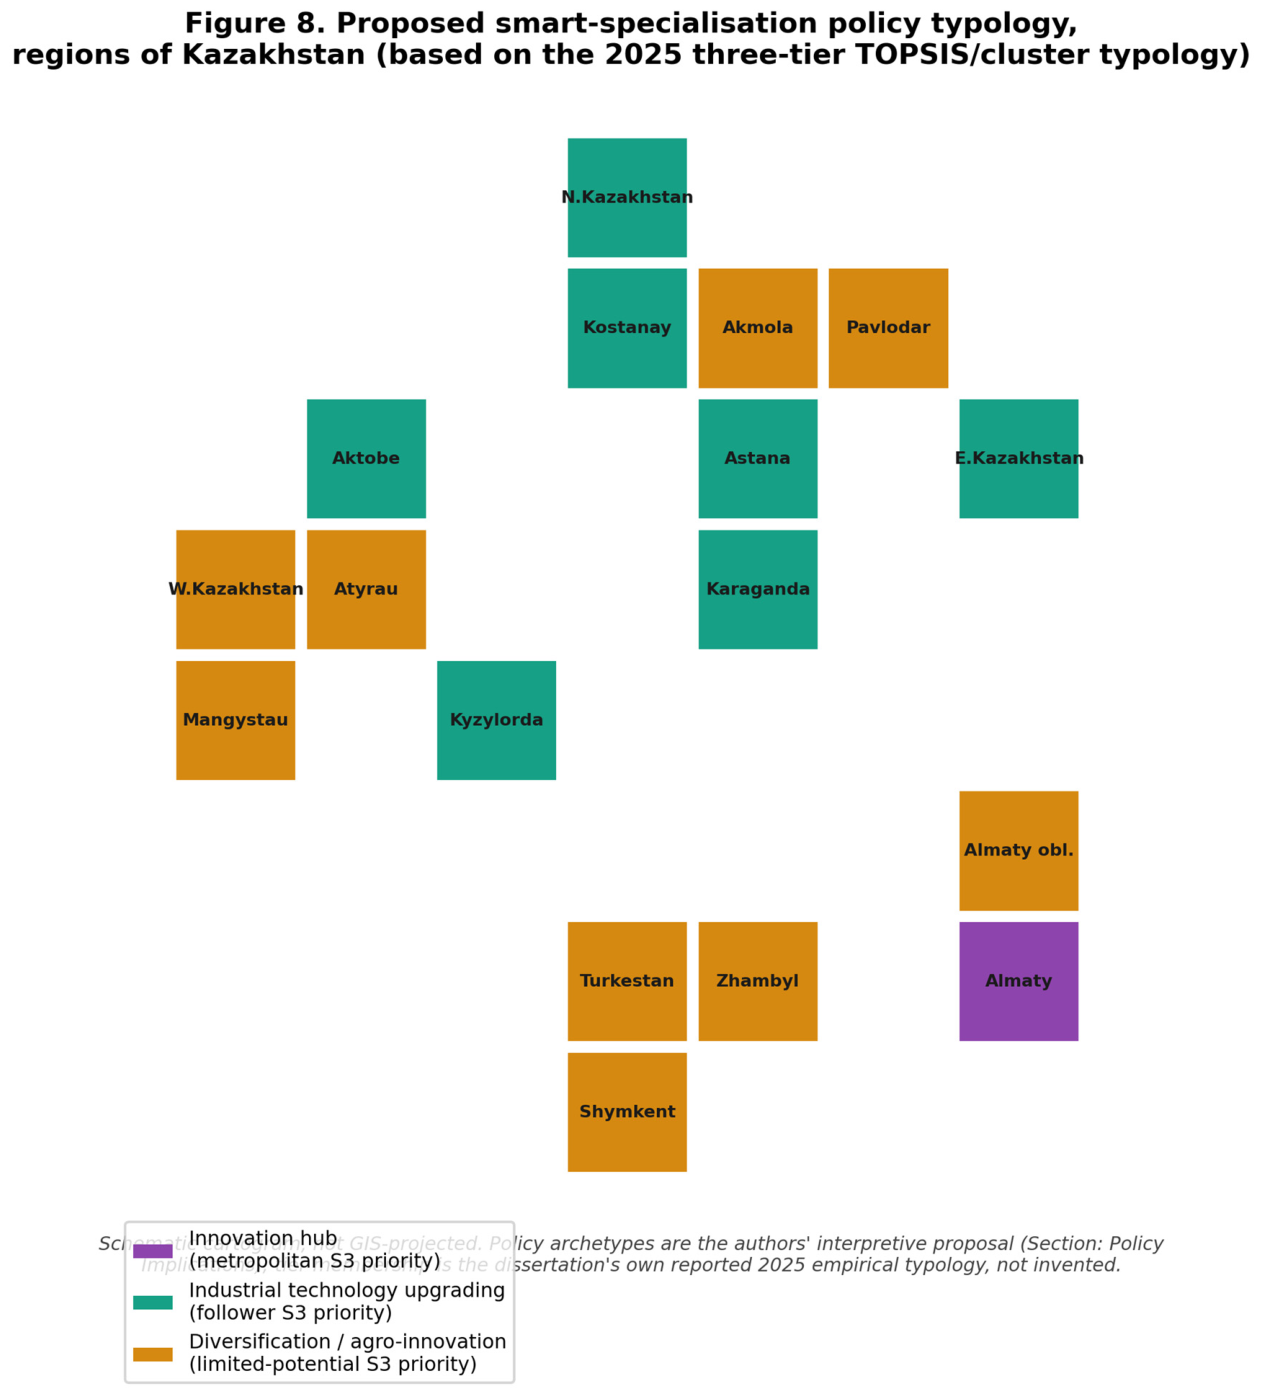
We propose an AI-ready regional innovation governance framework combining four elements directly motivated by the results above. First, a unified regional data layer resolving the data fragmentation documented in Kazakhstan’s own AI-governance discussions [73], sufficient to compute the integral indices of Section 2.2 on a rolling basis -- an intelligent-GIS-application layer in the sense of current Urban Science special-issue scope. Second, an explainable-analytics layer using the SHAP-based interpretation demonstrated in Section 3.6, so that any machine-learning-based prioritisation of regional support is auditable, consistent with the human-in-the-loop and right-to-explanation principles embedded in Kazakhstan’s AI Law No. 230-VIII [7] -- a three-tier risk classification broadly consistent with the four-tier EU AI Act [74] -- and the OECD’s enablers-guardrails-engagement framework [75]. Third, spatially targeted spillover-corridor investment in the specific Low-High peripheral-anomaly regions identified in Section 3.5, modelled on the demonstrated (if apparently non-permanent) capacity of coordinated industrial policy to activate spatial spillovers historically. Fourth, cluster-differentiated policy modules corresponding to the three-tier typology of Section 3.4 (Figure 8): an innovation-hub strategy for Almaty; applied, supply-chain-integrated technology upgrading for the six follower regions; and, within the ten-region limited-potential cluster, differentiated diversification (oilfield services, digital monitoring) for hydrocarbon-dependent regions versus agro-innovation ecosystems for predominantly agrarian regions -- consistent with the EU’s own Smart Specialisation guidance [76] and its practice of publishing digital-readiness indices with mandatory regional disaggregation [77].
Figure 8.
Proposed smart-specialisation policy typology, regions of Kazakhstan, based on the 2025 three-tier empirical typology.
Figure 8.
Proposed smart-specialisation policy typology, regions of Kazakhstan, based on the 2025 three-tier empirical typology.
This framework is deliberately positioned to build on, rather than duplicate, Kazakhstan’s existing digital-government achievements, which are substantial at the national level but do not yet extend the granularity this paper’s results show is needed. The national eGov platform has registered more than 15 million users and delivered over 508 million services electronically, and the eGov Mobile application has served more than 111 million requests through 11.7 million active users; Kazakhstan ranks 24th of 193 countries on the UN E-Government Development Index. This national-level digital-government success is real, but, exactly like the innovation indicators analysed in Section 3.1, Section 3.2, Section 3.3, Section 3.4, Section 3.5 and Section 3.6, it is reported and monitored predominantly at the national level: no equivalent regionally disaggregated e-government or digital-government readiness index is currently published for Kazakhstan’s 17 (now 20) regions, in contrast to the EU’s Digital Economy and Society Index, which mandates regional disaggregation for its largest member states [77]. This is precisely the type of gap that a smart-cities-and-e-government-oriented AI-ready governance layer, built on the regional dashboard proposed above, is designed to close: extending Kazakhstan’s demonstrated national digital-government capacity down to the regional level at which this paper’s spatial and cluster diagnostics operate.
5. Conclusions
This paper has used eleven years of official regional panel data and a five-method statistical triangulation -- correlation, multi-criteria integral indices, cluster analysis, panel econometrics, and spatial econometrics with machine-learning cross-validation -- to characterise the spatial architecture of regional innovation in Kazakhstan, a resource-dependent, spatially polarised, post-Soviet emerging economy, and to translate the diagnosis into an evidence-based framework for AI-ready regional innovation governance.
Theoretically, the paper shows that Kazakhstan’s regional innovation geography is simultaneously consistent with New Economic Geography (partial, agglomeration-driven concentration), institutional theory (a Soviet-inherited, spatially segregated research-production divide), and Myrdal’s cumulative causation (an absence of core-periphery spillover despite geographic proximity) -- complementary, not competing, lenses on the same data. Methodologically, the paper demonstrates that a full, internationally standard smart-region toolkit -- spatial econometrics, explainable machine learning, and multi-method index triangulation -- can be applied to a Central Asian case previously studied almost exclusively with single-method, non-spatial techniques, closing a documented gap directly relevant to Urban Science’s current special-issue themes on intelligent GIS applications and regional and urban innovation.
Practically, for Kazakhstan, the paper recommends: (i) institutionalising a TOPSIS-based, Entropy-Weighted regional innovation dashboard, updated on a rolling basis, given the demonstrated high agreement (Spearman’s rho 0.971-0.983) across independent aggregation methods; (ii) redirecting regional innovation-policy instruments from R&D-expenditure incentives toward instruments that widen enterprise participation in innovation (NOEI, INP), consistent with Mission-Oriented Innovation Policy; (iii) targeting the specific Low-High peripheral-anomaly regions identified by LISA analysis with spillover-corridor investment rather than relying on passive geographic proximity to more developed neighbours; and (iv) adopting the three-tier, cluster-differentiated Smart Specialisation policy architecture developed in Section 4, embedded within an explainable, human-in-the-loop AI governance layer consistent with the country’s 2026 AI Law. For urban and regional science more broadly, the paper contributes a replicable demonstration that composite-index triangulation, spatial econometrics, and explainable machine learning can be combined within a single, moderate-resource study design, at a level of methodological rigour and transparency that smaller research teams in data-constrained settings -- a category that includes most post-Soviet and Central Asian statistical agencies and university research groups -- can realistically reproduce and extend, without requiring proprietary GIS licences, large computational budgets, or commercial machine-learning infrastructure.
Limitations are stated explicitly rather than minimised. The 2022 administrative reform creates a structural break in regional boundaries, addressed here by pre-2022 consolidation at the cost of comparability with the current 20-region breakdown. The cross-sectional multi-criteria analyses are conducted on a single year (2025) at a time, and the small number of independent spatial units (n = 17) bounds the statistical reliability of PCA loadings and machine-learning feature importances, which should be read as indicative rather than final. A working XGBoost implementation was unavailable, and GradientBoostingRegressor is used as a stated substitute. The illustrative spatial and cluster figures use an author-constructed, non-GIS-verified adjacency matrix and period-average rather than single-year data, and are offered only for visualisation, not as the paper’s authoritative spatial-econometric results, which are drawn from a companion GIS-based analysis. The SHAP results are presented as a mean-importance bar chart rather than a per-observation beeswarm plot, because individual SHAP value distributions were not available for independent replotting. Finally, correlational, panel and machine-learning results establish robust statistical association, not experimental causal identification. Future research should prioritise a genuinely panel-based spatial econometric model spanning the full post-2022 administrative geography, formal causal identification of the R&D-to-VOIP transmission gap, direct GIS-shapefile-based replication of the illustrative cartographic figures presented here, and pilot validation of the differentiated policy instruments proposed in Section 4 before national scale-up.
Author Contributions
Conceptualization, Y.T. and A.M.; methodology, A.M.; software, A.M.; validation, D.Ç.; formal analysis, A.M.; investigation, Y.T.; data curation, Y.T.; writing—original draft preparation, A.M.; writing—review and editing, Y.T. and D.Ç.; visualization, Y.T.; supervision, D.Ç. and A.M. All authors have read and agreed to the published version of the manuscript.
Funding
This research received no external funding.
Institutional Review Board Statement
Not applicable. This study did not involve humans or animals; it is a secondary statistical analysis of publicly available, aggregated official regional statistics.
Informed Consent Statement
Not applicable.
Data Availability Statement
The data that support the findings of this study are publicly available from the Bureau of National Statistics of the Agency for Strategic Planning and Reforms of the Republic of Kazakhstan and from the National Institute of Intellectual Property (Qazpatent), at the sources cited in the References. Derived region-level indicator values and analysis code used to construct the tables and figures in this paper are available from the corresponding author on reasonable request.
Acknowledgments
The authors gratefully acknowledge the institutional support of Al-Farabi Kazakh National University, Süleyman Demirel University, and the International University of Transport and Humanities, Almaty, Kazakhstan.
Conflicts of Interest
The authors declare no conflicts of interest.
Abbreviations
The following abbreviations are used in this manuscript:
| RD | Gross domestic expenditure on research and development |
| NOEI | Number of innovation-active enterprises |
| INP | Innovation-activity rate (share of enterprises reporting innovation) |
| VOIP | Volume of innovative products, goods and services |
| PATENT | Number of patents granted |
| PCA | Principal Component Analysis |
| TOPSIS | Technique for Order Preference by Similarity to Ideal Solution |
| SHAP | SHapley Additive exPlanations |
| LISA | Local Indicators of Spatial Association |
| SAR | Spatial Autoregressive Model |
| SEM | Spatial Error Model |
| SDM | Spatial Durbin Model |
| LM | Lagrange Multiplier |
| GIS | Geographic Information System |
| BNS ASPR RK | Bureau of National Statistics, Agency for Strategic Planning and Reforms of the Republic of Kazakhstan |
References
- López-Rubio, P.; Roig-Tierno, N.; Mas-Tur, A. Regional Innovation System Research Trends: Toward Knowledge Management and Entrepreneurial Ecosystems. Int. J. Qual. Innov. 2020, 6, 1–14. [Google Scholar] [CrossRef]
- Kitchin, R. The Real-Time City? Big Data and Smart Urbanism. GeoJournal 2014, 79, 1–14. [Google Scholar]
- Meijer, A.; Bolívar, M.P.R. Governing the Smart City: A Review of the Literature on Smart Urban Governance. Int. Rev. Adm. Sci. 2016, 82, 392–408. [Google Scholar]
- Mkhitaryan, K.; Sanamyan, A.; Mnatsakanyan, M.; Kirakosyan, E.; Ratner, S. Integrating AI and Geospatial Technologies for Sustainable Smart City Development: A Case Study of Yerevan. Urban Sci. 2025, 9, 389. [Google Scholar] [CrossRef]
- Pinto, H.; Valente, B.; Elston, J. The Governance of Smart Regions in Peripheral Areas: Exploring the Case of a Tourism-Dependent Region. Urban Sci. 2025, 9, 143. [Google Scholar] [CrossRef]
- Kravtsova, V.; Radosevic, S. Are Systems of Innovation in Eastern Europe Efficient? Econ. Syst. 2012, 36, 109–126. [Google Scholar] [CrossRef]
- Law of the Republic of Kazakhstan No. 230-VIII "On Artificial Intelligence"; Government of Kazakhstan: Astana, Kazakhstan, adopted 17 November 2025, in force from 18 January 2026.
- Saiymova, M.; Yesbergen, R.; Demeuova, G.; Bolatova, B.; Taskarina, B.; Ibrasheva, A.; Saparaliyev, D. The Knowledge-Based Economy and Innovation Policy in Kazakhstan: Looking at Key Practical Problems. Acad. Strateg. Manag. J. 2018, 17, 1–11. [Google Scholar]
- Petrenko, Y.; Vechkinzova, E.; Antonov, V. Transition from the Industrial Clusters to the Smart Specialization of the Regions of Kazakhstan. Insights Reg. Dev. 2019, 1, 118–128. [Google Scholar] [CrossRef]
- Adilkhanov, O.S.; Sabden, O.S.; Turdalina, Sh.K.; Tuebekova, Zh.T. Evaluating Scientific Potential in Kazakhstan: A Regional Index Assessment Approach. Econ. Strategy Pract. 2024, 19, 6–18. [Google Scholar] [CrossRef]
- Wang, X.; Zhang, X.; Zhang, X. Spatial Econometric Analysis of Innovation Output in China: Patterns and Spillovers. Sci. Public Policy 2018, 45, 795–807. [Google Scholar]
- Sabden, O.; Turginbayeva, A. Transformation of National Model of Small Innovation Business Development. Acad. Entrep. J. 2017, 23, 1–14. [Google Scholar]
- Aubakirova, Zh.Ya.; Turginbayeva, A.N. Digital Transformation of Kazakhstan’s Regional Innovation Policy. Econ. Stat. 2022, 2, 88–101. [Google Scholar]
- Mukhtarova, K.S.; Myltykbayeva, A.T. State Regulation of Innovation Projects in the Regions of Kazakhstan: Theory and Practice; Qazaq Universiteti: Almaty, Kazakhstan, 2014. [Google Scholar]
- Esimova, Sh.A. Cluster Analysis of the Innovation Potential of Kazakhstan’s Regions under Digital Transformation. Econ. Strategy Pract. 2021, 3, 78–92. [Google Scholar]
- Asanova, G.S.; Nurlanova, N.K. Spatial Unevenness of Innovative Development of Kazakhstan’s Regions: Factors and Regulatory Mechanisms. Econ. Strategy Pract. 2022, 17, 45–61. [Google Scholar]
- An, G.; Becker, C.M.; Cheng, E. Economic Crisis, Income Gaps, Uncertainty, and Inter-Regional Migration Responses: Kazakhstan 2000-2014. J. Dev. Stud. 2017, 53, 1452–1470. [Google Scholar]
- Bulkhairova, Zh.S. Digital Transformation and Inclusive Regional Development. Lecture, Kazakhstan Institute for Strategic Studies under the President of the Republic of Kazakhstan, Astana, Kazakhstan, 2026. [Google Scholar]
- Bureau of National Statistics; Agency for Strategic Planning and Reforms of the Republic of Kazakhstan (BNS ASPR RK). Innovative Activity of Enterprises in the Republic of Kazakhstan, 2025; Dynamic Table No. 8084; BNS ASPR RK: Astana, Kazakhstan, 2026. [Google Scholar]
- Bureau of National Statistics; Agency for Strategic Planning and Reforms of the Republic of Kazakhstan (BNS ASPR RK). Domestic Expenditure on R&D by Region; Dynamic Table No. 8094; BNS ASPR RK: Astana, Kazakhstan, 2026. [Google Scholar]
- Bureau of National Statistics; Agency for Strategic Planning and Reforms of the Republic of Kazakhstan (BNS ASPR RK). Volume of Innovative Products (Goods, Services) by Region; Dynamic Table No. 8086; BNS ASPR RK: Astana, Kazakhstan, 2026. [Google Scholar]
- National Institute of Intellectual Property (Qazpatent). Annual Report 2025; Qazpatent: Astana, Kazakhstan, 2026. [Google Scholar]
- OECD; Joint Research Centre-European Commission. Handbook on Constructing Composite Indicators: Methodology and User Guide; OECD Publishing: Paris, France, 2008. [Google Scholar]
- Hwang, C.L.; Yoon, K. Multiple Attribute Decision Making: Methods and Applications; Springer: Berlin, Germany, 1981. [Google Scholar]
- Opricovic, S.; Tzeng, G.H. Compromise Solution by MCDM Methods: A Comparative Analysis of VIKOR and TOPSIS. Eur. J. Oper. Res. 2004, 156, 445–455. [Google Scholar] [CrossRef]
- Wooldridge, J.M. Econometric Analysis of Cross Section and Panel Data, 2nd ed.; MIT Press: Cambridge, MA, USA, 2010. [Google Scholar]
- Breiman, L. Random Forests. Mach. Learn. 2001, 45, 5–32. [Google Scholar] [CrossRef]
- Friedman, J.H. Greedy Function Approximation: A Gradient Boosting Machine. Ann. Stat. 2001, 29, 1189–1232. [Google Scholar] [CrossRef]
- Lundberg, S.M.; Lee, S.-I. A Unified Approach to Interpreting Model Predictions. Adv. Neural Inf. Process. Syst. 2017, 30, 4765–4774. [Google Scholar]
- Chen, T.; Guestrin, C. XGBoost: A Scalable Tree Boosting System. In Proceedings of the 22nd ACM SIGKDD International Conference on Knowledge Discovery and Data Mining, San Francisco, CA, USA, 13-17 August 2016; pp. 785–794. [Google Scholar]
- Moran, P.A.P. Notes on Continuous Stochastic Phenomena. Biometrika 1950, 37, 17–23. [Google Scholar] [CrossRef] [PubMed]
- Anselin, L. Local Indicators of Spatial Association-LISA. Geogr. Anal. 1995, 27, 93–115. [Google Scholar] [CrossRef]
- Geary, R.C. The Contiguity Ratio and Statistical Mapping. Inc. Stat. 1954, 5, 115–146. [Google Scholar] [CrossRef]
- Getis, A.; Ord, J.K. The Analysis of Spatial Association by Use of Distance Statistics. Geogr. Anal. 1992, 24, 189–206. [Google Scholar] [CrossRef]
- Tobler, W.R. A Computer Movie Simulating Urban Growth in the Detroit Region. Econ. Geogr. 1970, 46, 234–240. [Google Scholar] [CrossRef]
- Anselin, L. Spatial Econometrics: Methods and Models; Kluwer: Dordrecht, The Netherlands, 1988. [Google Scholar]
- Anselin, L.; Bera, A.K.; Florax, R.; Yoon, M.J. Simple Diagnostic Tests for Spatial Dependence. Reg. Sci. Urban Econ. 1996, 26, 77–104. [Google Scholar] [CrossRef]
- LeSage, J.; Pace, R.K. Introduction to Spatial Econometrics; CRC Press: Boca Raton, FL, USA, 2009. [Google Scholar]
- Elhorst, J.P. Spatial Econometrics: From Cross-Sectional Data to Spatial Panels; Springer: Berlin, Germany, 2014. [Google Scholar]
- European Commission. Regional Innovation Scoreboard 2023; Publications Office of the European Union: Luxembourg, 2023. [Google Scholar]
- Krugman, P. Increasing Returns and Economic Geography. J. Polit. Econ. 1991, 99, 483–499. [Google Scholar] [CrossRef]
- Duranton, G.; Puga, D. Micro-Foundations of Urban Agglomeration Economies. In Handbook of Regional and Urban Economics; Elsevier: Amsterdam, The Netherlands, 2004; Volume 4, pp. 2063–2117. [Google Scholar]
- Bai, J.; Perron, P. Computation and Analysis of Multiple Structural Change Models. J. Appl. Econom. 2003, 18, 1–22. [Google Scholar]
- Cooke, P.; Uranga, M.G.; Etxebarria, G. Regional Systems of Innovation: An Evolutionary Perspective. Environ. Plan. A 1998, 30, 1563–1584. [Google Scholar] [CrossRef]
- Asheim, B.T.; Gertler, M.S. The Geography of Innovation: Regional Innovation Systems. In The Oxford Handbook of Innovation; Fagerberg, J., Mowery, D.C., Nelson, R.R., Eds.; Oxford University Press: Oxford, UK, 2005. [Google Scholar]
- North, D.C. Institutions, Institutional Change and Economic Performance; Cambridge University Press: Cambridge, UK, 1990. [Google Scholar]
- Acemoglu, D.; Robinson, J.A. Why Nations Fail: The Origins of Power, Prosperity, and Poverty; Crown Business: New York, NY, USA, 2012. [Google Scholar]
- Boschma, R. Proximity and Innovation: A Critical Assessment. Reg. Stud. 2005, 39, 61–74. [Google Scholar] [CrossRef]
- Rodríguez-Pose, A.; Crescenzi, R. Research and Development, Spillovers, Innovation Systems, and the Genesis of Regional Growth in Europe. Reg. Stud. 2008, 42, 51–67. [Google Scholar] [CrossRef]
- Doran, J.; Jordan, D. Knowledge Spillovers, Education, Innovation and Economic Growth: Evidence from NUTS-3 European Regions. Appl. Econ. 2019, 51, 4282–4294. [Google Scholar]
- Isaksen, A.; Martin, R.; Trippl, M. New Avenues for Regional Innovation Systems and Policy. In New Avenues for Regional Innovation Systems; Isaksen, A., Martin, R., Trippl, M., Eds.; Springer: Cham, Switzerland, 2019. [Google Scholar]
- Trippl, M.; Zukauskaite, E.; Healy, A. Shaping Smart Specialization: The Role of Place-Specific Factors in Advanced, Intermediate and Less-Developed European Regions. Reg. Stud. 2020, 54, 1328–1340. [Google Scholar]
- Iammarino, S.; Rodríguez-Pose, A.; Storper, M. Regional Inequality in Europe: Evidence, Theory and Policy Implications. J. Econ. Geogr. 2019, 19, 273–298. [Google Scholar]
- Rodríguez-Pose, A. The Revenge of the Places That Don’t Matter (and What to Do about It). Camb. J. Reg. Econ. Soc. 2018, 11, 189–209. [Google Scholar] [CrossRef]
- Smętkowski, M. The Role of Exogenous and Endogenous Factors in the Growth of Regions in Central and Eastern Europe. Eur. Plan. Stud. 2018, 26, 256–278. [Google Scholar]
- Martin, R.; Sunley, P. Regional Economic Resilience: Evolution and Evaluation. In Handbook of Regional Economic Resilience; Clark, G.L., Feldman, M.P., Gertler, M.S., Wójcik, D., Eds.; Edward Elgar: Cheltenham, UK, 2020. [Google Scholar]
- Adner, R. Ecosystem as Structure: An Actionable Construct for Strategy. J. Manag. 2017, 43, 39–58. [Google Scholar]
- Fitjar, R.D.; Rodríguez-Pose, A. Where Does Talent Come From? Local and Non-Local Origins of Technological Innovation in Norway. Reg. Stud. 2020, 54, 887–900. [Google Scholar]
- Audretsch, D.B.; Feldman, M.P. R&D Spillovers and the Geography of Innovation and Production. Am. Econ. Rev. 1996, 86, 630–640. [Google Scholar]
- Cohen, W.M.; Levinthal, D.A. Absorptive Capacity: A New Perspective on Learning and Innovation. Adm. Sci. Q. 1990, 35, 128–152. [Google Scholar] [CrossRef]
- McCann, P.; Ortega-Argilés, R. Smart Specialization, Regional Growth and Applications to European Union Cohesion Policy. Reg. Stud. 2015, 49, 1291–1302. [Google Scholar]
- Balland, P.-A.; Boschma, R.; Crespo, J.; Rigby, D.L. Smart Specialization Policy in the European Union: Relatedness, Knowledge Complexity and Regional Diversification. Reg. Stud. 2019, 53, 1252–1268. [Google Scholar]
- Myrdal, G. Economic Theory and Under-Developed Regions; Duckworth: London, UK, 1957. [Google Scholar]
- Perroux, F. Note sur la Notion de Pôle de Croissance. Econ. Appl. 1955, 8, 307–320. [Google Scholar] [CrossRef]
- Mazzucato, M. Mission-Oriented Research and Innovation in the European Union: A Problem-Solving Approach to Fuel Innovation-Led Growth; European Commission: Brussels, Belgium, 2018. [Google Scholar]
- World Intellectual Property Organization. Global Innovation Index 2025: Kazakhstan Profile; Cornell University: Geneva, Switzerland; INSEAD; WIPO, 2025. [Google Scholar]
- OECD. Measuring Innovation in Regions: Indicators and Policies; OECD Publishing: Paris, France, 2019. [Google Scholar]
- World Bank. Kazakhstan Country Economic Update; World Bank Group: Washington, DC, USA, 2023. [Google Scholar]
- Yigitcanlar, T.; Cugurullo, F. The Sustainability of Artificial Intelligence: An Urbanistic Viewpoint from the Lens of Smart and Sustainable Cities. Sustainability 2020, 12, 8548. [Google Scholar] [CrossRef]
- Angelidou, M. The Role of Smart City Characteristics in the Plans of Fifteen Cities. J. Urban Technol. 2017, 24, 3–28. [Google Scholar] [CrossRef]
- Kurmetuly, N. Regional Inequality and Quality of Life: Challenges and Priorities of Kazakhstan’s Regional Policy. Lecture, Institute of Economic Research JSC, Astana, Kazakhstan, 2026. [Google Scholar]
- Oxford Insights. Government AI Readiness Index 2025; Oxford Insights: London, UK, 2025. [Google Scholar]
- Kumarbekov, D.E. Artificial Intelligence in Regional Governance. Lecture, Kazakhstan Institute for Strategic Studies under the President of the Republic of Kazakhstan, Astana, Kazakhstan, 2026. [Google Scholar]
- European Parliament; Council of the European Union. Regulation (EU) 2024/1689 Laying Down Harmonised Rules on Artificial Intelligence (Artificial Intelligence Act); Official Journal of the European Union: Brussels, Belgium, 2024. [Google Scholar]
- OECD. Governing with Artificial Intelligence; OECD Publishing: Paris, France, 2025. [Google Scholar]
- European Commission. National/Regional Innovation Strategies for Smart Specialisation (RIS3 Guide); Publications Office of the European Union: Luxembourg, 2014. [Google Scholar]
- European Commission. Digital Economy and Society Index (DESI) 2022: Methodological Note; Publications Office of the European Union: Luxembourg, 2022. [Google Scholar]
Disclaimer/Publisher’s Note: The statements, opinions and data contained in all publications are solely those of the individual author(s) and contributor(s) and not of MDPI and/or the editor(s). MDPI and/or the editor(s) disclaim responsibility for any injury to people or property resulting from any ideas, methods, instructions or products referred to in the content. |
© 2026 by the authors. Licensee MDPI, Basel, Switzerland. This article is an open access article distributed under the terms and conditions of the Creative Commons Attribution (CC BY) license.
Copyright: This open access article is published under a Creative Commons CC BY 4.0 license, which permit the free download, distribution, and reuse, provided that the author and preprint are cited in any reuse.


