

Submitted:
16 July 2026
Posted:
20 July 2026
You are already at the latest version
Abstract
Desmogleins (Dsg) are transmembrane proteins involved in cell-cell junctions. Keratinized epithelia, such as skin, express several forms of Dsg. Dsg4 deficiency is associated with hair loss in humans, mice, and rats. Recently, we reported that topical administration of imiquimod (IMQ) to Dsg4-deficient rats exacerbates skin inflammation. Different immune-mediated diseases, including Psoriasis, Spondyloarthritis, Systemic Lupus Erythematosus, and Atopic Dermatitis, involve skin inflammation. Unfortunately, the role of Dsg4 in the induction of humoral immunity has not been addressed. Our work aimed to determine whether Dsg4 deficiency impairs the induction of an antigen-specific immune response. For this purpose, Dsg4 deficient Oncins France Colony A hairless/hairless (OFA) and wild-type Sprague-Dawley (SD) rats were treated with IMQ, or vaseline, to evaluate lymph node (LN) expansion. We found that OFA rats exhibited higher LN size with histological differences compared to SD rats. Brachial LN expansion after topical IMQ treatment was reduced in OFA rats compared to SD. Surprisingly, when we evaluated the induction of the immune response to intradermal ovoalbumin (OVA) challenge, we observed that OFA rats showed lower levels of OVA-specific IgM, IgG, IgG2a and IgA than the SD group. Although further investigations are necessary, our results suggest a novel role for Dsg4 in supporting humoral immunity under inflammatory conditions.
Keywords:
desmoglein
; immunity
; inflammation
; lymph node
; antibodies
1. Introduction
Desmogleins (Dsg) are desmosome-associated proteins that mediate cell adhesion [1]. They also play roles in epithelial cell differentiation, proliferation and cell signaling [2]. Dsg2 and Dsg3 are mainly expressed in the lower layers of keratinized epithelia, whereas Dsg1 and Dsg4 are expressed in the more differentiated layers of the epithelia [3,4]. Additionally, Dsg4 is strongly linked to hair follicle differentiation, and its deficiency in humans, mice, and rats leads to hair loss [5,6]. Changes in Dsg2 and Dsg3 expression have been reported to promote proliferative dysregulation and abnormal differentiation of keratinocytes, which can compromise tissue integrity [7].
In a recent report by our group, rats with a deficiency in Dsg4 develop severe cutaneous inflammatory lesions with marked histological changes in the skin in response to imiquimod (IMQ) compared to control Sprague Dawley rats [8]. Furthermore, we have reported that RNAseq analysis from Psoriasis (PSO) skin lesions showed decreased DSG4 gene expression compared to Atopic Dermatitis (AD) patients [8]. Lymph nodes (LN) are complex structures with various functions, including the initiation of the adaptive immune response, and may reflect the local inflammatory status [9]. Although there is an extensive literature on the underlying mechanisms of LN biology, the impact of keratinocytes (KC) on the function of the draining LN remains poorly understood. It has been reported that CD40L overexpression on skin basal KC causes continuous stimulation of skin dendritic cells (DCs), spontaneous skin inflammation, T cell infiltration, and extensive LN hyperplasia, along with increased serum IgG levels [10].
Several immune-mediated skin diseases such as PSO, AD, Systemic Lupus Erythematosus, Rheumatoid Arthritis, Dermatopathic Lymphadenitis, Histiocytosis, Spondyloarthritis (SpA), and Atopic Dermatitis (AD) may exhibit alterations in lymphatic vessels and nodes [11,12,13]. Indeed, PSO and SpA share underlying immune mechanisms and are treated with TNF, IL-17 and Janus kinase inhibitors [13,14]. However, it remains unknown whether Dsg4 plays a relevant role in these diseases. Furthermore, whether Dsg4 modulates the induction of adaptive immune responses, or immune tolerance still needs to be addressed. Since skin immune-mediated diseases are prevalent in the population and patients may show alterations in adaptive immune responses, it is important to gain new insights into the underlying mechanisms to develop effective therapies [12,15]. The knowledge of how skin, KC and desmosome components such as Dsg interfere with the immune response remains elusive.
This work aims to identify the role of Dsg4 in initiating adaptive immune responses in the skin and to assess its impact on lymph nodes. We performed experiments on Dsg4-deficient rats to analyze the adaptive humoral immune response to a cutaneous antigenic challenge [16]. Surprisingly, we found that Dsg4 deficient rats exhibited larger lymph nodes but lower enlargement of draining lymph nodes in response to local IMQ compared to wild type rats. Furthermore, we found that the induction of the immune response against intradermal OVA challenge was reduced in Dsg4 deficient rats. Additionally, by transcriptomic analysis of human PSO and AD skin lesions RNA-seq assays, we found that inflammatory plus desmosome (including DSG4) and KC differentiation markers gene expression partition PSO and AD in a major branch, followed by a clear, exclusively minor PSO group.
2. Results
2.1. Desmoglein 4 Deficiency Impairs IMQ-Induced Lymph Node Enlargement
To determine whether Dsg4 plays a role in adaptive immunity, we evaluated the draining lymph node response to cutaneous IMQ or VAS challenge for three consecutive days in the dorsal skin of OFA and wild type SD rats, as detailed in materials and methods. Surprisingly, brachial, axillar and inguinal lymph nodes from VAS OFA rats were larger than those from VAS SD rats (Figure 1A, Figure 1D and Figure 1G). However, when exposed to IMQ, SD rats displayed a significant increase in the size of the draining brachial lymph nodes (Figure 1A), consistent with the site of topical application. OFA rats showed less enlargement of the draining brachial lymph nodes than SD rats, as measured by the index (weight IMQ/weight untreated ratio) (Figure 1 A-C). In contrast, OFA rats, which already had enlarged lymph nodes under basal conditions, did not show statistically significant changes in weight after IMQ exposure compared to VAS OFA (Figure 1A). OFA rats exhibited a smaller increase in the size of the draining brachial lymph nodes than SD rats when measured by the index (weight IMQ/weight untreated ratio) (Figure 1B). Unexpectedly, inguinal and axillar lymph nodes displayed only minor enlargement in both strains in response to IMQ (Figure 1E and Figure 1H). Figure 1C, Figure 1F, and Figure 1I show representative macroscopic images of lymph nodes. These findings suggest that, under normal conditions, lymph nodes from Dsg4-deficient skin may display different histological or functional characteristics.
Furthermore, histological analysis of the lymph nodes was characterized by morphological changes associated with skin inflammation, and to better understand the extent and nature of lymphadenopathy. This approach allowed us to identify structural alterations associated with immune activation, such as changes in cellularity, organization, and lymphoid compartment expansion, thereby providing complementary information to the biometric data. Conventional H&E staining analysis showed a marked paracortical expansion (score 3) in VAS OFA and IMQ OFA groups compared to their respective SD controls (scores 1 and 2, respectively) (Figure 2 A-D). Additionally, the IMQ SD group exhibited greater paracortical expansion than the VAS SD group (score 2 vs. 1). IMQ treatment increased melanophages, especially in the IMQ-OFA-treated animals, which showed greater diffuse accumulation (Figure 2 E and F). In contrast, IMQ SD animals displayed a more localized increase, mainly in the axillary nodes, with less involvement of the brachial and inguinal nodes. No significant differences were observed between groups in immune cell infiltration, including eosinophils, neutrophils, plasma cells, or paracortical mitotic figures. Furthermore, reactive follicular hyperplasia, Castleman-like changes, and capsular or trabecular fibrosis were not seen in any of the experimental groups (Figure 2G).
When we evaluated blood cell counts, no significant differences were observed in red blood cells or platelets between rat strains. However, leukocyte counts (Supplementary Figures 1, 2, and 3) differed between groups: SD rats exhibited a higher percentage and absolute number of lymphocytes, whereas OFA rats under basal conditions showed a higher percentage of granulocytes. To further evaluate subclinical systemic inflammation, we found that the SII index was higher in VAS OFA compared to VAS SD rats. Although IMQ SD showed an increase in the SII values compared to VAS SD, IMQ OFA did not display any response.
2.2. Desmoglein 4 Deficiency Impairs the Induction of Specific Humoral Response
The immune response requires fine-tuning of immune cells including T cell priming and antigen drainage to lymph nodes [15,17]. These processes are essential for the development of an effective humoral immune response through the activation of B cells and subsequent antibody production. To investigate how enlarged LN affects the immune response, rats were intradermally sensitized with the T-cell dependent antigen OVA with topical VAS or IMQ administration to visualize the OVA-specific humoral immune response. Surprisingly, OFA rats showed lower OVA-specific IgM, IgG, IgG2a and IgA levels than the SD group in both, control VAS and IMQ-treated conditions (Figure 3 A-D). The finding that OFA rats exhibit a lower humoral immune response indicates that normal Dsg4 function may promote the induction of an immune response independent of inflammatory status. To rule out major humoral immune alterations, we measured total IgG in sera and found that OFA rats displayed only slightly elevated levels compared to SD (Figure 3 E). These data suggest that Dsg4 deficiency causes singularities during antigen exposure that impair the specific antibody response.
2.3. DSG4 and KC Differentiation Markers Gene Expression in Psoriasis Patients
To further dilucidated the mild lymphadenopathy observed in our psoriasis-like murine model, we performed a cluster analysis to divide PSO, AD, and healthy control patients into sets based on inflammation, immune response, and KC differentiation gene expression markers. As shown in Figure 4, the cluster analysis split datasets into two major branches and seven minor branches. Surprisingly, most lesional AD and all lesional PSO samples were grouped into one of the major branches (37 patients in total). Indeed, only two non-lesional PSO samples (2/37) were located in this branch, with 28/37 chronic AD, 8/37 lesional AD, and 26/37 lesional PSO. Furthermore, this AD/PSO branch split into two minor branches, one of which was almost exclusively composed of PSO patients, with 26/29 skin lesions, two non-lesional PSO samples, and only 1 lesional AD. This PSO branch was characterized by higher expression of inflammatory cytokines such as IL1, IL36, IL17F and IL17A; higher expression of PKP3, DSG3, DSC2, and JUP; lower expression of DSG4, DSC1, DSP, PKP1, and PKP2; higher expression of IVL (involucrin) and lower expression of LOR (loricrin) and FLG. In contrast to the PSO patient cluster, total AD skin lesions were gathered in two adjacent branches. AD skin lesions displayed a clear increase in IL13 gene expression, which was not observed in healthy controls and PSO patients [18]. Interestingly, KRT15, SERPINA12, and LOR displayed a clear pattern with a decreased expression in almost all of AD (17/21) and PSO (27/28) patients while healthy controls displayed an increased expression. As expected, SERPINB3, SERPINB4, S100A7, S100A8, and S100A9 performed a clear cluster with higher expression on AD (17/21) and PSO (27/28) skin lesions while displaying lower expression in healthy controls (37/38) (Figure 4).
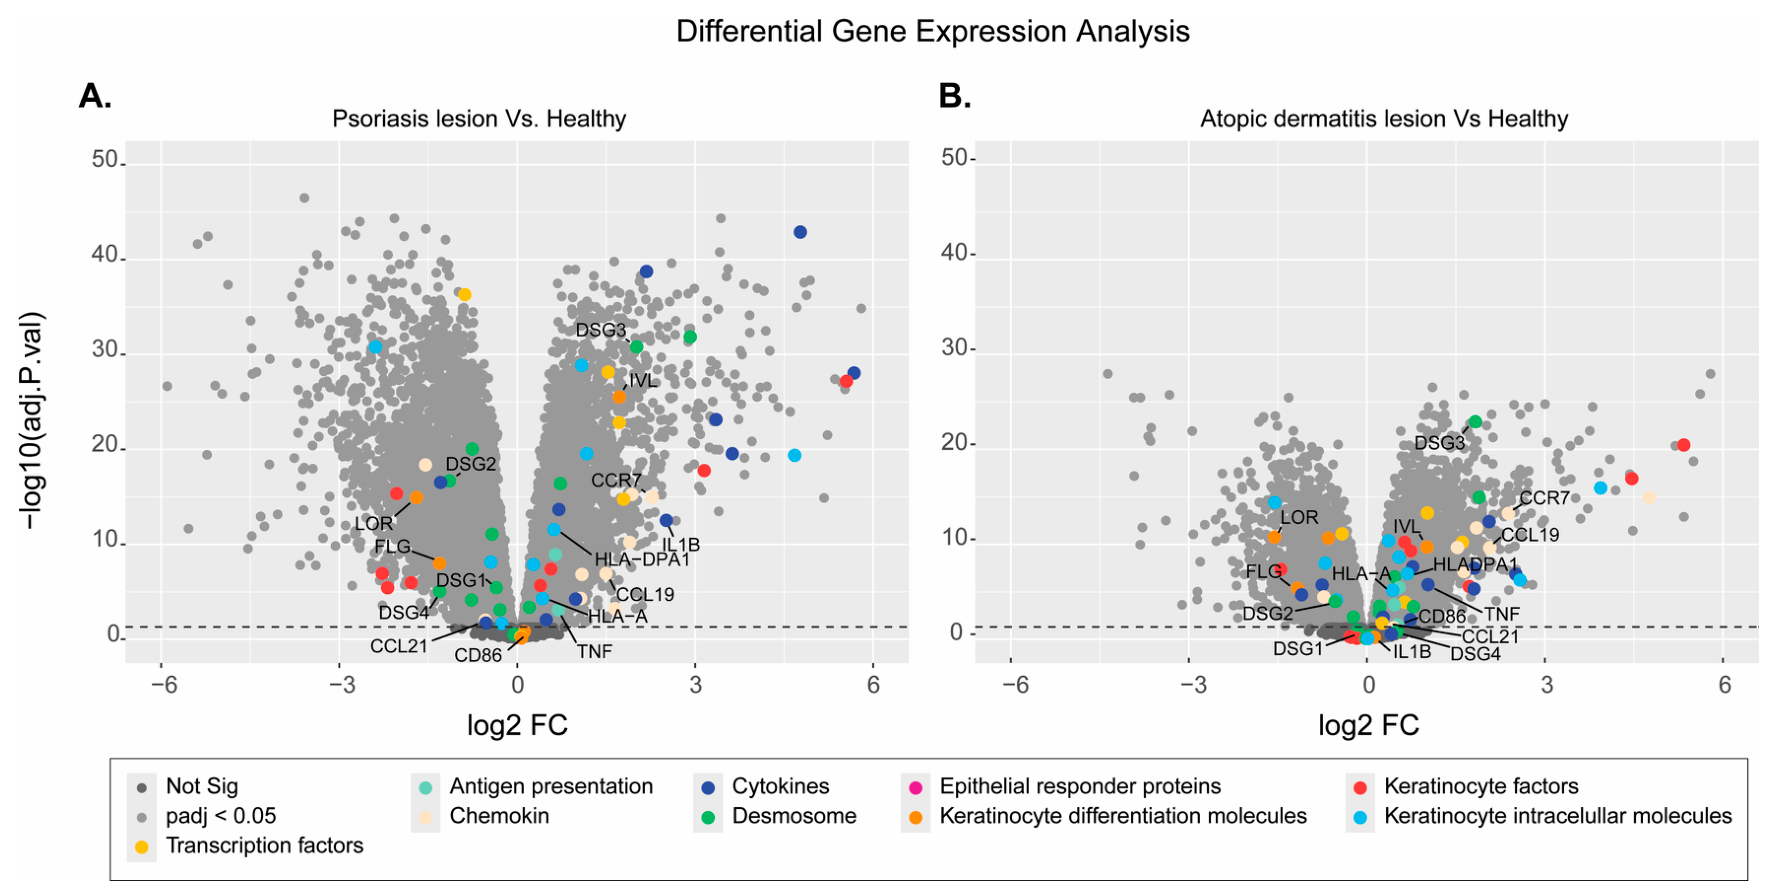
Furthermore, when we evaluated differential expressed genes (DEG), we confirmed that DSG4 gene expression is decreased in PSO as previously reported by our group while AD lesions did not display changes in its expression [8] (Figure 5 A and B). As observed in the gene cluster analysis, gene expression of the KC differentiation markers LOR and FLG (filaggrin) were decreased in PSO as well as in AD, while IVL was increased in both groups, PSO and AD skin lesions. A decreased DSG2 and increased DSG3 expression profile were observed in both PSO and AD samples compared to control (Figure 5 A and B).
Because we observed differences in lymphadenopathy in OFA Dsg4-deficient rats in response to IMQ, we examined gene expression of lymph node-related chemokines, chemokines receptors, and proinflammatory cytokines. CCR1 and CCR6 gene expression displayed no major changes in PSO skin lesions (Figure 5A). By contrast, PSO lesions showed a clear reduced in CCR3 expression, whereas AD patients showed minor changes. CCR5 and CCR7 displayed a sharp increase in expression in both AD and PSO patients (Figure 5 A and B). Additionally, both PSO and AD skin lesion samples showed increased expression of CCL19(Figure 5 A and B). By contrast, CCL21 gene expression was increased only in AD patients, whereas PSO displayed no changes. Additionally, CD86, HLA-B and HLA-C showed similar expression in PSO patients compared to healthy controls. However, HLA-DPA1 showed increased expression in both AD and PSO skin lesion samples (Figure 5A and B).
3. Discussion
Our results suggest that Dsg4 adjusts KC function to mantain local immunity supporting skin homeostasis and to collaborate with the regional immune response. To our knowledge, this is the first report showing that Dsg4 deficiency alters LN enlargement and impairs the induction of the humoral immune response against dermal antigen challenge.
The reduced enlargement of draining LN in Dsg4-deficient rats after IMQ administration aligns with observations in patients with Rheumatoid Arthritis and murine models, where injured lymphatic endothelial cells lead to increased leakiness and poor lymphatic clearance [19]. It has been reported that progression of arthritis in TNF-transgenic mice occurs simultaneously with adjacent LN expansion due to increased lymphangiogenesis, lymphatic fluid accumulation, and macrophage infiltration[19]. However, the authors demonstrated that enlarged LNs collapsed due to changes in lymphoid cells, from the follicles to the lymphatic vessels of the paracortical sinuses [20]. Similarly, in our in vivo model, OFA rats exhibit alterations in the paracortical zone that do not respond to IMQ-induced inflammation, as seen in control SD rats. However, we observed increased melanophage infiltration in the IMQ OFA group compared to untreated controls. This effect was greater than in IMQ SD rats, suggesting an exacerbated inflammatory response in the OFA strain. Although we have not studied reactive lymph nodes in detail, we hypothesized that continuous cutaneous immunogenic stimuli in Dsg4-deficient rats lead to local cytokine production and increased LN size under basal conditions. Upon antigenic challenge, impaired lymphatic vessel function may reduce the migration of antigen- presenting cells as well as circulating T and B cells to regional LNs. This altered immune cell trafficking could also be associated with the reduced number of lymphocytes observed in blood.
Additionally, our results related to a mild induction of OVA-specific immune response by Dsg4-deficient rats align with a report demonstrating that DC capture and endocytose peptide antigens through tight junction-dependent structures, which are crucial for initiating the immune response [21]. Furthermore, similar findings were observed by Oettgen in the RelB(-/-) atopic dermatitis mouse model, where the induction of the immune response was abolished when the skin scarification route of antigen exposure were used [22]. These data suggest that Dsg4 may be involved in inducing the immune response where antigen exposure occurs in the skin. Although we do not fully understand the underlying mechanism, several processes could be involved in the altered antibody response of Dsg4 deficient rats, including alterations in lymphatic drainage, fine crosstalk between KC and DC, and germinal center reaction. In this context. Impaired antigen transport and suboptimal T cell priming may ultimately compromise B cell activation and differentiation, leading to a reduced humoral immune response. Moreover, these alterations could be further influenced by changes in immune cell trafficking and local inflammatory cues within the skin microenvironment.
In our in silico analysis, the increased expression of the proinflammatory mediators S100A7, S100A8, and S100A9, derived from KC and immune cells, in PSO agrees with reports demonstrating their increased expression in PSO patients [23,24]. As previously reported, we also demonstrated that AD and PSO displayed and increased IL22 and IL13 gene expression [18]. Interestingly, this analysis suggests that PSO lesions display a clear inflammatory profile, with both differentiated and basal KC affected, as indicated by changes in the expression of DSG4, LOR, and IVL. Our in silico data on LN chemokines and chemokine receptors agree with Chen et al (2025), showing that the PSO inflammation profile leads to increased CCL19 and decreased CCL21 expression [25].
Similarly to our in silico data, which showed increased CCR5, Sgambelluri et all (2016) demonstrated that PSO patients display an increased frequency of T cells expressing CCR5 in PSO skin plaques as well as in circulation, along with increased gene expression, suggesting a clear association between inflammation and PSO [26]. Similarly, the increased CCR7 gene expression observed in our in silico analysis aligns with a report by Guo et al (2026) demonstrating that CCR7+ T cells are involved in skin inflammation and fibrosis during Systemic Sclerosis [27]. However, contrary to expectations, our in vivo PSO-like murine model did not display LN enlargement. Unfortunately, we could not measure chemokine and chemokine receptors in IMQ-treated skin and LN. Our analysis expands the conventional inflammatory/immune RNA profiling of AD and PSO skin samples to include lymphatics, desmosome and KC-related genes. However, the role of the differences observed in desmosome and immune-related genes in the impaired induction of the immune response remains to be elucidated. Surprisingly, there are no previous reports linking any desmoglein to lymph node function. To our knowledge, this is the first report focusing on desmosome, lymphatics, and the immune response, together with the lymph node phenotype from the Dsg4 deficient OFA rats.
On the other hand, our results align with a report showing that mice carrying mutations in mattrin and FLG develop a defective skin barrier and spontaneous dermatitis, suggesting that skin physiology is crucial for maintaining immune homeostasis [28]. In agreement with our study, it has been reported that children carrying loss-of-function mutations in the skin barrier gene filaggrin are associated with food allergies, suggesting that these mutation may affect immune function and tolerance[29]. Unfortunately, the precise cause of the lower induction of the immune response to OVA and IMQ administration is unknown but processes such lymphatics drainage, antigen presentation, dendritic cells recruitment to LN, skin homeostasis, and skin inflammation may be involved [30]. Although further investigations are necessary, our results suggest a novel role for Dsg4 in supporting humoral immunity and immune tolerance under inflammatory condition. Understanding KC modulation and KC-derived factors will help us to understand the pathogenesis of immune-mediated skin diseases to design new therapeutics.
4. Materials and Methods
4.1. Animals, Experimental Design and Treatment
Ten- to twelve-week-old female OFA rats carrying an intragenic deletion of the Dsg-4 locus in a Sprague Dawley (SD) genetic background (originally purchased from Iffa Credo, Oncins, France, named IFL Nu at that time, later OFAhairless/hairless and finally OFA in this work, with a hairless phenotype) and wild type SD rats, both strains were bred at our institute (nDsg4 60; nSD 40). They were maintained under standard light and temperature conditions. Water and food (rat chow, GEPSA, Córdoba, Argentina) were available ad libitum. All animals were cared for following the Guiding Principles in the Care and Use of Animals of the National Institute of Health (NIH US). All procedures were approved by the Institutional Animal Care and Use Committee of the Facultad de Ciencias Médicas, Universidad Nacional de Cuyo (Protocol 224/2022). Rats were treated topically with 100 mg of Miquimod® cream containing 5% IMQ (Miquimod®, Lab Lazar, Argentina) or Vaseline Petroleum Jelly (VAS) [31]. This was done daily for three consecutive days (days 0 to 3) per week for two straight weeks on a 4 cm2 area of the dorsal skin of the lumbar region. Before administering IMQ, SD rats were shaved to remove hair. On days 4 and 15 after treatment, animals were euthanized to collect lymph node tissue for biometric and histological analyses. Euthanasia was performed using CO2 gas delivered in a transparent, lidded chamber specifically designed for small laboratory animals. Compressed CO₂ from a regulated cylinder was introduced into the chamber at a gradual fill rate of 20–30% of the chamber volume per minute. Additionally, blood samples were obtained by intracardiac puncture into sodium heparin tubes and analyzed using a Mindray BC-20 Blood Cell Analyzer to determine cell counts. The systemic Immune Inflammation index (SII) was calculated as the ratio of platelet count x neutrophil count/lymphocyte count [32]. Additionally, brachial, axillary and inguinal lymph nodes were obtained and weighed to indirectly evaluate local and systemic immune response to IMQ.
4.2. Histology
Brachial, axillary, and inguinal lymph nodes were collected. Nodes were carefully isolated, cleaned of surrounding adipose tissue, and individually weighed on an analytical balance (Sartorius, Germany). The index was calculated as lymph node weight divided by animal body weight, multiplied by 100. Values were then normalized to the VAS group to indirectly assess the degree of enlargement after IMQ exposure. Macroscopic photographs were taken with a stereoscopic magnifier (Zeiss, Germany), maintaining constant lighting and scale conditions.
Brachial lymph nodes from 3 female animals per group were fixed in Bouin solution and then included in paraffin blocks. 3–5 µm-thick tissue sections were obtained with a microtome (Leica SM2000R, Germany) and stained with hematoxylin and eosin (H&E) to assess histological architecture. Slides were examined under light microscopy (Nikon E200) at 10x and 40x magnification. Histological evaluation focused on identifying morphological alterations. Following the criteria described by Garces et al [33], a semi-quantitative scoring system ranging from 0 to 3 was established to grade the severity of histopathological changes including paracortical expansion, presence of melanophages, immune cell infiltration, reactive follicular hyperplasia, Castleman changes and capsular or trabecular fibrosis.
4.3. OVA Sensitization Protocol and Antibody Detection
To assess the induction of antigen-specific antibodies, animals were immunized intradermally with OVA (10 μg per 40 μL/animal) (Sigma). Immediately after immunization, IMQ or Vaseline (VAS) was applied topically near the inoculation site. After seven days, animals received a booster dose of OVA without adjuvant or VAS.
Blood samples were collected by the tail vein 15 days after the initial immunization. Serum was isolated, and the presence of OVA-specific antibodies was determined by indirect ELISA. Briefly, microplates were coated overnight (12 h) with OVA at 10 µg/ml. After blocking and washing, serum samples were added at appropriate dilutions. Detection was performed using peroxidase-conjugated goat anti-rat α, µ and γ antibodies (SIGMA, USA) at dilutions ranging from 1/50 to 1/200, following standard protocols.
4.4. RNA-Seq Data Acquisition and Differentially Expressed Genes (DEG) Analysis
Analyses were performed using R version 4.2.3 (http://www.r-project.org/) in a Windows 11 environment. Gene expression dataset from human patients was programmatically downloaded from the publicly available Gene Expression Omnibus (GEO) database (series number GSE121212) (20). The cohort in that study included 54 patients with AD, 55 with psoriasis (PSO), and 38 healthy controls, with lesional and non-lesional skin samples for PSO and AD patients. Target genes involved in the desmosome, cytokine signaling, inflammation and KC biology were used for gene expression analysis (Supplementary Table 1). Low expression counts were filtered out and Voom normalization from the R limma package was performed, allowing normal linear modeling of the RNA counts.
To identify transcriptionally distinct patient subgroups based on Z-score normalized expression of target genes, unsupervised bidirectional hierarchical clustering was performed. Pearson’s correlation metric was used to capture linear relationships, and the average linkage clustering algorithm was used to minimize the influence of outliers.
The results were visualized using a dual-axis dendrogram and heatmap, with rows (genes) and columns (patients) independently clustered to reveal co-expressed gene modules and patient clinical cohorts.
Differential expression analysis was performed comparing lesional PSO and AD cohorts against healthy controls using the DESeq2 R package. Genes were considered differentially expressed (DEGs) based on an adjusted p-value < 0.05 (Benjamini-Hochberg correction). Volcano plots were used to visualize the magnitude and statistical significance of these changes, with key genes annotated by their primary biological functions.
4.5. Statistics
Statistical analyses were performed using GraphPad Prism 8.0.2 for Windows (GraphPad Software). Normality was assessed using the Shapiro-Wilk test. For normally distributed data, two-way analysis of variance (two-way ANOVA) was used to analyze the effects of rat strain, IMQ exposure, and their interaction. Post-hoc comparisons were performed using Fisher's LSD test. For non-normally distributed data, the Kruskal-Wallis test was applied, followed by Dunn's multiple comparisons test. For comparison of two means only, Student's t-test was used. Results were considered statistically significant at p<0.05. The data shown represent the mean values and standard error of the mean (s.e.m.). All n values correspond to the number of samples, or individual animals used as biological replicates.
5. Conclusions
Using Dsg4-deficient rats we found that Dsg4 may be involved in the induction of adaptive immunity when antigens are exposed intradermally. To our knowledge this is the first report linking Dsg4 to immunological features.
Supplementary Materials
The following supporting information can be downloaded at the website of this paper posted on Preprints.org, Figure S1: White blood cell populations and spleen parameters in SD and OFA rats treated with Vaseline-VAS) or imiquimod (IMQ).; Figure S2: Supplementary Figure S2. Red blood cell parameters in SD and OFA rats treated with Vaseline-VAS) or imiquimod (IMQ); Figure S3: Supplementary Figure S3. Platelet parameters and systemic inflammatory indices in SD and OFA rats treated with Vaseline-VAS) or imiquimod (IMQ); Table S1: Gene used in DEG analysis; Table S2: DEG values in PSO vs HC analysis; Table S3: DEG values in AD vs HC analysis.
Author Contributions
M.C.M. and M.B.S. participated in formal analysis, investigation, immunization, in vivo and in vitro methodology and wrote the original draft; F.J.N., J.L.T., A.M., C.E.A. and J.A.R. performed in vivo experiments, sample processing and histological assays; J.M.F. and M.J.G. performed in silico work including Spearman correlation analysis and collaborate in manuscript writing; E.A.M. and E.O.P. performed histology studies (investigation and methodology); M.V.S. and L.B.V. contributed to ELISA test (investigation and methodology); M.E.T., S.R.V. and M.S. contributed to histological analysis; J.A.S., E.L.J., A.M.K. and D.E.C. contributed to the conceptualization and writing-review and editing; and J.P.M.O. played a lead role in conceptualization, funding acquisition, supervision and wrote the original draft. All authors revised and approved the manuscript.
Funding
This research was funded by by PIP 0012-2023 from CONICET Argentina, FONCYT/PICT 2021-GRF-TII00279 (ANPCYT), FONCYT/PICT 02642-2018, FONCYT/PICT 01762-2019 (ANPCYT), SIIP 2025-80020250300017UN and 2025-80020240100092UN from Universidad Nacional de Cuyo, Mendoza Argentina, CIUDA 2025 Universidad del Aconcagua, DICYT 2025 and 2024. Agencia Nacional de Investigacion y Desarrollo (ANID) – Millennium Science Initiative Program – Millennium Institute on Immunology and Immunotherapy ICN2021_045 (former ICN09_016; P09/016-F), FONDECYT Regular grant 1231851 (A.M. Kalergis) and FONDECYT Iniciación grant 11230573 (H.F. Peñaloza).
Institutional Review Board Statement
The animal study protocol was approved by the Institutional Review Board of Institutional Animal Care and Use Committee of the Facultad de Ciencias Médicas, Universidad Nacional de Cuyo Mendoza Argentina (Protocol 224/2022).
Acknowledgments
We are grateful to Silvina Gómez for their contribution to this work. We also thank Maritza Valerio and Hernán Farias from the vivarium staff.
Conflicts of Interest
The authors declare no conflicts of interest.
Abbreviations
The following abbreviations are used in this manuscript:
| AD | Atopic dermatitis | |
| DCs | Dendritic cells | |
| Dsg | Desmoglein | |
| IMQ | imiquimod | |
| LN | Lymph node | |
| KC | keratinocyte | |
| OFA | Oncins France Colony A. Desmoglein 4 deficient rats ackground. | |
| VAS | Vaseline | |
| PSO | Psoriasis | |
| SD | Sprague Dawley | |
References
- Getsios, S.; Huen, A. C.; Green, K. J. Working out the strength and flexibility of desmosomes. Nat. Rev. Mol. Cell Biol. 2004, 5(4), 271–81. [Google Scholar] [CrossRef] [PubMed]
- Brennan, D.; Hu, Y.; Joubeh, S.; Choi, Y. W.; Whitaker-Menezes, D.; O'Brien, T.; Uitto, J.; Rodeck, U.; Mahoney, M. G. Suprabasal Dsg2 expression in transgenic mouse skin confers a hyperproliferative and apoptosis-resistant phenotype to keratinocytes. J. Cell Sci. 2007, 120 Pt 5, 758–71. [Google Scholar] [CrossRef] [PubMed]
- Holthofer, B.; Windoffer, R.; Troyanovsky, S.; Leube, R. E. Structure and function of desmosomes. Int. Rev. Cytol. 2007, 264, 65–163. [Google Scholar] [CrossRef] [PubMed]
- Kottke, M. D.; Delva, E.; Kowalczyk, A. P. The desmosome: cell science lessons from human diseases. J. Cell Sci. 2006, 119 Pt 5, 797–806. [Google Scholar] [CrossRef] [PubMed]
- Bazzi, H.; Getz, A.; Mahoney, M. G.; Ishida-Yamamoto, A.; Langbein, L.; Wahl, J. K., 3rd; Christiano, A. M. Desmoglein 4 is expressed in highly differentiated keratinocytes and trichocytes in human epidermis and hair follicle. Differ. Res. Biol. Divers. 2006, 74(2-3), 129–40. [Google Scholar] [CrossRef]
- Kljuic, A.; Bazzi, H.; Sundberg, J. P.; Martinez-Mir, A.; O'Shaughnessy, R.; Mahoney, M. G.; Levy, M.; Montagutelli, X.; Ahmad, W.; Aita, V. M.; Gordon, D.; Uitto, J.; Whiting, D.; Ott, J.; Fischer, S.; Gilliam, T. C.; Jahoda, C. A.; Morris, R. J.; Panteleyev, A. A.; Nguyen, V. T.; Christiano, A. M. Desmoglein 4 in hair follicle differentiation and epidermal adhesion: evidence from inherited hypotrichosis and acquired pemphigus vulgaris. Cell 2003, 113(2), 249–60. [Google Scholar] [CrossRef] [PubMed]
- Merritt, A. J.; Berika, M. Y.; Zhai, W.; Kirk, S. E.; Ji, B.; Hardman, M. J.; Garrod, D. R. Suprabasal desmoglein 3 expression in the epidermis of transgenic mice results in hyperproliferation and abnormal differentiation. Mol. Cell Biol. 2002, 22(16), 5846–58. [Google Scholar] [CrossRef] [PubMed]
- Moreno-Sosa, T.; Sánchez, M. B.; Pietrobon, E. O.; Fernandez-Muñoz, J. M.; Zoppino, F. C. M.; Neira, F. J.; Germanó, M. J.; Cargnelutti, D. E.; Innocenti, A. C.; Jahn, G. A.; Valdez, S. R.; Mackern-Oberti, J. P. Desmoglein-4 Deficiency Exacerbates Psoriasiform Dermatitis in Rats While Psoriasis Patients Displayed a Decreased Gene Expression of DSG4. Front Immunol. 2021, 12, 625617. [Google Scholar] [CrossRef] [PubMed]
- Ozulumba, T.; Montalbine, A. N.; Ortiz-Cárdenas, J. E.; Pompano, R. R. New tools for immunologists: models of lymph node function from cells to tissues. Front. Immunol. 2023, 14, 1183286. [Google Scholar] [CrossRef] [PubMed]
- Mehling, A.; Loser, K.; Varga, G.; Metze, D.; Luger, T. A.; Schwarz, T.; Grabbe, S.; Beissert, S. Overexpression of CD40 ligand in murine epidermis results in chronic skin inflammation and systemic autoimmunity. J. Exp. Med. 2001, 194(5), 615–28. [Google Scholar] [CrossRef] [PubMed]
- Monaco, S. E.; Khalbuss, W. E.; Pantanowitz, L. Benign non-infectious causes of lymphadenopathy: A review of cytomorphology and differential diagnosis. Diagn. Cytopathol. 2012, 40(10), 925–38. [Google Scholar] [CrossRef] [PubMed]
- Rose, N. R. Mackay, I. R., The Autoimmune Diseases (Fifth Edition). In The Autoimmune Diseases (Fifth Edition); Rose, N. R., Mackay, I. R., Eds.; Academic Press: Boston, 2014; p. xxxiii. [Google Scholar]
- Navarro-Compán, V.; Sepriano, A.; Capelusnik, D.; Baraliakos, X. Axial spondyloarthritis. Lancet 2025, 405(10473), 159–172. [Google Scholar] [CrossRef]
- Yang, Y.; Sun, Z.; Ge, Y. Upadacitinib in the treatment of SAPHO syndrome: a case report. Front Immunol. 2025, 16, 1662675. [Google Scholar] [CrossRef] [PubMed]
- AK, A.; AH, L.; S, P. Immunol. Cel. Y Mol. 2008. [CrossRef]
- Bazzi, H.; Kljuic, A.; Christiano, A. M.; Panteleyev, A. A. Intragenic deletion in the Desmoglein 4 gene underlies the skin phenotype in the Iffa Credo "hairless" rat. Differ. Res. Biol. Divers. 2004, 72(8), 450–64. [Google Scholar] [CrossRef]
- Sonar, S. A.; Watanabe, M.; Nikolich, J. Disorganization of secondary lymphoid organs and dyscoordination of chemokine secretion as key contributors to immune aging. Semin. Immunol. 2023, 70, 101835. [Google Scholar] [CrossRef] [PubMed]
- Tsoi, L. C.; Rodriguez, E.; Degenhardt, F.; Baurecht, H.; Wehkamp, U.; Volks, N.; Szymczak, S.; Swindell, W. R.; Sarkar, M. K.; Raja, K.; Shao, S.; Patrick, M.; Gao, Y.; Uppala, R.; Perez White, B. E.; Getsios, S.; Harms, P. W.; Maverakis, E.; Elder, J. T.; Franke, A.; Gudjonsson, J. E.; Weidinger, S. Atopic Dermatitis Is an IL-13-Dominant Disease with Greater Molecular Heterogeneity Compared to Psoriasis. J. Investig. Dermatol. 2019, 139(7), 1480–1489. [Google Scholar] [CrossRef] [PubMed]
- Bouta, E. M.; Kuzin, I.; de Mesy Bentley, K.; Wood, R. W.; Rahimi, H.; Ji, R. C.; Ritchlin, C. T.; Bottaro, A.; Xing, L.; Schwarz, E. M. Brief Report: Treatment of Tumor Necrosis Factor-Transgenic Mice With Anti-Tumor Necrosis Factor Restores Lymphatic Contractions, Repairs Lymphatic Vessels, and May Increase Monocyte/Macrophage Egress. Arthritis Rheumatol. 2017, 69(6), 1187–1193. [Google Scholar] [CrossRef] [PubMed]
- Proulx, S. T.; Kwok, E.; You, Z.; Papuga, M. O.; Beck, C. A.; Shealy, D. J.; Ritchlin, C. T.; Awad, H. A.; Boyce, B. F.; Xing, L.; Schwarz, E. M. Longitudinal assessment of synovial, lymph node, and bone volumes in inflammatory arthritis in mice by in vivo magnetic resonance imaging and microfocal computed tomography. Arthritis Rheum. 2007, 56(12), 4024–37. [Google Scholar] [CrossRef] [PubMed]
- Ouchi, T.; Kubo, A.; Yokouchi, M.; Adachi, T.; Kobayashi, T.; Kitashima, D. Y.; Fujii, H.; Clausen, B. E.; Koyasu, S.; Amagai, M.; Nagao, K. Langerhans cell antigen capture through tight junctions confers preemptive immunity in experimental staphylococcal scalded skin syndrome. J. Exp. Med. 2011, 208(13), 2607–13. [Google Scholar] [CrossRef] [PubMed]
- Freyschmidt, E. J.; Mathias, C. B.; MacArthur, D. H.; Laouar, A.; Narasimhaswamy, M.; Weih, F.; Oettgen, H. C. Skin inflammation in RelB(-/-) mice leads to defective immunity and impaired clearance of vaccinia virus. J. Allergy Clin. Immunol. 2007, 119(3), 671–9. [Google Scholar] [PubMed]
- Madsen, P.; Rasmussen, H. H.; Leffers, H.; Honoré, B.; Dejgaard, K.; Olsen, E.; Kiil, J.; Walbum, E.; Andersen, A. H.; Basse, B.; et al. Molecular cloning, occurrence, and expression of a novel partially secreted protein "psoriasin" that is highly up-regulated in psoriatic skin. J. Investig. Dermatol. 1991, 97(4), 701–12. [Google Scholar] [CrossRef] [PubMed]
- Liang, H.; Li, J.; Zhang, K. Pathogenic role of S100 proteins in psoriasis. Front. Immunol. 2023, 14. [Google Scholar] [CrossRef] [PubMed]
- Chen, K. Y.; De Giovanni, M.; Xu, Y.; An, J.; Kirthivasan, N.; Lu, E.; Jiang, K.; Brooks, S.; Ranucci, S.; Yang, J.; Kanameishi, S.; Kabashima, K.; Brulois, K.; Bscheider, M.; Butcher, E. C.; Cyster, J. G. Inflammation switches the chemoattractant requirements for naive lymphocyte entry into lymph nodes. Cell 2025, 188(4), 1019–1035.e22. [Google Scholar] [CrossRef] [PubMed]
- Sgambelluri, F.; Diani, M.; Altomare, A.; Frigerio, E.; Drago, L.; Granucci, F.; Banfi, G.; Altomare, G.; Reali, E. A role for CCR5(+)CD4 T cells in cutaneous psoriasis and for CD103(+) CCR4(+) CD8 Teff cells in the associated systemic inflammation. J. Autoimmun. 2016, 70, 80–90. [Google Scholar] [CrossRef] [PubMed]
- Guo, W.; Li, Z.; Xu, D.; Li, T.; Li, X.; Fang, D.; Zhang, X.; Jin, Y.; Xing, D.; Chen, Z.; Yuan, X.; Wang, Z.; Dong, C.; Xu, H.; Varga, J.; Wang, J.; Ge, J.; Mu, R. CCL19+ fibroblast-CCR7+ T-cell crosstalk coordinates immunofibrotic signalling networks in systemic sclerosis. Br. J. Dermatol. 2026, 194(2), 326–339. [Google Scholar] [PubMed]
- Saunders, S. P.; Goh, C. S.; Brown, S. J.; Palmer, C. N.; Porter, R. M.; Cole, C.; Campbell, L. E.; Gierlinski, M.; Barton, G. J.; Schneider, G.; Balmain, A.; Prescott, A. R.; Weidinger, S.; Baurecht, H.; Kabesch, M.; Gieger, C.; Lee, Y. A.; Tavendale, R.; Mukhopadhyay, S.; Turner, S. W.; Madhok, V. B.; Sullivan, F. M.; Relton, C.; Burn, J.; Meggitt, S.; Smith, C. H.; Allen, M. A.; Barker, J. N.; Reynolds, N. J.; Cordell, H. J.; Irvine, A. D.; McLean, W. H.; Sandilands, A.; Fallon, P. G. Tmem79/Matt is the matted mouse gene and is a predisposing gene for atopic dermatitis in human subjects. J. Allergy Clin. Immunol. 2013, 132(5), 1121–9. [Google Scholar] [CrossRef] [PubMed]
- Kalb, B.; Marenholz, I.; Jeanrenaud, A.; Meixner, L.; Arnau-Soler, A.; Rosillo-Salazar, O. D.; Ghauri, A.; Cibin, P.; Blümchen, K.; Schlags, R.; Hansen, G.; Seidenberg, J.; Keil, T.; Lau, S.; Niggemann, B.; Beyer, K.; Lee, Y. A. Filaggrin loss-of-function mutations are associated with persistence of egg and milk allergy. J. Allergy Clin. Immunol. 2022, 150(5), 1125–1134. [Google Scholar] [CrossRef] [PubMed]
- Yokogawa, M.; Takaishi, M.; Nakajima, K.; Kamijima, R.; Fujimoto, C.; Kataoka, S.; Terada, Y.; Sano, S. Epicutaneous application of toll-like receptor 7 agonists leads to systemic autoimmunity in wild-type mice: a new model of systemic Lupus erythematosus. Arthritis Rheumatol. 2014, 66(3), 694–706. [Google Scholar] [CrossRef] [PubMed]
- Gangwar, R. S.; Gudjonsson, J. E.; Ward, N. L. Mouse Models of Psoriasis: A Comprehensive Review. J. Investig. Dermatol. 2022, 142 3 Pt B, 884–897. [Google Scholar] [CrossRef] [PubMed]
- Yontar, G.; Mutlu, E. A. Neutrophil-to-lymphocyte, platelet-to-lymphocyte ratios and systemic immune-inflammation index in patients with post-traumatic stress disorder. BMC Psychiatry 2024, 24(1), 966. [Google Scholar] [CrossRef] [PubMed]
- Garces, S.; Yin, C. C.; Miranda, R. N.; Patel, K. P.; Li, S.; Xu, J.; Thakral, B.; Poppiti, R. J.; Medina, A. M.; Sriganeshan, V.; Castellano-Sánchez, A.; Khoury, J. D.; Garces, J. C.; Medeiros, L. J. Clinical, histopathologic, and immunoarchitectural features of dermatopathic lymphadenopathy: an update. Modern pathology: an official journal of the United States and Canadian Academy of Pathology, Inc 2020, 33(6), 1104–1121. [Google Scholar] [CrossRef] [PubMed]
Figure 1.
Lymph nodes enlargement in response to imiquimod. SD and OFA rats were exposed to IMQ or VAS for three consecutive days in the dorsal skin. At day 4, rats were euthanized and lymph node were collected. Brachial lymph node weight (A), index (B), and representative photos (C); Axillary lymph node weight (D), index (E), and representative photos (F); Inguinal lymph node weight (G), index (H), and representative photos (I). Each dot represents an individual animal; bars indicate mean ± SEM. Statistical significance was determined using two-way ANOVA followed by Fisher LSD post hoc test. *p<0.05, **p<0.01, ***p<0.001, ****p<0.0001. Group sizes: lymph node index: SD-VAS (n=6), SD-IMQ (n=13), OFA-VAS (n=8), and OFA-IMQ (n=16); lymph node area: SD-VAS (n=10), SD-IMQ (n=14), OFA-VAS (n=10), and OFA-IMQ (n=14).
Figure 1.
Lymph nodes enlargement in response to imiquimod. SD and OFA rats were exposed to IMQ or VAS for three consecutive days in the dorsal skin. At day 4, rats were euthanized and lymph node were collected. Brachial lymph node weight (A), index (B), and representative photos (C); Axillary lymph node weight (D), index (E), and representative photos (F); Inguinal lymph node weight (G), index (H), and representative photos (I). Each dot represents an individual animal; bars indicate mean ± SEM. Statistical significance was determined using two-way ANOVA followed by Fisher LSD post hoc test. *p<0.05, **p<0.01, ***p<0.001, ****p<0.0001. Group sizes: lymph node index: SD-VAS (n=6), SD-IMQ (n=13), OFA-VAS (n=8), and OFA-IMQ (n=16); lymph node area: SD-VAS (n=10), SD-IMQ (n=14), OFA-VAS (n=10), and OFA-IMQ (n=14).
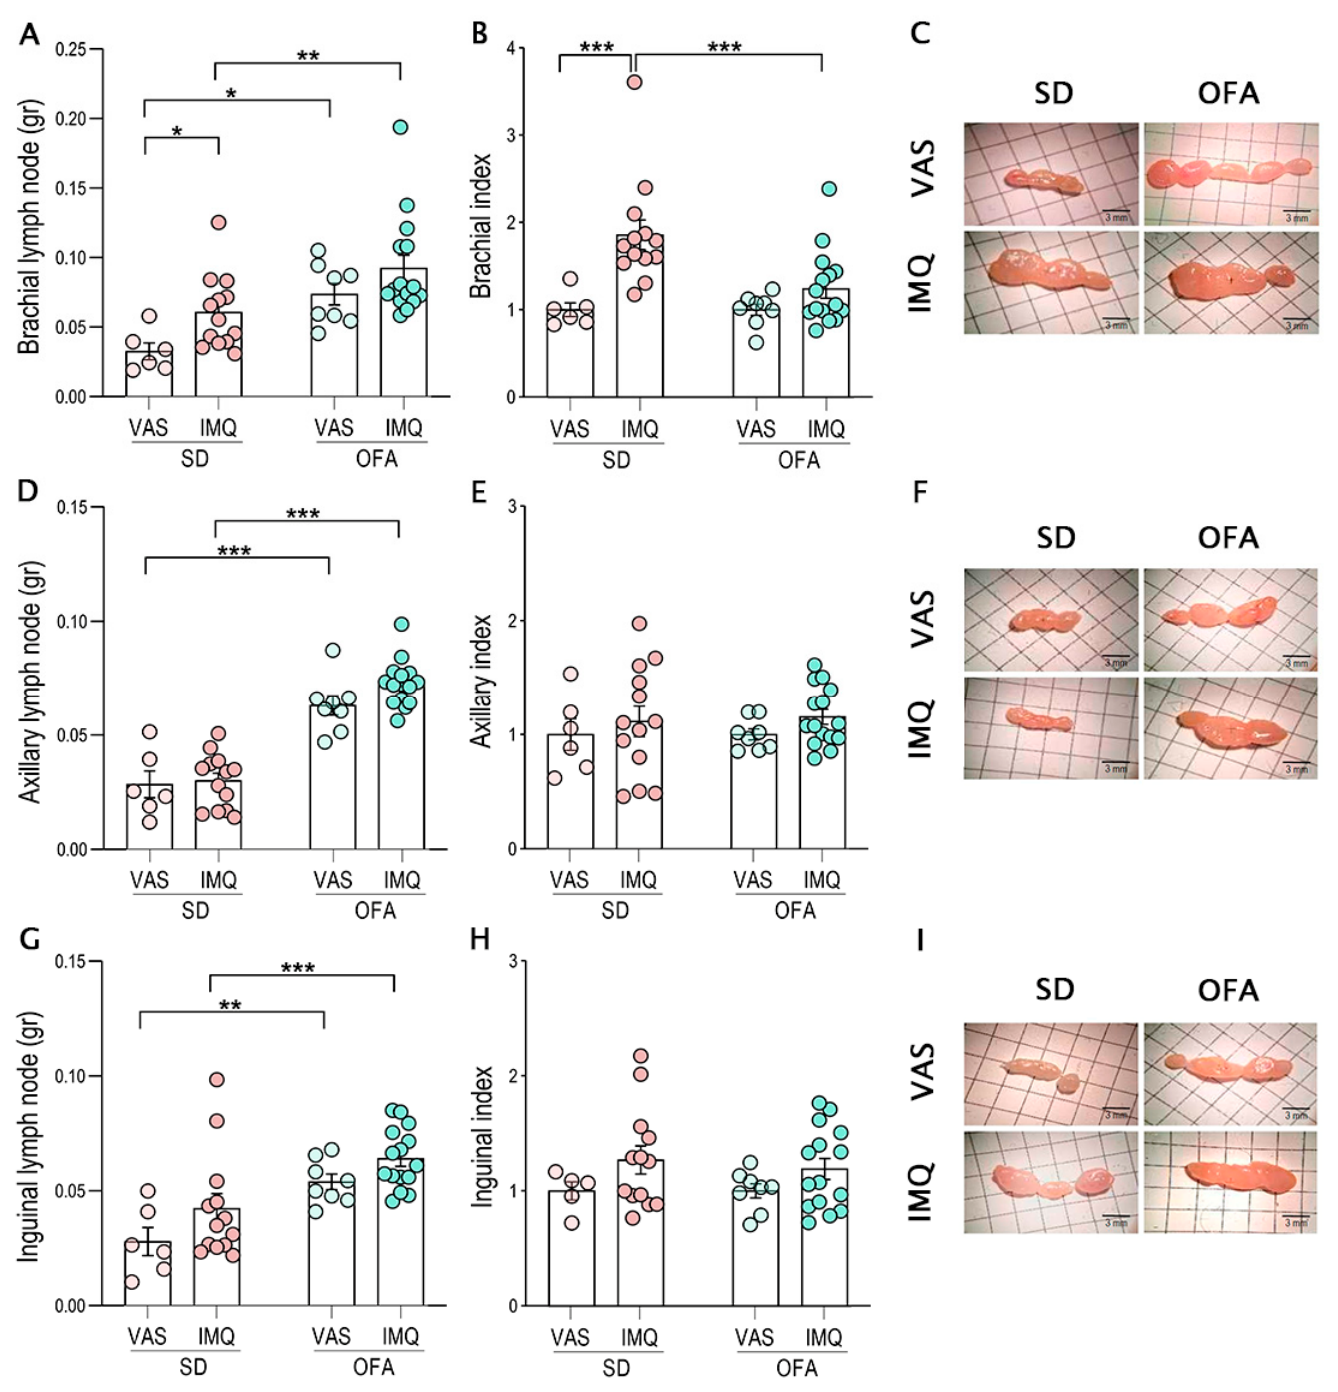
Figure 2.
Histological analysis of lymph nodes from control and IMQ-treated rats. Representative hematoxylin and eosin-stained sections of lymph nodes from control groups (SD and OFA) treated with vehicle (VAS) (A-B) or IMQ (C-D). The black dotted lines indicate the paracortical zone at 10x. Higher magnification images (E-F) at 40x show melanophages (black arrows). Semiquantitative score of histopathological features including paracortical expansion, presence of melanophages, immune cell infiltration, reactive follicular hyperplasia, Castleman changes and capsular or trabecular fibrosis (G). Scale bar 100 μm. Group sizes: 3´per group.
Figure 2.
Histological analysis of lymph nodes from control and IMQ-treated rats. Representative hematoxylin and eosin-stained sections of lymph nodes from control groups (SD and OFA) treated with vehicle (VAS) (A-B) or IMQ (C-D). The black dotted lines indicate the paracortical zone at 10x. Higher magnification images (E-F) at 40x show melanophages (black arrows). Semiquantitative score of histopathological features including paracortical expansion, presence of melanophages, immune cell infiltration, reactive follicular hyperplasia, Castleman changes and capsular or trabecular fibrosis (G). Scale bar 100 μm. Group sizes: 3´per group.
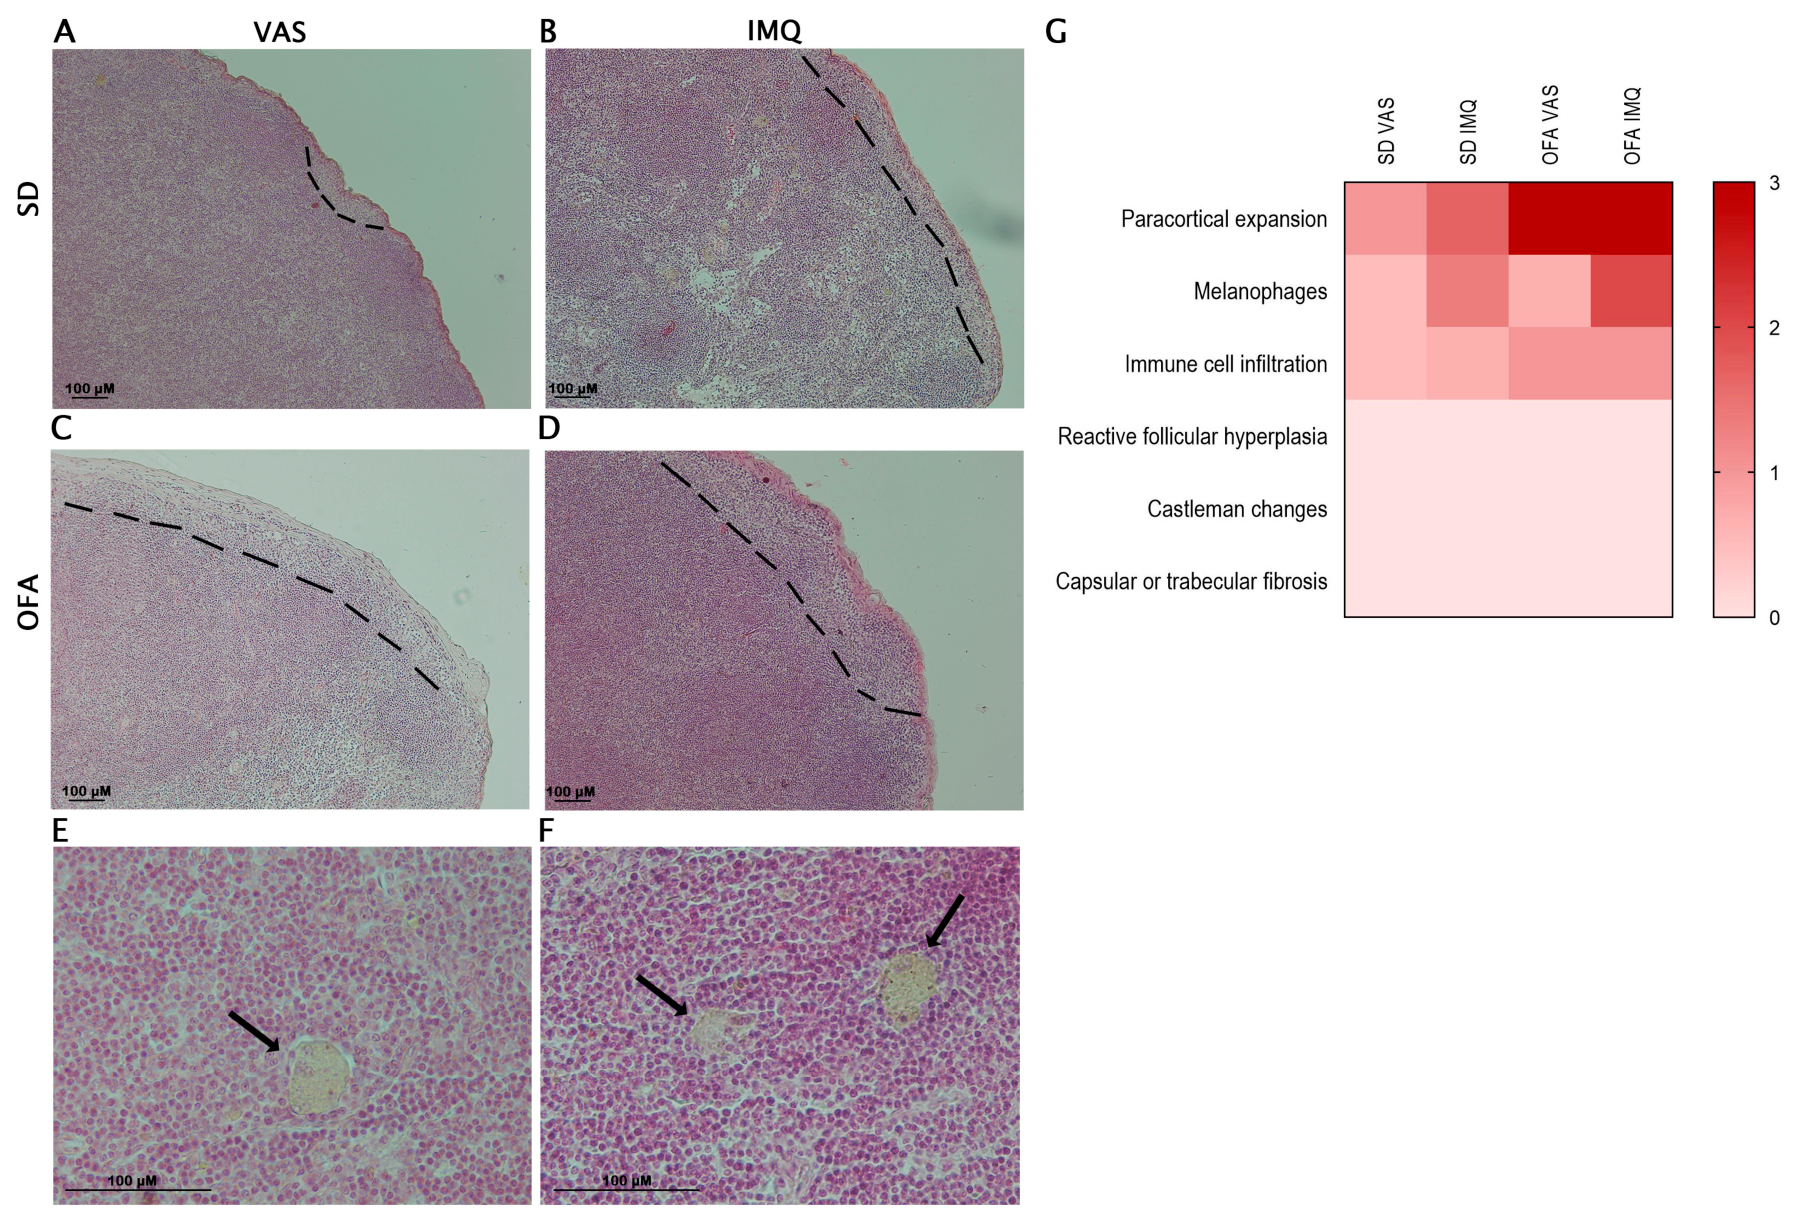
Figure 3.
OVA-specific antibody responses in serum in animals treated with vehicle (VAS) or imiquimod (IMQ). Antigen-specific antibodies against OVA: IgM (A), IgG (B), IgG2a (C), IgA (D) and total IgG concentration (E) were measured by ELISA. Data are presented as mean ± SEM. Statistical significance was determined using two-way ANOVA followed by Fisher's LSD multiple comparisons test. *p<0.05, **p<0.01, ***p<0.001, ****p<0.0001. n = 4–14 animals per group.
Figure 3.
OVA-specific antibody responses in serum in animals treated with vehicle (VAS) or imiquimod (IMQ). Antigen-specific antibodies against OVA: IgM (A), IgG (B), IgG2a (C), IgA (D) and total IgG concentration (E) were measured by ELISA. Data are presented as mean ± SEM. Statistical significance was determined using two-way ANOVA followed by Fisher's LSD multiple comparisons test. *p<0.05, **p<0.01, ***p<0.001, ****p<0.0001. n = 4–14 animals per group.
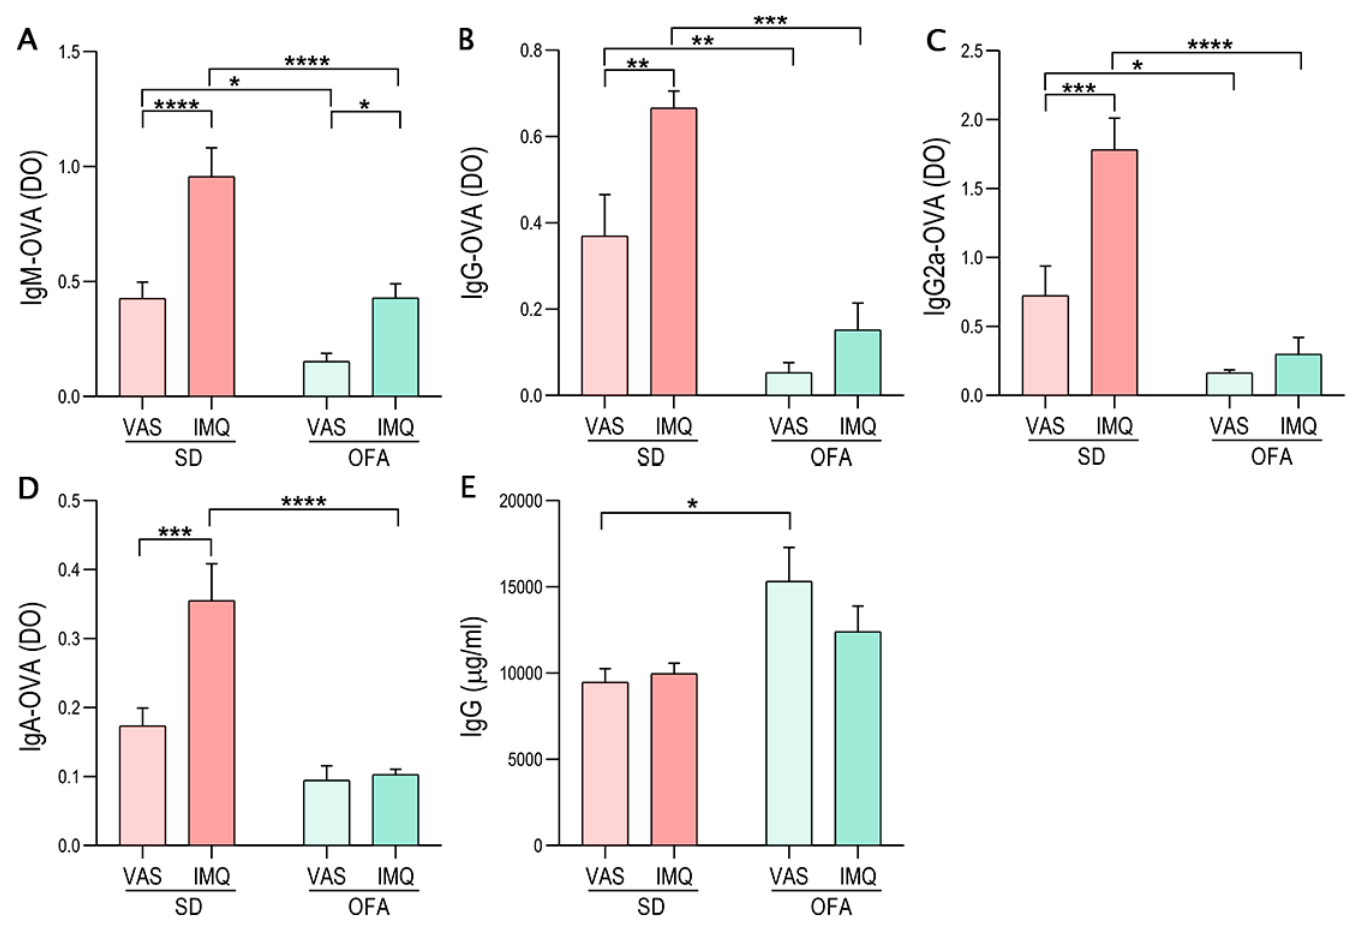
Figure 4.
Unsupervised hierarchical clustering of gene expression profiles in skin samples from patients with Atopic Dermatitis, Psoriasis, and healthy controls. The heatmap displays the expression levels of specific immune genes (rows) across skin samples (columns). Both samples and genes were subjected to unsupervised hierarchical clustering, with the resulting dendrograms shown at the top (for samples) and on the left (for genes). Expression values are row-normalized and scaled using Z-scores, with red representing high expression and green representing low expression, as indicated by the scale on the left. The color-coded annotation bar at the top of the heatmap classifies the samples into six distinct groups according to the legend: AD lesional (red), AD non-lesional (blue), Healthy (green), PSO lesional (purple), PSO non-lesional (orange), and AD chronic lesion (yellow). Abbreviations: AD: Atopic Dermatitis; PSO: Psoriasis; Z-score: standard score.
Figure 4.
Unsupervised hierarchical clustering of gene expression profiles in skin samples from patients with Atopic Dermatitis, Psoriasis, and healthy controls. The heatmap displays the expression levels of specific immune genes (rows) across skin samples (columns). Both samples and genes were subjected to unsupervised hierarchical clustering, with the resulting dendrograms shown at the top (for samples) and on the left (for genes). Expression values are row-normalized and scaled using Z-scores, with red representing high expression and green representing low expression, as indicated by the scale on the left. The color-coded annotation bar at the top of the heatmap classifies the samples into six distinct groups according to the legend: AD lesional (red), AD non-lesional (blue), Healthy (green), PSO lesional (purple), PSO non-lesional (orange), and AD chronic lesion (yellow). Abbreviations: AD: Atopic Dermatitis; PSO: Psoriasis; Z-score: standard score.
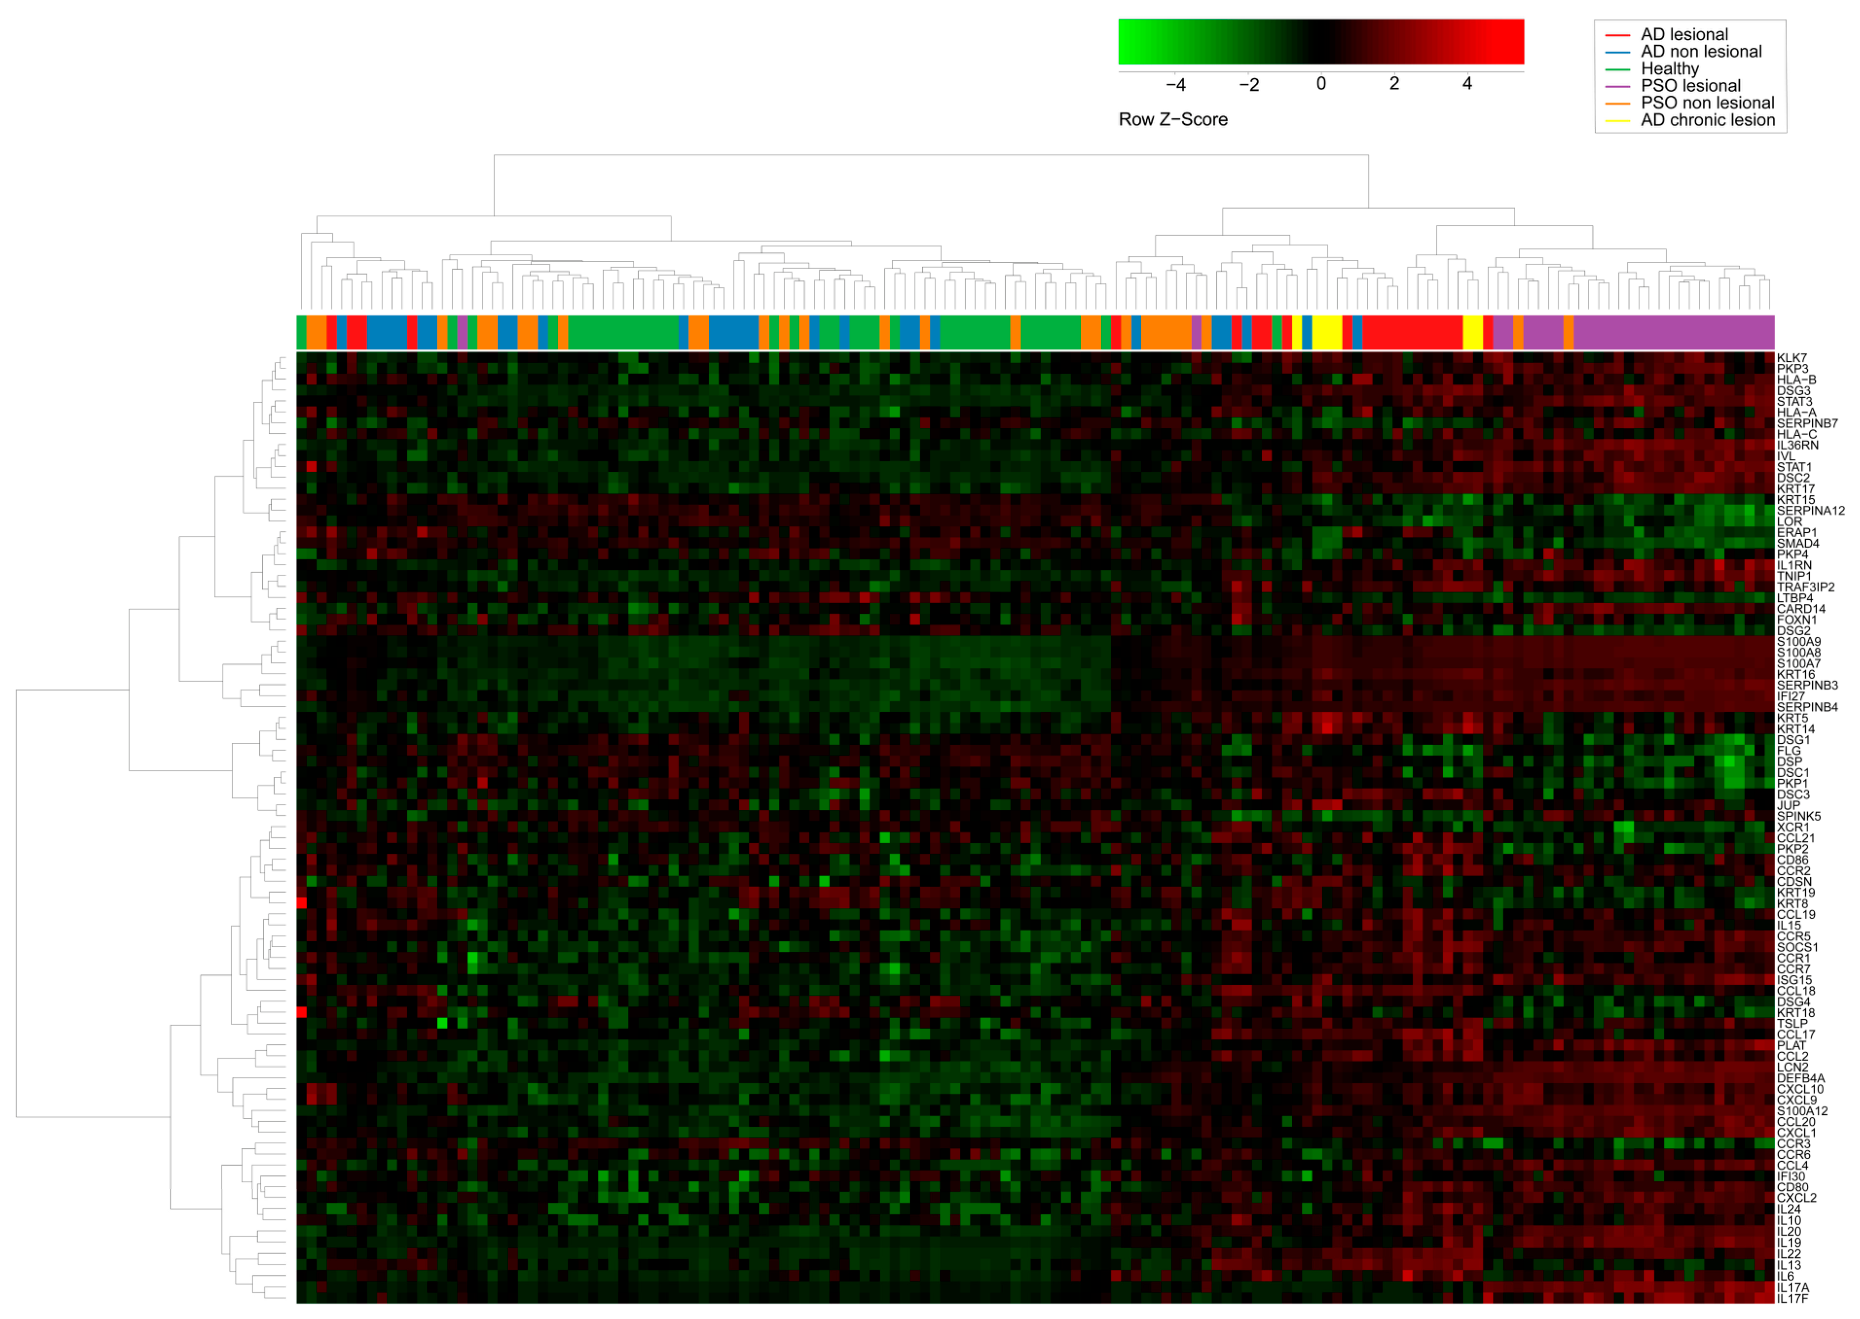
Figure 5.
Volcano plots showing differential gene expression (DGE) analysis performed using the limma R framework. The y-axis represents −log10(adjusted p-value), and the x-axis represents log2 fold change. (A) Psoriasis lesions versus healthy skin. (B) Atopic dermatitis lesions versus healthy skin. Highlighted genes are color-coded according to functional categories, , whereas genes below the horizontal dotted line (dark gray) represent non-significant genes (adjusted p-value ≥ 0.05).
Figure 5.
Volcano plots showing differential gene expression (DGE) analysis performed using the limma R framework. The y-axis represents −log10(adjusted p-value), and the x-axis represents log2 fold change. (A) Psoriasis lesions versus healthy skin. (B) Atopic dermatitis lesions versus healthy skin. Highlighted genes are color-coded according to functional categories, , whereas genes below the horizontal dotted line (dark gray) represent non-significant genes (adjusted p-value ≥ 0.05).
Disclaimer/Publisher’s Note: The statements, opinions and data contained in all publications are solely those of the individual author(s) and contributor(s) and not of MDPI and/or the editor(s). MDPI and/or the editor(s) disclaim responsibility for any injury to people or property resulting from any ideas, methods, instructions or products referred to in the content. |
© 2026 by the authors. Licensee MDPI, Basel, Switzerland. This article is an open access article distributed under the terms and conditions of the Creative Commons Attribution (CC BY) license (http://creativecommons.org/licenses/by/4.0/).
Copyright: This open access article is published under a Creative Commons CC BY 4.0 license, which permit the free download, distribution, and reuse, provided that the author and preprint are cited in any reuse.


