

Submitted:
18 September 2026
Posted:
20 September 2026
You are already at the latest version
Abstract
Cold-pool structure controls the confinement of wintertime ozone and its precursors in Utah’s Uinta Basin. Previous studies have documented difficulty capturing stable cold pools in meteorological models, complicating air-quality simulations when pollutants disperse too readily. Herein, we evaluate the meteorology behind one such high-ozone event on 2 February 2013 withWeather Research and Forecasting (WRF) simulations; chemistry is not simulated. We test sensitivity to Global Forecast System (GFS) or North American Mesoscale (NAM) forcing, domain feedback, boundary-layer and surface-layer schemes, slope-aware radiation, and terrain datasets (fine versus coarse). Across five hourly samples, GFS-driven runs were warmer at the evaluated surface sites, had an approximately 3.6K smaller 50–500m potential-temperature endpoint difference, and a 0.8–1.0ms−1 larger layermean wind-vector magnitude than feedback-matched NAM runs. GFS also retained less mean heat deficit, indicating a weaker modelled cold pool. Heat deficit increased in all four runs from 1400 to 1800 UTC, hence the product separation suggests a state difference without demonstrated faster cold-pool erosion. Toggling feedback and parameterisation settings yielded smaller responses; terrain fineness produced spatial responses that station comparisons could miss. The results guide diagnostics for subsequent air-chemistry modelling, while leaving initial versus lateral forcing, cold-pool depth and basin export for future studies.
Keywords:
winter ozone
; WRF simulation
; meteorological uncertainty
; cold-air pool
; complex terrain
; model resolution
1. Introduction
Wintertime ozone in the Uinta Basin develops within snow-covered, stable lower-atmospheric layers that confine precursors near the surface [1,2,3]. Here we study the meteorology of one such event; chemistry is not simulated. The basin floor, benches and surrounding terrain support strong temperature contrasts and thermally driven slope flows [4,5]. Comparable winter ozone episodes have been documented in Wyoming’s oil-and-gas-producing basins [6,7]; late-winter ozone pollution has also occurred in northern China under different chemical conditions [8]. Herein, we examine a well documented 2013 Uinta Basin episode whose meteorology challenged earlier simulations [2,9,10]. The five hourly samples span early morning through late morning, when daytime heating can begin to erode the cold pool.
Surface observations alone cannot estimate cold-pool depth or the three-dimensional mixing volume supplied to a chemistry model. Evaluation therefore requires complementary diagnostics of potential temperature, lower-layer winds and heat storage, with a clear distinction between observed agreement and modelled structure.
Earlier Uinta Basin ozone modelling demonstrates strong case dependence, so individual cases cannot establish general configuration recommendations [2,9,10]. Related work on particulate matter in Salt Lake City [11] and national air-quality prediction systems [12,13] places these meteorological questions within broader efforts to improve coupled models. Snow cover can strengthen cold pools by increasing albedo, while cloud phase modulates longwave forcing and nocturnal cooling [2]. Snow also affects the light available for ozone production, whose chemical sensitivity changes through the winter [14]. These coupled processes motivate joint meteorological and chemical observations in western basins [15]. Further compounding potential error, the choice of microphysics and domain configuration alters both the cold pool and its representation on atmospheric-chemistry grids. Four-dimensional data assimilation (FDDA) depends on the nudged variables, input analysis and scheme-dependent boundary-layer diagnosis [10]. A subsequent study examined reinitialisation, snow initialisation, and nudging, but assimilated evaluation data and differing samples limit configuration comparisons [16]. These studies motivate the present sensitivity tests: which model choices most affect the meteorology supplied to a simulation of a cold-pool and high-ozone event?
Errors in meteorology, emission inventory, photolysis, etc. may cancel in coupled simulations. While these errors are difficult to extricate, a common difficulty is representing persistent cold-air pools [2,10]. Changing emissions with fixed meteorology can improve ozone agreement without uniquely identifying inventory error [1]. Cumulative changes to these processes complicate attribution, and improved temperature profiles need not improve ozone profiles [9]. Hence credible meteorology reduces this confounding but does not guarantee improved ozone forecasts.
Deploying the Weather Research and Forecasting (WRF) model [17], we test whether the lower-atmospheric response to two different sets of initial and lateral-boundary conditions recurs under one-way (i.e., top-down) and two-way nesting, and compare it with parameterisation-suite and terrain-fineness responses. The diagnostics combine surface skill, the 50–500 m potential-temperature difference, layer-mean horizontal wind-vector magnitude, and mean heat deficit over a delineated area. Together, they describe the simulated cold-pool state, but in focussing our scope we do not estimate ventilation or basin export herein.
We ask:
- 1.
- Does the lower-layer response to different weather-model forcing datasets recur under both feedback modes?
- 2.
- How do changes in domain feedback, boundary-/surface-layer schemes, and slope-aware parameterisations compare with the response to different weather-model forcings?
- 3.
- How does changing the terrain dataset fineness affect the same scenario?
- 4.
- What do the combined diagnostics reveal that in-situ stations may not?
The study contains no chemistry calculation and does not separate initial from lateral-boundary forcing; follow-on work in preparation will connect meteorological representation with air-chemistry modelling for this and related cases.
2. Materials and Methods
2.1. Case, Observations, and Evaluation Domains
The case falls within the January–February 2013 period of snow cover, cold pools and elevated Uinta ozone [1,2,10]. Integrations capture 1200–1800 Coordinated Universal Time (UTC), or 0500–1100 Mountain Standard Time (MST; UTC) on 2 February 2013. Excluding the initialised output and first-hour forecast to reduce spin-up influence leaves 1400–1800 UTC (0700–1100 MST), the longest common retained window (i.e., five hourly samples over four elapsed hours). This morning window samples the transition towards daytime heating but cannot establish a diurnal cycle of cold-pool development and breakup. Data from in-situ stations acquired from Synoptic Data include 2 m temperature at 11 sites, 10 m wind speed at 10 sites, and surface pressure at 9 sites [18]. The temperature sample includes every registered station reporting in the window; Sand Wash had no reports. Subhourly reports were averaged within each UTC clock hour. The stations span the basin floor, sidewalls and benches but are unevenly distributed; their skill scores describe this sample rather than the basin as a whole. We use the 1 km d02 domain because seven stations lie outside the usable d03 interior (Figure 1). Four stations provide temperature context from 31 January 0000 UTC to 4 February 0000 UTC (Figure 3). For the observed and modelled Mountain Home-minus-Pariette Draw index (Figure 6), we calculate surface potential temperature as , with T in kelvin and p in hPa, using the dry-air Poisson relation [19].
Ozone context uses the US Environmental Protection Agency (EPA) Air Quality System (AQS) AirData daily archive for January–February 2013 [20]. We retained the “Ozone 8-hour 2015” daily-summary row at Ouray, Redwash, Roosevelt, Vernal and Little Mountain: one row per site on each of 59 local dates, with within-day coverage of 47–100% marked in the figure. The satellite panel below (Figure 2) uses the National Aeronautics and Space Administration (NASA) Global Imagery Browse Services (GIBS) Terra Moderate Resolution Imaging Spectroradiometer (MODIS) corrected-reflectance 7-2-1 layer for 2 February 2013 [21]. We use spectral absorption and scattering principles described by Liou [22], with snow/cloud colours specified by NASA’s layer documentation [23] to inform interpretation.
2.2. WRF Configuration and Archived Simulation Family
We used WRF version 4.8.0 [17], initialised at 1200 UTC with lateral boundary conditions through 1800 UTC on 2 February 2013. The inputs were the 1200 and 1800 UTC zero-hour GFS grid 004 (0.5∘; gfsanl_4) or NAM grid 218 (12 km; namanl_218) analyses [24,25]. These integrations include temporally interpolated lateral-boundary forcing, so the retained response combines initial-state and boundary influences. Three nested domains, d01–d03, have horizontal spacings of 3 km, 1 km and 333.3 m, with 75 model (eta) levels. Note that GFS and NAM inputs supply 27 and 40 metgrid levels, respectively. The WRF grid has approximately 20 m vertical spacing near the surface and a prescribed 50-hPa model top. The control physics-parameterisation suite comprises Thompson microphysics [26], Rapid Radiative Transfer Model for General Circulation Models (RRTMG) longwave and shortwave radiation [27], the revised fifth-generation Pennsylvania State University–National Center for Atmospheric Research Mesoscale Model (MM5) similarity surface layer [28], the Noah land-surface model [29] and the Yonsei University (YSU) planetary boundary layer (PBL) scheme [30]. No nudging or data assimilation was used. Table 1 lists the simulations analysed here.
The terrain datasets of varying fineness were ingested by the WRF Preprocessing System. The fine, default and coarse sources have spacings of 3 arc seconds, 30-arc-second class and 5 arc minutes, respectively; the coarse source is GMTED2010 [31]. These correspond to approximately 90 m, 900 m and 9 km north–south spacing at N, distinct from WRF horizontal-grid spacing.
Hence, our primary comparison crosses GFS and NAM forcing with one-way and two-way feedback on default terrain (X3, X5, X6 and X10). A controlled contrast pairs runs differing in one designated treatment on the same domain, locations, hours and diagnostic calculation. Snow and other land-surface initial fields remain bundled with the forcing product; the Noah scheme is held fixed.
2.3. Surface and Common-AGL Diagnostics
Surface variables and vertical fields were sampled from the same nearest d02 ( horizontal spacing) column at each station, keeping the model terrain and profile consistent. Station-to-cell distances are 133–594 m, with default-terrain elevation offsets of to m (Appendix Table A6). These pairings retain differences in exposure, slope and land cover; alternative interpolation methods were not tested. Potential temperature was interpolated at the layer bounds; wind components were linearly interpolated every 25 m from 50 to 500 m above ground level (AGL) for height integration. We repeat the eleven-column, five-hour comparison for all nine combinations of 50–500, 50–250 and 100–500 m layers with 10, 25 and 50 m wind integration increments. The bounds define a common shallow layer rather than an observed inversion boundary.
The finite-layer potential-temperature difference is defined as
An increase of potential temperature with height indicates dry static stability [19,32]. The endpoint difference does not locate an inversion top or resolve internal structure: a strong shallow inversion can share the same endpoints as a different profile. In addition, the magnitude of the layer-mean horizontal wind vector was defined as
where the bars denote height means from 50 m to 500 m AGL, not temporal or turbulent averages. We also calculate layer-mean scalar speed and the vector-to-scalar ratio to assess cancellation between winds at different heights. Native PBL height serves as a scheme-dependent companion diagnostic rather than an independent inversion-depth estimate [10].
2.4. Pairing, Aggregation, and Short-Sample Sensitivity
Run differences were paired by location and valid hour, then reduced to one spatial median per hour. Reported five-hour effects are means of those medians; stations are not independent spatially. To explore sensitivity to temporal dependence [33], a circular moving-block calculation drew 20,000 resamples of the five medians using two-hour blocks. Its 2.5th and 97.5th percentiles are descriptive sensitivity bounds for this single case; we emphasise practical effect size without treating them as evidence of statistical significance.
2.5. Area-Integrated Heat Deficit
To represent the cold-pool strength numerically, we adapted the basin heat-deficit formulation of Whiteman et al. [34] and the column implementation of Adler et al. [35]. Using hydrostatic balance, , to express column mass in pressure coordinates [19], we defined
where is dry-air specific heat at constant pressure, g is gravitational acceleration, and are surface and crest-reference pressures. The reference potential temperature is interpolated to the fixed crest height in each modelled column; clipping retains only positive deficits. This potential-temperature proxy then describes stratification relative to that reference. We report its cell-area-weighted mean in MJ m−2: the primary area is the convex hull of eleven stations and eleven basin waypoints, restricted to terrain below 2200 m (4965 d02 cells covering 5277 km2). We tested sensitivity of results to this hull at 2100, 2200 and 2300 m; increasing or eroding the area by one cell; and station-only areas at 2200 m. Given sensitivity of the case to complex terrain, we ensure GFS–NAM contrasts share a terrain dataset.
3. Results
3.1. Observed Episode Context
The MODIS image shows extensive snow and ice across the basin and surrounding terrain (Figure 2a). The AQS series places 2 February within a broader period of elevated ozone, with daily maximum eight-hour concentrations of 56–95 ppb across the five sites (Figure 2b). These observations establish episode context without attributing ozone to the simulated meteorology.
3.2. Observed Surface-Temperature Context
Inspecting a sample of observation stations across a range of altitudes, a representative basin-floor station repeatedly separated from the higher sites between 31 January and 3 February, with strong variation in diurnal temperature differences (Figure 3). Seep Ridge (USU04; 1933 m) appears anomalous, despite a modest station-to-cell distance of 133 m and 3 m terrain offset in the vertical, showing latent limitations in estimating cold-pool strength with observations. Exposure, slope flow and representativeness are possible explanations, but the metadata do not distinguish them. A fresh provider query returned all 17 retained-window samples per requested variable without QC flags, but supplied no exposure history or independent accuracy check. The recurring floor-to-bench separation is consistent with a cold-pool surface pattern; however, the horizontally separated sites cannot determine its vertical structure.
3.3. Overview of Experiment Responses
The forcing-product contrasts give the largest temperature and layer-mean wind responses (Figure 4). The PBL/surface-layer response is smaller; slope-radiation and feedback interaction effects cluster near zero on these scales. Pressure and wind-error metrics have inconsistent trends in time, preventing an overall configuration ranking for this case.
3.4. Driving-Product Response in the Lower Layer
Runs forced with GFS produced a smaller 50–500 m potential-temperature difference than NAM under both feedback modes (Figure 5). Paired GFS-minus-NAM effects averaged K with two-way feedback and K with one-way feedback, consistency borne out by a constant sign at every hour (Table A1). Layer-mean wind-vector magnitude increased by 0.79 and 0.99 m s−1, respectively, also with consistent hourly signs. Scalar-speed differences were similar, and directional cancellation therefore likely does not create the speed ordering (Appendix Table A2). The vector-to-scalar ratio difference was not consistent and hence not analysed further.
The paired GFS-minus-NAM endpoint and wind differences retain their respective signs in every hour across all nine layer/increment combinations. Their magnitudes depend on layer bounds (Appendix Table A3); varying integration increment at fixed bounds changed mean paired wind effects by less than 0.02 m s−1. This tests integration sampling of the same linearly interpolated winds, rather than native vertical resolution or an alternative interpolation method. Native PBL-height differences change sign under both feedback modes, consistent with the diagnostic’s scheme dependence discussed by Tran et al. [10].
3.5. Surface and Spatial Corroboration
Runs forced with GFS were warmer at the surface than NAM, consistent with the common-layer diagnostics (Table A4). The 2 m temperature-bias contrasts were approximately +1.8 ∘C under both feedback modes. Pressure absolute error decreased, while hourly wind-error differences followed no strong pattern. Figure 6 compares the observed bench-minus-floor surface index with the two-way-feedback simulations.
The five-hour mean bench-minus-floor contrast was 16.94 K observed, 17.03 K in X5 (NAM two-way), and 9.95 K in X6 (GFS two-way). Across the area of interest, GFS-minus-NAM near-surface responses were positive on average and concentrated below 500 m AGL under both feedback modes (Table A4).
3.6. Heat Deficit
Runs driven by GFS retained less area-mean heat deficit at every hour in all sensitivity tests (i.e., changing the area’s footprint), with mean paired effects of approximately MJ m−2 under both feedback modes (Table A5). Every run ended with more deficit at 1800 than at 1400 UTC, despite intermittent within-window declines (Figure 7).
3.7. Fine-Terrain Experiments
Replacing YSU/revised-MM5 with Mellor–Yamada–Janjić (MYJ)/Eta schemes [36] on fine terrain with slope radiation (X2 minus X1) increased temperature bias by 0.37 ∘C, reduced wind absolute error by 0.145 m s−1 and increased layer-mean wind-vector magnitude by 0.098 m s−1. All changes were consistent in the 5-h period, but were smaller than the forcing-product impact. The inconsistent temperature- and wind-error changes preclude further commentary on overall scheme behaviour.
Adding slope radiation and shading (X1 minus X0) had negligible effects at basin-floor station columns but produced a spatially organised sidewall skin-temperature response.
3.8. Nest-Feedback and Terrain Fineness
Effects introduced by toggling domain two-way feedback were small for both products: one-way minus two-way contrasts were at most 0.07 K in bulk potential-temperature difference and 0.10 m s−1 in wind-vector magnitude (Table A1). The fine-terrain NAM comparison (X9 minus X0, two-way minus one-way) was similarly small, with block-sensitivity bounds spanning zero for both metrics. Surface wind and pressure changes were negligible, providing no feedback recommendation beyond this case.
3.9. Terrain-Source Tests
The terrain comparisons hold NAM forcing, one-way feedback, WRF grid spacing and YSU/MM5 physics fixed as control. Default-minus-fine (X3 minus X0) had a small d02 response, while a wider default-minus-coarse (X3 minus X4) and fine-minus-coarse (X0 minus X4) terrain experiment gave larger spatial responses. For fine minus coarse at 1600 UTC, the heat-deficit median changed sign between d02 (+0.014 MJ m−2) and d03 ( MJ m−2), while the two d03 section medians were +0.278 and +0.369 K. Figure 8 shows this domain-dependent response; it does not establish a drainage mechanism or a benefit from finer terrain.
4. Discussion
4.1. Forcing-Product Differences in the Lower Layer
The principal result is the GFS–NAM separation under both feedback settings: GFS has a smaller potential-temperature endpoint difference, larger layer-mean wind-vector magnitude, and less heat deficit (weaker modelled cold pool). These differences matter for the meteorology supplied to a chemistry model, but do not measure precursor confinement or residence time. Because emissions, snow, cloud, and photolysis/chemical-mechanism errors can compensate in coupled simulations [1,2,9], forcing-product sensitivity deserves focus in future air-chemistry simulations; ensemble experiments across multiple cases would test its generality.
The modelled d03 Horsepool profiles, sampled near the lowest point in the Basin (and cold-air sink), show product-specific initial states and first-hour evolution (Figure 9). The early profile differences reinforce the need to assess the meteorological inputs before adding chemistry, but cannot separate initial-state influence from lateral-boundary evolution.
4.2. Heat-Deficit Evolution and Spatial Extent
Lower GFS-run heat deficit persisted across all footprint sensitivity tests, but positive net changes in every run do not demonstrate faster cold-pool erosion during the retained window. Indeed, at least a full diurnal cycle is needed to test differences in cold-pool erosion or persistence, and is a topic of the authors’ current research. The forcing-product response was strongest below 500 m AGL and consistent in its mean effect, while its early spatial sign share fell below the predeclared two-thirds criterion (Table A4).
4.3. Parameterisation, Feedback, and Terrain Sensitivities
Parameterisation and feedback effects were smaller than the forcing-product response on the temperature and wind diagnostics. The changes in parameterisation configuration modulated wind error while increasing temperature separation; feedback remained small on both terrain branches. While changes were small, slope radiation and terrain-fineness effects produced spatial responses that in-situ stations could miss. These results favour combining station and spatial diagnostics for a fully three-dimensional analysis (and advancing in time). Finer terrain can reveal geometric detail hidden by a coarse representation, as illustrated by scale-dependent measurements of irregular boundaries [37]. That analogy does not establish aerodynamic roughness or drainage speed in WRF; whether finer terrain changes cold-air pathways or storage remains a question for targeted experiments.
4.4. Observational and Design Limits
A bounded search of accessible holdings found no measured in-basin profile within the exact retained window. A provisional Roosevelt sounding began at 1801:54 UTC [38], just after the window, and has not undergone scientific QC or matched WRF analysis; inaccessible holdings were not treated as empty. Thus the surface comparisons do not validate inversion depth or free-air vertical structure. Separating initial from lateral forcing requires new experiments, while nudging tests require independent observations withheld from assimilation. Longer matched runs and additional cases are needed to assess persistence and generality.
5. Conclusions
We have presented WRF experiments to highlight the sensitivity of cold-pool representation—relevant to the retention of ozone and its precursors—to combined initial and lateral weather-model forcing. We use a well documented winter 2013 case in the Uinta Basin to identify differences among the meteorological simulations. The GFS–NAM contrast produced the largest repeated lower-layer response on the d02 (1-km) domain. Under both feedback modes, GFS-driven runs were warmer at the evaluated surface sites, had an approximately 3.6 K smaller 50–500 m potential-temperature difference, a 0.8–1.0 m s−1 larger wind-vector magnitude and approximately 1.2 MJ m−2 less area-mean heat deficit (weaker cold pool). The heat-deficit separation represents a state offset without demonstrated faster cold-pool erosion.
Nest-feedback effects were small (at most 0.07 K and 0.10 m s−1 on the same layer metrics), while MYJ/Eta increased temperature bias by 0.37 ∘C and reduced wind absolute error by 0.145 m s−1. Slope radiation and terrain effects depended on the spatial definition: the fine-minus-coarse heat-deficit median changed from +0.014 MJ m−2 on d02 to MJ m−2 on d03. These findings support complementary station, layer and basin-wide diagnostics for meteorology supplied to chemistry models, followed by ensemble experiments across multiple cases to examine uncertainty. Targeted forcing experiments, longer matched integrations and independent vertical observations are needed to identify forcing contributions and evaluate inversion depth and persistence; this study establishes neither basin export nor ozone response. Appendix A retains numerical summaries and sampling metadata for reproducibility.
Author Contributions
John R. Lawson: Conceptualization, Methodology, Software, Validation, Formal analysis, Investigation, Data curation, Writing—original draft, Writing—review and editing, Visualisation, and Project administration; Michael J. Davies: Methodology, Software, Validation, Formal analysis, Investigation, Data curation, Visualisation, and Writing—review and editing; Loknath Dhar: Conceptualization, Resources, and Writing—review and editing; Seth N. Lyman: Conceptualization, Writing—review and editing, Supervision, Project administration, and Funding acquisition.
Funding
Funding was provided by the Utah Legislature and Uintah County Special Service District 1. The article processing charge was waived. The funders had no role in the design of the study; in the collection, analyses, or interpretation of data; in the writing of the manuscript; or in the decision to publish the results.
Institutional Review Board Statement
Not applicable.
Informed Consent Statement
Not applicable.
Data Availability Statement
The analysis scripts, derived hourly and paired summaries, heat-deficit tables, selected EPA AQS daily records, run and comparison inventories, provenance records, and promoted figures used for this study are retained in the private working repository. Raw WRF inputs and Synoptic observations remain subject to the respective providers’ access and reuse terms.
Acknowledgments
We acknowledge the University of Utah Center for High Performance Computing for computational resources. We acknowledge Synoptic Data PBC and the contributing networks for surface observations [18]. We thank Brian K. Blaylock for Herbie and SynopticPy, used for source-data retrieval and Synoptic API access [39,40]. Analysis and plotting used NumPy [41], SciPy [42], pandas [43], Polars [44], xarray [45] and Matplotlib [46]. We thank Pamela Gardner for editorial and funding advice and KarLee Zager for continued contributions to collecting data relevant to this project.
Conflicts of Interest
The authors declare no conflict of interest.
Use of Artificial Intelligence
Generative artificial intelligence tools, including Anthropic Claude and OpenAI Codex, were used during manuscript preparation to assist with literature synthesis, provenance and analysis-code review, and drafting and editing. The authors reviewed and edited the resulting material and take responsibility for the content.
Appendix A. Data Tables and Secondary Diagnostics

Table A1.
Paired effects for the default-terrain forcing-product/feedback matrix, averaged over the five hourly spatial medians. Positive temperature values indicate a warmer model-minus-observation bias, positive endpoint-difference values indicate a larger 50–500 m potential-temperature difference, and positive wind-vector values indicate a larger layer-mean wind-vector magnitude. Values are descriptive means for this case.
| Effect | T2 bias (°C) | (K) | (m s−1) |
| GFS − NAM, two-way | +1.79 | -3.63 | +0.79 |
| GFS − NAM, one-way | +1.76 | -3.65 | +0.99 |
| GFS one-way − two-way | +0.07 | -0.07 | +0.10 |
| NAM one-way − two-way | -0.01 | +0.00 | +0.01 |
| Feedback interaction | +0.04 | -0.10 | +0.10 |
Table A2.
Primary-layer wind-metric comparison for the feedback-matched GFS-minus-NAM pairs. Each value is the mean of five hourly paired-station medians. The alignment ratio is the magnitude of the layer-mean vector divided by layer-mean scalar speed.
Table A2.
Primary-layer wind-metric comparison for the feedback-matched GFS-minus-NAM pairs. Each value is the mean of five hourly paired-station medians. The alignment ratio is the magnitude of the layer-mean vector divided by layer-mean scalar speed.
| Feedback | vector magnitude (m s−1) | scalar speed (m s−1) | alignment ratio |
| Two-way | +0.79 | +0.78 | +0.063 |
| One-way | +0.99 | +1.01 | +0.053 |
Table A3.
Layer-bound sensitivity of the GFS-minus-NAM contrasts at the primary 25 m wind integration increment. Each value is the mean of five hourly paired-station medians on d02 over the same eleven columns. is the potential-temperature endpoint-difference contrast; and are the layer-mean vector-magnitude and scalar-speed contrasts, respectively.
| (K) | (m s−1) | (m s−1) | ||||
| Layer (m AGL) | Two-way | One-way | Two-way | One-way | Two-way | One-way |
| 50–500 | -3.63 | -3.65 | +0.79 | +0.99 | +0.78 | +1.01 |
| 50–250 | -2.22 | -2.08 | +0.67 | +0.85 | +0.70 | +0.83 |
| 100–500 | -3.38 | -3.42 | +0.77 | +1.02 | +0.79 | +1.02 |
Table A4.
Surface, spatial, and vertical corroboration for the two GFS-minus-NAM forcing-product contrasts. All values use the 1400–1800 UTC window described in Section 3.5. The first four rows use station samples; the last four use area-weighted diagnostics over the basin-floor delineated area.
Table A4.
Surface, spatial, and vertical corroboration for the two GFS-minus-NAM forcing-product contrasts. All values use the 1400–1800 UTC window described in Section 3.5. The first four rows use station samples; the last four use area-weighted diagnostics over the basin-floor delineated area.
| Diagnostic | Result | Scope |
| 2 m temperature | GFS-minus-NAM bias contrast +1.79 ∘C two-way and +1.76 ∘C one-way; absolute-error differences +1.41 and +1.50 ∘C | Same ordering as the common-AGL endpoint difference |
| 10 m wind | Bias contrast +0.91 and +0.96 m s−1; hourly absolute-error differences change sign | No stable wind-skill ordering |
| Surface pressure | Absolute-error contrast -13.6 Pa two-way and -10.9 Pa one-way; negative in every hour | Opposite ordering from temperature, with small absolute differences |
| Two-site surface index | Observed 12.63–20.21 K; NAM 16.44–18.07 K; GFS 7.35–11.74 K under two-way feedback | Horizontally separated surface contrast, not inversion strength or depth |
| Mean 2 m potential-temperature difference | +0.89 to +1.16 K at 1400–1500 UTC; +2.00 to +2.74 K at 1600–1800 UTC | Positive at all ten pair-hours |
| Footprint sign share | 0.64–0.67 at 1400–1500 UTC; 0.84–0.93 later | Early response is not spatially uniform |
| Low-to-aloft absolute-response ratio | 1.45–3.12 | Response concentrated in the lower atmosphere |
| 50–500 m endpoint-difference contrast | -4.33 to -3.04 K | Negative at all ten pair-hours |
Table A5.
Footprint-mean, vertically integrated heat-deficit contrasts over the 1400–1800 UTC decision window. The primary definition uses the area convex hull with a 2200 m crest (4965 cells, 5277 km2); envelopes span all footprint definitions from sensitivity tests. The values are deterministic descriptive contrasts in MJ m−2.
| GFS − NAM quantity | Two-way pair | One-way pair |
| Mean difference (primary) | -1.23 | -1.25 |
| Hourly range (primary) | -1.50 to -0.97 | -1.53 to -0.99 |
| Hourly envelope (seven definitions) | -1.77 to -0.70 | -1.80 to -0.71 |
| GFS change, 1400–1800 UTC | +0.32 | +0.30 |
| NAM change, 1400–1800 UTC | +0.15 | +0.13 |
| Difference in change (primary) | +0.17 | +0.17 |
Table A6.
Case-window temperature stations and nearest d02 sampling audit. Coordinates and reported elevations are from the registered Synoptic Data PBC metadata; separation is great-circle distance to the sampled cell centre, and the final column is X3 default-terrain model height minus reported station elevation.
| ID | Site | Latitude | Longitude | Elevation (m) | Cell distance (m) | Elevation offset (m) |
| KVEL | Vernal Airport | 40.44295 | -109.51273 | 1604 | 405 | 0.0 |
| QRS | Roosevelt | 40.29430 | -110.00900 | 1588 | 354 | -32.4 |
| QV4 | Vernal | 40.46472 | -109.56083 | 1666 | 408 | -2.0 |
| USU01 | Seven Sisters | 39.98130 | -109.34540 | 1615 | 555 | -3.0 |
| USU02 | Gusher | 40.29350 | -109.65750 | 1550 | 230 | -5.0 |
| USU03 | Mountain Home | 40.43190 | -110.38210 | 2228 | 594 | -5.8 |
| USU04 | Seep Ridge | 39.75390 | -109.54600 | 1933 | 133 | +2.9 |
| USU05 | Wells Draw | 40.06700 | -110.15100 | 1759 | 187 | +10.1 |
| USU07 | Pariette Draw | 40.03460 | -109.83010 | 1465 | 485 | -0.1 |
| USU08 | USU Research Trailer | 40.14370 | -109.46718 | 1570 | 446 | -4.2 |
| UUT01 | Uintah Basin Research Trailer | 40.26560 | -110.04120 | 1561 | 419 | +14.3 |
References
- Ahmadov, R.; McKeen, S.; Trainer, M.; Banta, R.; Brewer, A.; Brown, S.; Edwards, P.M.; de Gouw, J.A.; Frost, G.J.; Gilman, J.; et al. Understanding high wintertime ozone pollution events in an oil- and natural gas-producing region of the western US. Atmospheric Chemistry and Physics 2015, 15, 411–429. [CrossRef]
- Neemann, E.M.; Crosman, E.T.; Horel, J.D.; Avey, L. Simulations of a cold-air pool associated with elevated wintertime ozone in the Uintah Basin, Utah. Atmos. Chem. Phys. 2015, 15, 135–151. [CrossRef]
- Davies, M.J.; Lawson, J.R.; O’Neil, T.; Lyman, S.N.; Zager, K.; Coxson, T.D. Uinta Basin snow shadow: Impact of snow-depth variation on winter ozone formation. Air (Basel) 2025, 3, 22. [CrossRef]
- Lyman, S.; Tran, T. Inversion structure and winter ozone distribution in the Uintah Basin, Utah, U.S.A. Atmos. Environ. 2015, 123, 156–165. [CrossRef]
- Whiteman, C.D. Mountain Meteorology: Fundamentals and Applications; Oxford University Press: New York, NY, USA, 2000. [CrossRef]
- Schnell, R.C.; Oltmans, S.J.; Neely, R.R.; Endres, M.S.; Molenar, J.V.; White, A.B. Rapid photochemical production of ozone at high concentrations in a rural site during winter. Nat. Geosci. 2009, 2, 120–122. [CrossRef]
- Oltmans, S.; Schnell, R.; Johnson, B.; Pétron, G.; Mefford, T.; Neely, III, R. Anatomy of wintertime ozone associated with oil and natural gas extraction activity in Wyoming and Utah. Elementa (Wash., DC) 2014, 2, 000024. [CrossRef]
- Li, K.; Jacob, D.J.; Liao, H.; Qiu, Y.; Shen, L.; Zhai, S.; Bates, K.H.; Sulprizio, M.P.; Song, S.; Lu, X.; et al. Ozone pollution in the North China Plain spreading into the late-winter haze season. Proc. Natl. Acad. Sci. U. S. A. 2021, 118, e2015797118. [CrossRef]
- Matichuk, R.; Tonnesen, G.; Luecken, D.; Gilliam, R.; Napelenok, S.L.; Baker, K.R.; Schwede, D.; Murphy, B.; Helmig, D.; Lyman, S.N.; et al. Evaluation of the Community Multiscale Air Quality Model for Simulating Winter Ozone Formation in the Uinta Basin. J. Geophys. Res. D: Atmos. 2017, 122, 13545–13572. [CrossRef]
- Tran, T.; Tran, H.; Mansfield, M.; Lyman, S.; Crosman, E. Four dimensional data assimilation (FDDA) impacts on WRF performance in simulating inversion layer structure and distributions of CMAQ-simulated winter ozone concentrations in Uintah Basin. Atmospheric Environment 2018, 177, 75–92. [CrossRef]
- Ivey, C.E.; Balachandran, S.; Colgan, S.; Hu, Y.; Holmes, H.A. Investigating fine particulate matter sources in Salt Lake City during persistent cold air pool events. Atmos. Environ. 2019, 213, 568–578. [CrossRef]
- Stajner, I.; NOAA’s FY19 Disaster Supplemental Wildfire 1 Project Team. Development of Next-Generation Air Quality Predictions for the United States. In Proceedings of the EGU General Assembly 2022, Vienna, Austria, 2022. Abstract EGU22-10491,. [CrossRef]
- Huang, J.; Stajner, I.; Montuoro, R.; Yang, F.; Wang, K.; Huang, H.C.; Jeon, C.H.; Curtis, B.; McQueen, J.; Liu, H.; et al. Development of the next-generation air quality prediction system in the Unified Forecast System framework: Enhancing predictability of wildfire air quality impacts. Bull. Am. Meteorol. Soc. 2025. Published online 15 January 2025,. [CrossRef]
- Mansfield, M.L.; Lyman, S.N. Seasonal trends in the wintertime photochemical regime of the Uinta Basin, Utah, USA. Atmospheric Chemistry and Physics 2025, 25, 11261–11274. [CrossRef]
- Hallar, A.G.; Brown, S.S.; Crosman, E.; Barsanti, K.; Cappa, C.D.; Faloona, I.; Fast, J.; Holmes, H.A.; Horel, J.; Lin, J.; et al. Coupled Air Quality and Boundary-Layer Meteorology in Western U.S. Basins during Winter: Design and Rationale for a Comprehensive Study. Bull. Am. Meteorol. Soc. 2021, 102, E2012–E2033. [CrossRef]
- Tran, T.; Tran, H. Uinta Basin Ozone State Implementation Plan Meteorological Modeling: Weather Research and Forecasting (WRF) Model Performance Evaluation. Technical report, Bingham Research Center, Utah State University, Vernal, UT, USA, 2021. Report submitted to the Utah Division of Air Quality, February 2021.
- Skamarock, W.C.; Klemp, J.B.; Dudhia, J.; Gill, D.O.; Liu, Z.; Berner, J.; Wang, W.; Powers, J.G.; Duda, M.G.; Barker, D.M.; et al. A Description of the Advanced Research WRF Model Version 4. NCAR Technical Note NCAR/TN-556+STR, National Center for Atmospheric Research, 2019. [CrossRef]
- Synoptic Data PBC. Mesonet API: Time Series Service. (https://docs.synopticdata.com/services/time-series, accessed 18 September 2026).
- Wallace, J.M.; Hobbs, P.V. Atmospheric Science: An Introductory Survey, 2nd ed.; Academic Press: Burlington, MA, USA, 2006.
- US Environmental Protection Agency. AQS AirData: Daily Ozone Summary, 2013. (https://aqs.epa.gov/aqsweb/airdata/download_files.html, accessed 18 September 2026). File daily_44201_2013.zip; January–February records for Ouray, Redwash, Roosevelt, Vernal and Little Mountain.
- NASA Earth Science Data and Information System. GIBS/Worldview: Terra MODIS Corrected Reflectance (Bands 7-2-1), 2 February 2013. (https://worldview.earthdata.nasa.gov/, accessed 18 September 2026).
- Liou, K.N. An Introduction to Atmospheric Radiation, 2nd ed.; Academic Press: San Diego, CA, USA, 2002.
- NASA Global Imagery Browse Services. MODIS Corrected Reflectance: Band Combinations and Interpretation. (https://github.com/nasa-gibs/worldview-options-eosdis/blob/master/common/config/metadata/modis/CorrectedReflectance.md, accessed 18 September 2026).
- NOAA National Centers for Environmental Information. Global Forecast System Analysis, Grid 004 (0.5°): 2 February 2013, 1200 and 1800 UTC Zero-Hour Analyses. (https://www.ncei.noaa.gov/products/weather-climate-models/global-forecast, accessed 18 September 2026).
- NOAA National Centers for Environmental Information. North American Mesoscale Forecast System Analysis, Grid 218 (12 km): 2 February 2013, 1200 and 1800 UTC Zero-Hour Analyses. (https://www.ncei.noaa.gov/products/weather-climate-models/north-american-mesoscale, accessed 18 September 2026).
- Thompson, G.; Field, P.R.; Rasmussen, R.M.; Hall, W.D. Explicit forecasts of winter precipitation using an improved bulk microphysics scheme. Part II: Implementation of a new snow parameterization. Mon. Weather Rev. 2008, 136, 5095–5115. [CrossRef]
- Iacono, M.J.; Delamere, J.S.; Mlawer, E.J.; Shephard, M.W.; Clough, S.A.; Collins, W.D. Radiative forcing by long-lived greenhouse gases: Calculations with the AER radiative transfer models. Journal of Geophysical Research: Atmospheres 2008, 113, D13103. [CrossRef]
- Jiménez, P.A.; Dudhia, J.; González-Rouco, J.F.; Navarro, J.; Montávez, J.P.; García-Bustamante, E. A Revised Scheme for the WRF Surface Layer Formulation. Monthly Weather Review 2012, 140, 898–918. [CrossRef]
- Tewari, M.; Chen, F.; Wang, W.; Dudhia, J.; LeMone, M.A.; Mitchell, K.; Ek, M.; Gayno, G.; Wegiel, J.; Cuenca, R.H. Implementation and verification of the unified NOAH land surface model in the WRF model. In Proceedings of the 20th Conference on Weather Analysis and Forecasting/16th Conference on Numerical Weather Prediction, 2004. Paper 14.2A. (https://www2.mmm.ucar.edu/wrf/users/physics/phys_refs/LAND_SURFACE/noah.pdf, accessed 18 September 2026).
- Hong, S.Y.; Noh, Y.; Dudhia, J. A New Vertical Diffusion Package with an Explicit Treatment of Entrainment Processes. Monthly Weather Review 2006, 134, 2318–2341. [CrossRef]
- Danielson, J.J.; Gesch, D.B. Global Multi-resolution Terrain Elevation Data 2010 (GMTED2010). Open-File Report 2011–1073, U.S. Geological Survey, 2011. [CrossRef]
- Stull, R.B. An Introduction to Boundary Layer Meteorology; Kluwer Academic Publishers: Dordrecht, The Netherlands, 1988. [CrossRef]
- Wilks, D.S. Statistical Methods in the Atmospheric Sciences, 4th ed.; Elsevier: Amsterdam, The Netherlands, 2019.
- Whiteman, C.D.; Bian, X.; Zhong, S. Wintertime Evolution of the Temperature Inversion in the Colorado Plateau Basin. Journal of Applied Meteorology 1999, 38, 1103–1117. [CrossRef]
- Adler, B.; Wilczak, J.M.; Kenyon, J.; Bianco, L.; Djalalova, I.V.; Olson, J.B.; Turner, D.D. Evaluation of a cloudy cold-air pool in the Columbia River basin in different versions of the High-Resolution Rapid Refresh (HRRR) model. Geoscientific Model Development 2023, 16, 597–619. [CrossRef]
- Janjić, Z.I. The Step-Mountain Eta Coordinate Model: Further Developments of the Convection, Viscous Sublayer, and Turbulence Closure Schemes. Monthly Weather Review 1994, 122, 927–945. [CrossRef]
- Mandelbrot, B. How long is the coast of Britain? Statistical self-similarity and fractional dimension. Science 1967, 156, 636–638. [CrossRef]
- University of Utah. UBOS Observation Page: Provisional Roosevelt Soundings, 2013. (https://www.inscc.utah.edu/~u0198116/ubos/obs.html, accessed 18 September 2026). Roosevelt record Roosevelt_02022013_1802UTC.txt.
- Blaylock, B.K. Herbie: Retrieve Numerical Weather Prediction Model Data. Computer software. (https://github.com/blaylockbk/Herbie, accessed 18 September 2026),. [CrossRef]
- Blaylock, B.K. SynopticPy: Synoptic API for Python. Computer software. (https://github.com/blaylockbk/SynopticPy, accessed 18 September 2026).
- Harris, C.R.; Millman, K.J.; van der Walt, S.J.; Gommers, R.; Virtanen, P.; Cournapeau, D.; Wieser, E.; Taylor, J.; Berg, S.; Smith, N.J.; et al. Array programming with NumPy. Nature 2020, 585, 357–362. [CrossRef]
- Virtanen, P.; Gommers, R.; Oliphant, T.E.; Haberland, M.; Reddy, T.; Cournapeau, D.; Burovski, E.; Peterson, P.; Weckesser, W.; Bright, J.; et al. SciPy 1.0: Fundamental Algorithms for Scientific Computing in Python. Nature Methods 2020, 17, 261–272. [CrossRef]
- McKinney, W. Data Structures for Statistical Computing in Python. In Proceedings of the 9th Python in Science Conference, 2010, pp. 56–61. [CrossRef]
- Polars developers. Polars User Guide. (https://docs.pola.rs/, accessed 18 September 2026).
- Hoyer, S.; Hamman, J.J. xarray: N-D labeled Arrays and Datasets in Python. Journal of Open Research Software 2017, 5, 10. [CrossRef]
- Hunter, J.D. Matplotlib: A 2D Graphics Environment. Computing in Science & Engineering 2007, 9, 90–95. [CrossRef]
Figure 1.
Geographic and sampling orientation for the evaluation. (a) The d02 terrain, reporting stations, and d03 interior define the common evaluation setting. (b) The d01–d02–d03 WRF grid layout places that setting within the full three-domain configuration. The d02 domain contains all eleven reporting stations; d03 contains four usable station columns.
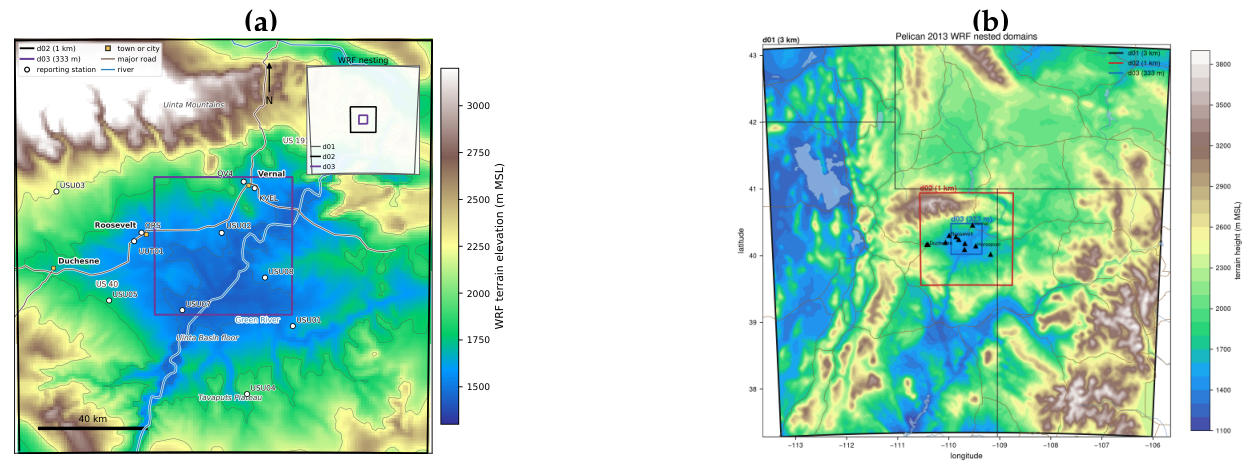
Figure 2.
Observed context for the 2 February 2013 simulation date. (a) NASA GIBS Terra MODIS corrected reflectance, bands 7-2-1, for the 2 February calendar day; snow and ice generally appear cyan, most liquid cloud appears white, and ice cloud may also appear cyan. (b) EPA AQS first maximum value (the eight-hour ozone daily-summary row) at Ouray, Redwash, Roosevelt, Vernal, and Little Mountain. These values use the current EPA daily-summary archive rather than a reconstruction of earlier studies’ observation processing. Hollow markers identify the seven site-days with less than 75% within-day observation coverage.
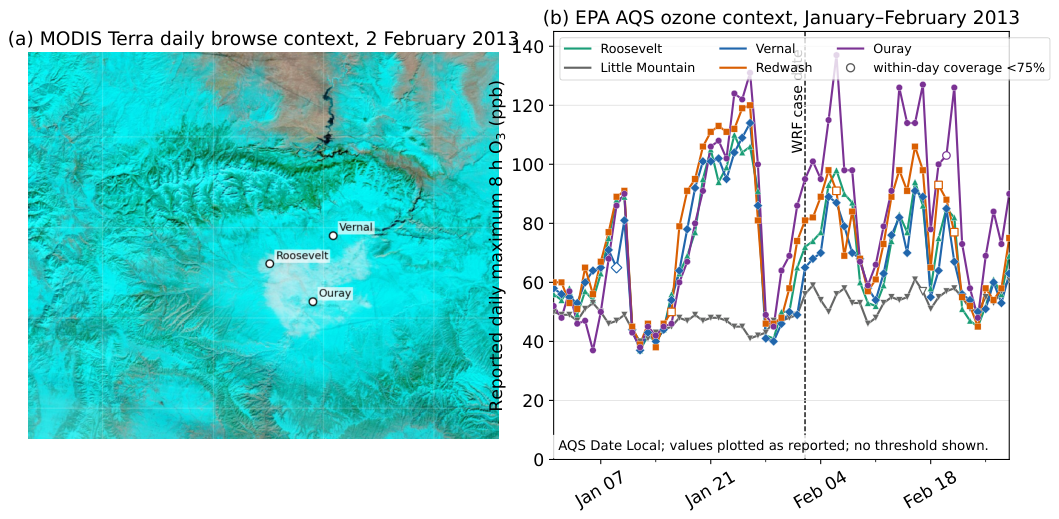
Figure 3.
Observed 2 m-temperature evolution at four elevation-spanning Uinta Basin stations from 31 January through 3 February 2013. Shading indicates approximate local night. The series show a spatial surface-temperature pattern, not a co-located vertical profile.
Figure 3.
Observed 2 m-temperature evolution at four elevation-spanning Uinta Basin stations from 31 January through 3 February 2013. Shading indicates approximate local night. The series show a spatial surface-temperature pattern, not a co-located vertical profile.
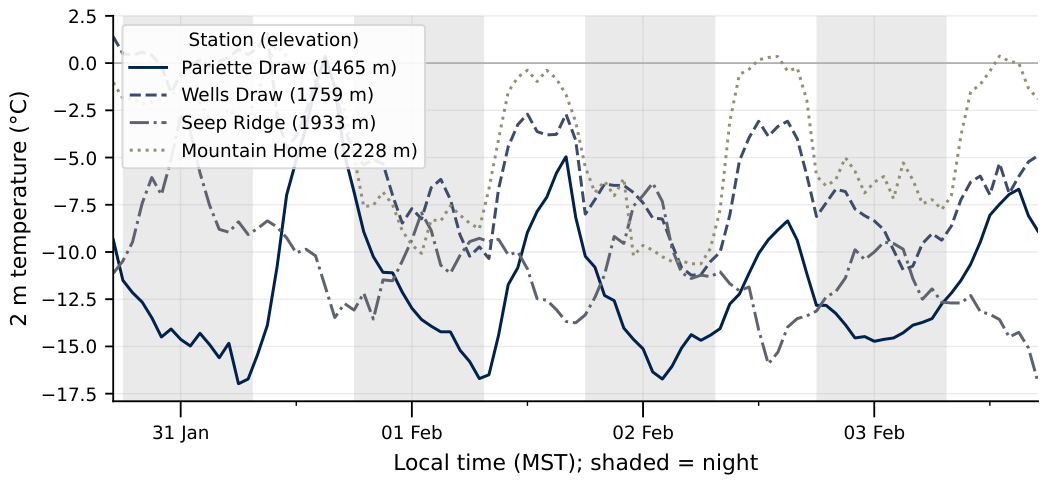
Figure 4.
Mean five-hour effects for the controlled comparisons that share the station/common-AGL pipeline. Colours and marker shapes identify forcing-product, feedback, and interaction contrasts. Whiskers show descriptive block-sensitivity intervals for five dependent hourly medians.
Figure 4.
Mean five-hour effects for the controlled comparisons that share the station/common-AGL pipeline. Colours and marker shapes identify forcing-product, feedback, and interaction contrasts. Whiskers show descriptive block-sensitivity intervals for five dependent hourly medians.
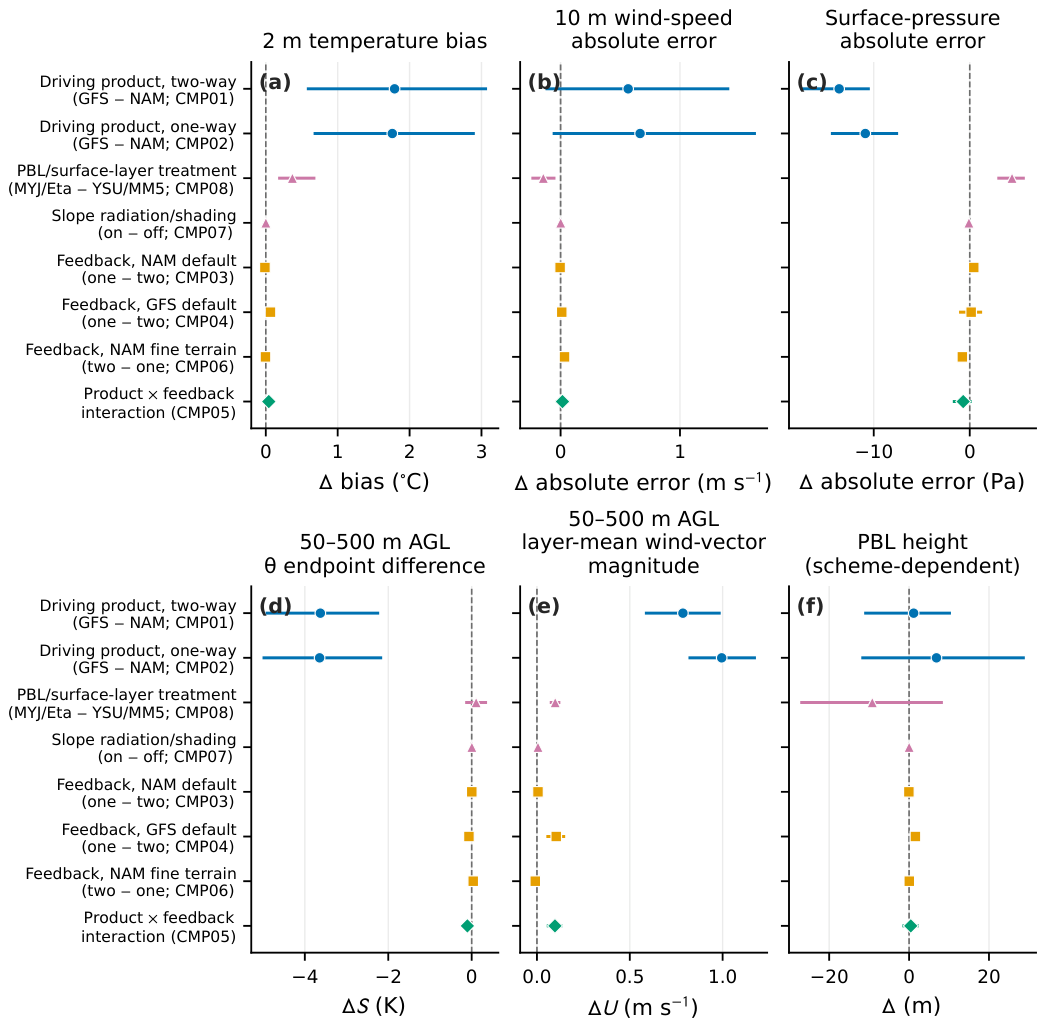
Figure 5.
Station-column medians and interquartile ranges for the 50–500 m AGL potential-temperature endpoint difference and layer-mean wind-vector magnitude over the matched window. Solid lines denote two-way feedback and dashed lines denote one-way feedback. Both feedback modes retain the GFS–NAM ordering throughout the window.
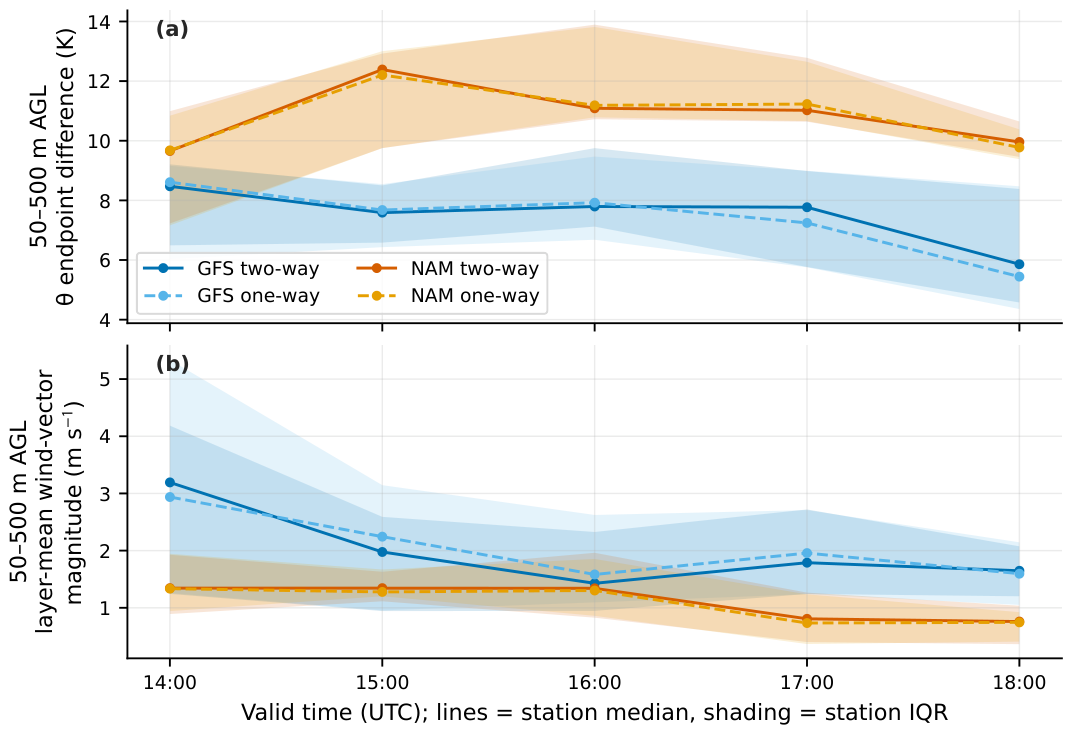
Figure 6.
Observed and modelled Mountain Home-minus-Pariette Draw surface potential-temperature contrast from 1400 to 1800 UTC on 2 February 2013. The modelled series are X6 (GFS two-way) and X5 (NAM two-way) on d02, sampled at the same five hours as the observations. The index is a horizontally separated bench-minus-floor surface contrast.
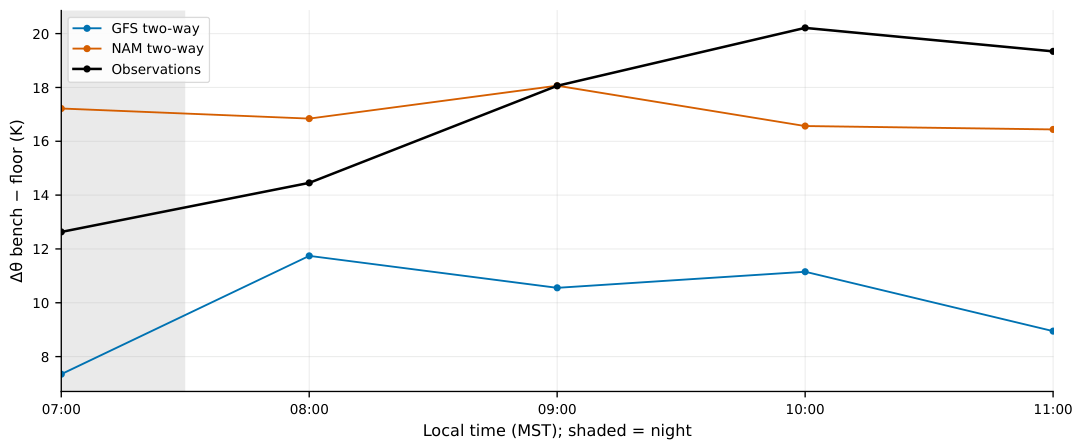
Figure 7.
Footprint-mean heat-deficit trajectories for the four default-terrain matrix members and seven-definition sensitivity envelopes for the two GFS-minus-NAM pairs. The 1300 UTC values orientate the trajectories but are excluded from every reported criterion and effect. GFS-driven runs retain a smaller deficit throughout, but the deficit does not decline faster in either GFS-based member.
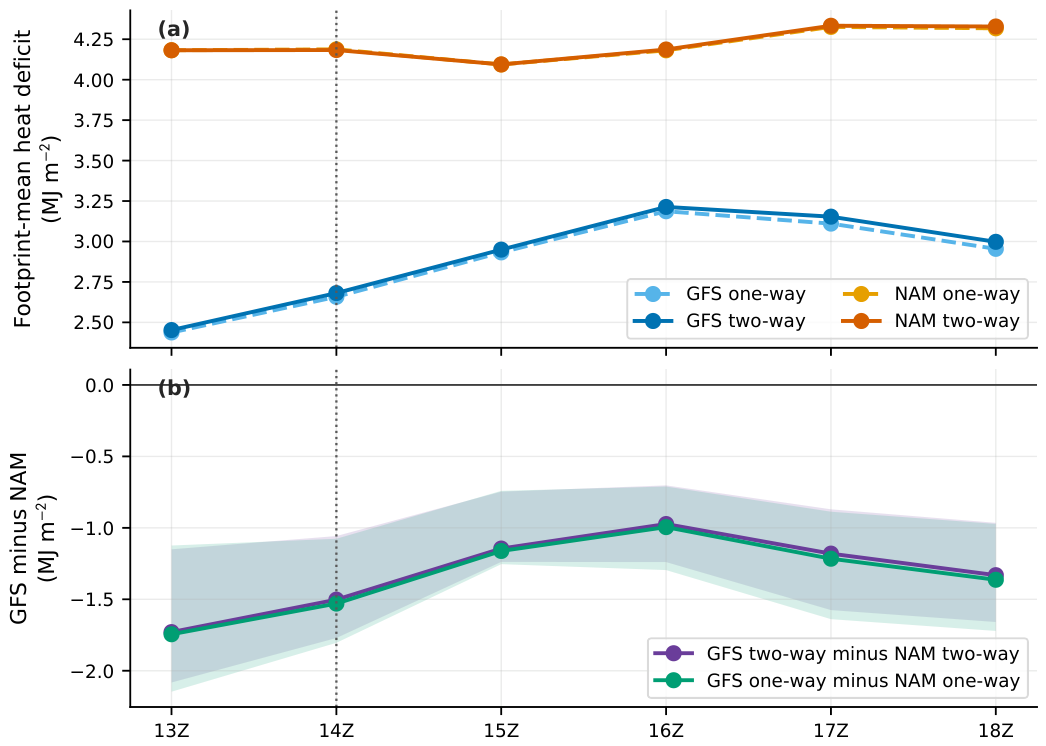
Figure 8.
Diagnostic response to the widest controlled terrain comparison at 1600 UTC, calculated as X0 minus X4 (fine 3-arc-second minus coarse 5-arc-minute source). (a) The basin-wide d02 and (b) inner-basin d03 top-down heat-deficit maps share a fixed MJ m−2 scale. (c) The north–south and (d) west–east d03 lower-atmosphere potential-temperature sections share a fixed K scale and the 2200 m crest reference.
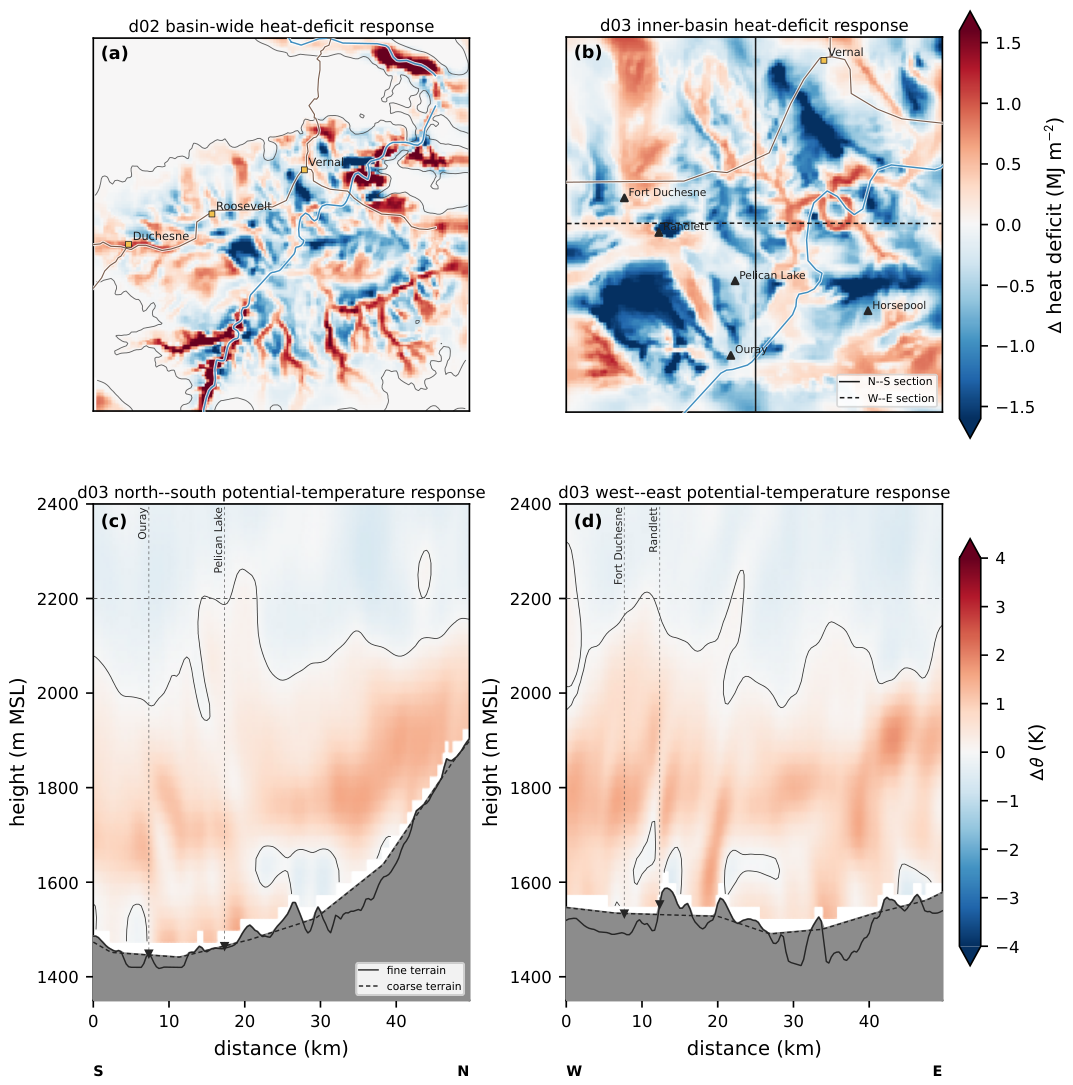
Figure 9.
Model d03 () potential-temperature profiles at Horsepool for X6 (GFS) and X5 (NAM). (a) The 1200 UTC initialised states and (b) the 1300 UTC one-hour forecasts use identical axes. Grey shading marks levels below the local model terrain, and the dashed 2200 m line is the fixed crest reference rather than an observed cold-pool top.
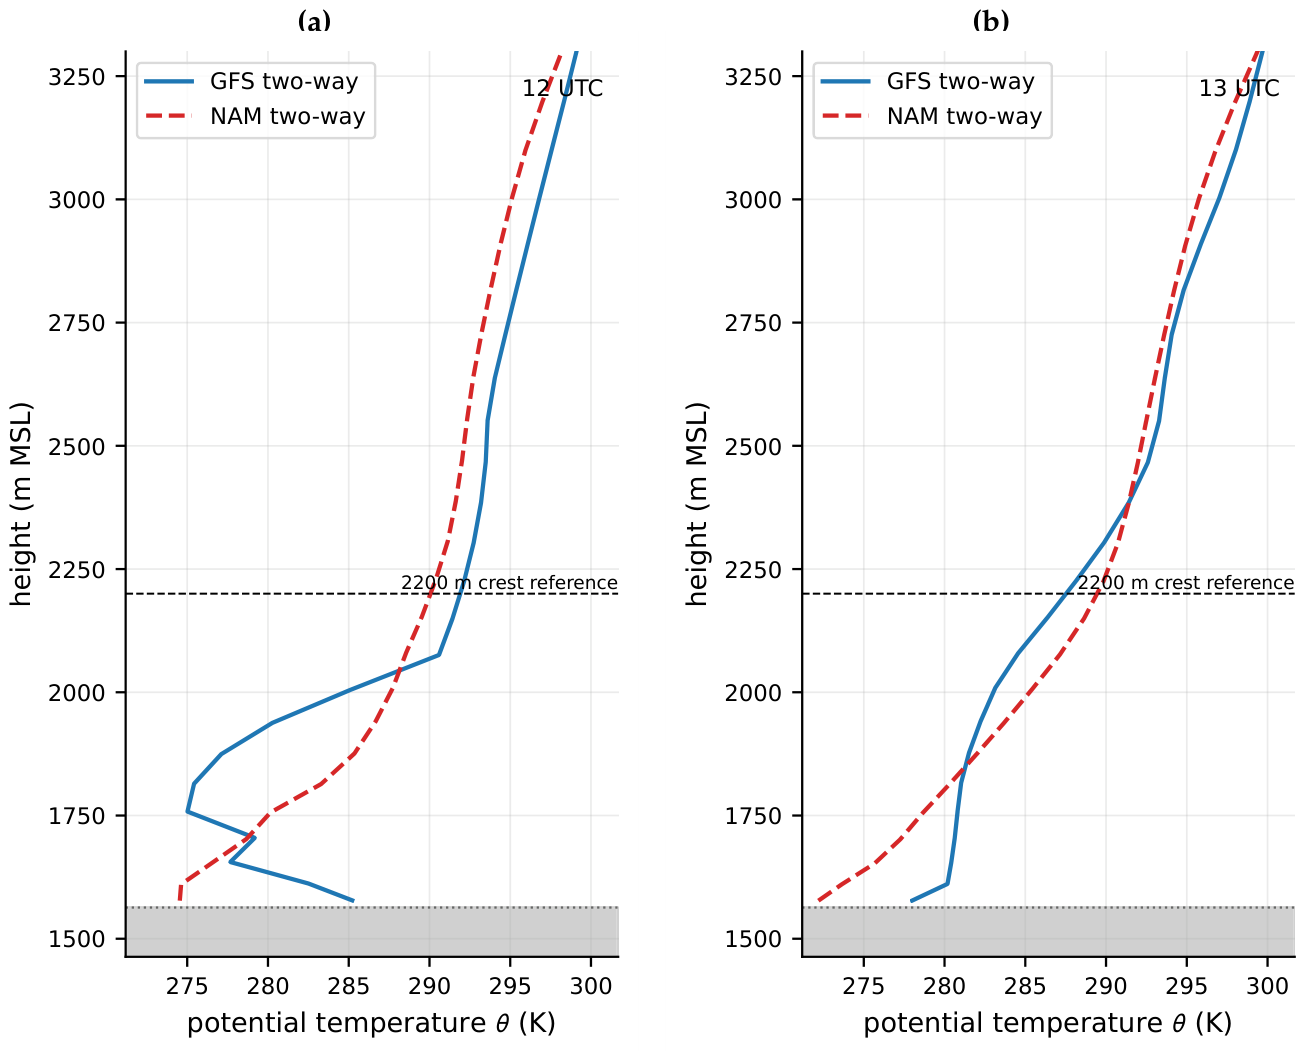
Table 1.
Simulations analysed in this study. Every run uses WRF 4.8.0, three nests at 3/1/0.333 km with 75 levels, Thompson microphysics, RRTMG radiation, and Noah land surface unless stated. “Fine terrain” is the custom 3-arc-second source, “default terrain” is 30-arc-second class, and “coarse terrain” is the 5-arc-minute GMTED2010 source.
| Code | Product, feedback | Terrain and physics |
| X0 | NAM, one-way | fine terrain, YSU/MM5 |
| X1 | NAM, one-way | X0 plus slope radiation and shading |
| X2 | NAM, one-way | X1 with MYJ/Eta instead of YSU/MM5 |
| X3 | NAM, one-way | default-terrain reference configuration |
| X4 | NAM, one-way | deliberately coarse 5-arc-minute terrain |
| X5 | NAM, two-way | default terrain |
| X6 | GFS, two-way | default terrain |
| X9 | NAM, two-way | X0 with two-way feedback |
| X10 | GFS, one-way | default terrain |
Disclaimer/Publisher’s Note: The statements, opinions and data contained in all publications are solely those of the individual author(s) and contributor(s) and not of MDPI and/or the editor(s). MDPI and/or the editor(s) disclaim responsibility for any injury to people or property resulting from any ideas, methods, instructions or products referred to in the content. |
© 2026 by the authors. Licensee MDPI, Basel, Switzerland. This article is an open access article distributed under the terms and conditions of the Creative Commons Attribution (CC BY) license (http://creativecommons.org/licenses/by/4.0/).
Copyright: This open access article is published under a Creative Commons CC BY 4.0 license, which permit the free download, distribution, and reuse, provided that the author and preprint are cited in any reuse.