

Submitted:
17 July 2026
Posted:
17 July 2026
You are already at the latest version
Abstract
Strategic noise maps represent a valuable tool for the characterisation of urban soundscapes, but their transformation into indicators related to the exposed population and health effects remains a matter of methodology, particularly in the absence of dwelling-level information. A workflow at the façade level for the estimation of population exposure to road-traffic noise and high sleep disturbance in six sampled sectors of Quito, Ecuador, is developed and tested. The workflow combines outputs from strategic noise maps, cadastral and land-use data, population of census sectors, receiver levels on façades, and three alternative methods of population assignment consistent with CNOSSOS-EU. Sectors were also classified by urban-methodological complexity to assess whether sensitivity of exposure estimates varies across urban fabrics. Results indicate that methodological uncertainty is strongly conditioned by urban configuration. Sensitivity was greatest in dense and morphologically complex sectors, where alternative population-assignment methods produced substantially different estimates of both exposure and high sleep disturbance. These findings suggest that urban form influences not only acoustic exposure itself, but also the reliability and interpretation of health-oriented noise indicators. At the aggregate level, estimated HSD varied from 283.8 under M2 to 718.5 under M1, a 2.5-fold difference. The greatest burdens were focused in San Bartolo and Solanda. The proposed workflow presents a clear and replicable method for turning noise maps into actionable exposure and health indicators in data-limited urban contexts.
Keywords:
road traffic noise
; population exposure
; façade receivers
; CNOSSOS-EU
; high sleep disturbance
; strategic noise mapping
; urban complexity
1. Introduction
As a major aspect of urban sustainability and public health, environmental noise is becoming more widely recognised. Road traffic continues as the predominant source of community noise disturbance in almost all cities because it is found everywhere, is directly related to land usage, and is difficult to reduce without coordinated action between transportation and urban planning. There is a growing amount of supporting evidence from epidemiological, experimental and review studies linking long-term environmental noise exposure to negative effects other than hearing, the most common of which are annoyance and sleep disturbance, which can result in cardiovascular disease through chronic stress response systems [1,2,3,4,5]. The World Health Organisation (WHO) has responded to this growing body of evidence by producing recommendations for reducing the harmful effects of environmental noise on human health, including an emphasis on reducing night-time exposure to environmental noise to improve the quality of sleep [6]. A crucial change in modern-day management of noise is observed in these developments; we can now model sound levels, but the focus will be on quantifying who is impacted, and how these impacts should be communicated through indicators that can be easily understood for use in planning and health-related policy.
Regulatory frameworks have reinforced this transition by linking strategic noise mapping with population-exposure reporting. In Europe, the Environmental Noise Directive established a common framework for assessing and managing environmental noise through strategic noise maps and action plans, using harmonised indicators such as Lden and Lnight (Directive 2002/49/EC, 2002). Subsequent developments, including CNOSSOS-EU, have aimed to improve the consistency and comparability of noise assessment methods [7,8], while more recent requirements incorporate the estimation of harmful effects, including high annoyance and high sleep disturbance, through exposure–response relationships [9,10]. Although these instruments were developed for the European context, they provide a useful methodological reference for cities where local procedures for estimating exposed population and health-related noise indicators are still being developed [11].
Although strategic noise maps have improved the spatial description of urban acoustic environments, translating them into population-exposure estimates remains methodologically challenging [12]. Noise maps can identify where sound levels are high, but they do not indicate how residents are distributed within that acoustic environment. Population data are often available only at aggregated administrative scales, such as census sectors, whereas exposure is ideally estimated at the level of buildings, façades or dwellings. This mismatch requires that census population counts be redistributed to residential buildings using spatial proxies, for example, footprint area, number of floors, building volume, or land-use classification.
The subsequent assignment of residents to acoustic values is a step that can be considered critical. When dwelling-level information is unavailable, different assumptions must be made about how the population of a building is distributed across the façade receivers. These assumptions may either be part of embedded software routines or reported very briefly, though they can have a large impact on the final number of exposed residents and the health-burden estimate to be associated with it. In dense or mixed-use urban areas, especially where façade exposure can vary greatly within the same building, an acoustic condition together with a default assignment rule can shape mitigation priorities as much as the underlying acoustic condition itself [13].
Another issue is with the height dimension for calculating exposure to the environment. The construction of strategic maps typically occurs using a constant reference height (4m) for comparability across assessments and for meeting regulatory requirements (e.g. Directive 2002/49/EC). However, this creates incongruity with vertically-stacked multi-residential buildings because the levels of the building façades will differ by height in relation to where the barriers between sources and receivers are located. Therefore, in relation to façade-based receiver approaches there still needs to be decisions made regarding which metric to use in determining how much exposure occurred from the maximum façade height for the receiver of that particular source (e.g. use of the Maximum Façade Height vs Energy-Mean) and then make a decision as to how to distribute the amount of exposure between all the floors of the building given that the total number of residents is distributed throughout all of the floors of the building [14]. The decision made here (and there) is clearly an important consideration in urban areas that have different types of buildings (e.g. single family, multi-family; i.e. multi-residential, mixed use, commercial) and of varying heights.
Many developing cities face these issues, at which time the demographic and ownership data for residential properties are usually absent but traffic is heavily impacted by the density of roads in close proximity to them [15,16]. Quito, Ecuador, serves as an example of multiple urban design strategies and road corridors that cross through or are close to housing units. A previous study demonstrated the successful establishment of the roadmap for managing urban noise levels in Quito; this project also shows that strategic mapping of traffic and roadway noise can be performed at the city level [17]. Previous work also provides the foundation for implementing the next phase in terms of noise exposure with an existing noise map currently under development; as such, the next phase of this effort will be to provide a more comprehensive approach to exposing populations to noise through the utilization of new policies and procedures.
This study develops and applies a GIS-based, façade-oriented workflow for estimating population exposure to road-traffic noise in Quito, Ecuador. The workflow links strategic noise-map outputs, cadastral and land-use information, census-sector population data, and façade receiver levels to estimate exposed population under three CNOSSOS-consistent population-assignment methods. By comparing these methods across urban sectors with contrasting morphologies, the study investigates whether methodological uncertainty is itself conditioned by urban configuration and whether this interaction can substantially alter estimates of noise-related health burden. The aim is to examine how urban configuration conditions methodological sensitivity and influences the translation of noise maps into health-oriented indicators.
2. Methodology
This study applies a façade-based workflow to estimate population exposure to road-traffic noise and the associated burden of high sleep disturbance in selected urban sectors of Quito, Ecuador. The workflow links road-traffic noise indicators, cadastral and land-use information, census-sector population data, and façade receiver levels. Three CNOSSOS-consistent population-assignment methods were compared in order to assess how different assumptions about the distribution of residents across building façades affect exposure and health-burden estimates.
Figure 1.
Façade-based workflow for estimating population exposure to road-traffic noise and high sleep disturbance in the sampled sectors of Quito.
Figure 1.
Façade-based workflow for estimating population exposure to road-traffic noise and high sleep disturbance in the sampled sectors of Quito.
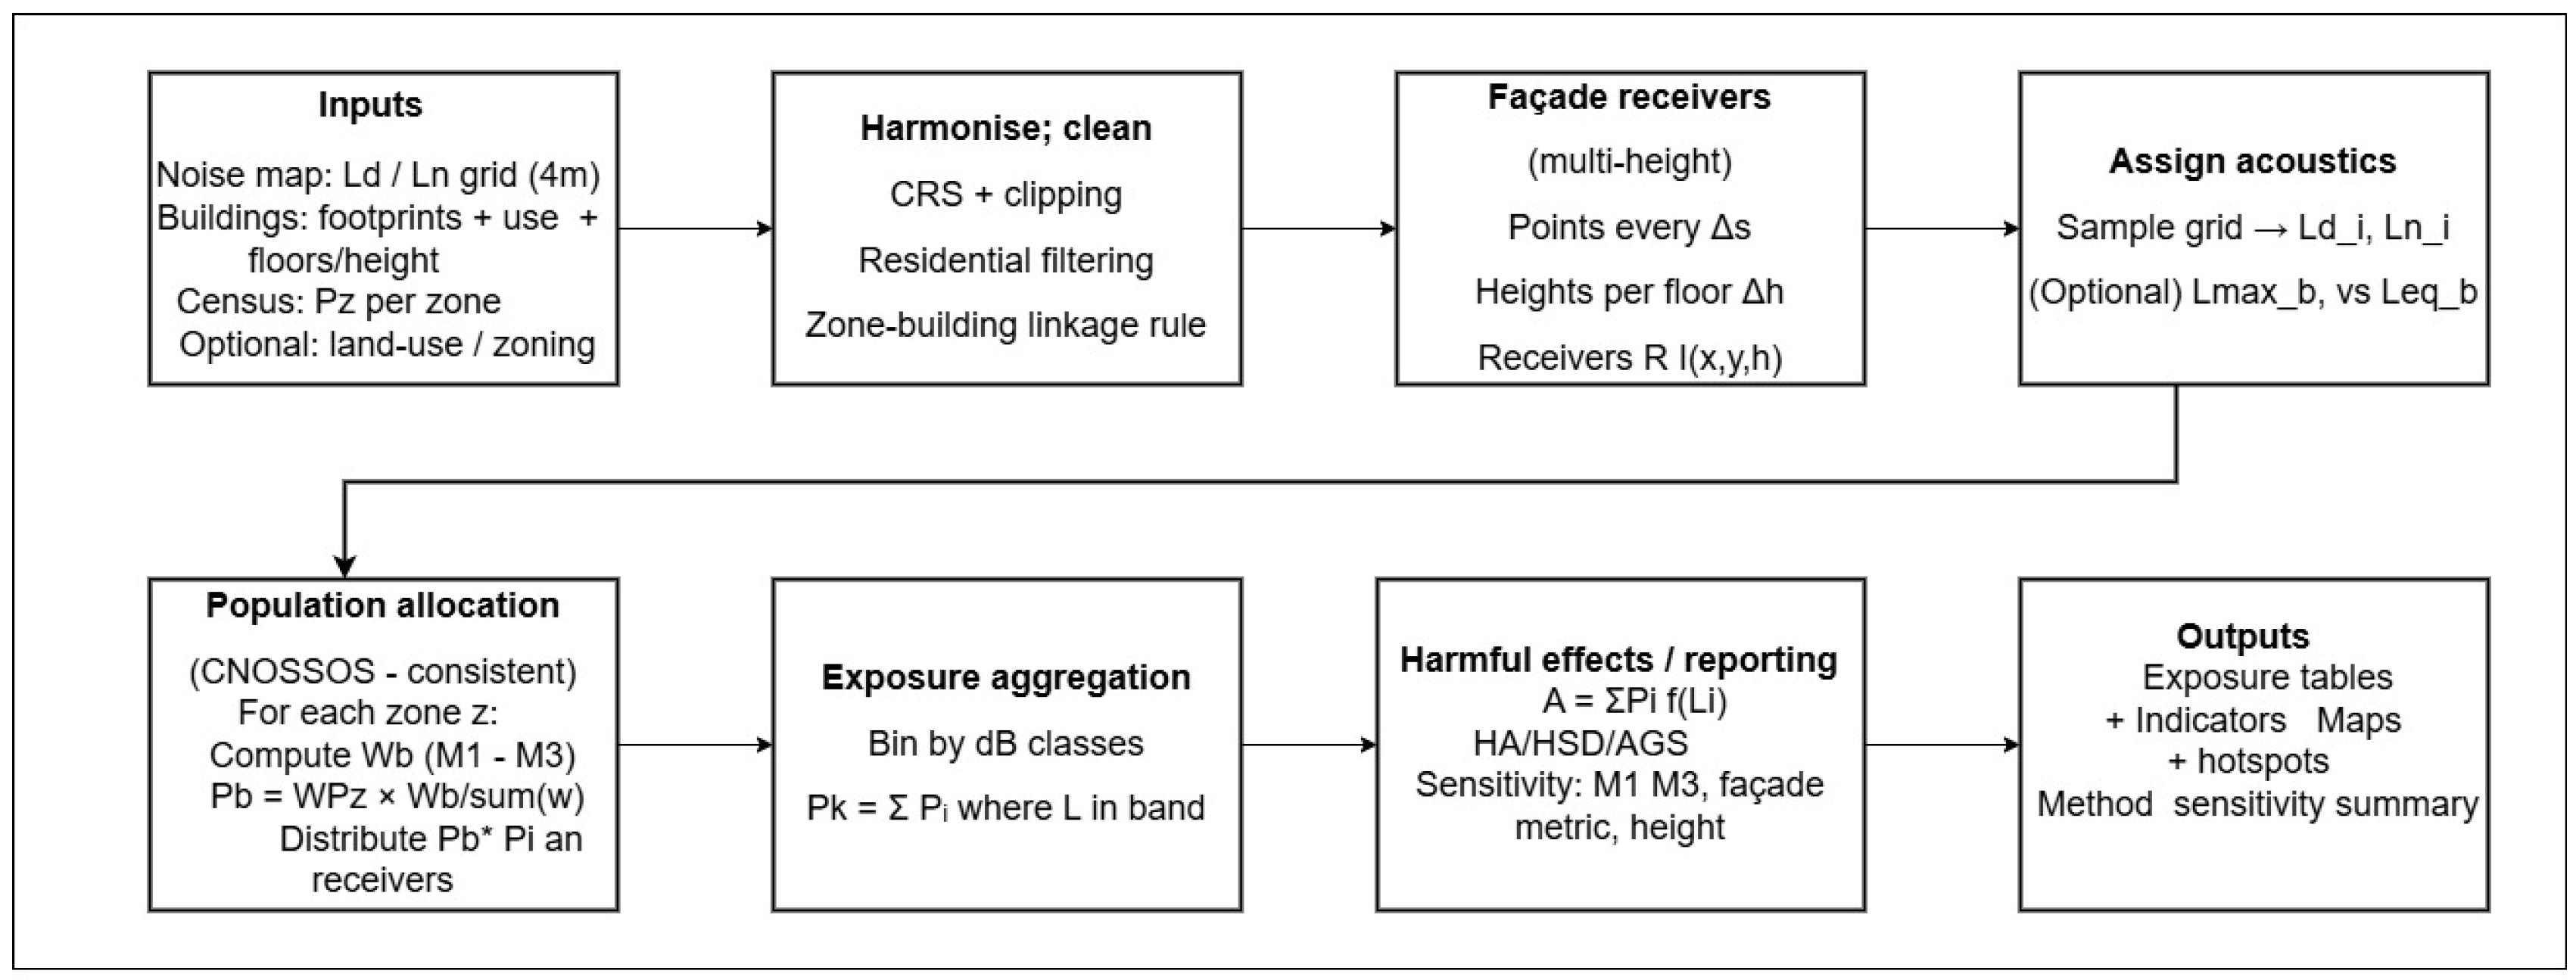
The methodological process consisted of six main stages: selection and classification of the sampled sectors, preprocessing of spatial and alphanumeric datasets, identification of eligible residential buildings, allocation of census population to buildings, assignment of residents to façade receiver levels, and estimation of exposure and high sleep disturbance indicators. The methodology was implemented in all sectors to maintain comparability across urban complexity groups and population-assignment methods.
2.1. Study Area, Input Data and Sector Classification
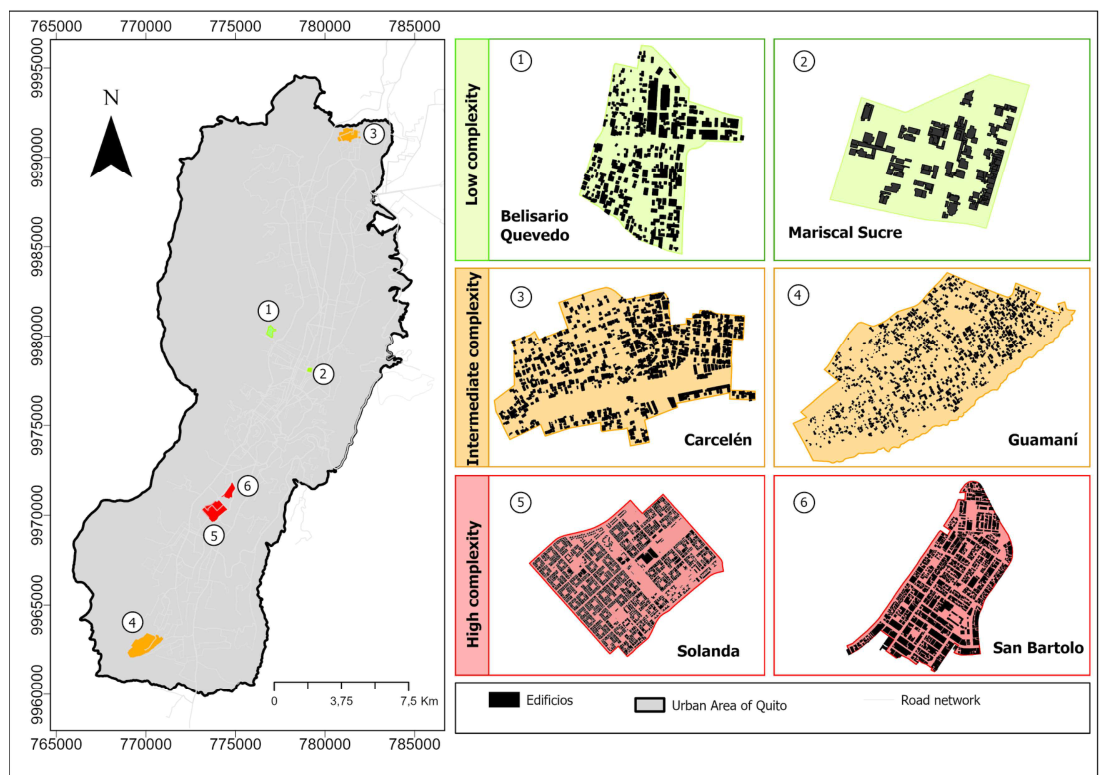
The analysis was conducted in six sampled urban sectors: Mariscal Sucre, Belisario Quevedo, Carcelén, Guamaní, San Bartolo, and Solanda. These sectors were classified into three levels of urban-methodological complexity: lower, intermediate and high complexity.
The classification was based on expert assessment of the urban fabric and processing difficulty, considering factors such as sector size, building density, expected number of façade receivers, presence of adjoined buildings, geometric fragmentation, and the expected difficulty of linking buildings, receivers and population attributes.
This classification was not intended to represent acoustic risk directly. Instead, it was used as a diagnostic variable to interpret where the workflow is expected to be more sensitive to preprocessing decisions and assumptions on population assignment.

Table 1.
Classification of sampled sectors by urban-methodological complexity.
| Complexity group | Sector |
Total inhabitants, census sector |
Main methodological interpretation |
| Lower | Mariscal Sucre | 277 | More controlled geometry and smaller residential sample |
| Lower | Belisario Quevedo | 3,024 | Lower geometric conflict and more manageable preprocessing |
| Intermediate | Cercelén | 6,659 | Larger sector and increased geometric processing needs |
| Intermediate | Guamaní | 7,648 | Larger sector, moderate density and more variable building configuration |
| High | San Bartolo | 8,332 | Dense urban fabric, higher façade heterogeneity and greater sensitivity to assignment rules |
| High | Solanda | 29,844 | Large and dense sector with complex building–receiver relationships |
The workflow required four main categories of spatial and alphanumeric data:
• Noise mapping outputs, including day and night road-traffic noise indicators;
• Cadastral and building data, including building footprints, construction units, number of floors and property attributes;
• Land-use and parcel data, used to identify residential buildings and exclude non-residential or insufficiently characterized structures;
• Census population data, available at the census-sector level.
All spatial layers were harmonized in a common coordinate reference system before processing. The input layers were clipped to each sampled sector and checked for geometry validity, duplicate elements, missing attributes and inconsistent values.
2.2. Workflow Overview and Data Preprocessing
Prior to estimating population exposure, all spatial and alphanumeric datasets were pre-processed and quality-controlled to maintain consistency among the cadastral, demographic, land-use, and acoustic layers and to minimize error propagation into the population allocation and exposure estimation stages [18].
The geospatial preprocessing included the harmonisation of coordinate reference systems, the clipping of input layers to the boundaries of each sampled sector, and the verification of building geometries. Particular attention was given to overlapping, duplicated or fragmented building features, since these inconsistencies may affect both the estimation of building volume and the association between buildings and façade receivers [19]. The cadastral attributes were also reviewed to identify missing, null or inconsistent values, especially those related to number of floors, land use and property characteristics.
Figure 2.
Location of the six sampled sectors in Quito and their classification by urban-methodological complexity.
Figure 2.
Location of the six sampled sectors in Quito and their classification by urban-methodological complexity.
The validation of building height information was a critical component of the preprocessing stage. Since the allocation of census population to residential buildings was based on building volume, errors in the number of floors could directly lead to overestimation or underestimation of the number of residents assigned to each building. This is why implausible values in the floor attributes were checked and corrected where sufficient support information was available. In cases where the number of floors was not available or was considered unreliable, the affected buildings were either handled as per the imputation rule adopted or excluded if the uncertainty was too high.
The façade receiver dataset was reviewed prior to the population-assignment methods. Acoustic outputs that were invalid (e.g., negative or non-physical sound-pressure values) were removed from the analysis. This was done to ensure that no problems arose from having duplicated, misplaced, or unnecessary receiver points which could distort the distribution of residents across exposure classes. The placement of receivers was checked within dense urban configurations, especially where buildings were adjoined or closely spaced, to avoid any problems with duplicated, misplaced, or unnecessary receiver points that could distort the distribution of residents across exposure classes.
The preprocessing stage was particularly important in sectors with higher urban-methodological complexity, where dense building arrangements and cadastral fragmentation make it more likely for geometry-related inconsistencies to arise. By enforcing the same quality control logic across all sampled sectors, the workflow made sure that differences in the results would be more properly attributed to differences in exposure conditions and methodological assumptions than to avoidable data errors.
2.3. Residential Building Selection and Population Allocation
Population exposure was evaluated only for buildings considered eligible for residential use. Residential eligibility was determined through the spatial integration of land-use information, parcel attributes and building geometries. Parcels or areas classified as predominantly residential were first identified, and the corresponding building units and construction blocks located within those parcels were then selected. Buildings were retained only when their attributes supported residential use and provided sufficient information for population allocation. Conversely, buildings with predominantly non-residential use or with insufficient cadastral information to support a reliable allocation of residents were excluded from the exposure analysis.
Because population data were available at census-sector level rather than building level, residents were allocated to residential buildings using the CNOSSOS-EU logic. This case is applicable when the number of inhabitants is known for a larger territorial unit, but not for individual buildings.
For each residential building b, the building volume was estimated as:
where, Vb is the estimated volume of building b, Ab is the building footprint or constructed base area, and Hb is the building height. When height was not directly available, it was estimated from the number of floors:
Vb = Ab ∙ Hb,
Hb = Nfloors,b ∙ 3 (as the representative floor height)
The total residential volume in each sector was then computed as:
Vtotal = ∑Vb,
Finally, the number of residents assigned to each building was calculated proportionally to its volume:
Where Pb is the population assigned to building b, and Psector is the total population of the corresponding census sector. This allocation conserves the total population of the sector while distributing residents according to the relative size of residential buildings.
2.4. Façade Receiver Levels and Population-Assignment Methods
The levels of façade receivers were acquired from the model of road-traffic noise. It was a different configuration of the receiver calculation to represent the exposure level at the building façades, as opposed to using only a regular noise grid. This distinction is important because population exposure is ultimately experienced at residential façades rather than at regular grid nodes.
For each sampled sector, façade receiver points were generated around residential buildings. Each receiver was associated with acoustic indicators for the day and night periods: Ld,i, Ln,i.
The façade receiver dataset was then exported and processed in GIS. Before applying the population-assignment methods, receiver points were checked to remove invalid values and to verify their spatial correspondence with building footprints. This step was especially relevant in dense areas with adjoined buildings, where receiver duplication or misassignment may occur.
Where multi-height façade calculations are available, the same workflow can be applied to receiver sets located at different heights. In such cases, each receiver is defined by horizontal position and height Ri = (xi,yi,hi,Ld,i,Ln,i). This extension is important for sectors with mid-rise or high-rise buildings, where exposure may vary with floor level.
After assigning residents to buildings, the next step was to distribute each building population Pb to its façade receiver points. Three CNOSSOS-consistent methods were applied and compared. Let Rb be the set of façade receivers associated with building b and let Li be the noise level at receiver i [20].
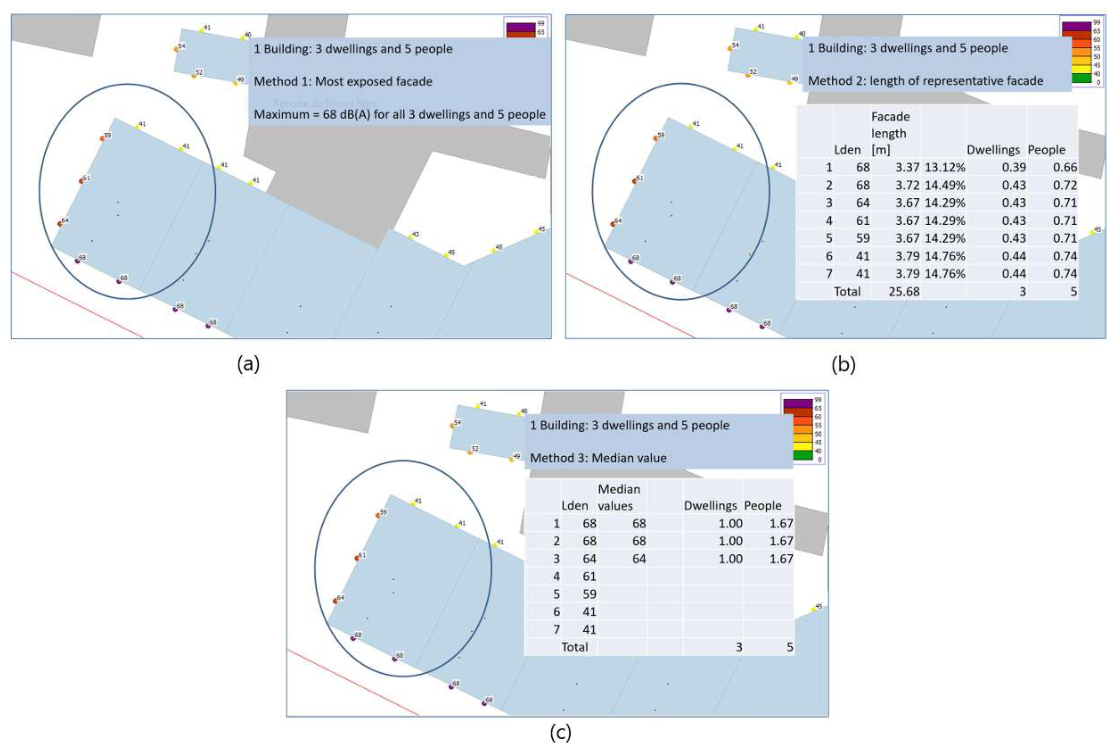
2.4.1. Method 1: Most Exposed Façade
Method 1 assigns all residents of a building to the façade receiver with the highest noise level.
All residents Pb are therefore counted in the exposure class corresponding to .
This method represents a conservative scenario because it assumes that the full building population is exposed to the highest façade level. It is appropriate when dwelling orientation is known and when dwellings are directly associated with the most exposed façade. However, in buildings with several façades or unknown dwelling distribution, it may overestimate exposure
2.4.2. Method 2: Façade Length Represented
Method 2 distributes residents according to the façade length represented by each receiver. In the implemented workflow, receiver points were assumed to be uniformly spaced along the façades. Under this assumption, each receiver represents an equivalent façade segment, and the building population is distributed evenly across all validated receivers:
Where is the population assigned to receiver i, and nb is the number of validated receivers associated with building b. This method represents a distributed exposure assumption. It tends to reduce the influence of the most exposed façade because residents are spread across all receiver conditions.
2.4.3. Method 3: Median-Based Upper-Half Assignment
Method 3 assigns residents only to the upper half of the façade noise-level distribution. For each building, the median façade level is calculated:
Receivers with values below the median are excluded from population assignment. The building population is then distributed evenly among receivers at or above the median:
Where is the number of receivers in the upper half of the façade exposure distribution. This method represents an intermediate scenario. It avoids assigning all residents to the maximum façade level, as in M1, but it also avoids assigning population to the least exposed façade conditions, as may occur under M2. For this reason, M3 is particularly relevant when the number of exposed façades or the internal dwelling distribution is unknown.
Figure 3.
Conceptual representation of the three population-assignment methods applied to façade receiver levels. (a) M1. (b) M2. (c) M3. Taken from [20].
Figure 3.
Conceptual representation of the three population-assignment methods applied to façade receiver levels. (a) M1. (b) M2. (c) M3. Taken from [20].
2.5. Exposure and High Sleep Disturbance Estimation
For each method, residents assigned to receivers were aggregated into noise-level classes. For the night indicator, the population exposed in class k was calculated as:
Where [ak,bk) is the corresponding noise interval, and Pi is the population assigned to receiver i. Exposure classes were reported using 5 dB intervals, consistent with strategic noise-mapping practice and local reporting needs. The key nighttime threshold used to compare sectors and evaluate the sensitivity of the three population-assignment methods was Ln≥55 dBA.
In order to estimate the health burden associated with night-time road-traffic noise, the study calculated the number of people affected by high sleep disturbance. This indicator was estimated using the exposure-response relationship established for road traffic noise in the European harmful-effects framework [21].
A lower cut-off of 45 dBA was used for the night-time exposure indicator, following the health-oriented interpretation of night noise. Population below this threshold was not included in the high sleep disturbance calculation.
The absolute risk of high sleep disturbance due to road traffic noise was calculated as:
The number of affected residents in each band was then calculated as: NHSD,j=nj∙RAHSD,j, where nj is the number of residents exposed in band j, and RAHSD,j is the absolute risk corresponding to the central value of band j.
The total number of affected residents was obtained by summing across all exposure bands:
This calculation was performed separately for M1, M2 and M3.
In addition to the GIS-based implementation of M1, M2 and M3, exposure estimates were compared with a reference implementation generated using validated acoustic-modelling software (CadnaA v.2026). This comparison was used to evaluate whether the GIS-based methods produced plausible exposure distributions and to identify which assignment method best approximated the reference implementation across different sector-complexity levels. Besides, to evaluate how the different assignment assumptions behave relative to a reference calculation and to determine whether M1, M2 or M3 should be interpreted as default, conservative or sensitivity scenarios.
2.6. Reference Implementation, Sensitivity Analysis and Workflow Outputs
A sensitivity analysis was conducted to evaluate how exposure and health-burden estimates varied according to the population-assignment method, the complexity of the sampled sector, the selected night-time exposure threshold, and the resulting high sleep disturbance indicator. The purpose of this analysis was to determine whether methodological uncertainty remained relatively stable across sectors or increased under more complex urban conditions.
The comparison was made for the three CNOSSOS-consistent assignment methods mainly: M1, M2 and M3. For each sector, the population exposed above the chosen night-time threshold was calculated under the three methods and compared with the reference implementation. A special focus was put on the threshold Ln≥55 dBA, which would allow for a uniform comparison of night-time exposure over the sampled sectors.
Sector complexity was included as an interpretative variable. The sectors sampled were classified into categories of low, intermediate, and high urban-methodological complexity. This allowed assessing whether differences among M1, M2, and M3 related to characteristics such as building density, heterogeneous façades, cadastral complexity, and the difficulty in linking residents to receivers on the façades.
The health outcome was calculated as the estimated number of residents suffering from high sleep disturbance (HSD). This indicator was calculated for each method and sector, separately, to allow us to see how differences in exposure assignment propagate into health-oriented outputs.
The main methodological sensitivity indicator was the spread between M1 and M2:
For the high sleep disturbance indicator, the corresponding sensitivity ratio was defined as:
This ratio was used to scale the increase in estimated health burden when moving from the most distributed assignment assumption to the most conservative one. These indicators allowed us to determine whether M3 behaved as an intermediate scenario and whether methodological sensitivity increased in sectors with higher urban-methodological complexity.
3. Results
3.1. Classification of the sampled sectors by urban-methodological complexity
This workflow was applied to the six sampled sectors in Quito: Mariscal Sucre, Belisario Quevedo, Carcelén, Guamaní, San Bartolo, and Solanda. As mentioned in the methodology, these sectors were aggregated into three urban-methodological complexity levels. Lower-complexity sectors included Mariscal Sucre and Belisario Quevedo; intermediate-complexity sectors were Carcelén and Guamaní; and high-complexity sectors were San Bartolo and Solanda. Table 2 summarizes the census-sector population and the retained residential population that was included in the exposure workflow.
The retained population varied substantially across sectors, reflecting differences in residential eligibility, cadastral structure, and the inclusion criteria applied during preprocessing. Mariscal Sucre retained the full census-sector population, whereas Belisario Quevedo retained a smaller share of its census population. The largest retained populations were observed in San Bartolo and Solanda, which also correspond to the high-complexity group. This distinction is important because all subsequent exposure percentages and high sleep disturbance estimates refer to the retained population included in the workflow, rather than to the total census-sector population.
3.2. Night-Time Exposure Across Complexity Groups
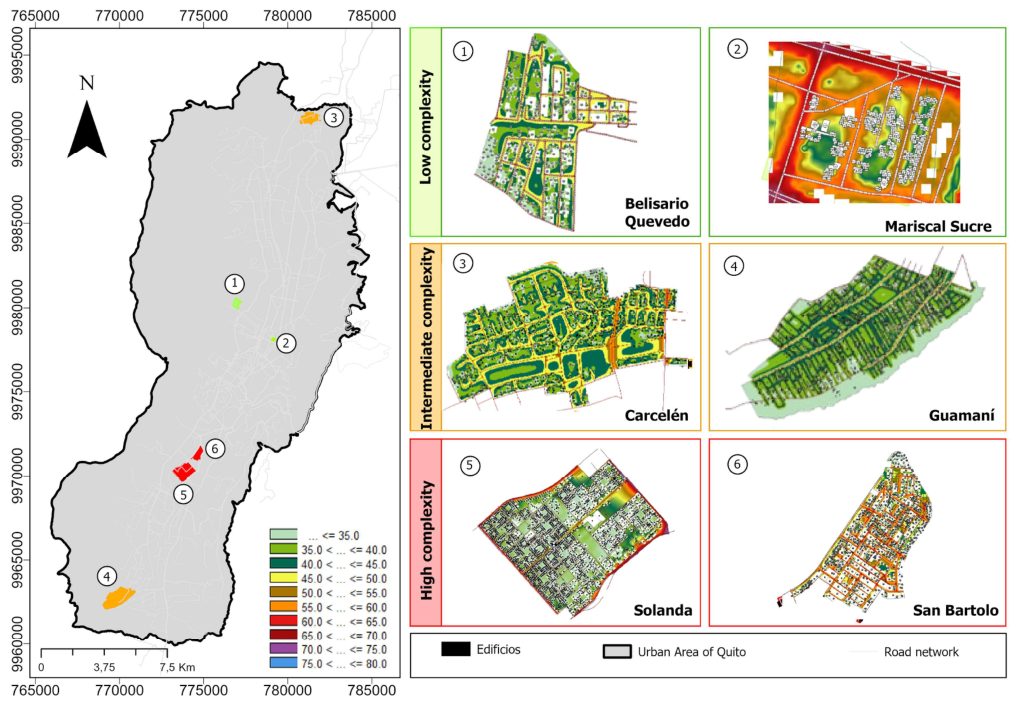
Nighttime exposure varied across complexity groups, with the highest values observed when high urban-methodological complexity coincided with residential concentration near traffic corridors.
The lower-complexity group showed relatively low to moderate exposure. In Mariscal Sucre, the reference implementation estimated 3.18% of the retained population above 55 dB, while the GIS-based methods ranged from 2.89% under M2 to 17.69% under M1. For Belisario Quevedo, the reference value was only 0.55%, with M2 and M3 staying close to that value, while M1 increased the estimate to 3.84%.
The intermediate-complexity group had the lowest exposure levels overall. In Carcelén, the percentage of the population above 55 dBA remained below 1.2% in all methods. In Guamaní, exposure above 55 dBA was almost negligible in all approaches. This indicates that, while these sectors may need more preprocessing than the lower-complexity group, their nighttime acoustic exposure is limited.
San Bartolo was the most critical sector, with the GIS-based methods ranging from 22.39% under M2 to 72.01% under M1, while the reference implementation estimated 41.86% of residents above 55 dBA. The high-complexity group showed the highest exposure and the largest methodological sensitivity. Solanda showed a lower but still relevant exposure pattern, with values ranging from 2.89% under M2 to 10.09% under M1.
Table 3.
Percentage of retained population exposed to Ln ≥ 55 dBA.
| Group | Sector | M1 | M2 | M3 | Reference implementation |
| Lower | Mariscal Sucre | 17.69% | 2.89% | 5.05% | 3.18% |
| Lower | Belisario Quevedo | 3.84% | 0.44% | 1.01% | 0.55% |
| Intermediate | Carcelén | 1.19% | 0.24% | 0.50% | 0.31% |
| Intermediate | Guamaní | 0.07% | 0.01% | 0.01% | 0.01% |
| High | San Bartolo | 72.01% | 22.39% | 43.54% | 41.86% |
| High | Solanda | 10.09% | 2.89% | 5.80% | 5.40% |
At the aggregated group level, the high-complexity sectors concentrated most of the exposure. Under the reference implementation, the share of population above 55 dBA was 1.19% in the lower-complexity group, 0.18% in the intermediate group, and 15.60% in the high-complexity group. This confirms that the most relevant exposure differences are not only sector-specific but also associated with the broader urban configuration of each group.
Figure 4.
Nighttime road-traffic noise maps Ln for the six sampled sectors in Quito, grouped by urban-methodological complexity. The figure provides spatial context for the differences in exposure patterns and method sensitivity observed across sectors. .
Figure 4.
Nighttime road-traffic noise maps Ln for the six sampled sectors in Quito, grouped by urban-methodological complexity. The figure provides spatial context for the differences in exposure patterns and method sensitivity observed across sectors. .
3.3. Sensitivity of Exposure Estimates to Population-Assignment Method
A consistent ordering was observed across all six sectors: M1 produced the highest percentage of population exposed to Ln ≥ 55 dBA, M2 produced the lowest percentage, and M3 produced intermediate values. These results reflect the varying assumptions of each method for assigning the population. In M1, the entire building population is assigned to the most exposed condition on the façade. In M2, the population is distributed across all validated façade receivers. M3 involves assigning the population to receivers positioned in the upper half of the distribution at the level of the façade.
The magnitude of the difference among methods varied substantially by sector. The spread between M1 and M2 was smallest in sectors with very low night-time exposure, such as Guamaní and Carcelén, where the difference was below 1 percentage point. In contrast, the largest spread was observed in San Bartolo, where M1 estimated 72.01% of the retained population above 55 dB and M2 estimated 22.39%, corresponding to a difference of 49.59 percentage points. Mariscal Sucre and Solanda also showed visible method sensitivity, with M1–M2 differences of 14.80 and 7.20 percentage points, respectively.
Table 4 summarises the difference between the most conservative and the most distributed assignment scenarios. These differences show that methodological sensitivity was not uniform across the sampled sectors. Instead, it was concentrated in sectors where façade-level exposure contrasts and residential concentration were more relevant.
At the complexity-group level, the highest methodological spread was observed in the high-complexity group. This finding suggests that methodological uncertainty is itself spatially structured rather than random. The magnitude of uncertainty increases when dense urban morphology, heterogeneous façade exposure and residential concentration coexist. When San Bartolo and Solanda were combined and weighted by retained population, the share of residents exposed to Ln ≥ 55 dBA was 27.39% under M1 and 8.34% under M2, resulting in a difference of 19.05 percentage points. The corresponding differences were 6.17 percentage points in the lower-complexity group and 0.55 percentage points in the intermediate-complexity group.
The comparison with the reference implementation also varied by sector. In lower- and intermediate-complexity sectors, the reference values were generally close to M2 or located between M2 and M3. In the high-complexity sectors, particularly San Bartolo and Solanda, the reference implementation was closer to M3. This suggests that the relative position of the reference implementation depends not only on the assignment method, but also on the urban configuration and exposure distribution of each sector.
3.4. High Sleep Disturbance Burden by Sector and Complexity Group
The estimated number of residents affected by high sleep disturbance (NHSD) followed the same methodological ordering observed for exposure: M1>M3>M2.
This pattern was consistent in all six sectors. However, the magnitude of the burden and the sensitivity to method choice varied substantially by sector and complexity group.
At the sector level, San Bartolo dominated the results. Depending on the method, the estimated NHSD ranged from 189.8 under M2 to 438.6 under M1. Solanda was the second-largest contributor, with NHSD ranging from 67.9 under M2 to 200.7 under M1. Together, these two high-complexity sectors accounted for most of the estimated health burden across the sample.
In the lower-complexity group, Mariscal Sucre and Belisario Quevedo produced smaller absolute burdens, but the effect of method choice remained visible. For instance, Belisario Quevedo increased from 5.3 NHSD under M2 to 23.8 under M1. In Mariscal Sucre, the estimated burden ranged from 10.0 under M2 to 15.0 under M1.
The intermediate-complexity group showed relatively low absolute burdens. Carcelén and Guamaní both had low exposures above 55 dB, and their NHSD values were modest in comparison with those of San Bartolo and Solanda. This underscores that complexity should not be taken as a direct proxy for acoustic risk; rather, it helps to understand how likely the results can be sensitive once the exposure is there.
Table 5.
Estimated number of residents affected by high sleep disturbance (NHSD).
| Group | Sector | M1 | M2 | M3 |
| Lower | Mariscal Sucre | 15.0 | 10.0 | 12.0 |
| Lower | Belisario Quevedo | 23.8 | 5.3 | 11.3 |
| Intermediate | Carcelén | 23.3 | 6.9 | 13.3 |
| Intermediate | Guamaní | 17.1 | 3.9 | 8.0 |
| High | San Bartolo | 438.6 | 189.8 | 244.3 |
| High | Solanda | 200.7 | 67.9 | 128.7 |
| Total | 718.5 | 283.8 | 417.6 |
Figure 5.
Bubble plots showing the relationship between the share of retained population exposed to Ln ≥ 55dBA, retained population, and the estimated number of residents affected by high sleep disturbance (NHSD) under Methods M1, M2, and M3.
Figure 5.
Bubble plots showing the relationship between the share of retained population exposed to Ln ≥ 55dBA, retained population, and the estimated number of residents affected by high sleep disturbance (NHSD) under Methods M1, M2, and M3.
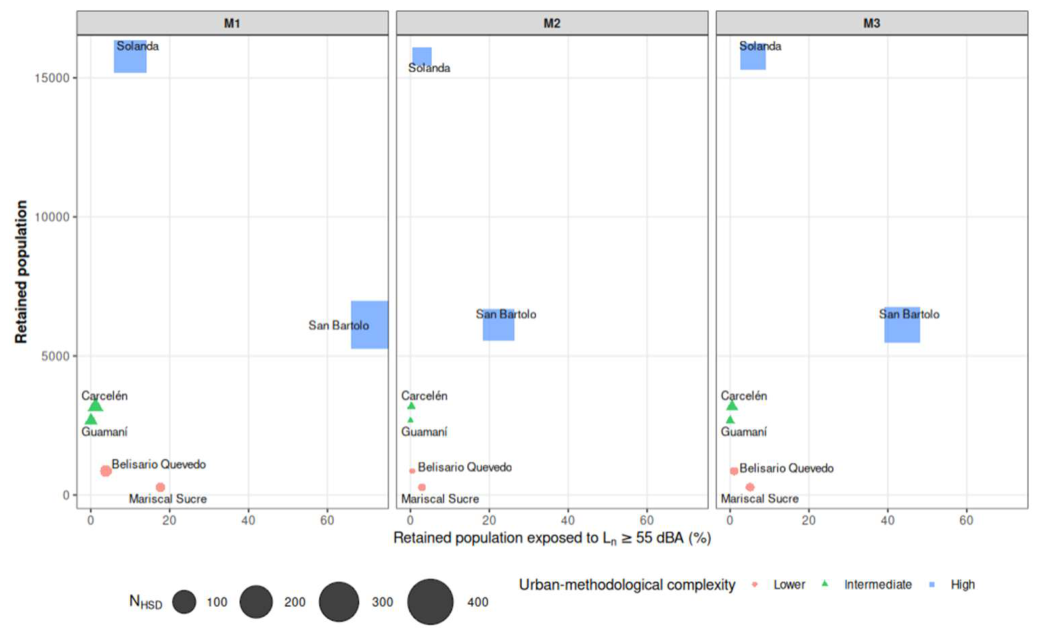
At the aggregate level, the six-sector burden was 718.5 NHSD under M1, 283.8 NHSD under M2, and 417.6 NHSD under M3. Expressed per 1,000 retained residents, this corresponds to approximately 24.9, 9.8, and 14.5 cases per 1,000 inhabitants, respectively. Thus, the most conservative scenario produces an aggregate burden approximately 2.5 times higher than the most distributed scenario.
By complexity group, the high-complexity sectors accounted for the majority of the total estimated burden: 639.3 NHSD under M1, 257.7 under M2, and 373.0 under M3. This confirms that the most complex sectors are also the ones where choices in methods matter most for practical health-oriented reporting.
The high-complexity sectors accounted for approximately 89–91% of the total estimated NHSD, depending on the assignment method. In general, results indicate that the classification of the sampled sectors according to urban-methodological complexity enhances the interpretation of exposure and health-burden estimates. It does not substitute for acoustic analysis, nor does it mean that higher complexity always implies higher exposure. It does explain the small impact of the population-assignment method in some sectors and its large impact in others. Most important methodological sensitivity is where complex urban morphology coincides with relevant night-time exposure, as seen particularly in San Bartolo and to a lesser extent in Solanda.
4. Discussion
The results indicate that methodological uncertainty in traffic-noise exposure assessment is not spatially invariant. Instead, it depends strongly on urban configuration. In sectors where dense morphology, façade heterogeneity and residential concentration coincide, the choice of population-assignment method substantially alters both exposure estimates and the associated health burden. The results confirm that the estimation of population exposure to road-traffic noise is highly influenced by the method assumed to assign residents to levels at the façade. Across the six sampled sectors, the same ordering in results was noted: M1 produced the highest exposure and health-burden estimates, M2 the lowest, and M3 values in between. This pattern relates to the assumptions built into each method. In M1, the entire building population is assigned to the most exposed façade condition; in M2, residents are distributed over all validated façade receivers; and in M3, they are assigned to the upper half of the façade-level distribution. The practical relevance lies not only in the existence of methodological differences, but in their magnitude. The level of difference is substantial enough to change how exposure is interpreted and mitigation measures are prioritized.
At the aggregate level, the estimated number of residents affected by high sleep disturbance ranged from 283.8 under M2 to 718.5 under M1, with 417.6 under M3. This means that the most conservative assignment scenario produced an estimated burden approximately 2.5 times higher than the most distributed scenario. Such variation shows that population assignment should not be treated as a secondary post-processing step. Even when the same acoustic model, building layer and census population are used, the rule adopted to link residents with façade noise levels can substantially change the reported number of exposed residents and associated health-oriented indicators.
These findings are consistent with previous studies showing that exposure estimates can vary considerably according to the method used to assign population to acoustic values. For example, Murphy and Douglas [22] indicated that the method of assessment of exposure may strongly influence final estimates of exposure of the population. Similar results were obtained by Van Banda[20] and Soto Molina et al. [23] who found that on average M3 gives higher exposure estimates than M2, while M1 tends to be the most conservative approach. The present study extends this discussion to Quito and shows that this methodological sensitivity is also relevant in Latin American cities, where dwelling-level demographic information is limited or unavailable.
A second contribution of the study is the use of urban-methodological complexity as an interpretative dimension. The results indicate that complexity should not be taken as a direct surrogate of acoustic risk. Carcelén and Guamaní were classified as sectors of intermediate complexity, but both presented very low night-time exposure above Ln ≥ 55 dB dBA. In contrast, San Bartolo presented high urban-methodological complexity together with significant night-time exposure, generating the largest methodological spread and the highest NHSD values. This distinction is important because it separates two related but different concepts: acoustic exposure depends on the spatial distribution and intensity of road-traffic noise, whereas methodological sensitivity depends on how difficult it is to link buildings, façade receivers and population attributes under incomplete dwelling-level information.
The proposed complexity classification should therefore be interpreted as a diagnostic tool rather than as an exposure classification. More importantly, the proposed classification can be interpreted as an indicator of where methodological uncertainty is likely to become relevant for decision-making. From this perspective, urban complexity operates as a moderator of uncertainty propagation from exposure assessment to health-burden estimation. The value would lie in identifying where the workflow is more likely to be sensitive to assumptions about façade exposure and residential distribution. In low- and intermediate-complexity sectors, the differences among assignment methods were generally smaller in absolute terms, particularly where night-time exposure was limited. In high-complexity sectors, especially San Bartolo and Solanda, the differences became more relevant because dense urban morphology, façade heterogeneity and larger retained populations coincided with meaningful acoustic exposure. This suggests that urban complexity becomes most important when it overlaps with residential concentration near traffic-noise sources.
The comparison with the reference implementation provides additional insight into how the three methods should be interpreted. M1 should be understood as a conservative upper-bound scenario rather than as a general default method. It may be appropriate for conservative screening, detached dwellings or cases where residents are known to be associated with the most exposed façade. However, when applied uniformly to buildings with multiple façades or unknown dwelling orientation, it may overestimate exposure by assigning the entire building population to the maximum façade level.
M2 represents the most distributed assumption. By assigning residents across all validated façade receivers, it minimizes the influence of the highest façade levels and, therefore, tends to give the lowest exposure and NHSD estimates. This approach may be appropriate when there is no knowledge about dwelling orientation and when a less conservative estimate is needed. However, it may underestimate exposure in buildings where dwellings are not evenly distributed across façades or where a substantial share of residents is oriented toward noisier façades.
M3 assigns the people at the upper half of the distribution of façade levels. In this study, M3 was particularly informative in sectors with high complexity, where the reference implementation was closer to M3 than to M2. In dense or geometrically complex urban fabrics, M3 may provide a more balanced estimate when façade exposure is heterogeneous and dwelling orientation is unknown. However, the results do not imply that M3 is universally correct; rather, they support its use as part of a sensitivity-based reporting strategy.
From a reporting perspective, the most defensible approach is to make the assignment method explicit and to avoid presenting a single exposure value as if it were free of methodological uncertainty. In data-limited contexts, reporting M2 and M3 together, with M1 as an upper-bound scenario, can provide a more transparent range of plausible exposure and health-burden estimates. This approach is especially relevant for urban noise management because different assignment methods may lead to different interpretations of which areas should be prioritised for mitigation.
The results also have practical implications for public-health-oriented noise management. San Bartolo and Solanda concentrated most of the estimated NHSD burden because they combined relevant night-time exposure with substantial retained residential population. This confirms that mitigation priorities should not be based only on the highest sound levels, but on the overlap between acoustic exposure, residential concentration and urban configuration. By translating façade-level noise estimates into exposed population and NHSD, the workflow provides information that is more directly actionable for traffic calming, speed management, quiet pavement strategies, façade insulation programmes and land-use planning.
Several limitations should be acknowledged. First, the workflow is dependent on the quality and availability of cadastral, land-use, and demographic data. Since population was available at the level of the census sector, the residents had to be redistributed to the residential buildings on the basis of volumetric assumptions. This introduces uncertainty, especially for mixed-use areas and for buildings where residential occupancy is not directly observed. Second, the assignment of residents to façade receivers is somewhat of an approximation because information on dwelling orientation, floor occupancy, and internal residential distribution was not available. Third, the proposed complexity classification is currently based on methodological and urban interpretation; future applications should strengthen it with quantitative descriptors such as the number of residential buildings, the number of façade receivers, receptors per building, retained-population ratio, and method-sensitivity indicators. The fourth point is that future work should include multi-height façade receiver analysis where data permit, especially in sectors with mid-rise and high-rise residential buildings.
In summary, this study shows that the conversion of strategic noise maps into indicators of population exposure and health is not a neutral technical step. Sensitivity to the choice of population assignment method can greatly shape exposure estimates, and this sensitivity is even greater in the presence of complex urban morphology where relevant night-time traffic noise is considered. The proposed workflow, by combining assessment of exposure at the façade, method comparison, classification of urban-methodological complexity, and estimation of NHSD, offers a transparent and transferable framework for the improvement of environmental noise assessment in cities where information at the level of dwellings is scarce.
5. Conclusions
The study developed and tested a workflow based on façades to estimate population exposure to road-traffic noise and the associated burden of high sleep disturbance in six urban sectors of Quito. This includes strategic noise-map output, cadastral and land-use information, census-sector population data, façade receiver levels, and population assignment using CNOSSOS-consistent methods. It is shown that the transition from noise maps to exposed population is a methodologically sensitive step rather than a neutral post-processing operation.
The results demonstrate that the choice of population-assignment method greatly influences exposure estimates and health-burden indicators. For all six sectors, M1 consistently gave the highest estimates, M2 the lowest, and M3 intermediate values. At the aggregate level, the estimated number of residents affected by high sleep disturbance varied from 283.8 under M2 to 718.5 under M1, with 417.6 under M3. This 2.5-fold difference between the most distributed and the most conservative scenarios confirms that the assignment method should be explicitly reported and considered a key modelling decision.
M1 should be interpreted as a conservative upper-bound scenario rather than as a general default method, not a general default method — especially when you don’t know the internal distribution of dwellings. M2 gives a more distributed exposure assumption; M3 offers an intermediate alternative that was particularly informative in the high-complexity sectors. For contexts with little data, the combined reporting of M2 and M3, together with M1 as an upper-bound scenario, gives a clearer picture of methodological uncertainty.
The classification of sectors by urban-methodological complexity also proved useful for interpreting the results. Urban complexity did not emerge as a direct proxy for acoustic risk. Instead, it determined the magnitude of methodological sensitivity and therefore conditioned how uncertainty propagated from façade-level exposure estimates to health-oriented indicators. The results demonstrate that identical acoustic environments may lead to substantially different estimates of exposed population and high sleep disturbance depending on both the selected assignment method and the characteristics of the urban fabric in which it is applied. The greatest sensitivity occurred where complex urban morphology coincided with relevant nighttime exposure, particularly in San Bartolo and Solanda.
The estimated health burden was also found to be highly concentrated in space. Most of the estimated NHSD was found in San Bartolo and Solanda. This shows that mitigation priorities should not only be based on the highest sound levels but on the overlap between acoustic exposure, residential concentration and urban configuration. The proposed workflow can thus help support more targeted, as well as health-oriented, environmental noise management.
Some limitations still exist. The residents' allocation to buildings relies on the quality and completeness of cadastral, land-use, and demographic data; therefore, when information at the level of dwellings is not available, the assignment of residents to façade receivers can only be considered an approximation. Future applications should strengthen the complexity classification with quantitative descriptors, incorporate multi-height façade receiver analysis where data permit, and test mixed-method strategies that assign M1, M2 or M3 according to building typology and available residential information.
In general, the study shows that a façade-based and method-sensitive workflow can enhance the interpretation of urban traffic-noise impacts in data-limited contexts. By connecting strategic noise maps with population exposure, urban complexity and NHSD, the approach proposed herein offers a clear framework for the transformation of acoustic modelling outputs into information that can be acted upon in urban planning, public health and environmental noise management.
Author Contributions
Conceptualization, L.B.-M., G.M. and I.P.; methodology, G.M.; software, G.M. and F.E.; validation, G.M. and L.B.-M.; formal analysis, G.M. and L.B.-M.; data curation, G.M. and F.E.; writing—original draft preparation, L.B.-M., G.M., I.P. and F.E.; writing—review and editing, L.B.-M., G.M., I.P. and F.E.; supervision, L.B.-M. and I.P. All authors have read and agreed to the published version of the manuscript.
Funding
This research received no external funding. The APC was funded by Universidad de Las Américas.
Data Availability Statement
The original contributions presented in the study are included in the article, further inquiries can be directed to the corresponding author.
Conflicts of Interest
The authors declare no conflicts of interest.
Abbreviations
The following abbreviations are used in this manuscript:
| CNOSSOS-EU | Common Noise Assessment Methods in Europe |
| HSD | Highly sleep disturbed |
| GIS | Geographic Information System |
| Lden | Day-evening-night level |
| Ln | Night level |
References
- Basner, M.; McGuire, S. WHO Environmental Noise Guidelines for the European Region: A Systematic Review on Environmental Noise and Effects on Sleep. Int. J. Environ. Res. Public Health 2018 2018, Vol. 15, Page 519, vol. 15(no. 3), 519. [Google Scholar] [CrossRef]
- Münzel, T.; Schmidt, F. P.; Steven, S.; Herzog, J.; Daiber, A.; Sørensen, M. Environmental Noise and the Cardiovascular System. J. Am. Coll. Cardiol. 2018, vol. 71(no. 6), 688–697. [Google Scholar] [CrossRef] [PubMed]
- Gapp, K.; et al. , Transportation Noise and Cardiovascular Health: Evidence, Mechanisms, and Policy Imperatives. Anatol. J. Cardiol. vol. 29(no. 10), 525–2025. [CrossRef] [PubMed]
- Hahad, et al. , Noise and mental health: evidence, mechanisms, and consequences. J. Expo. Sci. Environ. Epidemiol. 2024, 2024 35:1, vol. 35(no. 1), 16–23. [Google Scholar] [CrossRef] [PubMed]
- Arregi, et al. , Association of environmental noise exposure with cortisol levels in children from eight European birth cohorts. Environ. Res. 2025, vol. 277, 121541. [Google Scholar] [CrossRef] [PubMed]
- Blanes, N.; et al. , Noise in Europe 2017: updated assessment ETC/ACM Technical Paper 2016/13. Eur. Top. Cent. Air Pollut. Clim. Change Mitig. 2017, vol. 13(no. 6), 200–203. [Google Scholar]
- Kephalopoulos, S.; Paviotti, M.; Anfosso-Lédée, F.; Van Maercke, D.; Shilton, S.; Jones, N. Advances in the development of common noise assessment methods in Europe: The CNOSSOS-EU framework for strategic environmental noise mapping. Sci. Total Environ. 2014, vol. 482–483(no. 1), 400–410. [Google Scholar] [CrossRef] [PubMed]
- Directive - 2015/996 - EN - EUR-Lex. Available online: https://eur-lex.europa.eu/legal-content/EN/ALL/?qid=1604406703507&uri=CELEX%3A32015L0996 (accessed on Jun. 23 2026).
- Directive - 2020/367 - EN - EUR-Lex. Available online: https://eur-lex.europa.eu/legal-content/EN/ALL/?uri=CELEX%3A32020L0367 (accessed on Jun. 23 2026).
- Murphy, E.; Douglas, O. Population exposure to road traffic noise: Experimental results from varying exposure estimation approaches. Transp. Res. D. Transp. Environ. 2018, vol. 58, 70–79. [Google Scholar] [CrossRef]
- Cai, M.; Lan, Z.; Zhang, Z.; Wang, H. Evaluation of road traffic noise exposure based on high-resolution population distribution and grid-level noise data. Build. Environ. 2019, vol. 147, 211–220. [Google Scholar] [CrossRef]
- Licitra, G.; Ascari, E. Gden: An indicator for European noise maps comparison and to support action plans. Sci. Total Environ. 2014, vol. 482–483(no. 1), 411–419. [Google Scholar] [CrossRef] [PubMed]
- Chen, S.; He, P.; Yu, B.; Wei, D.; Chen, Y. The challenge of noise pollution in high-density urban areas: Relationship between 2D/3D urban morphology and noise perception. Build. Environ. 2024, vol. 253, 111313. [Google Scholar] [CrossRef]
- Almansi, K. Y.; Ujang, U.; Azri, S.; Wickramathilaka, N. Machine learning-based 2D and 3D traffic noise modelling in campus environments: a framework for vertical façade exposure assessment. Appl. Intell. 2026, 2026 56:6, vol. 56(no. 6), 199. [Google Scholar] [CrossRef]
- Alonso; Suárez, R.; Patricio, J.; Escandón, R.; Sendra, J. J. Acoustic retrofit strategies of windows in facades of residential buildings: Requirements and recommendations to reduce exposure to environmental noise. J. Build. Eng. 2021, vol. 41, 102773. [Google Scholar] [CrossRef]
- Meller, G.; de Lourenço, W. M.; de Melo, V. S. G.; Grigoletti, G. de Campos. Use of noise prediction models for road noise mapping in locations that do not have a standardized model: a short systematic review. Environ. Monit. Assess. 2023 2023, 195:6, vol. 195(no. 6), 740. [Google Scholar] [CrossRef] [PubMed]
- Bravo-Moncayo, L.; Chávez, M.; Puyana, V.; Lucio-Naranjo, J.; Garzón, C.; Pavón-García, I. A cost-effective approach to the evaluation of traffic noise exposure in the city of Quito, Ecuador. Case Stud. Transp. Policy 2018. [Google Scholar] [CrossRef]
- Zafar, M. I.; et al. , GIS Based Road Traffic Noise Mapping and Assessment of Health Hazards for a Developing Urban Intersection. Acoustics 2023, vol. 5(no. 1), 87–119. [Google Scholar] [CrossRef]
- Cueto, J. L.; Licitra, G. Geographic information system tools for noise mapping. Noise Mapp. EU Model. Proced. 2012, 215–253. [Google Scholar] [CrossRef]
- van Banda, E. H. The three methods of calculating population exposure according to CNOSSOS-EU. In Internoise 2022 - 51st International Congress and Exposition on Noise Control Engineering; 2022. [Google Scholar] [CrossRef]
- Van Kamp; Woudenberg, F. A Sound Approach to Noise and Health. In Springer-AAS Acoustics Series; 2025. [Google Scholar]
- Murphy, E.; Douglas, O. Population exposure to road traffic noise: Experimental results from varying exposure estimation approaches. Transp. Res. D. Transp. Environ. 2018, vol. 58, 70–79. [Google Scholar] [CrossRef]
- Soto-Molina, M. Ausejo Prieto; Ruiz, R. M. Arce. Enhancing noise assessment accuracy: FEM as an advanced complement to CNOSSOS-EU. In Noise and Vibration Worldwide; JOURNAL:JOURNAL:NVWA; PAGEGROUP:STRING:PUBLICATION, Mar 2025; vol. 56, no. 3, pp. 164–185. [Google Scholar] [CrossRef]
Table 2.
Census-sector population and retained residential population by urban-methodological complexity group.
Table 2.
Census-sector population and retained residential population by urban-methodological complexity group.
| Group | Sector | Census-sector population | Population retained in exposure workflow / (%) |
| Lower | Mariscal Sucre | 277 | 277 / (100%) |
| Lower | Belisario Quevedo | 3,024 | 860 / (28.4%) |
| Intermediate | Carcelén | 6,659 | 3,186 / (47.8%) |
| Intermediate | Guamaní | 7,648 | 2,677 / (35.0%) |
| High | San Bartolo | 8,332 | 6,112 / (73.4%) |
| High | Solanda | 29,844 | 15,762 / (52.8%) |
Table 4.
Difference between M1 and M2 in the share of retained population exposed to Ln ≥ 55 dBA.
| Group | Sector | M1 | M2 | M1 – M2 difference |
| Lower | Mariscal Sucre | 17.69% | 2.89% | 14.80 pp |
| Lower | Belisario Quevedo | 3.84% | 0.44% | 3.40 pp |
| Intermediate | Carcelén | 1.19% | 0.24% | 0.95 pp |
| Intermediate | Guamaní | 0.07% | 0.01% | 0.06 pp |
| High | San Bartolo | 71.97% | 22.38% | 49.59 pp |
| High | Solanda | 10.09% | 2.89% | 7.20 pp |
Disclaimer/Publisher’s Note: The statements, opinions and data contained in all publications are solely those of the individual author(s) and contributor(s) and not of MDPI and/or the editor(s). MDPI and/or the editor(s) disclaim responsibility for any injury to people or property resulting from any ideas, methods, instructions or products referred to in the content. |
© 2026 by the authors. Licensee MDPI, Basel, Switzerland. This article is an open access article distributed under the terms and conditions of the Creative Commons Attribution (CC BY) license (http://creativecommons.org/licenses/by/4.0/).
Copyright: This open access article is published under a Creative Commons CC BY 4.0 license, which permit the free download, distribution, and reuse, provided that the author and preprint are cited in any reuse.