

Submitted:
14 August 2026
Posted:
17 August 2026
You are already at the latest version
Abstract
Liver fibrosis is a serious complication of non-alcoholic fatty liver disease (NAFLD) and the metabolic syndrome (MetS), conditions closely linked to obesity. We investigated the levels and dynamics of liver fibrosis biomarkers and liver fat content during personalized weight loss intervention in individuals with obesity, NAFLD, and concomitant MetS (n=30), with assessments at baseline, 1, and 5 months. Liver fat content decreased significantly (p < 0.0001), corresponding with complete resolution of steatosis in 36.7% of the participants, after 1 month of weight loss. Similarily, the fibrosis markers: T1 (p < 0.01), CK18 (p < 0.01), PIIINP (p < 0.0001), TIMP1 (p < 0.001), and MACK3 (p < 0.001) dropped after 1 month. CK18 (p < 0.01) and MACK3 (p < 0.001) further changed from 1 to 5 months, while FNI decreased after 5 months (p < 0.01). Except for CK18, the dynamics of these changes were more pronounced from baseline to 1 month compared with 1 to 5 months. Finally, MACK3 showed promise for explaining T1.Our study underlines the importance of weight loss in swiftly mitigating liver steatosis and supports the integration of non-invasive biomarkers to monitor fibrosis risk in individuals with obesity, NAFLD, and MetS.
Keywords:
obesity
; intervention
; NAFLD
; MetS
; MASLD
; liver fibrosis risk
; MACK3
; T1 relaxation time
; CK18
; TIMP1
Introduction
Liver fibrosis is a pathological condition characterized by the excessive accumulation of extracellular matrix proteins in the liver, resulting from chronic liver injury and inflammation [1]. This condition represents a critical turning point in the progression of liver diseases, as it significantly increases the risk of cirrhosis, hepatocellular carcinoma, and liver failure [2,3]. The early identification and management of liver fibrosis are essential to mitigate these adverse outcomes and improve patient prognosis. However, effective early diagnostic strategies remain a challenge, particularly in high-risk populations such as individuals with obesity, non-alcoholic fatty liver disease (NAFLD), and the metabolic syndrome (MetS) (or the more recent metabolic dysfunction–associated steatotic liver disease (MASLD) definition, comprising both liver steatosis and metabolic complications) [4,5].
The gold standard for diagnosis of liver fibrosis relies on liver biopsy and histological evaluation. However, this procedure is limited by its invasiveness, high cost, sampling variability, and associated risks, such as bleeding and infection, rendering it unsuitable for routine screening or longitudinal monitoring [6,7]. Especially for advanced liver fibrosis, transient elastography (FibroScan) and the fibrosis-4 (FIB-4) index represent non-invasive tools, although their use in individuals with obesity or for early fibrosis and risk assessment are restricted [8,9,10]. These limitations have driven the development of new non-invasive screening methods, which include imaging modalities, circulating biomarkers, and composite algorithms.
Among imaging-based techniques, magnetic resonance imaging (MRI) and magnetic resonance elastography (MRE) are promising tools. MRI-based T1 relaxation time (T1 mapping) assesses liver fibrosis, while MRE measures liver stiffness, a surrogate for fibrosis [8,11]. Both methods have shown potential for detecting early fibrotic changes but are limited by high costs and the need for specialized equipment [12,13]. Circulating biomarkers such as cytokeratin-18 (CK18), procollagen III N-terminal peptide (PIIINP), and tissue inhibitor of metalloproteinases 1 (TIMP1) offer less invasive alternatives by reflecting hepatocyte apoptosis, extracellular matrix remodeling, and fibrogenesis, respectively [14,15,16,17]. Composite algorithms like the FIB-4 index, Forns score, fibrosis non-invasive index (FNI), and MACK3 score combine clinical and laboratory parameters to estimate fibrosis risk, enhancing their potential diagnostic accuracy while reducing reliance on single parameters [9,18,19,20]. However, these tools face challenges, including variability in sensitivity, specificity, and applicability across diverse patient populations.
In a previous study [21], we combined imaging techniques, circulating biomarkers, and algorithms for assessing early fibrosis detection in individuals with obesity. This study demonstrated that, in the absence of overt liver disease, T1 relaxation time, FNI, CK18, and MACK3 scores were significantly elevated in individuals with obesity, NAFLD, and MetS (or MASLD) compared with an obesity control group. These findings underscore the importance of early assessment in high-risk populations and provide a rationale for evaluating the longitudinal responsiveness of these markers during interventions aimed at improving liver health.
Weight loss is a well-established strategy for reducing liver steatosis and improving metabolic health [22]. However, the responsiveness and temporal trajectories of noninvasive fibrosis-related markers during weight loss intervention remain insufficiently understood.
Building on these insights, the present study aimed to characterize the magnitude and timing of changes in non-invasive fibrosis-related markers during a personalized weight loss intervention in individuals with obesity, NAFLD, and MetS. We hypothesized that weight loss would be accompanied by reductions in markers reflecting liver injury, fibrogenesis, and fibrosis risk. To test this hypothesis, we longitudinally assessed T1 relaxation time, liver stiffness measured by magnetic resonance elastography, CK18, PIIINP, TIMP1, FIB-4, the Forns score, FNI, and MACK3 at baseline and after 1 and 5 months of intervention. By integrating imaging-based, circulating, and algorithm-derived markers across early and later time points, this study sought to determine which measures are responsive to weight loss and when these changes become detectable, thereby clarifying their potential value for longitudinal monitoring in individuals with obesity at increased risk of progressive liver disease.
Materials and Methods
Study Design and Population
This study was designed as a prospective, non-randomized, single-arm longitudinal intervention study (Figure 1A) to investigate changes occurring during a personalized weight loss intervention in individuals with obesity, NAFLD, and MetS (NAFLD-MetS).
The study was organized and managed at Aalborg University Hospital (Aalborg, Denmark), where participant recruitment and data collection were performed. The personalized weight loss intervention was delivered by Diætisthuset Aalborg (Aalborg, Denmark). The present study was conducted between October 2020 and July 2022 as part of the MULTISITE study [21], which is registered on ClinicalTrials.gov (registration no. NCT05699863, 26/01/2023) and conducted in accordance with the Helsinki Declaration. The study was approved by The North Denmark Region Committee on Health Research Ethics (registration no. N-20200013). All participants provided written informed consent before inclusion.
The study started with a baseline/screening study visit to Aalborg University Hospital that included blood sample collection, magnetic resonance imaging (MRI), Dual-energy X-Ray absorptiometry (DXA) and collection of clinical data (anthropometry and blood pressure). Following this baseline visit, eligible individuals were included and began the personalized weight loss intervention.
Participants were originally recruited based on the presence of NAFLD and MetS. NAFLD was defined as hepatic steatosis ≥5%, as measured by MRI, in the absence of other known causes of hepatic steatosis. MetS was defined according to the International Diabetes Federation criteria as central obesity, based on ethnicity-specific waist circumference thresholds, together with at least two of the following four components: triglycerides ≥1.7 mmol/L or specific treatment for hypertriglyceridemia; HDL cholesterol <1.03 mmol/L in men or <1.29 mmol/L in women, or specific treatment for this lipid abnormality; systolic blood pressure ≥130 mmHg or diastolic blood pressure ≥85 mmHg, or treatment for previously diagnosed hypertension; and fasting plasma glucose ≥5.6 mmol/L [23]. Participants were excluded based on previously diagnosed diabetes or glycated hemoglobin (HbA1c) above 48 mmol/mol (6.5%); endocrine or malignant disease; pregnancy; alcohol abuse (men: ≥ 21 standardized units per week; women ≥ 14 standardized units per week (12g alcohol per unit)); drug abuse; contraindications to MRI scanning; ongoing medical treatment with corticosteroids, antibiotics, chemotherapy, and antibiotic treatment within two months prior to inclusion.
Because the present study was designed before the introduction of the MASLD nomenclature [5], the original NAFLD-MetS terminology is maintained in this study, in line with previously published findings [21]. However, all participants meeting the original NAFLD-MetS criteria also fulfill the subsequently proposed criteria for MASLD [5], why our findings also comply to individuals with obesity and MASLD.
A total of 34 adult participants were enrolled in the study, of whom 32 initiated the personalized weight loss intervention and 30 completed the 5-month follow-up after two participants withdrew. Among the participants who completed the intervention, the mean age was 48 years, and the cohort included 18 women (60%) and 12 men (40%). Additional baseline characteristics are presented in Table 1.
The intervention was conducted by “Diætisthuset Aalborg” and consisted of one initial consultation with a dietician of 1 hour and 15 minutes where participants received a personalized weight loss plan tailored to their everyday life, preferences, and habits. The intervention aimed to achieve a weight loss of approximately 10% of the initial body weight and was conducted over 5 months. Following the initial consultation, participants attended 10 follow-up consultations of approximately 25 minutes each to assess progress and make individualized adjustments to the program as needed. Thus, the intervention comprised a total of 11 dietitian consultations distributed throughout the study period. Dietary status and physical activity were additionally assessed by repeated questionnaires during the intervention, which recorded changes from the preceding assessment. Adherence to the intervention was monitored through attendance at the scheduled dietitian consultations, and lack of compliance with the weight loss intervention constituted a predefined criterion for withdrawal from the study. No standardized caloric intake or exercise frequency/intensity was prescribed as part of the study. Individual caloric and physical activity recommendations were determined by the dietitian according to each participant’s individualized plan.
During the intervention period, participants attended two additional study visits at Aalborg University Hospital with blood sample collection, MRI, DXA, and collection of clinical data (anthropometry and blood pressure) after 1 and 5 months. For all study visits, participants were requested to fast overnight (> 8 hours) and remained fasting for the duration of the study visit. All assessments were completed in a single day to minimize confounding factors related to sample collection times.
Clinical Data
Weight was assessed with participants wearing a hospital gown. Height was measured using a stadiometer. Waist circumference, hip circumference, waist-to-hip, and waist-to-height ratios (WHR, WHtR respectively) were measured and calculated in accordance with the world health organization (WHO) guidelines [24]. Blood pressure was measured a minimum of three times after a 5-10 minute period of seated rest and reported as the average of measurements two and three.
Circulating Biomarkers
Routine blood analysis was performed immediately after sample collection at an accredited hospital laboratory (DS/EN ISO 15189). Briefly, plasma glucose, alanine transaminase (ALT), aspartate transaminase (AST), gamma glutamyl transferase (GGT), cholesterol, high-density lipoproteins (HDL), triglycerides (TG) were measured on Cobas 6000c (Roche, Mannheim, Germany). Low-density lipoproteins (LDL) were calculated using the Friedewald equation [25]. Serum insulin and C-peptide levels were measured on Cobas 601E (Roche, Mannheim, Germany). Platelet concentration was measured on Sysmex XN-9000 (Sysmex Co., Kobe, Japan). HbA1c was measured on Sebia Capillarys 3 (Sebia, Lisses, France). Insulin resistance was estimated using the homeostasis model assessment for insulin resistance (HOMA2-IR), and was calculated from specific insulin and fasting plasma glucose levels using the iterative structural model using the HOMA2 calculator [26,27].
TIMP1 was measured using Quantikine ELISA kit (R&D Systems Inc., Minneapolis, MN, USA, Cat. #DTM100, Lot. #651-170619) with inter-assay CVs of 4.6% (97ng/mL; plasma pool), 2.2% (6ng/mL; high control), 4.3% (3ng/mL; medium control), and 4.1% (1ng/mL; low control). CK-18 was measured using the M30 Apoptosense and CK18 ELISA Kit (VLVbio, Stockholm, Sweden, Cat. #P10011, Lot. #10011-014) following manufacturer’s instructions with inter-assay CVs of 10.7% (137U/L; plasma pool), 1.4% (664U/L; high control), and 4.9% (122U/L; low control). Serum PIIINP was measured in an accredited routine hospital laboratory (DS/EN ISO 15189) by the Atellica IM analysis (Siemens Healthineers, Erlangen, Germany) with inter-assay CVs of 5.6% (11.4μg/L; high control) and 10.3% (2.24μg/L; low control).
Imaging
Liver steatosis was determined by MRI using proton density fat fraction (PDFF) maps and liver fibrosis was evaluated by MRI using T1 mapping and MRE, as previously described [21]. In short, participants were scanned in a 3T MRI scanner (Signa Premier, General Electric, Milwaukee, WI, USA) using a flexible 30-channel coil (AIR) and a 60-channel in-bed coil in the supine position. PDFF maps were obtained using breath-hold multi-point Dixon (IDEAL IQ) sequences using fat- and water-only images to generate PDFF maps [28]. Liver fat content was calculated from PDFF map images using Vitrea Read (v.8.3.53-55, Canon Medical Informatics Inc., Minnetonka, Minnesota, USA, RRID: SCR_023418) as the mean of four circular regions of interest (ROIs); (mean size: 10cm2).
Liver fibrosis was estimated using T1 mapping (T1 relaxation time) and MRE (liver stiffness). For T1 mapping, a pulse-triggered modified Look-Locker inversion recovery (MOLLI) 2D imaging sequence was done as described [28]. Assessment of T1 relaxation time was performed on the T1 maps using GE Volume Viewer (v. 15.0 Ext. 6, General Electrics, Milwaukee, WI, USA) and calculated as the mean of four circular ROIs (mean size: 7cm2). MRE was performed using mechanical waves centred on the xiphisternum and generated using a rigid, round, active pneumatic driver fastened to the upper abdomen and vibrated at 40 Hz. MRE was determined from stiffness maps generated using a direct inversion algorithm on the MRI scanner. Measurements were performed using GE Volume Viewer (v. 3.0, Ext. 2.3, General Electrics, Milwaukee, WI, USA) and calculated as the mean of four circular ROIs (mean size: 9cm2). ROIs for all measurements were placed in the anterior, posterior, medial, and lateral segments of the liver to include as much liver parenchyma as possible within the segments, excluding large vessels, the liver border, and artifacts, as recommended [29,30]. Images were processed by a single skilled operator.
For visceral fat, custom software (BodyComposition) was used to calculate the cross-sectional area of visceral fat content (cm2) from a single slice at the L3 level [31].
Total percent body fat and subcutaneous fat were determined with a Hologic 4500 (Hologic Inc., Marlborough, MA, USA) ® Dual-energy X-Ray absorptiometry (DXA) scanner. Daily quality control measures were in place using a standard phantom [32].
Liver Fibrosis Algorithms
Liver fibrosis algorithms were calculated for the FIB-4 index, Forns score, and FNI. The FIB-4 index was calculated using Equation (1) [33]:
The Forns score was calculated using Equation (2) [20]:
FNI was calculated using Equation (3) [34]:
Data Analysis
Data analysis was performed in RStudio 2024.09.1 using different methods depending on the hypothesis being tested. Differences across the three time points (baseline, 1 month, and 5 months) were first evaluated using the non-parametric Friedman test to assess overall differences, followed by paired Wilcoxon signed-rank tests for post-hoc comparisons and the resulting p-values were adjusted for multiple comparisons using the Holm-Bonferroni method. To assess the robustness of the longitudinal findings after covariate adjustment, linear mixed-effects models were fitted with time as a fixed effect and a participant-specific random intercept, adjusting for baseline age, sex, BMI, liver PDFF, and HOMA2-IR. Potential heterogeneity in longitudinal responses was further explored by adding separate time-by-baseline characteristic interaction terms for sex, BMI, liver PDFF, and HOMA2-IR to the adjusted models. Global interaction p-values were obtained from Type III tests using Satterthwaite’s approximation. For binary or categorical traits measured longitudinally, changes in proportions over time were assessed using Cochran’s Q test. Statistical significance was defined as a p-value < 0.05. Variable estimations in the experimental groups are reported as mean values ± SD and changes in variables during the intervention are presented as mean change and the 95% confidence interval (CI). Correlations between variables were analysed using Spearman’s rank-order correlation method, with results presented as the correlation coefficient and the corresponding p-value.
Relative percentage changes per week of variables in baseline to 1 month and 1 month to 5 months were calculated as follows:
where Y0 represents the initial value of the variable, Yf represents the value of the variable after 1 or 5 months and N represents the number of weeks.
L1 regularization (LASSO regression) was used to assess the importance of fibrotic indexes and circulating markers in predicting liver fibrosis (T1). The model included fibrotic indexes (Forns, FIB-4, MACK3, and FNI), and PDFF and MRE values as predictors.
Furthermore, the model was constructed using both baseline/1 month data and baseline/5 months data to evaluate whether predictive power changes across different intervention stages. Each dataset was split into training (75%) and testing (25%) subsets, with hyperparameter tuning performed using 10-fold cross-validation. The penalty parameter was optimized by selecting the value that minimized the root mean square error. Predictor importance was assessed based on the absolute values of the regression coefficients obtained during model training.
Finally, model performance was evaluated using the test datasets, and the Pearson correlation coefficient was calculated by comparing predicted and actual T1 values.
Results
Study Participants
Participants underwent a personalized weight loss intervention for 5 months, with study visits at baseline and after 1 and 5 months (Figure 1A). Of the 34 participants enrolled, 32 initiated the intervention and 30 completed the study after two participants withdrew (Figure 1B). Baseline participant characteristics are summarized in Table 1. The mean intervals from baseline to the first and final follow-up visits were 34 ± 5 and 165 ± 20 days, respectively.
Changes in Metabolic Parameters and Fat Depots During Weight Loss Intervention
Assessing the metabolic characteristics, the average body mass index (BMI) was 35.8±2.8 kg/m2 at baseline, decreased to 34.2±2.9 kg/m2 at 1 month, and 32.7±3.5 kg/m2 at 5 months (Figure 2A), showing that BMI was decreased by 3.1 kg/m2 in average (CI: 3.8 – 2.4 kg/m2; p < 0.0001) at the end of the intervention. Similarly, the waist-to-height ratio decreased by an average of 0.05 after 5 months of intervention (CI: 0.04–0.07; p < 0.0001). Additional key metabolic parameters such as fasting plasma glucose, low density lipoprotein (LDL), high density lipoprotein (HDL), alanine aminotransferase (ALT), aspartate aminotransferase (AST), and insulin also decreased during weight loss (Table 1). Moreover, we found that insulin resistance assessed by homeostasis model assessment 2 for insulin resistance (HOMA2-IR) and glycated hemoglobin (HbA1c) were significantly reduced after 1 (CI: 1.6 – 0.3 mmol/mol; p < 0.05) and 5 (CI: 2.0 – 0.5 mmol/mol; p < 0.05) months (Figure 2B-C).
Longitudinal assessment of fat depots showed that both liver fat and total body fat had decreased significantly by 1 month, with further reductions observed between 1 and 5 months (Figure 2E-D). Specifically, total body fat was decreased by 1.0% (CI: 1.6 – 0.5%; p < 0.01) at 1 month and by 2.3% (CI: 3.0 to 1.5%; p < 0.0001) at 5 months (Figure 2D), whereas liver steatosis (PDFF) was decreased at 1 month by 4.4% (CI: 5.7 – 3.0%; p < 0.0001) and by 7.1% (CI: 9.6 – 4.6%; p < 0.0001) after 5 months (Figure 2E-F). Also, subcutaneous and visceral fat stores decreased significantly during the weight loss intervention, at 1 month by 30.8 cm2 (CI: 38.9 – 22.7 cm2; p < 0.0001) and 24.6 cm2 (CI: 36.6 – 12.6 cm2; p < 0.001) and by 70.2 cm2 (CI: 86.3 – 54.1 cm2; p < 0.0001) and 41.6cm2 (CI: 58.4 – 24.9cm2; p < 0.0001) at 5 months, respectively (Supplementary Figure S1A and S1B).
Finally, after 1 month of weight loss intervention, 11 participants (36.7%) showed complete resolution of liver steatosis (< 5% liver fat content), while this increased to 17 participants (56.7%) after 5 months (Table 1). Additionally, after 1 and 5 months, 3 (10%) and 9 (30%) participants no longer presented with MetS, respectively (Table 1).
Changes in Liver Fibrosis Biomarkers During Weight Loss Intervention
We evaluated the levels (and changes) of three different types of non-invasive liver fibrosis biomarkers during weight loss intervention. Firstly, the image-based T1 relaxation time decreased significantly from baseline to 1 month (CI: [48.4 – 15.6 ms]; p < 0.01) and baseline to 5 months (CI: [72.5 – 15.9 ms]; p < 0.01) non-significant differences were observed between 1 and 5 months (Figure 3A). In contrast, liver stiffness measures did not show changes during the intervention (Figure 3B).
Next, levels of the circulating biomarkers: CK18, PIIINP, and TIMP1 were evaluated. Significant reductions in CK18 levels were observed after both 1 and 5 months, from baseline (169 ± 114 U/L) to 1 month (147 ± 92 U/L; p<0.01) and to 5 months (124 ± 74 U/L; p<0.01), and from 1 month to 5 months (p<0.01; Figure 3C). Likewise, for PIIINP the circulating levels dropped from baseline (7.8 ± 1.9 µg/L) to 1 month (6.8 ± 1.3 µg/L; p<0.0001), with no significant differences after 5 months (7.3 ± 1.4 µg/L), due to an increase observed between 1 and 5 months (Figure 3D). For TIMP1 levels, we found that levels decreased from baseline (102.1 ± 21.3 ng/mL) to 1 month (96.2 ± 17.5 ng/mL; p<0.001) and 5 months (96.8 ± 21.8 ng/mL; p<0.05), whereas no differences were observed between 1 and 5 months (Figure 3E).
Finally, we investigated the fibrosis algorithms the FIB-4 index, Forns score, FNI, and MACK3 score. The MACK3 score showed significant reductions between all three comparisons: from baseline (0.19 ± 0.16) to 1 month (0.13 ± 0.12; p<0.001) and to 5 months (0.07 ± 0.06; p<0.0001), and from 1 month to 5 months (p<0.001; Figure 3F). For FNI, significant differences were observed between baseline (0.15 ± 0.13) and 5 months (0.10 ± 0.07; p<0.05) and between 1 (0.15 ± 0.09) and 5 months (p<0.001), whereas no difference was seen from baseline to 1 month (Figure 3G). For the FIB-4 index and Forns Score, measures did not show significant changes between timepoints during the intervention (Figure 3H and Figure 3I).
These findings were largely supported by the adjusted linear mixed-effects models (Supplementary Table S1). Significant adjusted pairwise differences were observed for T1 relaxation time, CK18, PIIINP, TIMP1, MACK3, and FNI, whereas liver stiffness, FIB-4, and Forns score remained unchanged. Notably, the adjusted model also identified a significant difference in PIIINP between baseline and 5 months (p = 0.023), which was not observed in the primary non-parametric analysis.
Exploratory interaction analyses indicated that baseline liver content was the most consistent modifier of longitudinal response, with significant time-by-PDFF interactions observed for T1 relaxation time, CK18, TIMP1, MACK3, and FNI. Significant time-by-BMI interactions were also observed for T1 relaxation time and MACK3, whereas time-by-HOMA2-IR interactions were observed for T1 relaxation time and CK18. Sex was associated with the adjusted levels of several fibrosis markers (Supplementary Table S1), whereas evidence of sex-specific longitudinal responses was limited to CK18 and MACK3 (Supplementary Table S2).
Dynamics of Liver Fat Content and Liver Fibrosis Biomarkers During Weight Loss Intervention
When investigating the dynamics and temporality of the weight loss, we found that the relative percentage change in BMI occurred at a significantly faster rate from baseline to 1 month compared with the subsequent change from 1 to 5 months (-1.1 ± 0.6 vs -0.3 ± 0.3% per week; p < 0.0001; Figure 4A). This was also true for changes in liver fat content, changing from baseline to 1 month (-8.4 ± 5.3% per week) and from 1 to 5 months (-1.1± 3.8% per week; p < 0.0001; Figure 4B). Similar results were observed for total body fat (-0.6 ± 0.9 vs -0.2± 0.3% per week; p < 0.05; Figure 4C), subcutaneous fat (-1.5 ± 1.0 vs -0.5 ± 0.5% per week; p < 0.0001; Figure 4D), and visceral fat (-2.4 ± 3.2 vs -0.5 ± 1.0% per week; p < 0.05; Figure 4E).
For the liver fibrosis markers, T1 showed an increased rate of change during the first month of intervention (-0.9 ± 1.2 vs -0.1 ± 0.4% per week; p < 0.01) compared with the subsequent change from 1 to 5 months (Figure 5A). Again, liver stiffness did not show significant differences (Figure 5B). For the circulating biomarkers, the rates of changes in CK18 levels remained constant for both intervention periods (Figure 5C), while PIIIPN (Figure 5D) and TIMP1 (Figure 5E) decreased more rapidly from baseline to 1 month compared with 1 to 5 months (-3.0 ± 2.7 vs 0.6 ± 1.2% per week; p < 0.0001; and -1.3 ± 1.8 vs 0.02 ± 0.8% per week; p < 0.01, respectively). Finally, for the composite liver fibrosis scores, we found that the rate of changes of MACK3 were more pronounced between baseline and the first month (-4.7 ± 15.8 vs -2.2 ± 2.2% per week; p < 0.05; Figure 5F). This was also seen for FIB-4 (2.0 ± 4.1 vs 0.02 ± 1.8% per week; p < 0.05; Figure 5G), while the Forns score and FNI change stayed constant during the study (Figure 5H and Figure 5I).
Correlations Between Independent Fibrosis Markers
When correlating independent liver fibrosis markers, we found that at baseline T1 relaxation time correlated positively with the MACK3 score (r = 0.382; p < 0.05), FNI (r = 377; p < 0.05), and FIB-4 (r = 0.380; p < 0.05), while T1 relaxation time correlated negatively with FNI at 5 months (r = -0.382, p < 0.05; Table 2).
To evaluate which non-invasive fibrosis algorithms and imaging parameters contribute most to explaining variation in liver T1 relaxation time during weight loss intervention, we applied LASSO regression as a variable-selection approach. The model included fibrosis scores (Forns, FIB-4, MACK3, and FNI) and MRI-based measures (liver steatosis: PDFF and liver stiffness: MRE) to determine their relative contribution within a shared multivariable context. MACK3, and to a lesser extent FIB-4, emerged as the parameters most strongly associated with T1 relaxation time, providing the clearest independent signal in the model. In contrast, Forns and FNI remained in the model but contributed less, reflecting that much of the information they capture overlaps with that of the stronger predictors. The BL–1M model showed the highest predictive accuracy (R2 = 0.80, Figure 6B), whereas the BL–5M (R2 = 0.508, Figure 6C) and the all-timepoint model (R2 = 0.50, Figure 6D) exhibited more modest fits.
Discussion
In this longitudinal study, we assessed changes in liver fat content and non-invasive liver fibrosis markers in individuals with obesity, NAFLD, and MetS undergoing a personalized weight loss intervention. We observed early changes in both liver fat content and several fibrosis-related markers. Specifically, after only 1 month, liver steatosis dropped below 5% in nearly 37% of the participants, while T1 relaxation time, CK18, PIIINP, TIMP1, and the MACK3 score also decreased. Moreover, liver fat content, CK18, and MACK3 continued to decrease through 5 months, at which point FNI had also decreased significantly. In contrast, PIIINP increased between 1 and 5 months.
This study builds on our recent findings that liver fibrosis markers (T1 relaxation time, CK18, MACK3) are elevated in individuals with obesity, NAFLD, and MetS compared with an obesity control group [21]. To our knowledge, the present study provides the first longitudinal assessment of liver fat content together with multiple independent fibrosis-related markers as early as 1 month after the initiation of weight loss intervention in individuals with obesity, NAFLD, and MetS (or MASLD) without overt liver disease.
A principal observation from this intervention study is that T1 relaxation time declined significantly within the first month of the weight loss intervention, alongside a rapid decrease in hepatic fat content. Interestingly, while liver fat content, BMI, and total body fat continued to decrease from baseline to 1 month and further from 1 to 5 months, T1 relaxation time did not change after 1 month, possibly indicating that the initial change occurred predominantly during the early phase of the intervention, with values reaching near-normal levels thereafter. T1 mapping has emerged as a highly reliable non-invasive imaging method for fibrosis staging and progression [12]. It directly reflects the liver’s extracellular matrix composition including water content, thereby correlating with fibrotic remodelling [12,36]. However, T1 relaxation time may also be influenced by changes in hepatic fat and other components of liver tissue composition; therefore, its reduction should not be interpreted as direct evidence of fibrosis regression [37]. T1 mapping is both cost- and resource-intensive, limiting its accessibility in many clinical settings. Identifying more practical alternatives that show comparable longitudinal patterns is therefore of high importance to clinicians and researchers alike.
Among the examined biomarkers, the MACK3 score continued to decrease throughout the weight loss intervention. Because MACK3 incorporates AST, HOMA, and CK18, markers that are closely tied to hepatocyte injury and metabolic stress, this score has been proposed to capture processes associated with lipotoxicity and inflammation in NAFLD [18,19]. Moreover, given that MACK3 has validated refence values for the spectrum of non-alcoholic steatohepatitis (NASH)/fibrosis, our previous findings suggested that MACK3 could differentiate the participants in our study at baseline [21]. In the present study, MACK3 also showed potential for explaining variability in T1 relaxation time. However, the observed differences should be interpreted primarily as reflections of dataset structure and model fitting, rather than as evidence of greater biological sensitivity. The comparatively stronger performance of the baseline to 1 Month model raises the hypothesis that non-invasive fibrosis markers, particularly MACK3, may capture variability in T1 relaxation time more effectively during earlier stages of the intervention. Collectively, our findings support further investigation of the MACK3 score for risk assessment and longitudinal monitoring during weight loss intervention in individuals with obesity, NAFLD, and MetS, although these findings remain exploratory and require external validation.
The temporal dynamics of T1 relaxation time, TIMP1, and PIIINP during the weight loss intervention showed distinct longitudinal patterns. The most pronounced reductions in T1 relaxation time, TIMP1, and PIIINP occurred within the first month, coinciding with rapid declines in liver fat content as well as subcutaneous and visceral fat. These concurrent changes may reflect early alterations in hepatic metabolic stress, inflammation, and extracellular matrix turnover. Moreover, like T1 relaxation time, TIMP1 reductions plateaued after the first month with PIIINP even slightly increasing between month 1 to 5, indicating that these markers do not follow a uniform trajectory during weight loss. CK18, a well-established biomarker of hepatocyte apoptosis and a marker associated with liver injury and fibrosis risk, continued to decline throughout the study, supporting its potential responsiveness to longitudinal metabolic changes.
The concurrent reduction in visceral fat is particularly relevant, as it is a major source of pro-inflammatory cytokines and adipokines that contribute to hepatic fibrogenesis [38]. The changes observed in fibrosis-related markers are consistent with prior weight loss and bariatric studies showing that metabolic interventions are associated with early changes in steatosis and non-invasive fibrosis markers early, whereas fibrosis regression and extracellular matrix remodeling often progress more gradually over longer follow-up [22,39,40,41]. Our findings thus, underscore the importance of monitoring biomarker dynamics in response to weight loss interventions, as short-term changes may provide information that is not captured by baseline measurements alone.
FIB-4 and the Forns score, originally developed to detect advanced fibrosis in chronic viral hepatitis cohorts, remain widely used as an inexpensive screening tool to rule out severe fibrosis and have proven clinical utility for stratifying long-term fibrosis risk [9,20]. However, consistent with our previous findings in this cohort, which did not include participants with clinical signs of advanced liver disease, cirrhosis, or elevated baseline FIB-4 values, neither index changed significantly during the 5-month intervention. On average, both remained below the conventional “rule-out” thresholds for advanced fibrosis. These indices may therefore be less responsive for tracking short-term changes in individuals with obesity and early NAFLD and MetS (or MASLD) than in populations with more advanced disease.
Similarly, MRE did not track short-term changes in our study and did not exhibit a robust correlation with T1 relaxation time or the composite indices, even as liver fat decreased. Although elastography-based techniques are widely used to quantify liver stiffness as a surrogate for fibrosis [42], MRE values may be influenced by hepatic fat content and other features of liver tissue composition, potentially limiting the detection of small longitudinal changes in early-stage disease [37]. The absence of detectable MRE changes may therefore reflect the early disease stage, the relatively short follow-up period, and concurrent changes in hepatic fat content.
Collectively, these results indicate that while FIB-4, the Forns score, and MRE provide important data for advanced disease staging or risk stratification, they may not be the most useful markers for monitoring short-term longitudinal changes in early NAFLD/MASLD.
Despite its strengths, our study has several limitations. The principal limitation of this study is the absence of a contemporaneous control group not undergoing weight loss intervention. Consequently, the observed reductions in fibrosis-related markers cannot be attributed exclusively to the intervention, and potential contributions from regression to the mean, seasonal variation, medication changes, or other concurrent and time-varying factors cannot be excluded. Participants were not selected based on elevated fibrosis-related marker levels, which may reduce, but does not eliminate, the potential influence of regression to the mean. Although the repeated-measures design allowed each participant to serve as their own reference and enabled characterization of changes at early and later time points, it does not provide the counterfactual comparison required for causal inference. The findings should therefore be interpreted as exploratory longitudinal associations and validated in controlled studies that include a randomized or appropriately matched non-intervention group.
A further limitation is the absence of liver biopsy data. Because the study aimed to investigate early changes in fibrosis-related markers and liver fat content in individuals with (early) NAFLD and MetS, obtaining liver biopsies was not considered ethically feasible. This precluded direct histopathological confirmation of fibrosis stage or regression. While T1 mapping is a robust marker of tissue composition, it is not yet considered an absolute replacement for biopsy in all clinical or research contexts, especially in early-stage fibrosis. Second, hepatic steatosis can influence MRI-based parameters [43]. Although liver fat content was included in the adjusted analyses, residual confounding cannot be excluded. Advanced or iron-corrected T1 techniques might enhance specificity for fibrosis by factoring out the impact of hepatic iron and fat.
The relatively small cohort size and interindividual variability in demographic, anthropometric, and metabolic characteristics may also have limited statistical power, precision, and generalizability. Nevertheless, the longitudinal repeated-measures design increased analytical efficiency by capturing within-participant trajectories over time. Mixed-effects models were additionally used to account for within-participant correlation and relevant covariates, although residual heterogeneity cannot be excluded. Larger multicenter studies including independent and more diverse cohorts, appropriate control groups and adequate representation of both sexes are therefore required to validate and extend these findings. Finally, despite the observed performance of CK18, the lack of universal assay standardization remains a barrier to broader clinical implementation. Although the M30 Apoptosense assay used in this study is among the most extensively validated, differences in assay platforms and cutoff values across laboratories continue to complicate comparisons between studies.
Overall, our results suggest that MACK3 and CK18 warrant further investigation as potentially accessible markers of longitudinal changes in liver injury and fibrosis-related risk. Their consistent declines in tandem with liver fat content and T1 relaxation time at 1 month, suggest that they may capture early metabolic and inflammatory changes occurring during weight loss. However, the present study does not establish that these markers can replace imaging-based assessments or be implemented in routine clinical monitoring. Going forward, long-term studies should confirm whether these biomarker trends persist and whether composite algorithms that integrate both dynamic metabolic and collagen-turnover markers can further enhance diagnostic accuracy.
In conclusion, this work shows that MACK3 and CK18, along with T1 mapping, undergo measurable longitudinal changes during weight loss intervention in individuals with obesity, NAFLD, and MetS (or MASLD). These findings support their further evaluation as candidate markers of changes in liver injury and fibrosis-related risk. However, their clinical utility cannot be established from this single, modestly sized cohort, and validation in larger independent and appropriately controlled studies is required.
Supplementary Materials
The following supporting information can be downloaded at: Preprints.org, Supplementary Figure S1: Longitudinal Changes in Subcutaneous and Visceral Fat During the Weight Loss Intervention. Supplementary Table S1: Mixed-effects models of longitudinal changes in liver fibrosis markers during the weight loss intervention, adjusted for baseline age, sex, BMI, liver PDFF, and HOMA2-IR. Supplementary Table S2: Time-by-baseline characteristic interactions in linear mixed-effects models of liver fibrosis markers during the weight loss intervention.
Author Contributions
Conceptualization: AH, AA, KH, MM; Methodology: AA, AH, JBF, PV, RWR, MG, MM; Data curation: JDQ; Visualization: JDQ; Formal Analysis: AA, AH, MM JBF, PV, MG, KH, JDQ, MU, NAG; Original Draft Preparation: AA, AH, MM, JDQ, MU, NAG; Funding Acquisition: AH, MM; Writing – Review & Editing: All authors.
Funding
This work was supported by a research grant from the Danish Diabetes Academy, which is funded by the Novo Nordisk Foundation, Grant No. NNF17SA0031406, the Independent Research Fund Denmark, Grant No. 10.46540/3101-00394B, Project in Clinical and Translational Medicine, funded by the Novo Nordisk Foundation, Grant No. NNF22OC0080036, and research grant from the Region North’s Health Sciences Research Fund, Grant No. 2024-0069.
Data Availability Statement
Restrictions apply to the availability of some, or all data generated or analyzed during this study to preserve patient confidentiality. The corresponding author will on request detail the restrictions and any conditions under which access to some data may be provided.
Acknowledgments
The authors would like to thank and acknowledge Anne-Mette Haubro Christensen, Birthe H. Thomsen, Rikke Bülow Eschen, and Zuzana Valnickova Hansen for collecting blood samples. Kenneth Krogh Jensen for assisting in planning and performing the MRI examinations. Merete Grothe Christensen, Mette Brodersen, Line Rosengreen Kaldahl, and Katrine Bruhn Vogensen for performing height and weight measurements, and Anne Lone Larsen for performing ELISA for TIMP1 and CK18.
Conflicts of Interest Statement
The authors declare no conflicts of interest.
References
- Cerrito, L.; et al. “Present and Future Perspectives in the Treatment of Liver Fibrosis,” (in eng). Pharmaceuticals 2025, vol. 18(no. 9). [Google Scholar] [CrossRef] [PubMed]
- Lazarus, J. V.; et al. “Advancing the global public health agenda for NAFLD: a consensus statement,” (in eng). Nat. Rev. Gastroenterol. Hepatol. 2022, vol. 19(no. 1), 60–78. [Google Scholar] [CrossRef] [PubMed]
- Fabbrini, E.; Sullivan, S.; Klein, S. “Obesity and nonalcoholic fatty liver disease: biochemical, metabolic, and clinical implications,” (in eng). Hepatology 2010, vol. 51(no. 2), 679–89. [Google Scholar] [CrossRef] [PubMed]
- Quek, J.; et al. “Global prevalence of non-alcoholic fatty liver disease and non-alcoholic steatohepatitis in the overweight and obese population: a systematic review and meta-analysis,” (in eng). Lancet Gastroenterol. Hepatol. 2023, vol. 8(no. 1), 20–30. [Google Scholar] [CrossRef] [PubMed]
- Rinella, M. E.; et al. “A multisociety Delphi consensus statement on new fatty liver disease nomenclature,” (in eng). Hepatology 2023, vol. 78(no. 6), 1966–1986. [Google Scholar] [CrossRef] [PubMed]
- Ratziu, V.; et al. “Sampling variability of liver biopsy in nonalcoholic fatty liver disease,” (in eng). Gastroenterology 2005, vol. 128(no. 7), 1898–906. [Google Scholar] [CrossRef] [PubMed]
- “EASL-ALEH Clinical Practice Guidelines: Non-invasive tests for evaluation of liver disease severity and prognosis,” (in eng). J. Hepatol. 2015, vol. 63(no. 1), 237–64. [CrossRef] [PubMed]
- Castera, L.; Forns, X.; Alberti, A. “Non-invasive evaluation of liver fibrosis using transient elastography,” (in eng). J. Hepatol. 2008, vol. 48(no. 5), 835–47. [Google Scholar] [CrossRef] [PubMed]
- Vallet-Pichard, et al. “FIB-4: an inexpensive and accurate marker of fibrosis in HCV infection. comparison with liver biopsy and fibrotest,” (in eng). Hepatology 2007, vol. 46(no. 1), 32–6. [Google Scholar] [CrossRef] [PubMed]
- Velji-Ibrahim, J.; Woodard, J.; Alden, J.; Abrams, G. A. “FibroScan Discordance With Liver Biopsy Significantly Overestimates Advanced Fibrosis and Cirrhosis in MASLD Subjects With Class 3 Obesity: Implications for Resmetirom Eligibility,” (in eng). J. Clin. Gastroenterol. 2025. [Google Scholar] [CrossRef] [PubMed]
- Hoffman, D. H.; Ayoola, A.; Nickel, D.; Han, F.; Chandarana, H.; Shanbhogue, K. P. “T1 mapping, T2 mapping and MR elastography of the liver for detection and staging of liver fibrosis,” (in eng). Abdom. Radiol. (NY) 2020, vol. 45(no. 3), 692–700. [Google Scholar] [CrossRef] [PubMed]
- Li, Z.; et al. “Assessment of liver fibrosis by variable flip angle T1 mapping at 3.0T,” (in eng). J. Magn. Reson Imaging 2016, vol. 43(no. 3), 698–703. [Google Scholar] [CrossRef] [PubMed]
- Venkatesh, S. K.; Yin, M.; Ehman, R. L. “Magnetic resonance elastography of liver: technique, analysis, and clinical applications,” (in eng). J. Magn. Reson Imaging 2013, vol. 37(no. 3), 544–55. [Google Scholar] [CrossRef] [PubMed]
- Feldstein, E.; Wieckowska, A.; Lopez, A. R.; Liu, Y. C.; Zein, N. N.; McCullough, A. J. “Cytokeratin-18 fragment levels as noninvasive biomarkers for nonalcoholic steatohepatitis: a multicenter validation study,” (in eng). Hepatology 2009, vol. 50(no. 4), 1072–8. [Google Scholar] [CrossRef] [PubMed]
- Nie, Q. H.; et al. “Correlation between TIMP-1 expression and liver fibrosis in two rat liver fibrosis models,” (in eng). World J. Gastroenterol. 2006, vol. 12(no. 19), 3044–9. [Google Scholar] [CrossRef] [PubMed]
- Collazos, J.; Díaz, F. “Role of the measurement of serum procollagen type III N-terminal peptide in the evaluation of liver diseases,” (in eng). Clin. Chim. Acta 1994, vol. 227(no. 1-2), 37–43. [Google Scholar] [CrossRef] [PubMed]
- Hemmann, S.; Graf, J.; Roderfeld, M.; Roeb, E. “Expression of MMPs and TIMPs in liver fibrosis - a systematic review with special emphasis on anti-fibrotic strategies,” (in eng). J. Hepatol. 2007, vol. 46(no. 5), 955–75. [Google Scholar] [CrossRef] [PubMed]
- Boursier, J.; et al. “Screening for therapeutic trials and treatment indication in clinical practice: MACK-3, a new blood test for the diagnosis of fibrotic NASH,” (in eng). Aliment Pharmacol. Ther. 2018, vol. 47(no. 10), 1387–1396. [Google Scholar] [CrossRef] [PubMed]
- Canivet, C. M.; et al. “Validation of the Blood Test MACK-3 for the Noninvasive Diagnosis of Fibrotic Nonalcoholic Steatohepatitis: An International Study With 1924 Patients,” (in eng). Clin. Gastroenterol. Hepatol. 2023, vol. 21(no. 12), 3097–3106.e10. [Google Scholar] [CrossRef] [PubMed]
- Forns, X.; et al. “Identification of chronic hepatitis C patients without hepatic fibrosis by a simple predictive model,” (in eng). Hepatology 2002, vol. 36 no. 4 Pt 1, 986–92. [Google Scholar] [CrossRef] [PubMed]
- Askeland, et al. Non-invasive liver fibrosis markers are increased in obese individuals with non-alcoholic fatty liver disease and the metabolic syndrome. Sci. Rep. vol. 15(no. 1), 10652, 2025/03/27 2025. [CrossRef] [PubMed]
- Takawy, M. W.; Abdelmalek, M. F. Impact of Weight Loss on Metabolic Dysfunction Associated Steatohepatitis and Hepatic Fibrosis. Curr. Diabetes Rep. vol. 25(no. 1), 23, 2025/02/18 2025. [CrossRef] [PubMed]
- Alberti, K. G.; Zimmet, P.; Shaw, J. “Metabolic syndrome--a new world-wide definition. A Consensus Statement from the International Diabetes Federation,” (in eng). Diabet. Med. 2006, vol. 23(no. 5), 469–80. [Google Scholar] [CrossRef] [PubMed]
- WHO.
- Friedewald, W. T.; Levy, R. I.; Fredrickson, D. S. “Estimation of the concentration of low-density lipoprotein cholesterol in plasma, without use of the preparative ultracentrifuge,” (in eng). Clin. Chem. 1972, vol. 18(no. 6), 499–502. [Google Scholar] [CrossRef]
- Levy, J. C.; Matthews, D. R.; Hermans, M. P. “Correct homeostasis model assessment (HOMA) evaluation uses the computer program,” (in eng). Diabetes Care 1998, vol. 21(no. 12), 2191–2. [Google Scholar] [CrossRef] [PubMed]
- Hines G, K. I.; Holman, R. HOMA2 Calculator. accessed. (accessed on 21 October 2022).
- Steinkohl, E.; Olesen, S. S.; Hansen, T. M.; Drewes, A. M.; Frøkjær, J. B. “T1 relaxation times and MR elastography-derived stiffness: new potential imaging biomarkers for the assessment of chronic pancreatitis,” (in eng). Abdom. Radiol. (NY) 2021, vol. 46(no. 12), 5598–5608. [Google Scholar] [CrossRef] [PubMed]
- Campo, C. A.; Hernando, D.; Schubert, T.; Bookwalter, C. A.; Pay, A. J. V.; Reeder, S. B. “Standardized Approach for ROI-Based Measurements of Proton Density Fat Fraction and R2* in the Liver,” (in eng). AJR Am. J. Roentgenol. 2017, vol. 209(no. 3), 592–603. [Google Scholar] [CrossRef] [PubMed]
- Hong, C. W.; et al. “Optimization of region-of-interest sampling strategies for hepatic MRI proton density fat fraction quantification,” (in eng). J. Magn. Reson Imaging 2018, vol. 47(no. 4), 988–994. [Google Scholar] [CrossRef] [PubMed]
- Gjela, M.; Askeland, A.; Mellergaard, M.; Drewes, A. M.; Handberg, A.; Frøkjær, J. B. “Intra-pancreatic fat deposition and its relation to obesity: a magnetic resonance imaging study,” (in eng). Scand. J. Gastroenterol. 2024, vol. 59(no. 6), 742–748. [Google Scholar] [CrossRef] [PubMed]
- Brandt, A. G.; Vestergaard, P.; Harsløf, T.; Juhl, C. B.; Rasmussen, N. H.-H.; Frost, M. Association Between Muscle Status and Bone Size, Density, and Strength in Type 1 Diabetes: A Cross-sectional Study. J. Clin. Endocrinol. Metab. 2025, p. dgaf245. [Google Scholar] [CrossRef] [PubMed]
- Sterling, R. K.; et al. “Development of a simple noninvasive index to predict significant fibrosis in patients with HIV/HCV coinfection,” (in eng). Hepatology 2006, vol. 43(no. 6), 1317–25. [Google Scholar] [CrossRef] [PubMed]
- Tavaglione, F.; et al. “Development and Validation of a Score for Fibrotic Nonalcoholic Steatohepatitis,” (in eng). Clin. Gastroenterol. Hepatol. 2023, vol. 21(no. 6), 1523–1532.e1. [Google Scholar] [CrossRef] [PubMed]
- “MACK3.”. accessed.
- Mesropyan, N.; et al. “Dixon-Based Water T1 Mapping for Fat-Corrected Assessment of Hepatic Fibrosis in Chronic Liver Disease,” (in eng). Invest Radiol. 2025. [Google Scholar] [CrossRef] [PubMed]
- Liu, et al. “Hepatic steatosis leads to overestimation of liver stiffness measurement in both chronic hepatitis B and metabolic-associated fatty liver disease patients,” (in eng). Clin. Res. Hepatol. Gastroenterol. 2022, vol. 46(no. 8), 101957. [Google Scholar] [CrossRef] [PubMed]
- Bansal, S.; Vachher, M.; Arora, T.; Kumar, B.; Burman, A. Visceral fat: A key mediator of NAFLD development and progression. Hum. Nutr. Metab. vol. 33, 200210, 2023/09/01/ 2023. [CrossRef]
- Nixdorf, et al. Rapid improvement of hepatic steatosis and liver stiffness after metabolic/bariatric surgery: a prospective study. Sci. Rep. 2024/07/30 2024, vol. 14(no. 1), 17558. [Google Scholar] [CrossRef] [PubMed]
- Gummlich, B. P. M.; Raddatz, D.; Gollisch, K. S. C. Intensive lifestyle intervention positively affects nonalcoholic fatty liver fibrosis score (NFS) and key metabolic parameters: A retrospective study. Hum. Nutr. Metab. vol. 35, 200247, 2024/03/01/ 2024. [CrossRef]
- Lassailly, G.; et al. “Bariatric Surgery Provides Long-term Resolution of Nonalcoholic Steatohepatitis and Regression of Fibrosis,” (in eng). Gastroenterology 2020, vol. 159(no. 4), 1290–1301.e5. [Google Scholar] [CrossRef] [PubMed]
- Li, S.; Li, X.; Xiao, H.; Dou, J. The relationship between liver stiffness, fat content measured by liver elastography, and coronary artery disease: a study based on the NHANES database. Sci. Rep. vol. 15(no. 1), 30010, 2025/08/16 2025. [CrossRef] [PubMed]
- Masrour, et al. Diagnostic accuracy of transient elastography in MASLD is independent of MRI-PDFF steatosis in a multicenter study. JHEP Rep. vol. 7(no. 12), 101589, 2025/12/01/ 2025. [CrossRef] [PubMed]
Figure 1.
A) Overview of the study timeline from screening/baseline visit, introduction with dietician, intervention start, 1 month study visit, follow up visits at the dietician and 5 months study visit. Created with BioRender.com. B) Consort diagram of study population and exclusion information, showing number of participants that were: included (n=34), excluded (n=2), eligible (n=32), withdrew (n=2), and the final study population (n=30).
Figure 1.
A) Overview of the study timeline from screening/baseline visit, introduction with dietician, intervention start, 1 month study visit, follow up visits at the dietician and 5 months study visit. Created with BioRender.com. B) Consort diagram of study population and exclusion information, showing number of participants that were: included (n=34), excluded (n=2), eligible (n=32), withdrew (n=2), and the final study population (n=30).
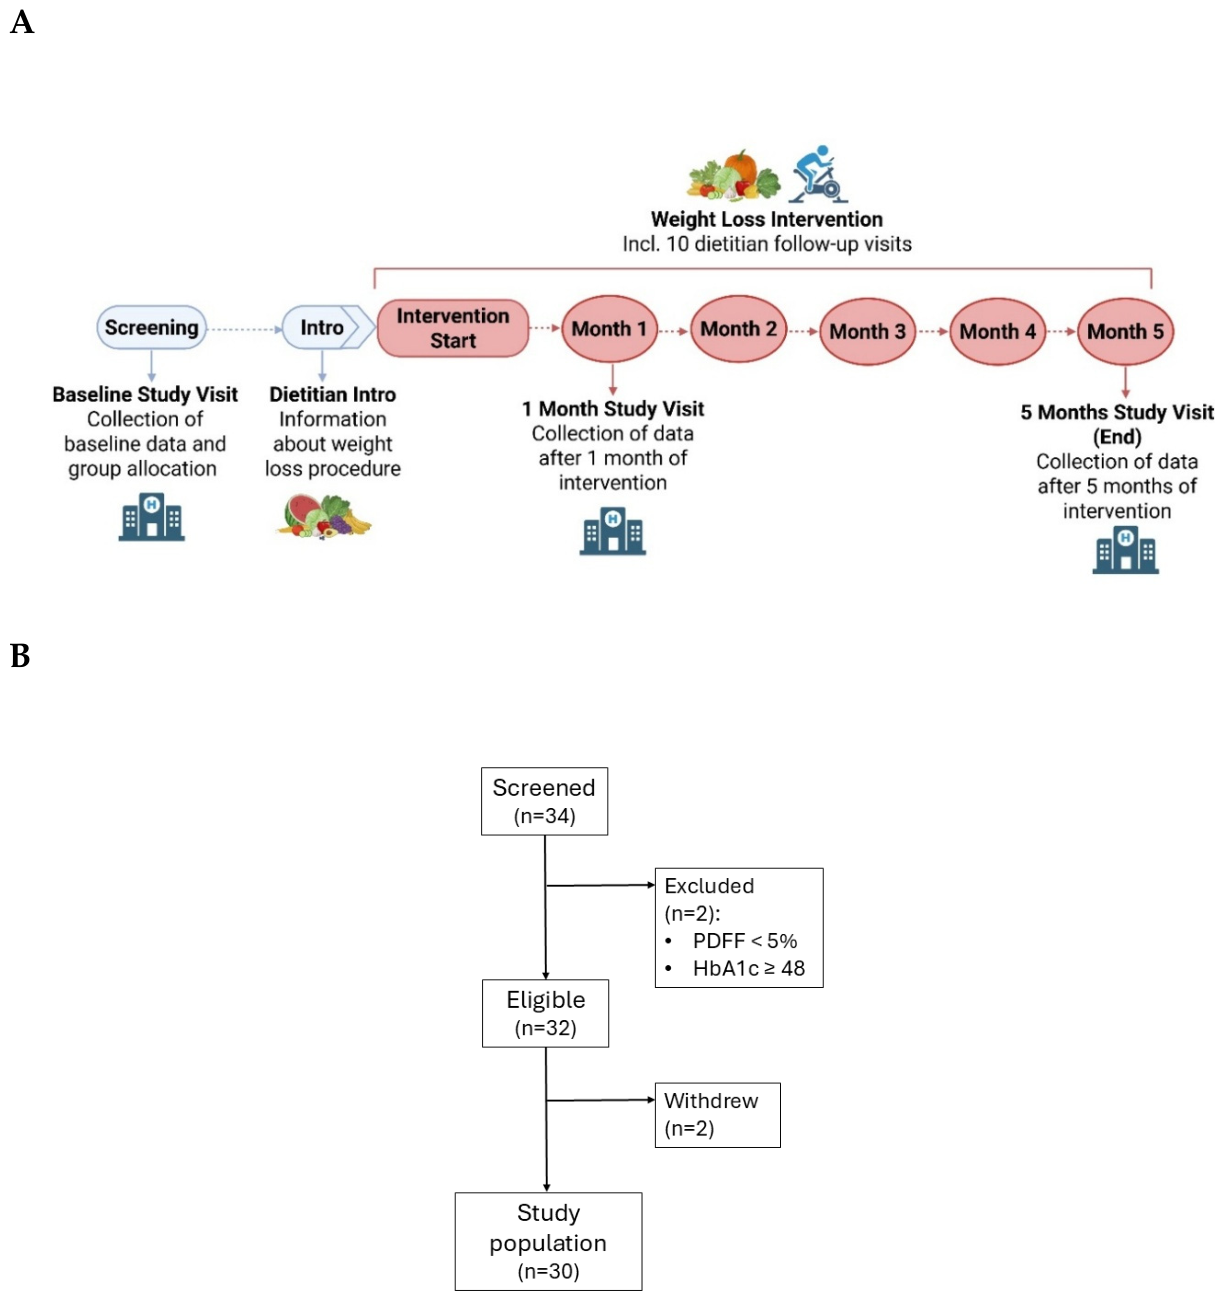
Figure 2.
Longitudinal changes in BMI, fat depots, and metabolic parameters during the weight loss intervention assessed at baseline (BL), 1 month (1M), and 5 months (5M). Data presented as paired dot-plots showing changes during the intervention for A) BMI (kg/m2), B) HOMA2-IR , C) HbA1c (mmol/mol), D) total body fat (%), E) liver fat content (PDFF), F) representative PDFF images from one participant at baseline (~ 30% liver fat content), 1 month (~ 15% liver fat content), and 5 months (< 5% liver fat content). Error bars: Mean ± SD. Significance levels: * (p-value < 0.05), ** (p-value < 0.01), ***(p-value < 0.001), ****(p-value < 0.0001).
Figure 2.
Longitudinal changes in BMI, fat depots, and metabolic parameters during the weight loss intervention assessed at baseline (BL), 1 month (1M), and 5 months (5M). Data presented as paired dot-plots showing changes during the intervention for A) BMI (kg/m2), B) HOMA2-IR , C) HbA1c (mmol/mol), D) total body fat (%), E) liver fat content (PDFF), F) representative PDFF images from one participant at baseline (~ 30% liver fat content), 1 month (~ 15% liver fat content), and 5 months (< 5% liver fat content). Error bars: Mean ± SD. Significance levels: * (p-value < 0.05), ** (p-value < 0.01), ***(p-value < 0.001), ****(p-value < 0.0001).
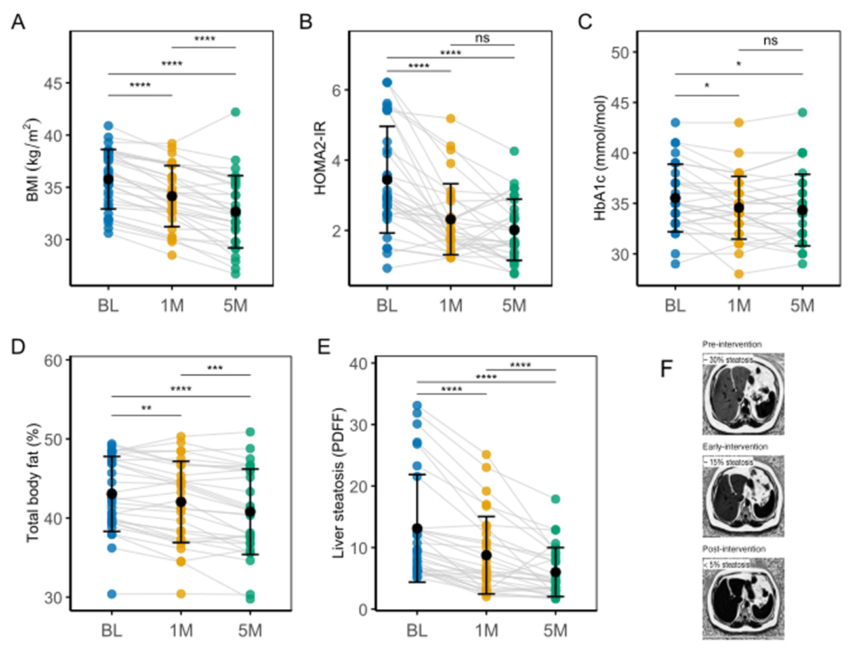
Figure 3.
Longitudinal changes in noninvasive liver fibrosis–related markers during the weight loss intervention assessed at baseline (BL), 1 month (1M), and 5 months (5M). Paired box plots show changes over time in A) T1 relaxation time, B) liver stiffness (MRE), C) CK18 (U/L), D) PIIINP (µg/L), E) TIMP1 (ng/mL), F) MACK3 score G) FNI index, H) FIB4 index, and I) Forns score. Error bars: Mean ± SD. Significance levels: * (p-value < 0.05), ** (p-value < 0.01), ***(p-value < 0.001), ****(p-value < 0.0001).
Figure 3.
Longitudinal changes in noninvasive liver fibrosis–related markers during the weight loss intervention assessed at baseline (BL), 1 month (1M), and 5 months (5M). Paired box plots show changes over time in A) T1 relaxation time, B) liver stiffness (MRE), C) CK18 (U/L), D) PIIINP (µg/L), E) TIMP1 (ng/mL), F) MACK3 score G) FNI index, H) FIB4 index, and I) Forns score. Error bars: Mean ± SD. Significance levels: * (p-value < 0.05), ** (p-value < 0.01), ***(p-value < 0.001), ****(p-value < 0.0001).
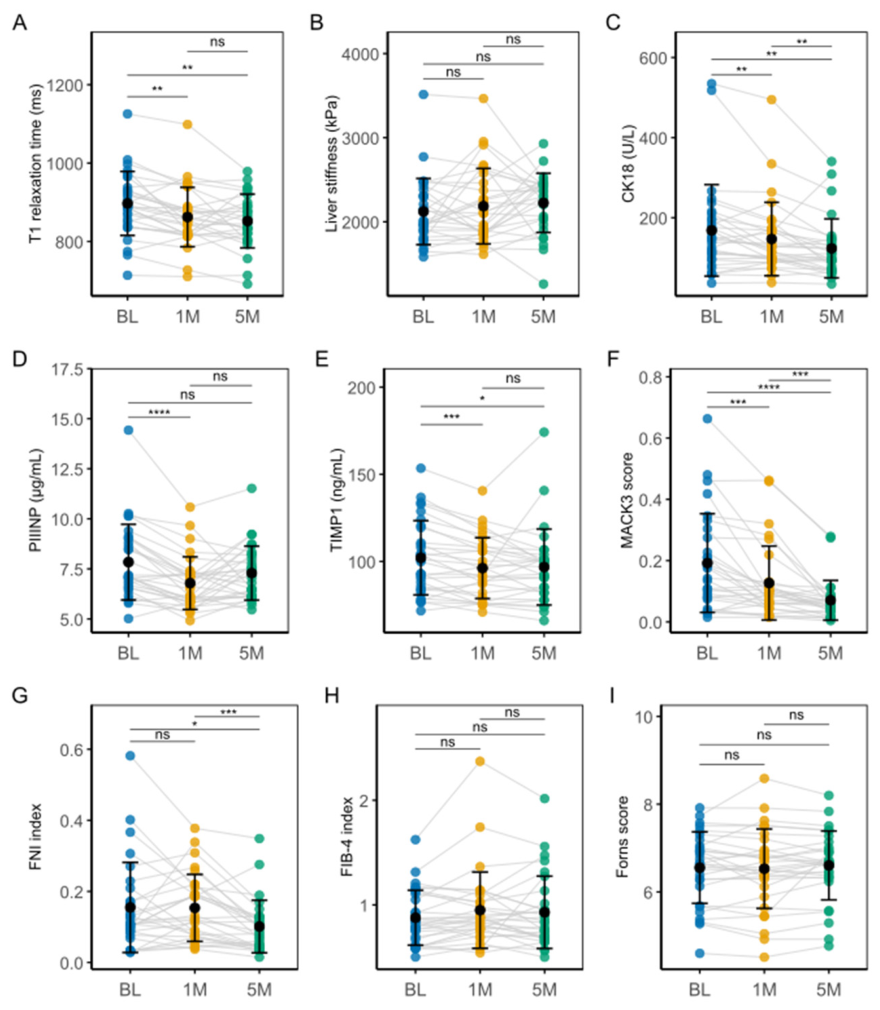
Figure 4.
Relative differences per week (%) in weight loss temporality between baseline to 1 month (BL to 1M) and 1 to 5 months (1M to 5M) for A) BMI, B) liver fat content, C) total body fat, D) subcutaneous fat, E) Visceral fat area. Error bars: Mean ± SD. Significance levels: * (p-value < 0.05), ** (p-value < 0.01), ***(p-value < 0.001), ****(p-value < 0.0001).
Figure 4.
Relative differences per week (%) in weight loss temporality between baseline to 1 month (BL to 1M) and 1 to 5 months (1M to 5M) for A) BMI, B) liver fat content, C) total body fat, D) subcutaneous fat, E) Visceral fat area. Error bars: Mean ± SD. Significance levels: * (p-value < 0.05), ** (p-value < 0.01), ***(p-value < 0.001), ****(p-value < 0.0001).
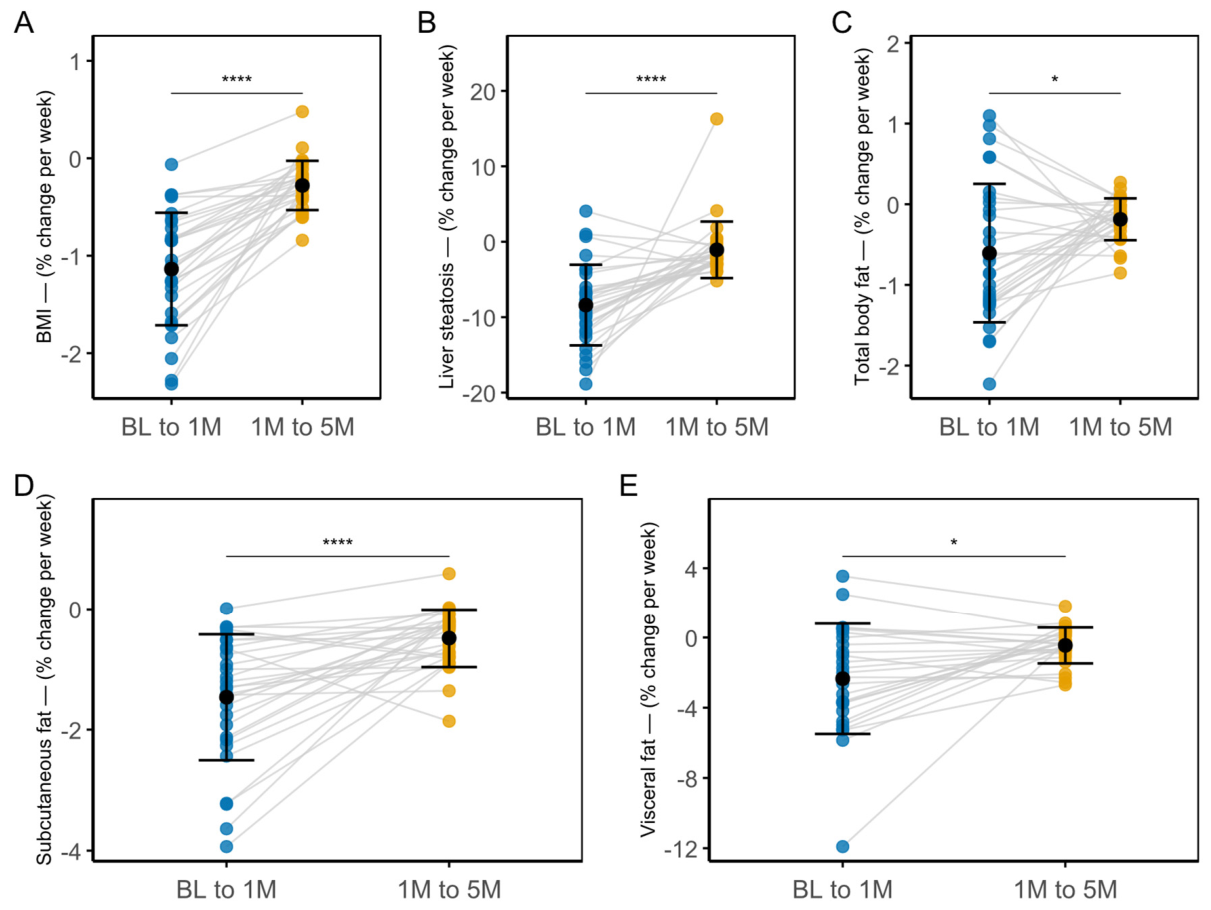
Figure 5.
Relative differences per week (%) in weight loss temporality between baseline to 1 month (BL to 1M) and 1 to 5 months (1M to 5M) for A) T1 relaxation time, B) MRE, C) CK18, D) PIIINP, E) TIMP1, F) MACK3 score, G) FIB4, H) Forns score, and I) FNI index. Error bars: Mean ± SD. Significance levels: * (p-value < 0.05), ** (p-value < 0.01), ***(p-value < 0.001), ****(p-value < 0.0001).
Figure 5.
Relative differences per week (%) in weight loss temporality between baseline to 1 month (BL to 1M) and 1 to 5 months (1M to 5M) for A) T1 relaxation time, B) MRE, C) CK18, D) PIIINP, E) TIMP1, F) MACK3 score, G) FIB4, H) Forns score, and I) FNI index. Error bars: Mean ± SD. Significance levels: * (p-value < 0.05), ** (p-value < 0.01), ***(p-value < 0.001), ****(p-value < 0.0001).
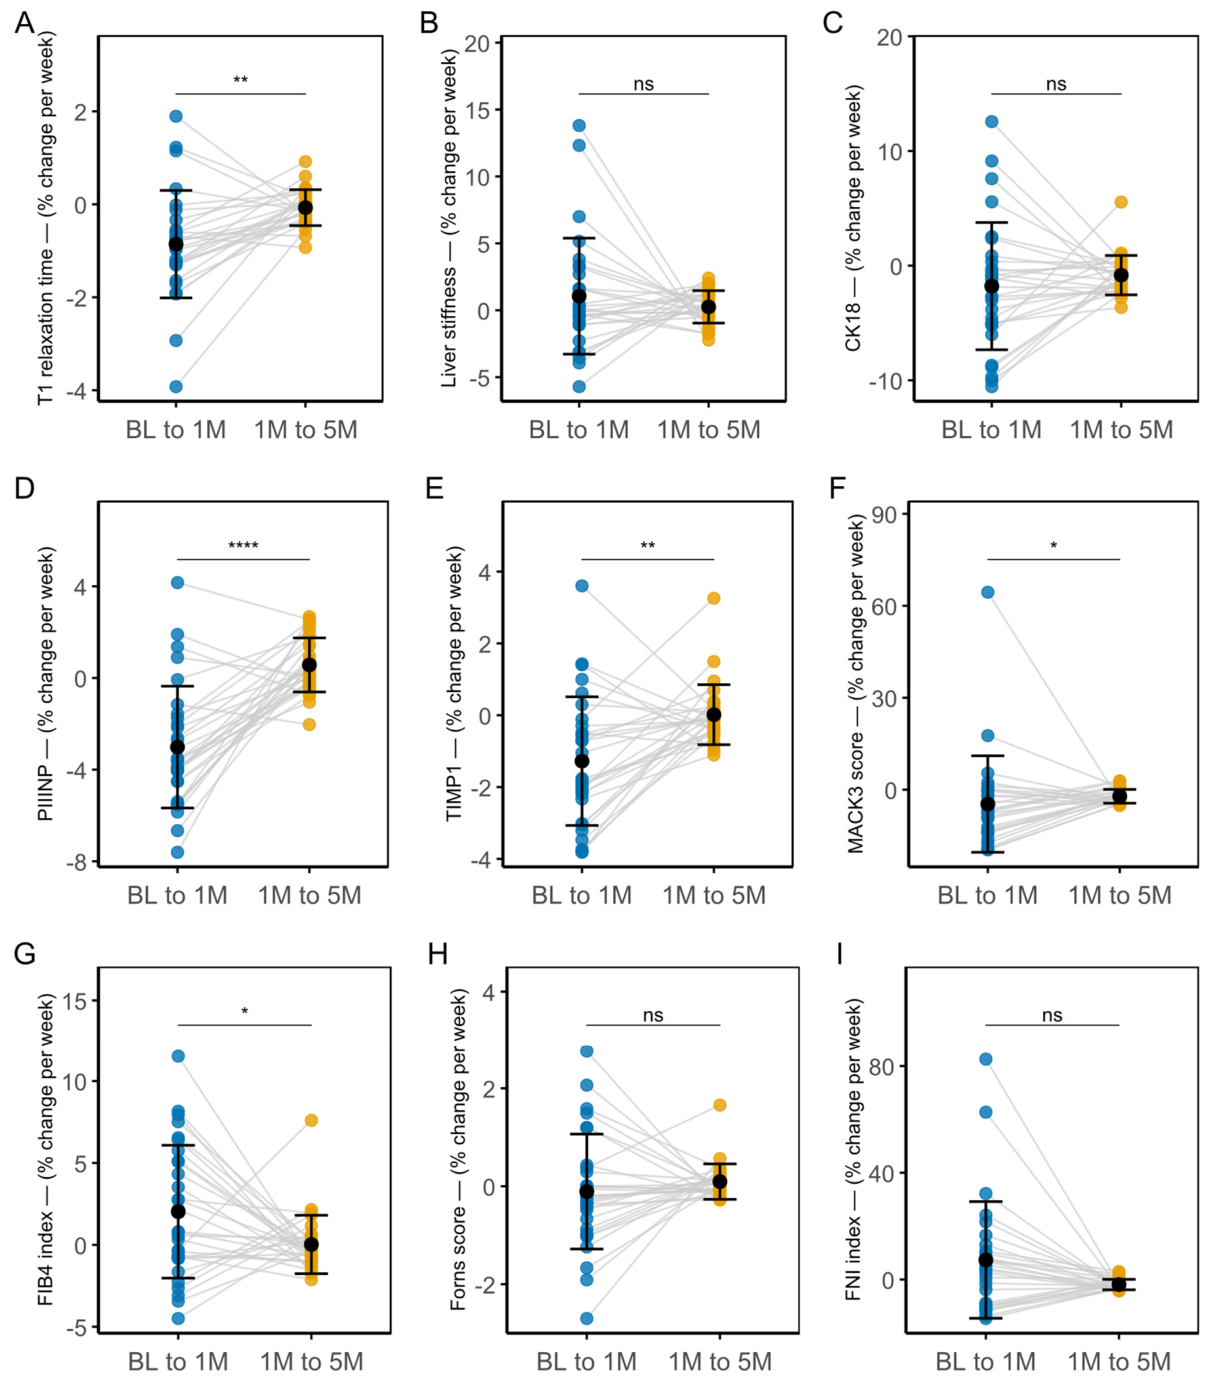
Figure 6.
Predictive performance of fibrosis algorithms and imaging parameters in estimating T1 relaxation time. A) Overview of LASSO regression models trained on all intervention data, BL and 1M data, and BL and 5M data. (B-D) Scatter plots show the correlation between predicted and observed T1 values for BL and 1M (B), BL and 5M (C), and all intervention data (D), with the corresponding R² values representing the Pearson correlation coefficient. Higher R² values indicate better predictive performance.
Figure 6.
Predictive performance of fibrosis algorithms and imaging parameters in estimating T1 relaxation time. A) Overview of LASSO regression models trained on all intervention data, BL and 1M data, and BL and 5M data. (B-D) Scatter plots show the correlation between predicted and observed T1 values for BL and 1M (B), BL and 5M (C), and all intervention data (D), with the corresponding R² values representing the Pearson correlation coefficient. Higher R² values indicate better predictive performance.
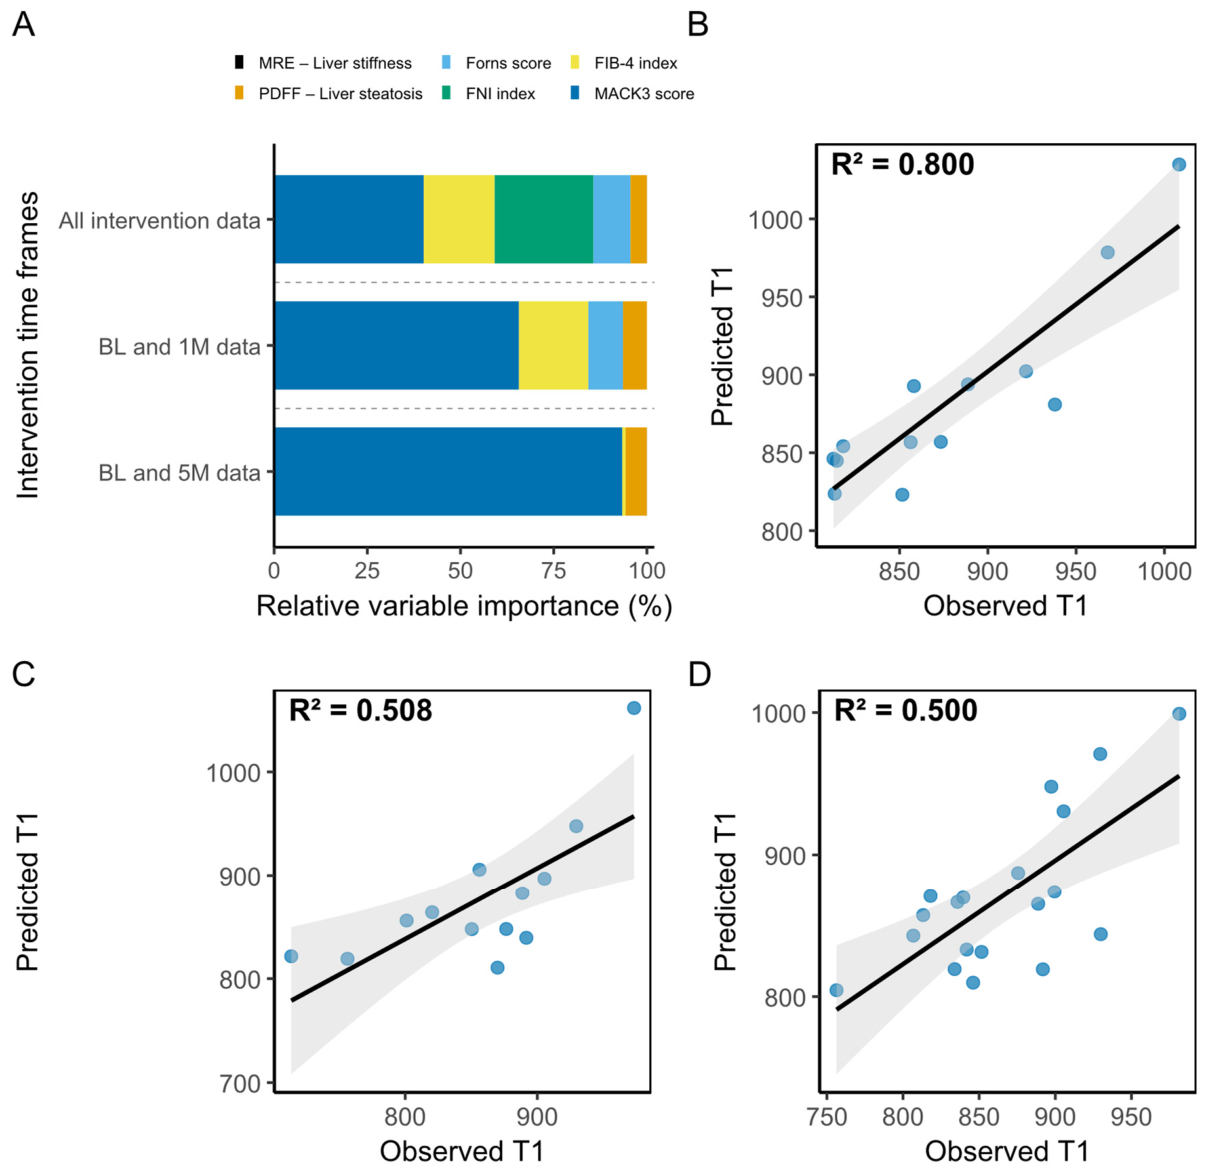

Table 1.
Clinical and metabolic features of all participants according to study visit.
|
Characteristic |
Visit |
p-value |
||
| Baseline (n=30) | 1 Month (n=30) | 5 Months (n=30) | ||
| General | ||||
| Age1 | 48.1 (7.1) | |||
| Female2 | 18/30 (60%) | 18/30 (60%) | 18/30 (60%) | 1a |
| Male2 | 12/30 (40%) | 12/30 (40%) | 12/30 (40%) | 1a |
| BMI (kg/m2)1 | 35.8 (2.8) | 34.2 (2.9) | 32.7 (3.5) | <0.0001b |
| WHtR1 | 0.65 (0.04) | 0.62 (0.04) | 0.60 (0.04) | <0.0001b |
| Liver steatosis2 | 30/30 (100%) | 19/30 (63.3%) | 13/30 (43.3%) | <0.0001b |
| Liver enzymes | ||||
| ALT (U/L)1 | 33.7 (16.5) | 32.6 (13.2) | 26.6 (10.6) | 0.02b |
| AST (U/L)1 | 25.6 (7.6) | 25.6 (6.4) | 22.2 (5.5) | 0.01b |
| Lipids | ||||
| Triglycerides (mmol/L)1 | 1.6 (0.7) | 1.6 (0.7) | 1.4 (0.7) | 0.01b |
| HDL (mmol/L)1 | 1.2 (0.2) | 1.1 (0.2) | 1.2 (0.2) | 0.006b |
| LDL (mmol/L)1 | 3.1 (0.7) | 2.7 (0.7) | 2.9 (0.7) | 0.02b |
| Cholesterol (mmol/L)1 | 4.9 (0.8) | 4.5 (0.8) | 4.7 (0.9) | 0.02b |
| Metabolism | ||||
| Glucose (mmol/L)1 | 5.9 (0.6) | 5.6 (0.5) | 5.5 (0.6) | <0.001b |
| Insulin (pmol/L)1 | 159.7 (74.1) | 106.4 (47.9) | 92.7 (39.8) | <0.0001b |
| GGT (U/L)1 | 38.3 (25.3) | 29.8 (19.4) | 29.9 (13.7) | <0.0001b |
| HOMA2-IR1 | 3.4 (1.5) | 2.3 (1.0) | 2.0 (0.9) | <0.0001b |
| HbA1C (mmol/mol)1 | 35.5 (3.4) | 34.6 (3.1) | 34.3 (3.6) | 0.03b |
| MetS components | ||||
| Blood pressure2 | 27/30 (90%) | 23/30 (76.7%) | 23/30 (76.7%) | 0.17c |
| Central obesity2 | 30/30 (100%) | 30/30 (100%) | 30/30 (100%) | 1c |
| Glucose2 | 24/30 (80%) | 16/30 (53.5%) | 11/30 (36.7%) | <0.0001c |
| HDL2 | 19/30 (63.3%) | 21/30 (70%) | 16/30 (53.3%) | 0.15c |
| Triglycerides2 | 10/30 (33.3%) | 12/30 (40%) | 21/30 (70%) | 0.02c |
| MetS2 | 30/30 (100%) | 27/30 (90%) | 21/30 (70%) | 0.002c |
1Mean (SD); 2n (%); ap-value estimated by Pearson’s Chi-squared test; bp-value estimated by Friedman test; cp-value estimated by Cochran’s Q test. AST: Aspartate transaminase; ALT: Alanine transaminase; GGT: Gamma-glutamyltransferase; HbA1C: Glycated hemoglobin; HDL: High density lipoprotein; HOMA2-IR: homeostasis model assessment 2 for insulin resistance LDL: Low-density lipoprotein; MetS: the metabolic syndrome; WHtR: Waist-to-height ratio.
Table 2.
Spearman’s correlation factor of T1 with selected variables.
|
T1 relaxation time at baseline |
T1 relaxation time at 1 month |
T1 relaxation time at 5 months | |
| MRE | -0.351 (0.057) | -0.160 (0.415) | 0.364 (0.057) |
| CK18 (U/L) | 0.328 (0.077) | 0.145 (0.452) | 0.065 (0.748) |
| PIIINP (µg/L) | -0.056 (0.768) | -0.215 (0.263) | 0.148 (0.451) |
| TIMP1 (ng/mL) | 0.324 (0.081) | 0.250 (0.190) | 0.122 (0.544) |
| FORNS Score | 0.233 (0.215) | -0.032 (0.869) | -0.151 (0.445) |
| FIB-4 index | 0.380 (0.038)* | -0.045 (0.817) | -0.136 (0.489) |
| FNI index | 0.377 (0.043)* | -0.045 (0.818) | -0.382 (0.049)* |
| MACK3 score | 0.382 (0.041)* | 0.138 (0.485) | -0.228 (0.264) |
Values are presented as Spearman’s rank correlation coefficient (p-value).
Disclaimer/Publisher’s Note: The statements, opinions and data contained in all publications are solely those of the individual author(s) and contributor(s) and not of MDPI and/or the editor(s). MDPI and/or the editor(s) disclaim responsibility for any injury to people or property resulting from any ideas, methods, instructions or products referred to in the content. |
© 2026 by the authors. Licensee MDPI, Basel, Switzerland. This article is an open access article distributed under the terms and conditions of the Creative Commons Attribution (CC BY) license.
Copyright: This open access article is published under a Creative Commons CC BY 4.0 license, which permit the free download, distribution, and reuse, provided that the author and preprint are cited in any reuse.