

Submitted:
15 July 2026
Posted:
17 July 2026
You are already at the latest version
Abstract
Sulfur dioxide (SO2) is an antimicrobial and reductant used in the production of fermented beverages. Its effect on the oxidation-reduction potential (ORP) during alcoholic fermentation of apple cider has never been recorded. In this study, apple juice was fermented with a 30 mg/L free SO2 addition (RED) and without (CON). Fermentation ki-netics, ORP, basic chemistry, organic acids, nitrogenous compounds, free and total SO2, glutathione, phenolics, and volatiles were monitored, and sensory analysis was conducted. Sulfur dioxide had no effect on fermentation kinetics, nitrogen utilization, ethanol yield, or the volatile composition of the apple ciders. The ORP (vs. Ag/AgCl reference electrode) reached maximum values of 310 mV in CON and 218 mV in RED before alcoholic fermentation, and minimum values of –94 mV and –136 mV, respectively, near peak alcoholic fermentation. Mean ORP values were –29 mV in CON and –47 mV in RED, but no differences were found between the ORP of CON and RED using net area under the curve (AUC). SO2 preserved monomeric, dimeric, and increased the pool of sulfonated flavan-3-ols. The sensory composition of the ciders in CON showed higher banana aroma whereas RED trended towards reduction aromas. SO2 additions in apple cider preserved phenolics, inhibited MLF, and increased reduction aroma with no effects on fermentation kinetics and ORP.
Keywords:
apple cider
; aroma
; glutathione
; oxidation-reduction potential
; phenolics
; sulfur dioxide
1. Introduction
The fermented beverage produced from apple juice, commonly referred to as hard cider, or more broadly as cider, can be traced to the writings of Gaius Plinius Secundus, known as Pliny the Elder, who mentioned cider production in the first century AD [1]. Fast forward to today, cider production has grown to a global scale. In 2024, the largest producers included the United Kingdom (8.19 M hL), South Africa (4.60 M hL), the United States (1.55 M hL), Australia (1.30 M hL), Spain (1.03 M hL), and Argentina (1.01 M hL), with smaller-scale production also occurring in Canada, Germany, Ireland, and France [2]. In parallel with this expansion, apple cider has experienced increasing popularity in the United States in recent years [3]; reportedly, the number of cideries in the United States increased 7-fold from 2011 to 2023 [4], perhaps due to the beverage’s relatively lower ethanol content (compared to that of wine) and the rising awareness of ethanol-related health risks [5]. As a result, there is growing interest in research aiming to improve apple cider production and quality.
Separate from cooking apples or dessert apples, apples destined for cider making have been classified into four primary categories: sour, bitter-sour, bitter-sweet, and sweet. This system of classification is based upon differences in acidity, sugar, and phenolic content [6]. As discussed by Ye et al. (2014) [7] and Ramos-Aguilar et al. (2017) [8], malic acid (2.5 to 4.9 g/L) is the predominant organic acid in apple juice, while citric acid, quinic acid, glycolic acid, succinic acid, lactic acid, galacturonic acid, and citramalic acid have been described in trace amounts [9]. In addition, the average total carbohydrate content of cider apples, defined here primarily as the combined concentration of glucose and fructose, with minor contributions from sucrose, sorbitol, and starch, has been reported to be approximately 125 g/L [10], or approximately 12.5 ºBrix when expressed as soluble sugar equivalents. At this concentration and using the theoretical maximum ethanol yield of 0.51 g ethanol per 1 g of sugar, the average cider would theoretically contain approximately 8.1% (v/v) ethanol.
Phenolic compounds in cider are responsible for the perception of bitterness, astringency, and brown color. These compounds are typically classified into several groups: hydroxycinnamic acids, flavan-3-ols (including condensed tannins), flavonols, and dihydrochalcones [11]. In a study on English ciders, total phenolic concentrations ranged from 44 to 1559 mg/L, with hydroxycinnamic acids reported as the predominant group of phenolic compounds. In the same study, flavan-3-ols, which contribute primarily to the perception of bitterness, and condensed tannins, which are associated with the drying tactile sensation known as astringency, were present at concentrations ranging from 8 to 722 mg/L. This wide range highlights the substantial variability in bitterness and astringency among apples and their respective ciders [11]. Among the phenolic compounds present in apple cider, catechin-derived flavan-3-ols and condensed tannins were found to be the most susceptible to oxidation, a process initiated by the presence of dissolved oxygen (DO) [12].
The mechanisms of oxidation in cider remain unclear. However, the cider matrix may facilitate oxidation pathways similar to those observed in wine, where these mechanisms are relatively well described. Oxidation pathways have been broadly categorized as either biological or chemical. Biological oxidation refers to enzyme-mediated oxidation; for example, polyphenol oxidases (PPOs) are the enzyme responsible for the oxidation of phenolic compounds in juice and must. Polyphenol oxidases are present in apples, although to a varying extent [13], and act by preferentially oxidizing hydroxycinnamic acids and flavan-3-ols over other phenolics [14]. The resulting quinones proceed to oxidize other cider components or polymerize with other phenolic compounds, leading to the formation of brown pigments. Polyphenol oxidase requires molecular oxygen (O2) as a co-substrate and therefore only catalyzes these reactions under aerobic conditions, which are generally met during the pre-fermentative phase [15,16]. Additionally, environments of pH < 5 drastically slow the rate of PPO activity [17,18]. In contrast, chemical oxidation involves the oxidation of chemical species through the formation of reactive oxygen species (ROS) derived from the well-described metal-mediated Fenton reaction [19]. In this process, Fe2+ reduces oxygen to hydrogen peroxide (H2O2), which is reduced again by Fe2+ to the hydroxyl radical (HO•), the latter of which is highly reactive and capable of oxidizing any compound it encounters [20].
Sulfur dioxide (SO2) is a chemical antioxidant commonly added to apple juice or cider. In addition to quenching hydrogen peroxide (H2O2) and thereby preventing the downstream formation of more powerful oxidizing agents [21], SO2 controls the proliferation of microbes [22], reduces polyphenol oxidase activity by more than 90% [21], and binds acetaldehyde and other carbonyl compounds that can significantly reduce the quality of a fermented beverage [23]. Although SO2 is a strong reducing agent, the reactions it participates in are largely irreversible, implying they may not constitute true redox couples (acetaldehyde binding, while reversible, does not involve electron transfer). SO2 may therefore not contribute directly to the oxidation-reduction potential (ORP), a processing parameter that has recently drawn increased attention in commercial alcoholic beverage production. The ORP is instead governed by chemically reversible half-cell reactions [24,25], so any decrease in ORP observed after SO2 additions likely reflects an indirect effect, with SO2 reducing other redox-active species rather than participating directly itself.
Rather than measuring dissolved oxygen directly, the ORP reflects the ratio of oxidized to reduced forms among redox-active species present in solution at a given time [26]. These include tartrate-bound ferrous and ferric iron (Fe2+/Fe3+), cuprous and cupric copper (Cu1+/Cu2+), and glutathione in its reduced and oxidized forms (GSH/GSSG). Iron and copper drive the Fenton reaction through redox cycling, while the sulfhydryl group of GSH readily reduces reactive oxygen species and quinones back to their parent phenols [27,28], cycling reversibly between GSH and GSSG in the process [29]. Although some authors argue that the ORP is primarily determined by the coupled oxidation of ethanol and reduction of O2 [24], it has been generally observed that the ORP decreases during alcoholic fermentation, a trend attributed to the activity of Saccharomyces cerevisiae through the release of GSH, production of ethanol, consumption of oxygen, and the physical stripping of O2 from solution by the release of carbon dioxide (CO2) [25,30,31]. In wine alcoholic fermentation, it has been proposed that maintaining an ORP of –70 mV, measured using a silver/silver chloride (Ag/AgCl) reference electrode, causes the hydrogen sulfide: elemental sulfur (H2S/Sº) redox couple to remain as elemental sulfur, thereby limiting reduction aromas associated with the chemical reduction of ºS to H2S at low ORP values [32]. Therefore, maintaining ORP values above –70 mV may also be of significant value during apple cider production.
There is to date no scientific report of the evolution of the oxidation-reduction potential during cider making. The latter is especially puzzling as it is anecdotally believed that the sole use of SO2 during cider making invariably precludes the formation of volatile sulfur compounds mediated by a drop of the ORP during cider fermentation. This study, therefore, aims to establish baseline ORP trends and values throughout alcoholic fermentation of apple juice and evaluate the chemical and sensory effects of SO2 additions made prior to alcoholic fermentation.
2. Materials and Methods
2.1. Apple Processing & Cider Making
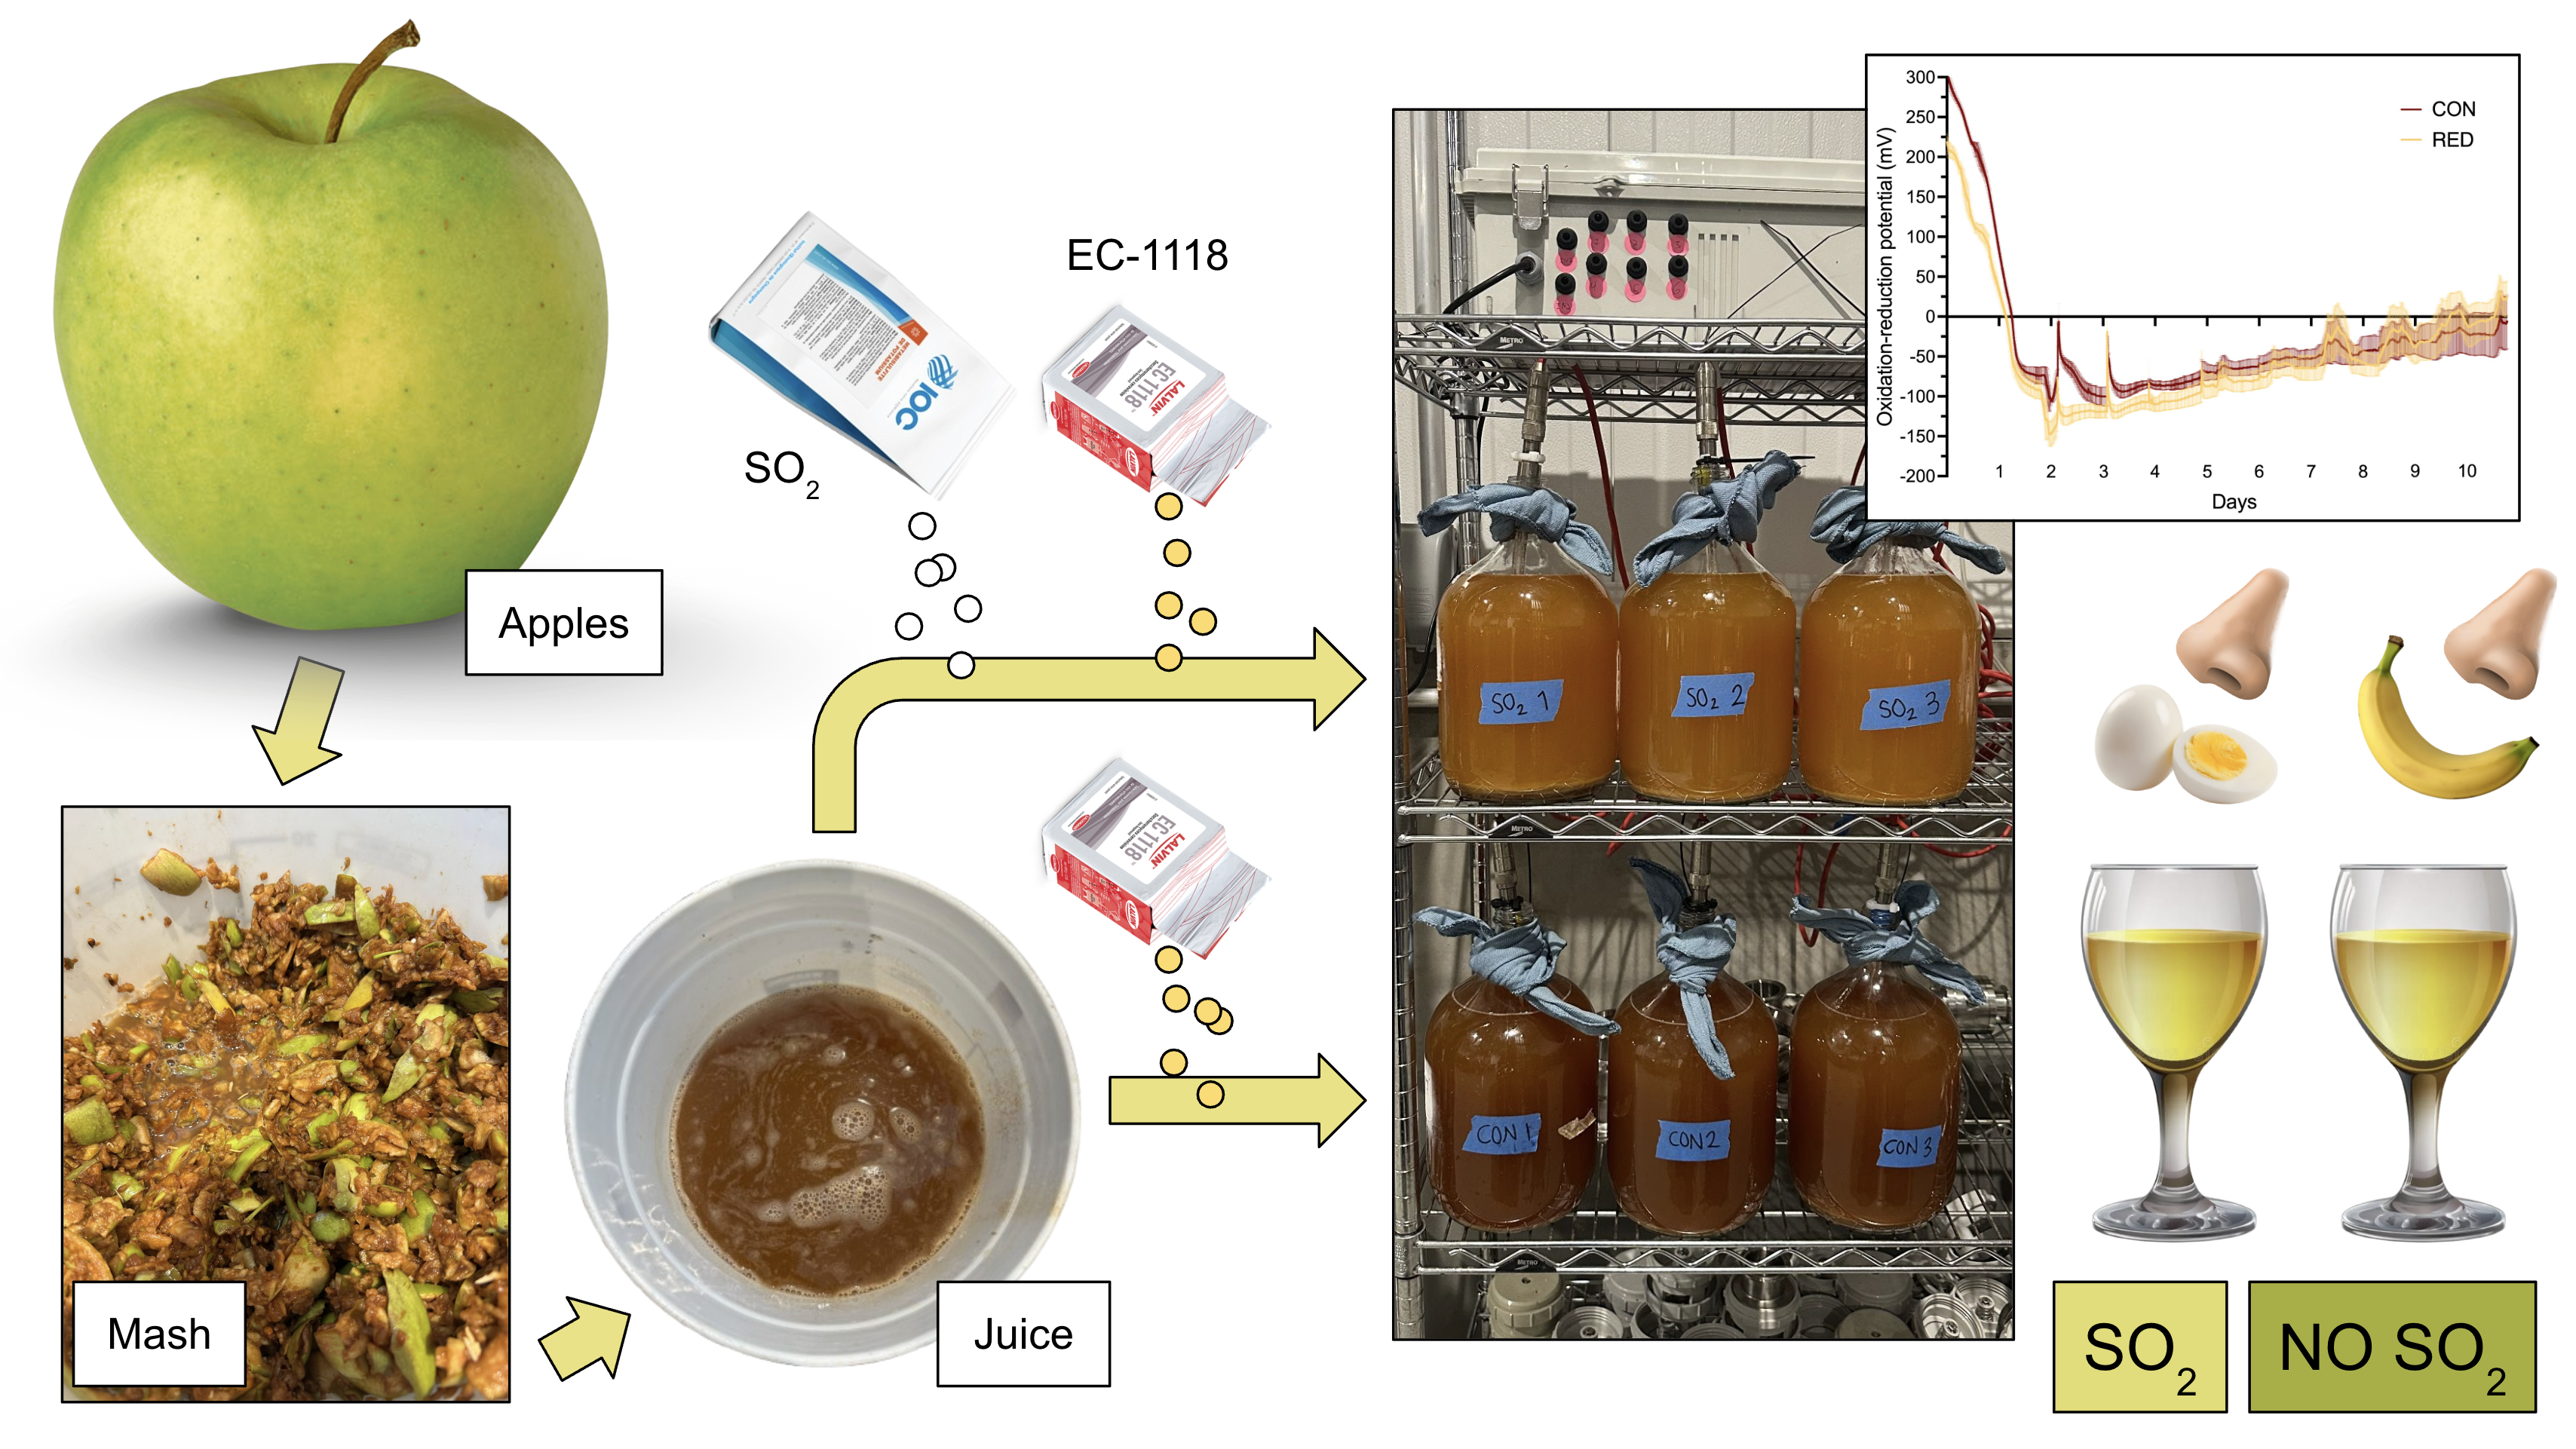
Seventy kg of apples (approximately 50/50% cv. Crispin and Granny Smith) were harvested from two locations in San Luis Obispo, California, and transported to the California Polytechnic State University Research Winery for processing. The apples were quartered by hand and milled using a modified wine grape destemmer (Enoitalia, Calmasino, Di Bardolino, Italy). After milling, the mash was left to macerate for two hours in food-grade buckets with Lallzyme EX™ (6 g/100 kg; Lallemand, Montreal, Quebec, Canada). The mash was pressed using a stainless steel hydropress (Enotecnica Pillan, Camisano Vicentino, Italy), yielding 40.7 L of fresh juice, which was collected in a stainless steel variable capacity tank (The Vintner Vault, Paso Robles, CA, USA). Sixty g/hL Actimax Plus (Agrovin, Alcázar de San Juan, Castilla-La Mancha, Spain) was added to the variable capacity tank and mixed thoroughly.
The juice was divided into 3.785 L glass jug fermentors at random (Figure 1): both treatments were performed in triplicate and were labeled CON (n=3) and RED (n=3). Thirty mg/L SO2 solution (Institut Œnologique de Champagne, Mardeuil, France) was added to the fermentors labeled RED, and 30 g/hL EC-1118 yeast (Lallemand, Montreal, Quebec, Canada) was added to both CON and RED treatments and their replicates three hours after SO2 additions. An ORP control system (MeshVines, Davis, CA, USA) and ORP sensors (Hamilton Company, Reno, NV, USA), which were secured to the mouth of each jug so the platinum tip of each sensor was fully submerged into the juice, were employed to collect and record ORP data shortly following inoculation. Any space between the ORP sensors and the mouths of the fermentors was covered with cloth to prevent environmental contamination. ºBrix and temperature (ºC) were monitored once a day with a DMA 35 (Anton Paar, Graz, Austria).
Three-min-long air sparges (5 L of air/min; 15 L air delivered per sparging event) were conducted at 1/3 ºBrix drop (day 2 of alcoholic fermentation) and day 3 of alcoholic fermentation through 3.175 mm inner diameter plastic tubing. Measurement of the ORP was stopped 10 days after the onset of alcoholic fermentation, and the cider was racked into clean glass vessels. The racked ciders were stored at 15 °C for two days then racked again and bottled in 750 mL Bordeaux bottles with conglomerated corks (Diem 30, 49 mm height x 23.5 mm diameter, G3 Enterprises, Modesto, CA, USA) without filtration.
2.2. Chemical Analyses
2.2.1. Basic Chemistry
Prior to chemical analysis, all samples were centrifuged at ambient temperature for 8 min at 15,000 g in an Eppendorf Model 5415D microcentrifuge (Eppendorf, Enfield, CT, USA). Basic chemistry: pH, titratable acidity (TA, g/L), and ethanol content (% v/v) were measured with an Orion Star A211 pH meter, an HI 901W Automatic Titrator (Hanna Instruments, Woonsocket, RI, USA), and an Alcolyzer Wine M analysis system (Anton Paar, Graz, Austria), respectively.
2.2.2. Colorimetric Analysis
The SPICA (Admeo, Angwin, CA, USA) and commercially available kits (Biosystems, Barcelona, Spain) was used to measure glucose+fructose, glycerol, acetaldehyde, acetic acid, lactic acid, malic acid, tartaric acid, free and total SO2, ammonia, yeast assimilable nitrogen (YAN), and primary amino nitrogen (PAN). Full scans (200 to 800 nm), total color (measured as the sum of 420 nm, 520 nm, and 620 nm wavelength absorbance units) and CIELAB coordinates (L*, lightness value; a*, red vs. green; and b*, yellow vs. blue) were collected using a Cary 60 UV-Vis spectrophotometer and an 18 sample cell auto sampler (Agilent Technologies, Santa Clara, CA, USA). Total phenolics (mg/L gallic acid equivalents) were determined using a previously described method [33], and tannins (mg/L (+)-catechin equivalents) by protein precipitation.
2.2.3. Flavan-3-ols
Cider samples were analyzed before alcoholic fermentation and at racking with a 1260 Infinity II liquid chromatograph (Agilent Technologies, Santa Clara, CA, USA) in conjunction with an Ultivo mass spectrometer (MS) (Agilent Technologies, Santa Clara, CA, USA), which was set to scan from 100 to 1400 m/z. To begin, 10 μL of apple cider sample was injected into a Zorbax Eclipse Plus C18 column (4.6 × 100 mm, 3.5 µm; Agilent Technologies, Santa Clara, CA, USA). Mobile phases included: (A) 0.1% formic acid in water and (B) 0.1% formic acid in acetonitrile. Solvent flow rate was adjusted to 0.8 mL/min, and the column temperature was adjusted to 25 °C. The solvent flow rate was: 3% (B) at 0 min, 3% (B) at 2 min, 6% (B) at 10 min, 42% (B) at 25 min, 100% (B) at 30 min, and 3% (B) at 32.5 min. The autosampler tray (Agilent Technologies, Santa Clara, USA) was adjusted to 10 °C, and samples were run using dual electrospray ionization (ESI) in negative mode. The ESI source conditions were as follows: drying gas (11.0 L/min, 325 °C), nebulizer pressure (35 psi), capillary voltage (3000 V), and fragmentor voltage (130 V). Using MS, data were collected across a mass range of m/z 100 to 2000. All instruments were calibrated following the manufacturer’s protocol before analysis.
2.2.4. Glutathione
Both GSH and GSSG were measured with a previously described method [34], similar to the method for flavan-3-ols above, but with the following differences: column temperature was set to 40 °C and the flow rate to 0.6 mL/min; the elution gradient was 2% Solvent (B) at 0 min; 2 to 10% Solvent (B) at 0.6 min; 10 to 100% Solvent (B) at 5 min, and 100% Solvent (B) from 6 to 8 min. Adjustments in ESI conditions were made as follows: gas flow, 5 L/min; gas temperature, 300 °C; nebulizer pressure, 30 psi; and capillary voltage, 4500 V. GSH was quantified with a transition from 308 m/z to 179 m/z, and GSSG from 613 m/z to 355 m/z.
2.2.5. Volatile Composition
Prior to analysis, volatile compounds were absorbed from cider samples onto polydimethylsiloxane (PDMS) coated stir bars (Twister®, Gerstel, Germany) using previously described methods [35,36]. The Twister® stir bars were placed directly into the samples and set to stir (1000 rpm) for one hour at ambient temperature. A thermal desorption unit (TDU2, Gerstel, Germany) coupled to a cooled injection system (CIS-4, Gerstel, Germany) with a 20 mg Tenax TA® lining was used to thermally desorb the samples. Previously described methods were used to determine thermal desorption and chromatographic conditions [36]. An 8890 gas chromatograph (GC) (Agilent Technologies, Santa Clara, CA, USA) coupled to a triple quadrupole (QqQ) 7000D MS (Agilent Technologies, Santa Clara, CA, USA) running in simple quadrupole mode was used to separate the desorbed volatiles. Volatiles were quantified using calibration curves from pure standards, which were diluted in model wine with the following attributes: 13.5% (v/v) ethanol, 5 g/L TA, pH 3.60, and 20 mg/L free SO2. Internal standards were calibrated using the following > 95% pure standards: 2-phenylethyl acetate, β-citronellol, β-ionone, cis-rose oxide, ethyl butyrate, ethyl cinnamate, ethyl decanoate, ethyl hexanoate, ethyl isovalerate, ethyl n-octanoate, geraniol, hexyl acetate, isoamyl acetate, linalool, methyl salicylate, nerol, and trans-nerolidol. Compounds that were not included in the calibration were identified with mass spectra (NIST library) and quantified as γ-hexalactone equivalents.
2.3. Sensory Analysis
A panel of 11 individuals experienced in wines (6 males, 5 females) conducted descriptive analysis in the ciders of both treatments and their replicates for aroma and retronasal flavor. The sensory descriptors used for both aroma and flavor were defined by consensus and included green apple, banana, flint or matchstick, and reduction (Supplementary Table S1). These were selected beforehand by a group of three expert sensory scientists. Prior to evaluation, the panelists received a short training in which they were instructed to swirl each sample in the glass to evaluate its aroma, sip the sample, swirl it in the mouth for five seconds, and then expectorate.
Panelists evaluated the samples in individual sensory booths lit by red light (Luna 3AO, 18:18W, Zaniboni Lighting, Clearwater, FL, USA) to avoid bias due to color. Samples were chilled to 5 °C [37] and served in clear pear shaped ISO glasses one at a time through a sliding door in a randomized order. Water (Fiji, The Wonderful Company, Los Angeles, CA, USA) and unsalted crackers (Nabisco, East Hanover, NJ, USA) were provided ad libitum for palate cleansing between samples. The perceived intensity of each descriptor was recorded using the generalized labeled magnitude scale (gLMS). RedJade software (RedJade, Pleasant Hill, CA, USA) was used to conduct the evaluation. Consent to participate forms were obtained from all panelists before testing, and the study was approved by the California Polytechnic State University Institutional Review Board (IRB) under IRB Protocol #2020-058.
2.4. Statistical Analyses
Data were collected and organized as tables in Excel (Microsoft, Redmond, WA, USA), and statistical analysis was performed in JMP Pro 18 (JMP Statistical Discovery LLC, Cary, NC, USA). Welch’s two-sample t-test (two-sided, α = 0.05) was used to examine differences between CON and RED. One-way ANOVA and Duncan’s post hoc test were used to determine which replicates were perceived to have more aroma or flavor in sensory analysis. Prism (GraphPad Software Inc., La Jolla, CA, USA) was used to graph all figures besides Figure 1, which was made in Google Slides (Google, Mountain View, CA, USA).
3. Results and Discussion
3.1. Fermentation Kinetics
3.1.1. Brix & Temperature
Before the onset of alcoholic fermentation, the apple juice contained 12 ºBrix of soluble solids. Ten days after the onset of alcoholic fermentation, glucose+fructose was recorded as < 2 g/L in both CON (0.05 g/L) and RED (0.05 g/L), with no significant differences among treatments. There were also no significant differences in the area under the curve (AUC) for ºBrix (p = 0.7977) or temperature (p = 0.2564) between CON and RED from days 1 through 10 of alcoholic fermentation (Figure 2).
These data suggest that a 30 mg/L SO2 addition prior to alcoholic fermentation had no significant impact on the fermentation kinetics of apple cider. These results align with work by [22], who found no difference in the overall time of alcoholic fermentation in reconstituted apple juice with and without SO2 additions under more extreme conditions (100 mg/L vs. 0 mg/L) than the present work. However, the same work mentioned faster rates of alcoholic fermentation within the first ten days when 100 mg/L SO2 was added, likely due to the inhibition of non-fermentative microbes and polyphenol oxidases, which have been shown to compete with S. cerevisiae for dissolved oxygen [38]. When fitted with linear trend lines, no differences were observed in the slopes of sugar consumption between CON (slope = −1.58; R2 = 0.77) and RED (slope = −1.58; R2 = 0.77) in the present experiment. This may be explained by the relatively low SO2 addition (30 mg/L) to apple juice at pH 3.41 (and 0.74 mg/L molecular SO2) (Supplementary Table S2), compared with the study by [22], in which 100 mg/L free SO2 was added to apple juice at pH 3.7 (1.27 mg/L molecular SO2).
3.1.2. Oxidation-Reduction Potential
There were no significant differences in the average ORP (CON, –29 mV; RED, –47 mV) or in the AUC of the ORP between CON and RED during alcoholic fermentation (Figure 3). The highest average ORP values observed in CON and RED were 310 mV and 218 mV, respectively, whereas the lowest average values recorded were –94 mV and –136 mV, respectively. Despite the absence of significant differences in the ORP, the mean and maximum ORP values of CON were 18 mV and 92 mV higher than those of RED, respectively, while the minimum ORP of RED was 42 mV lower than the minimum of CON.
Previous studies on the vinification of wine have reported ORP fluctuations between –120 mV and 120 mV, with values reaching up to 300 mV following air mixing events in Petit Sirah [39], between –80 mV and 120 mV during the alcoholic fermentation of Syrah [40], between –10 mV and 190 mV during alcoholic fermentation of Grenache and Mataro in which the ORP was controlled to remain above –10 mV by air injection [41], and between –150 mV and 150 mV during the fermentation of Chardonnay [42]. A study on the alcoholic fermentation of agave plant cores for Mezcal production reported ORP values ranging from –150 mV to 100 mV [43]. In the present study, the ORP ranged from 310 mV in the juice before the onset of alcoholic fermentation in CON to –136 mV at peak fermentation in RED; values which fall into the range observed in the studies described above. These observations taken as a whole suggest that the biological activity of S. cerevisiae is the primary factor influencing the drop in the ORP during alcoholic fermentation, a factor that may depend upon the chemical composition of the juice (including SO2) that is being fermented. This ORP trajectory during alcoholic fermentation is likely driven by the release of redox-active sulfhydryl compounds such as GSH [32,44] or NADH and NADPH [45] from S. cerevisiae. Based upon results herein presented, there does not seem to be evidence that the evolution of ORP during alcoholic fermentation of apple cider is significantly different from that of wine and other products that undergo glycolysis followed by alcoholic fermentation.
3.2. Basic Chemistry
No statistical differences in titratable acidity (CON, 5.67 g/L; RED, 5.98 g/L) and ethanol (CON, 6.47% (v/v); RED, 6.40% (v/v)) were observed in the finished apple ciders; however, a small but statistically significant difference of 0.06 pH units was observed between CON (pH 3.39) and RED (pH 3.45) (p = 0.0241) (Supplementary Table S2). Since SO2 can inhibit malolactic fermentation (MLF), which converts the stronger diprotic malic acid into the weaker monoprotic lactic acid, inhibition of MLF would be expected to preserve acidity and maintain a lower pH. In agreement with this mechanism, RED ciders retained higher malic acid concentrations and exhibited lower lactic acid concentrations relative to CON. Despite this inhibition of MLF, RED displayed a slightly higher pH. Given the modest magnitude of the difference in pH (0.06 units), this shift may reflect subtle differences in yeast organic acid metabolism rather than a direct effect of SO2 on acid chemistry. The practical significance of this small pH difference is likely limited.
No tartaric acid (Supplementary Table S2) was detected in the apple juice, nor in the finished ciders after racking. These results align with previous findings by Ma et al. (2018) [46], who found only trace levels of tartaric acid in the apples Malus toringo, Malus sieversii, and Malus sylvestris. No differences in acetic acid (Supplementary Table S2) were observed between treatments after racking. However, lactic acid (Supplementary Table S2) was higher in CON (0.28 g/L) than in RED (0.01 g/L) (p = 0.0108), and malic acid (Supplementary Table S2) was 11% higher in RED (4.92 g/L) than in CON (4.42 g/L) (p = 0.0034) after racking. These results suggest that MLF was inhibited by SO2 in RED but, conversely, facilitated in CON ciders [22]. Malic acid was found to be the predominant acid in the apple ciders of the present study (accounting for 92% and 98% of all measured acids in CON and RED, respectively), aligning with previous findings by Ma et al. (2018) [46]. These results underscore the role of SO2 as an MLF inhibitor during apple cider production. However, the small differences in lactic acid are, practically and sensorially, likely irrelevant.
As for nitrogenous compounds, there were no differences in YAN, PAN, or ammonia (Supplementary Table S2) between CON and RED after racking, indicating that EC-1118 metabolized similar amounts of nitrogenous compounds during alcoholic fermentation of apple cider regardless of SO2 treatment.
3.3. Sulfur Dioxide & Acetaldehyde
Following the addition of 30 mg/L free SO2 to RED, 23 mg/L free SO2 was detected in the juice, indicating an immediate loss of 7 mg/L free SO2. As intended, SO2 was undetectable in CON juice. At racking, free SO2 concentrations were < 1 mg/L in both CON and RED (Supplementary Table S3). However, at the same time point, total SO2 (Supplementary Table S3) was 127% higher in RED (26 mg/L) than in CON (11 mg/L) (p < 0.0001). These results suggest that free SO2 was depleted in both treatments by racking, likely due to its reactivity with acetaldehyde and its role in quenching reactive oxygen species [19,47]. Consistent with this interpretation, acetaldehyde concentrations were 23% higher in CON than in RED after racking (p < 0.0001) (Supplementary Table S3), indicating that a portion of the free SO2 added in RED was bound to acetaldehyde. It should also be noted that the 11 mg/L of total SO2 observed in CON at racking was likely attributed to the sulfur reduction pathway of S. cerevisiae, in which sulfate is reduced intracellularly to SO2, and, when produced in excess, diffuses out of the cells as a metabolic by-product [48].
3.4. Glutathione
In the apple juice, GSH and GSSG concentrations (Supplementary Table S3) were 3 mg/L and 1 mg/L. Previous studies have shown the native concentration of GSH in grape musts to vary between 0 and 100 mg/L [44,49]. However, native GSH levels of apple juice have not been reported in the literature. Nonetheless, GSH and GSSG concentrations of the apple cider in the present study were low relative to grape musts. No statistical differences were observed in GSH between CON (3 mg/L) and RED (2 mg/L), nor in GSSG between CON (1 mg/L) and RED (1 mg/L) at racking. These data suggest that SO2 additions before alcoholic fermentation of apple cider had no impact on biological GSH production or the GSH/GSSG ratio, which was reflected by negligible differences in the ORP.
3.5. Phenolics & Color
There were no differences in total tannins, total phenolics, or 420 nm absorbance units (AU) between CON and RED after racking (Figure 4). There were also no statistical differences in CIELAB coordinates (Supplementary Table S4). However, there were differences in total (p = 0.0257), monomeric (p = 0.0416), dimeric (p = 0.0056), and sulfonated (p = 0.0149) flavan-3-ols, as well as epicatechin (p = 0.0467).
Previous work by Marks et al. (2007) [11] detected catechin and epicatechin in 23 different samples of apple cider, with catechin ranging from 4 to 38 mg/L and epicatechin ranging from 1 to 106 mg/L. The present study detected catechin and epicatechin at < 1 mg/L, regardless of treatment, suggesting that flavan-3-ols fell below the previously reported range. Cider apples have been reported to contain 10-fold the phenolic content of dessert apples like cv. Crispin and Granny Smith apples [50]. This observation was reflected in the low phenolic content of the ciders in the present study. Despite low concentrations, total flavan-3-ols, monomeric flavan-3-ols, dimeric flavan-3-ols, sulfonated flavan-3-ols, and epicatechin were 36%, 24%, 92%, 58%, and 32% higher in RED than CON at racking (Figure 5). This suggests that flavan-3-ols were protected from oxidation in RED compared to CON, attributable to the antioxidative effect of SO2 via polyphenol oxidase inhibition [51], direct oxygen scavenging, ROS quenching, and phenolic regeneration [52,53].
Phenolics have not been noted to influence the ORP during alcoholic fermentation [25]. It should be noted, however, that despite the current understanding that phenolics play no direct role in governing the ORP [54,55], they may play a secondary role by reducing Fe3+ to Fe2+, therefore leading to a decrease in the ORP at the expense of their own oxidation [56]. Altogether, the role of phenolics in governing the ORP of apple cider requires further investigation.
3.6. Volatile Compounds
There were no differences in the concentrations of individual esters, terpenes, total esters, or total terpenes between CON and RED at racking (Figure 6). Odor activity values (OAVs; Supplementary Figure S1), which indicate whether a volatile compound may be perceived, were calculated by dividing the concentration of each volatile compound by its corresponding odor threshold [57]. Odor thresholds were obtained from previously published studies (Supplementary Table S5) [57,58,59,60,61,62,63,64,65,66]. Among the measured volatiles, ethyl butyrate, ethyl hexanoate, ethyl isovalerate, hexyl acetate, isoamyl acetate, geraniol, nerol, β-citronellol, and trans-nerolidol exhibited OAVs > 1. No differences in OAVs were observed between CON and RED.
Regardless of treatment, it should be noted that ethyl hexanoate, an ester formed from the condensation of hexanoic acid and ethyl alcohol, accounted for 84% of the total ester concentration of the ciders. This compound has been widely identified in apple cider [67,68,69] and has been described to contribute to the perception of apple peel and fruit aromas in red wine [70]. Similarly, nerol, a monoterpene synthesized through the mevalonate pathway [71] that has not yet been reported in apple cider, accounted for 89% of the total terpenoid concentration across all ciders in the present study. In wine grapes, nerol has been shown to be concentrated in berry skins [72]. Therefore, the high nerol concentrations observed in the present study may be attributed to mash handling practices, as the crushed apples were allowed to macerate on skins for two hours on Lallzyme EX™. To provide perspective, the average nerol concentration across all ciders was 55.6 mg/L, which was 89.7- and 163.5-times higher than concentrations reported in wines produced from the aromatic grape varieties Moscato Branco and Moscato Bianco, respectively [73].
Other works have found that SO2 additions before alcoholic fermentation increased terpenoid and ester production [74,75] in wine alcoholic fermentations. However, we propose that the 30 mg/L free SO2 addition at the beginning of alcoholic fermentation was quickly bound to acetaldehyde or oxidized to sulfate by radical quenching. This was supported by free SO2 data, which showed both CON and RED contained only < 1 mg/L free SO2 at racking. The lack of differences in volatile compounds between CON and RED can therefore be explained by practically negligible differences in free SO2 during alcoholic fermentation.
3.7. Sensory Analysis
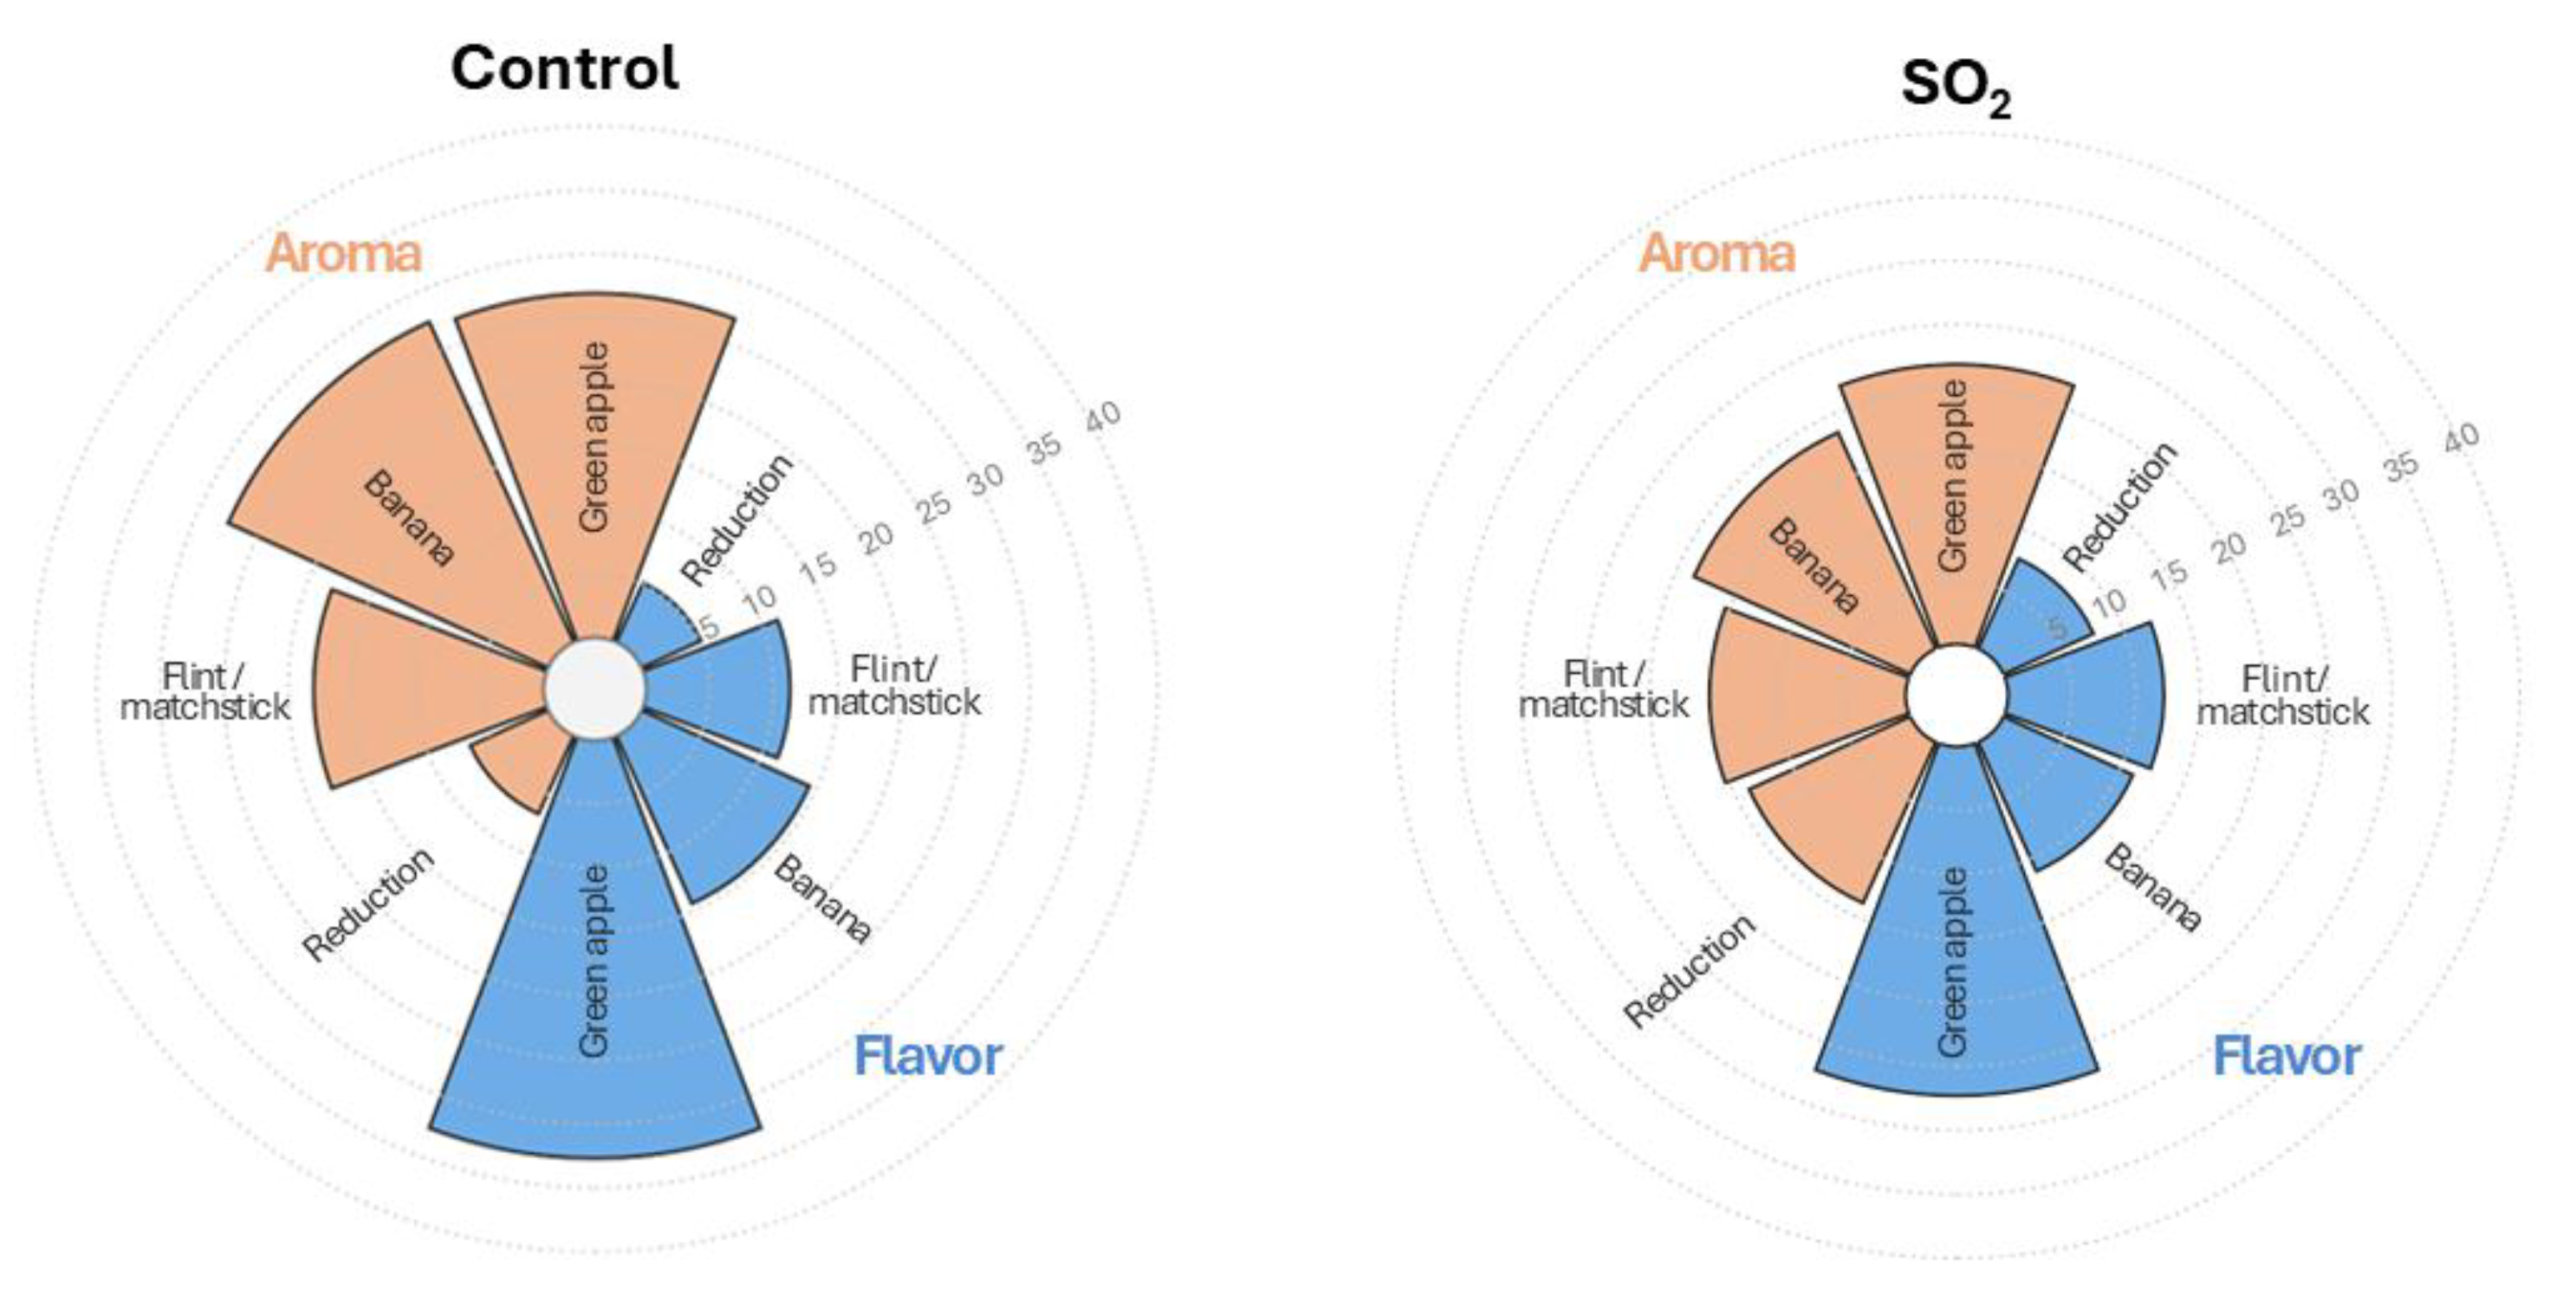
In the present study, a set of sensory descriptors were first previously selected based upon a screening of the apple ciders. Upon this, they were subsequently assessed by a sensory panel. Crucially, these sensory descriptors were assessed both orthonasally and retronasally (i.e., flavor perception). Spider plots from the sensory analysis are shown in Figure 7, and the individual tables for reduction and banana aromas are presented in Supplementary Tables S6 and S7, respectively. Sensory analysis revealed differences between CON and RED in banana aroma (p = 0.0330) and reduction aroma, although the difference in reduction aroma was not significant (p > 0.05). Banana aroma was higher in CON, whereas reduction aromas were higher in RED. These results conflict with the fact that RED contained slightly more esters than CON. However, the findings seem to indicate that ester-derived aromas were likely masked by reduction aromas in RED. In fact, based on sensory scores, CON ciders were perceived as having 48% more banana aroma and 30% more banana flavor than RED ciders, while RED ciders were perceived as having 106% more reduction aroma and 51% more reduction flavor than CON ciders. This observation is consistent with the findings of Franco-Luesma et al. (2016) [76], who demonstrated that reduction aromas, specifically H2S and methane thiol (MeSH), suppressed fruity and floral aromas in model wine systems, as it seems to be the case with the SO2-added ciders of the present study. Volatile sulfur compounds such as H2S and MeSH have been commonly associated with decreased quality in fermented beverages and are considered sensory faults [77]. Therefore, cidermakers should take precaution and consider the formation and perception of reduction aromas following SO2 additions before alcoholic fermentation, as such additions may reduce final cider perceived fruitiness.
4. Limitations
Two main limitations are identified. First, the study was based on dessert apples, which are inherently lower in phenolic content than cider apples. However, cider apples are not commonly found in California, and conversely, widely grown in Europe. Indeed, in North America, most of the production of cider makes use of dessert apples. The second limitation is the relatively low dose of SO2 employed, at 30 mg/L. While the SO2 addition used is considered still standard, a higher dose, e.g., 50 mg/L, would have produce different results, especially in the conditions of relatively low pH of the apple juice of the present experiment.
5. Conclusions
Fresh apple juice received 0 mg/L (CON) and 30 mg/L (RED) SO2 prior to alcoholic fermentation with the assumption that a supposedly extreme reductive environment inherent to apple cider fermentation will result in the formation of reduction aromas mediated by the initial SO2 addition. Fermentation kinetics, chemical composition, and sensory profiles of the resulting ciders were tracked. The addition of modest amounts of SO2 (30 mg/L) prior to alcoholic fermentation of apple cider did not affect fermentation kinetics, nitrogenous composition, volatile chemistry, total phenolic and total tannin composition, or the color of the resulting apple cider. Although RED ciders showed lower ORPs during alcoholic fermentation, these differences were negligible and not reflected in the chemistry of glutathione, suggesting that yeast performance exerted a more profound influence on ORP conditions than SO2 additions. Conversely, ciders that received SO2 additions contained slightly more malic acid and less lactic acid than CON ciders, indicating significant inhibition of malolactic bacteria in the former. Sulfur dioxide additions also promoted the preservation of flavan-3-ols: monomeric, dimeric, and sulfonated flavan-3-ols in RED ciders, likely through the inhibition of polyphenol oxidases and radical quenching. Sensory analysis revealed a trend of heightened perception of reduction aromas, and diminished banana aroma in ciders added with SO2, suggesting that volatile sulfur compounds masked fruity aromas in RED ciders. Altogether, these results suggest that moderate SO2 additions before alcoholic fermentation in cider-making inhibited MLF and preserved flavan-3-ols but slightly increased the perception of reportedly negative reduction aromas, thereby providing no clear benefits to the overall aroma or the ORP in cidermaking. Sulfur dioxide additions above 50 mg/L free SO2, which may not be infrequent during winemaking of high pH wines or ciders, may have produced more extreme results, but this remains speculative. At reasonable pH values near 3.4, cider making does not seem to benefit from modest SO2 additions.
Supplementary Materials
The following supporting information can be downloaded at the website of this paper posted on Preprints.org, Figure S1: A) Esters, and B) terpenoids of the apple cider at racking, in OAVs; Table S1: Detailed composition of the sensory standards used during the descriptive analysis training and formal evaluation sessions of apple ciders; Table S2: Basic and other chemistry of the apple juice before alcoholic fermentation and the ciders at racking; Table S3: Sulfur dioxide, acetaldehyde, and glutathione chemistry of ciders at racking; Table S4: CIELAB coordinates of ciders after racking; Table S5: Odor thresholds of volatile compounds; Table S6: gLMS results for banana aroma in apple ciders; Table S7: gLMS results for reduction aroma in apple ciders.
Author Contributions
Conceptualization, W.J.W., C.R.I. and L.F.C.; Methodology, L.F.C., W.J.W. and C.R.I.; Software, J.N.; Validation, L.F.C., W.J.W. and C.R.I.; Formal Analysis, C.R.I., S.K. and W.J.W.; Investigation, W.J.W. and C.R.I.; Resources, W.J.W., C.R.I. and L.F.C.; Data Curation, W.J.W. and C.R.I.; Writing – Original Draft Preparation, W.J.W.; Writing – Review & Editing, D.J.P. and L.F.C.; Visualization, W.J.W.; Supervision, L.F.C.; Project Administration, W.J.W. and C.R.I.; Funding Acquisition, L.F.C.
Funding
This research received no external funding.
Institutional Review Board Statement
This study was approved by the California Polytechnic State University Institutional Review Board (IRB) under IRB Protocol #2020-058.
Informed Consent Statement
Consent to participate forms were obtained from all panelists before testing.
Data Availability Statement
The original contributions presented in this study are included in the article/Supplementary Materials. Further inquiries can be directed to the corresponding author.
Acknowledgments
Eliza Rosales and Cassandra Richardson are thanked for their generous donation of apples.
Abbreviations
The following abbreviations are used in this manuscript:
| ANOVA | Analysis of variance |
| AU | Absorbance units |
| AUC | Area under the curve |
| CIS | Cooled injection system |
| DO | Dissolved oxygen |
| ESI | Electrospray ionization |
| GC | Gas chromatograph |
| gLMS | Generalized labeled magnitude scale |
| GSH | Glutathione |
| GSSG | Glutathione disulfide |
| H2S | Hydrogen sulfide |
| IRB | Institutional review board |
| MeSH | Methanethiol |
| MLF | Malolactic fermentation |
| MS | Mass spectrometer |
| NADH | Nicotinamide adenine dinucleotide |
| NADPH | Nicotinamide adenine dinucleotide phosphate |
| NIST | National Institute of Standards and Technology |
| OAV | Odor activity value |
| ORP | Oxidation-reduction potential |
| PAN | Primary amino nitrogen |
| PDMS | Polydimethylsiloxane |
| PPO | Polyphenol oxidase |
| QqQ | Triple quadrupole |
| ROS | Reactive oxygen species |
| SO2 | Sulfur dioxide |
| TA | Titratable acidity |
| TDU | Thermal desorption unit |
| YAN | Yeast assimilable nitrogen |
References
- Rackham; Jones, H.; Eichholz, W. H. S.; D. E. Natural History; Harvard University Press, 1967; Available online: https://books.google.com/books?id=cJsrAQAAMAAJ.
- International Alliance for Responsible Drinking. Beer and cider volumes 2000-2024 [Data set]. International Alliance for Responsible Drinking, November 2025. Available online: https://www.iard.org/science-resources/detail/BeerCider-GlobalData.
- Wood, G. Good harvest: the industry will likely benefit from an influx of new entrants. No. OD5335; IBISWorld Industry Report OD5335. 2021. [Google Scholar]
- Milkovich, M. Hard cider sales show regional resiliency . In Good Fruit Grower; 2023. [Google Scholar]
- https. Available online: //www.goodfruit.com/hard-cider-sales-show-regional-resiliency/.
- U.S. Department of Health and Human Services; Office of the Assistant Secretary for Health. Alcohol and cancer risk . 2025. Available online: https://www.hhs.gov/sites/default/files/oash-alcohol-cancer-risk.pdf.
- Calugar, P. C.; Coldea, T. E.; Salanță, L. C.; Pop, C. R.; Pasqualone, A.; Burja-Udrea, C.; Zhao, H.; Mudura, E. An overview of the factors influencing apple cider sensory and microbial quality from raw materials to emerging processing technologies. Processes 2021, 9(3), 502. [Google Scholar] [CrossRef]
- Ye, M.; Yue, T.; Yuan, Y. Evolution of polyphenols and organic acids during the fermentation of apple cider. J. Sci. Food Agric. 2014, 94(14), 2951–2957. [Google Scholar] [CrossRef] [PubMed]
- Ramos-Aguilar, A. L.; Victoria-Campos, C. I.; Ochoa-Reyes, E.; Ornelas-Paz, J. de J.; Zamudio-Flores, P. B.; Rios-Velasco, C.; Reyes-Hernández, J.; Pérez-Martínez, J. D.; Ibarra-Junquera, V. Physicochemical properties of apple juice during sequential steps of the industrial processing and functional properties of pectin fractions from the generated pomace. LWT 86 2017, 465–472. [Google Scholar] [CrossRef]
- Joshi, V. K.; Attri, B. L. Specific features of table wine production technology. In Science and technology of fruit wine production; Kosseva, M. R., Joshi, V. K., Panesar, P. S., Eds.; Academic Press, 2017; pp. 295–461. [Google Scholar]
- https. [CrossRef]
- Schmid, T.; Baumann, B.; Himmelsbach, M.; Klampfl, C. W.; Buchberger, W. Analysis of saccharides in beverages by HPLC with direct UV detection. Anal. Bioanal. Chem. 2016, 408(7), 1871–1878. [Google Scholar] [CrossRef] [PubMed]
- https. [CrossRef] [PubMed]
- Marks, S. C.; Mullen, W.; Crozier, A. Flavonoid and hydroxycinnamate profiles of English apple ciders. J. Agric. Food Chem. 2007, 55(21), 8723–8730. [Google Scholar] [CrossRef] [PubMed]
- Guyot, S.; Marnet, N.; Sanoner, P.; Drilleau, J. F. Variability of the polyphenolic composition of cider apple (Malus domestica) fruits and juices. J. Agric. Food Chem. 2003, 51(21), 6240–6247. [Google Scholar] [CrossRef] [PubMed]
- Coseteng, M. Y.; Lee, C. Y. Changes in apple polyphenoloxidase and polyphenol concentrations in relation to degree of browning. J. Food Sci. 1987, 52(4), 985–989. [Google Scholar] [CrossRef]
- Amiot, M. J.; Aubert, S.; Nicolas, J. Phenolic composition and browning susceptibility of various apple and pear cultivars at maturity. Acta Hortic. 343 1993, 67–69. [Google Scholar] [CrossRef]
- Mayer, A. M.; Harel, E. Review: polyphenol oxidases in plants. Phytochemistry 1979, 18(2), 193–215. [Google Scholar] [CrossRef]
- Mayer, A. M. Polyphenol oxidases in plants-recent progress. Phytochemistry 1986, 26(1), 11–20. [Google Scholar] [CrossRef]
- https. [CrossRef]
- Valero, E.; García-Carmona, F. pH-Dependent effect of sodium chloride on latent grape polyphenol oxidase. J. Agric. Food Chem. 1998, 46(7), 2447–2451. [Google Scholar] [CrossRef]
- de Oliveira Carvalho, J.; Orlanda, J. F. F. Heat stability and effect of pH on enzyme activity of polyphenol oxidase in buriti (Mauritia flexuosa Linnaeus f.) fruit extract. Food Chem. 233 2017, 159–163. [Google Scholar] [CrossRef] [PubMed]
- Elias, R. J.; Waterhouse, A. L. Controlling the Fenton reaction in wine. J. Agric. Food Chem. 2010, 58(3), 1699–1707. [Google Scholar] [CrossRef] [PubMed]
- Gligorovski, S.; Strekowski, R.; Barbati, S.; Vione, D. Environmental implications of hydroxyl radicals (•OH). Chem. Rev. 2015, 115(24), 13051–13092. [Google Scholar] [CrossRef] [PubMed]
- Boulton, R. B.; Singleton, V. L.; Bisson, L. F.; Kunkee, R. E. The role of sulfur dioxide in wine. In Principles and practices of winemaking; 1996; pp. 448–473. [Google Scholar] [CrossRef]
- Herrero, M.; García, L. A.; Díaz, M. The effect of SO2 on the production of ethanol, acetaldehyde, organic acids, and flavor volatiles during industrial cider fermentation. J. Agric. Food Chem. 2003, 51(11), 3455–3459. [Google Scholar] [CrossRef] [PubMed]
- Carnacini, A. B.; Capella, P.; Amati, A.; Pallotta, U. Volatile components of Albana wine. III. carbonyl compounds. Am. J. Enol. Vitic. 1980, 31(3), 219–226. [Google Scholar] [CrossRef]
- Danilewicz, J. C.; Tunbridge, P.; Kilmartin, P. A. Wine reduction potentials: are these measured values really reduction potentials? J. Agric. Food Chem. 2019, 67(15), 4145–4153. [Google Scholar] [CrossRef] [PubMed]
- Nelson, J.; Boulton, R.; Knoesen, A. Redox potential and its control in research and commercial wine fermentations. Fermentation 2025, 11(1), 9. [Google Scholar] [CrossRef]
- Coleman, R. E.; Boulton, R. B.; Stuchebrukhov, A. A. Kinetics of autoxidation of tartaric acid in presence of iron. J. Chem. Phys. 2020, 153(6). [Google Scholar] [CrossRef] [PubMed]
- Kreitman, G. Y.; Laurie, V. F.; Elias, R. J. Investigation of ethyl radical quenching by phenolics and thiols in model wine. J. Agric. Food Chem. 2013, 61(3), 685–692. [Google Scholar] [CrossRef] [PubMed]
- Newair, E. F.; Al-Anazi, A.; Garcia, F. Oxidation of wine polyphenols by electrochemical means in the presence of glutathione. Antioxidants 2023, 12(10), 1891. [Google Scholar] [CrossRef] [PubMed]
- Giustarini, D.; Tsikas, D.; Colombo, G.; Milzani, A.; Dalle-Donne, I.; Fanti, P.; Rossi, R. Pitfalls in the analysis of the physiological antioxidant glutathione (GSH) and its disulfide (GSSG) in biological samples: an elephant in the room. J. Chromatogr. B 1019 2016, 21–28. [Google Scholar] [CrossRef] [PubMed]
- Berovic, M. The role and application of redox potential in wine technology. Fermentation 2024, 10(6), 312. [Google Scholar] [CrossRef]
- Parnigoni, D. J.; Kuster, S. T.; Villalobos, J.; Nelson, J.; Coleman, R. E.; Casassa, L. F. Effect of contrasting redox potential evolutions and cap management techniques on the chemical composition of red wine. Molecules 2025, 30(15), 3172. [Google Scholar] [CrossRef] [PubMed]
- Nelson, J.; Coleman, R.; Chacón-Rodríguez, L.; Runnebaum, R.; Boulton, R.; Knoesen, A. Advanced monitoring and control of redox potential in wine fermentation across scales. Fermentation 2022, 9(1), 7. [Google Scholar] [CrossRef]
- Harbertson, J. F.; Picciotto, E. A.; Adams, D. O. Measurement of polymeric pigments in grape berry extracts and wines using a protein precipitation assay combined with bisulfite bleaching. Am. J. Enol. Vitic. 2003, 54(4), 301–306. [Google Scholar] [CrossRef]
- Dienes-Nagy, Á.; Vuichard, F.; Belcher, S.; Blackford, M.; Rösti, J.; Lorenzini, F. Simultaneous quantification of glutathione, glutathione disulfide and glutathione-S-sulfonate in grape and wine using LC-MS/MS. Food Chem. 386 2022, 132756. [Google Scholar] [CrossRef] [PubMed]
- Cebrián-Tarancón, C.; Sánchez-Gómez, R.; Cabrita, M. J.; García, R.; Zalacain, A.; Alonso, G. L.; Salinas, M. R. Winemaking with vine-shoots. Modulating the composition of wines by using their own resources. Food Res. Int. 121 2019, 117–126. [Google Scholar] [CrossRef] [PubMed]
- Marín-San Román, S.; Carot-Sierra, J. M.; Sáenz de Urturi, I.; Rubio-Bretón, P.; Pérez-Álvarez, E. P.; Garde-Cerdán, T. Optimization of stir bar sorptive extraction (SBSE) and multi-stir bar sorptive extraction (mSBSE) to improve must volatile compounds extraction. LWT 172 2022, 114182. [Google Scholar] [CrossRef]
- Calvert, M. D.; Neill, C. L.; Stewart, A. C.; Lahne, J. Sensory descriptive analysis of hard ciders from the Northeast and Mid-Atlantic United States. J. Food Sci. 2023, 88(4), 1700–1717. [Google Scholar] [CrossRef] [PubMed]
- Holm Hansen, E.; Nissen, P.; Sommer, P.; Nielsen, J. C.; Arneborg, N. The effect of oxygen on the survival of non-Saccharomyces yeasts during mixed culture fermentations of grape juice with Saccharomyces cerevisiae. J. Appl. Microbiol. 2001, 91(3), 541–547. [Google Scholar] [CrossRef] [PubMed]
- Parnigoni, D.; Kuster, S.; Villalobos, J.; Nelson, J.; Coleman, R.; Casassa, F. Controlling the redox potential in red wines through cap management and mixing techniques. Food Chem. 2025, 146890. [Google Scholar] [CrossRef]
- Wright, W. J.; Kuster, S.; Petrova, B.; Villalobos, J.; Nelson, J.; Coleman, R.; Casassa, L. F. Chemical and sensory effects of macro-oxygenation and air sparging coupled with oxidation-reduction potential (ORP) monitoring in Syrah wines. Food Chem. X 31 2025, 103135. [Google Scholar] [CrossRef] [PubMed]
- Killeen, D. J.; Boulton, R.; Knoesen, A. Advanced monitoring and control of redox potential in wine fermentation. Am. J. Enol. Vitic. 2018, 69(4), 394–399. [Google Scholar] [CrossRef]
- Young, S.; Merrell, C.; Arvik, T.; Boulton, R. Redox control of a Chardonnay fermentation to limit the conversion of elemental Sulfur to hydrogen sulfide. Am. J. Enol. Vitic. 2025, 76(2), 0760021. [Google Scholar] [CrossRef]
- Escalante-Minakata, P.; Ibarra-Junquera, V.; Rosu, H. C.; De León-Rodríguez, A.; González-García, R. Online monitoring of Mezcal fermentation based on redox potential measurements. Bioprocess Biosyst. Eng. 2008, 32(1), 47–52. [Google Scholar] [CrossRef] [PubMed]
- https. [CrossRef] [PubMed]
- Park, S. K.; Boulton, R. B.; Noble, A. C. Formation of hydrogen sulfide and glutathione during fermentation of white grape musts. Am. J. Enol. Vitic. 2000, 51(2), 91–97. [Google Scholar] [CrossRef]
- Marinelli, K. A. The effects of oxygenation on redox potential and fermentation kinetics. Master’s thesis, University of California, Davis, 2022. Available online: https://escholarship.org/uc/item/52n7g3ws.
- Ma, B.; Yuan, Y.; Gao, M.; Li, C.; Ogutu, C.; Li, M.; Ma, F. Determination of predominant organic acid components in Malus species: correlation with apple domestication. Metabolites 2018, 8(4), 74. [Google Scholar] [CrossRef] [PubMed]
- Ochando, T.; Mouret, J.-R.; Humbert-Goffard, A.; Aguera, E.; Sablayrolles, J.-M.; Farines, V. Comprehensive study of the dynamic interaction between SO2 and acetaldehyde during alcoholic fermentation. Food Res. Int. 136 2020, 109607. [Google Scholar] [CrossRef] [PubMed]
- Donalies, U. E. B.; Stahl, U. Increasing sulphite formation in Saccharomyces cerevisiae by overexpression of MET14 and SSU1. Yeast 2002, 19(6), 475–484. [Google Scholar] [CrossRef] [PubMed]
- Cheynier, V.; Souquet, J. M.; Moutounet, M. Glutathione content and glutathione to hydroxycinnamic acid ratio in Vitis vinifera grapes and musts. Am. J. Enol. Vitic. 1989, 40(4), 320–324. [Google Scholar] [CrossRef]
- Sanoner, P.; Guyot, S.; Marnet, N.; Molle, D.; Drilleau, J. F. Polyphenol profiles of French cider apple varieties. J. Agric. Food Chem. 1999, 47(12), 4847–4853. [Google Scholar] [CrossRef] [PubMed]
- Sayavedra-Soto, L. A.; Montgomery, M. W. Inhibition of polyphenoloxidase by sulfite. J. Food Sci. 1986, 51(6), 1531–1536. [Google Scholar] [CrossRef]
- Oliveira, C. M.; Ferreira, A. C. S.; De Freitas, V.; Silva, A. M. S. Oxidation mechanisms occurring in wines. Food Res. Int. 2011, 44(5), 1115–1126. [Google Scholar] [CrossRef]
- Karbowiak, T.; Gougeon, R. D.; Alinc, J.-B.; Brachais, L.; Debeaufort, F.; Voilley, A.; Chassagne, D. Wine oxidation and the role of cork. Crit. Rev. Food Sci. Nutr. 2009, 50(1), 20–52. [Google Scholar] [CrossRef]
- Danilewicz, J. C. Review of oxidative processes in wine and value of reduction potentials in enology. Am. J. Enol. Vitic. 2012, 63(1), 1–10. [Google Scholar] [CrossRef]
- Wright, W. J.; Parnigoni, D. J.; Kuster, S.; Nelson, J.; Coleman, R. E.; Casassa, L. F. Caffeic acid, reduced glutathione, and ferric iron addition effects on the redox potential of model wine solutions. Molecules 2026, 31(7), 1226. [Google Scholar] [CrossRef] [PubMed]
- Waterhouse, A. L.; Laurie, V. F. Oxidation of wine phenolics: a critical evaluation and hypotheses. Am. J. Enol. Vitic. 2006, 57(3), 306–313. [Google Scholar] [CrossRef]
- Waterhouse, A. L.; Sacks, G. L.; Jeffery, D. W. Esters. In Understanding wine chemistry (Chapter 7); John Wiley & Sons, 2016. [Google Scholar] [CrossRef]
- Cordente, A. G.; Solomon, M.; Schulkin, A.; Leigh Francis, I.; Barker, A.; Borneman, A. R.; Curtin, C. D. Novel wine yeast with ARO4 and TYR1 mutations that overproduce ‘floral’ aroma compounds 2-phenylethanol and 2-phenylethyl acetate. Appl. Microbiol. Biotechnol. 2018, 102(14), 5977–5988. [Google Scholar] [CrossRef] [PubMed]
- Elsharif, S. A.; Buettner, A. Structure-odor relationship study on geraniol, nerol, and their synthesized oxygenated derivatives. J. Agric. Food Chem. 2016, 66(10), 2324–2333. [Google Scholar] [CrossRef] [PubMed]
- Ferreira, V.; Lopez, R.; Cacho, J. F. Quantitative determination of the odorants of young red wines from different grape varieties. J. Sci. Food Agric. 2000, 80(11), 1659–1667. [Google Scholar] [CrossRef]
- https.
- Guth, H. Quantitation and sensory studies of character impact odorants of different white wine varieties. J. Agric. Food Chem. 1997, 45(8), 3027–3032. [Google Scholar] [CrossRef]
- Niu, M.; Huang, J.; Jin, Y.; Wu, C.; Zhou, R. Volatiles and antioxidant activity of fermented Goji (Lycium Chinese) wine: effect of different oak matrix (barrel, shavings and chips). Int. J. Food Prop. 2017, 1–13. [Google Scholar] [CrossRef]
- Padrayuttawat, A.; Yoshizawa, T.; Tamura, H.; Tokunaga, T. Optical isomers and odor thresholds of volatile constituents in Citrus sudachi. Food Sci. Technol. Int. Tokyo 1997, 3(4), 402–408. [Google Scholar] [CrossRef]
- Poitou, X.; Redon, P.; Pons, A.; Bruez, E.; Delière, L.; Marchal, A.; Cholet, C.; Geny-Denis, L.; Darriet, P. Methyl salicylate, a grape and wine chemical marker and sensory contributor in wines elaborated from grapes affected or not by cryptogamic diseases. Food Chem. 360 2021, 130120. [Google Scholar] [CrossRef] [PubMed]
- Rodríguez-Bencomo, J.; Pozo-Bayón, M.; Moreno-Arribas, M. Wine fermentation and production. In Handbook of plant-based fermented food and beverage technology; 2012; Volume Second Edition, pp. 179–200. [Google Scholar] [CrossRef]
- Takeoka, G.; Buttery, R. G.; Ling, L. Odour thresholds of various branched and straight chain acetates. LWT 1996, 29(7), 677–680. [Google Scholar] [CrossRef]
- Kliks, J.; Kawa-Rygielska, J.; Gasiński, A.; Głowacki, A.; Szumny, A. Analysis of volatile compounds and sugar content in three Polish regional ciders with pear addition. Molecules 2020, 25(16), 3564. [Google Scholar] [CrossRef] [PubMed]
- Ye, M.; Yue, T.; Yuan, Y. Changes in the profile of volatile compounds and amino acids during cider fermentation using dessert variety of apples. Eur. Food Res. Technol. 2014, 239(1), 67–77. [Google Scholar] [CrossRef]
- Ferremi Leali, N.; Salvetti, E.; Luzzini, G.; Salini, A.; Slaghenaufi, D.; Fusco, S.; Ugliano, M.; Torriani, S.; Binati, R. L. Differences in the volatile profile of apple cider fermented with Schizosaccharomyces pombe and Schizosaccharomyces japonicus. Fermentation 2024, 10(3), 128. [Google Scholar] [CrossRef]
- Englezos, V.; Torchio, F.; Cravero, F.; Marengo, F.; Giacosa, S.; Gerbi, V.; Rantsiou, K.; Rolle, L.; Cocolin, L. Aroma profile and composition of Barbera wines obtained by mixed fermentations of Starmerella bacillaris (synonym Candida zemplinina) and Saccharomyces cerevisiae. LWT 73 2016, 567–575. [Google Scholar] [CrossRef]
- Bohlmann, J.; Keeling, C. I. Terpenoid biomaterials. Plant J. 2008, 54(4), 656–669. [Google Scholar] [CrossRef] [PubMed]
- https. [CrossRef] [PubMed]
- Wilson, B.; Strauss, C. R.; Williams, P. J. The distribution of free and glycosidically-bound monoterpenes among skin, juice, and pulp fractions of some white grape varieties. Am. J. Enol. Vitic. 1986, 37(2), 107–111. [Google Scholar] [CrossRef]
- Marcon, Â. R.; Schwarz, L. V.; Dutra, S. V.; Delamare, A. P. L.; Gottardi, F.; Parpinello, G. P.; Echeverrigaray, S. Chemical composition and sensory evaluation of wines produced with different Moscato varieties. BIO Web Conf. 12 2019, 2033. [Google Scholar] [CrossRef]
- Garde-Cerdán, T.; Rubio-Bretón, P.; Marín-San Román, S.; Sáenz de Urturi, I.; Pérez-Álvarez, E. P. Pre-fermentative maceration with SO2 enhanced the must aromatic composition. Food Chem. 345 2021, 128870. [Google Scholar] [CrossRef]
- https. [CrossRef] [PubMed]
- Garde-Cerdán, T.; Ancín-Azpilicueta, C. Effect of SO2 on the formation and evolution of volatile compounds in wines. Food Control 2007, 18(12), 1501–1506. [Google Scholar] [CrossRef]
- Franco-Luesma, E.; Sáenz-Navajas, M.-P.; Valentin, D.; Ballester, J.; Rodrigues, H.; Ferreira, V. Study of the effect of H2S, MeSH and DMS on the sensory profile of wine model solutions by Rate-All-That-Apply (RATA). Food Res. Int. 87 2016, 152–160. [Google Scholar] [CrossRef] [PubMed]
- Mierczynska-Vasilev, A. M.; Kulcsar, A. C.; Dabare, P. R. L.; Vasilev, K. A.; Bekker, M. Z. Surface nanoengineering technology for the removal of sulfur compounds associated with negative attributes in wines. npj Sci. Food 2023, 7(1). [Google Scholar] [CrossRef] [PubMed]
Figure 1.
Experimental design during alcoholic fermentation of ciders.
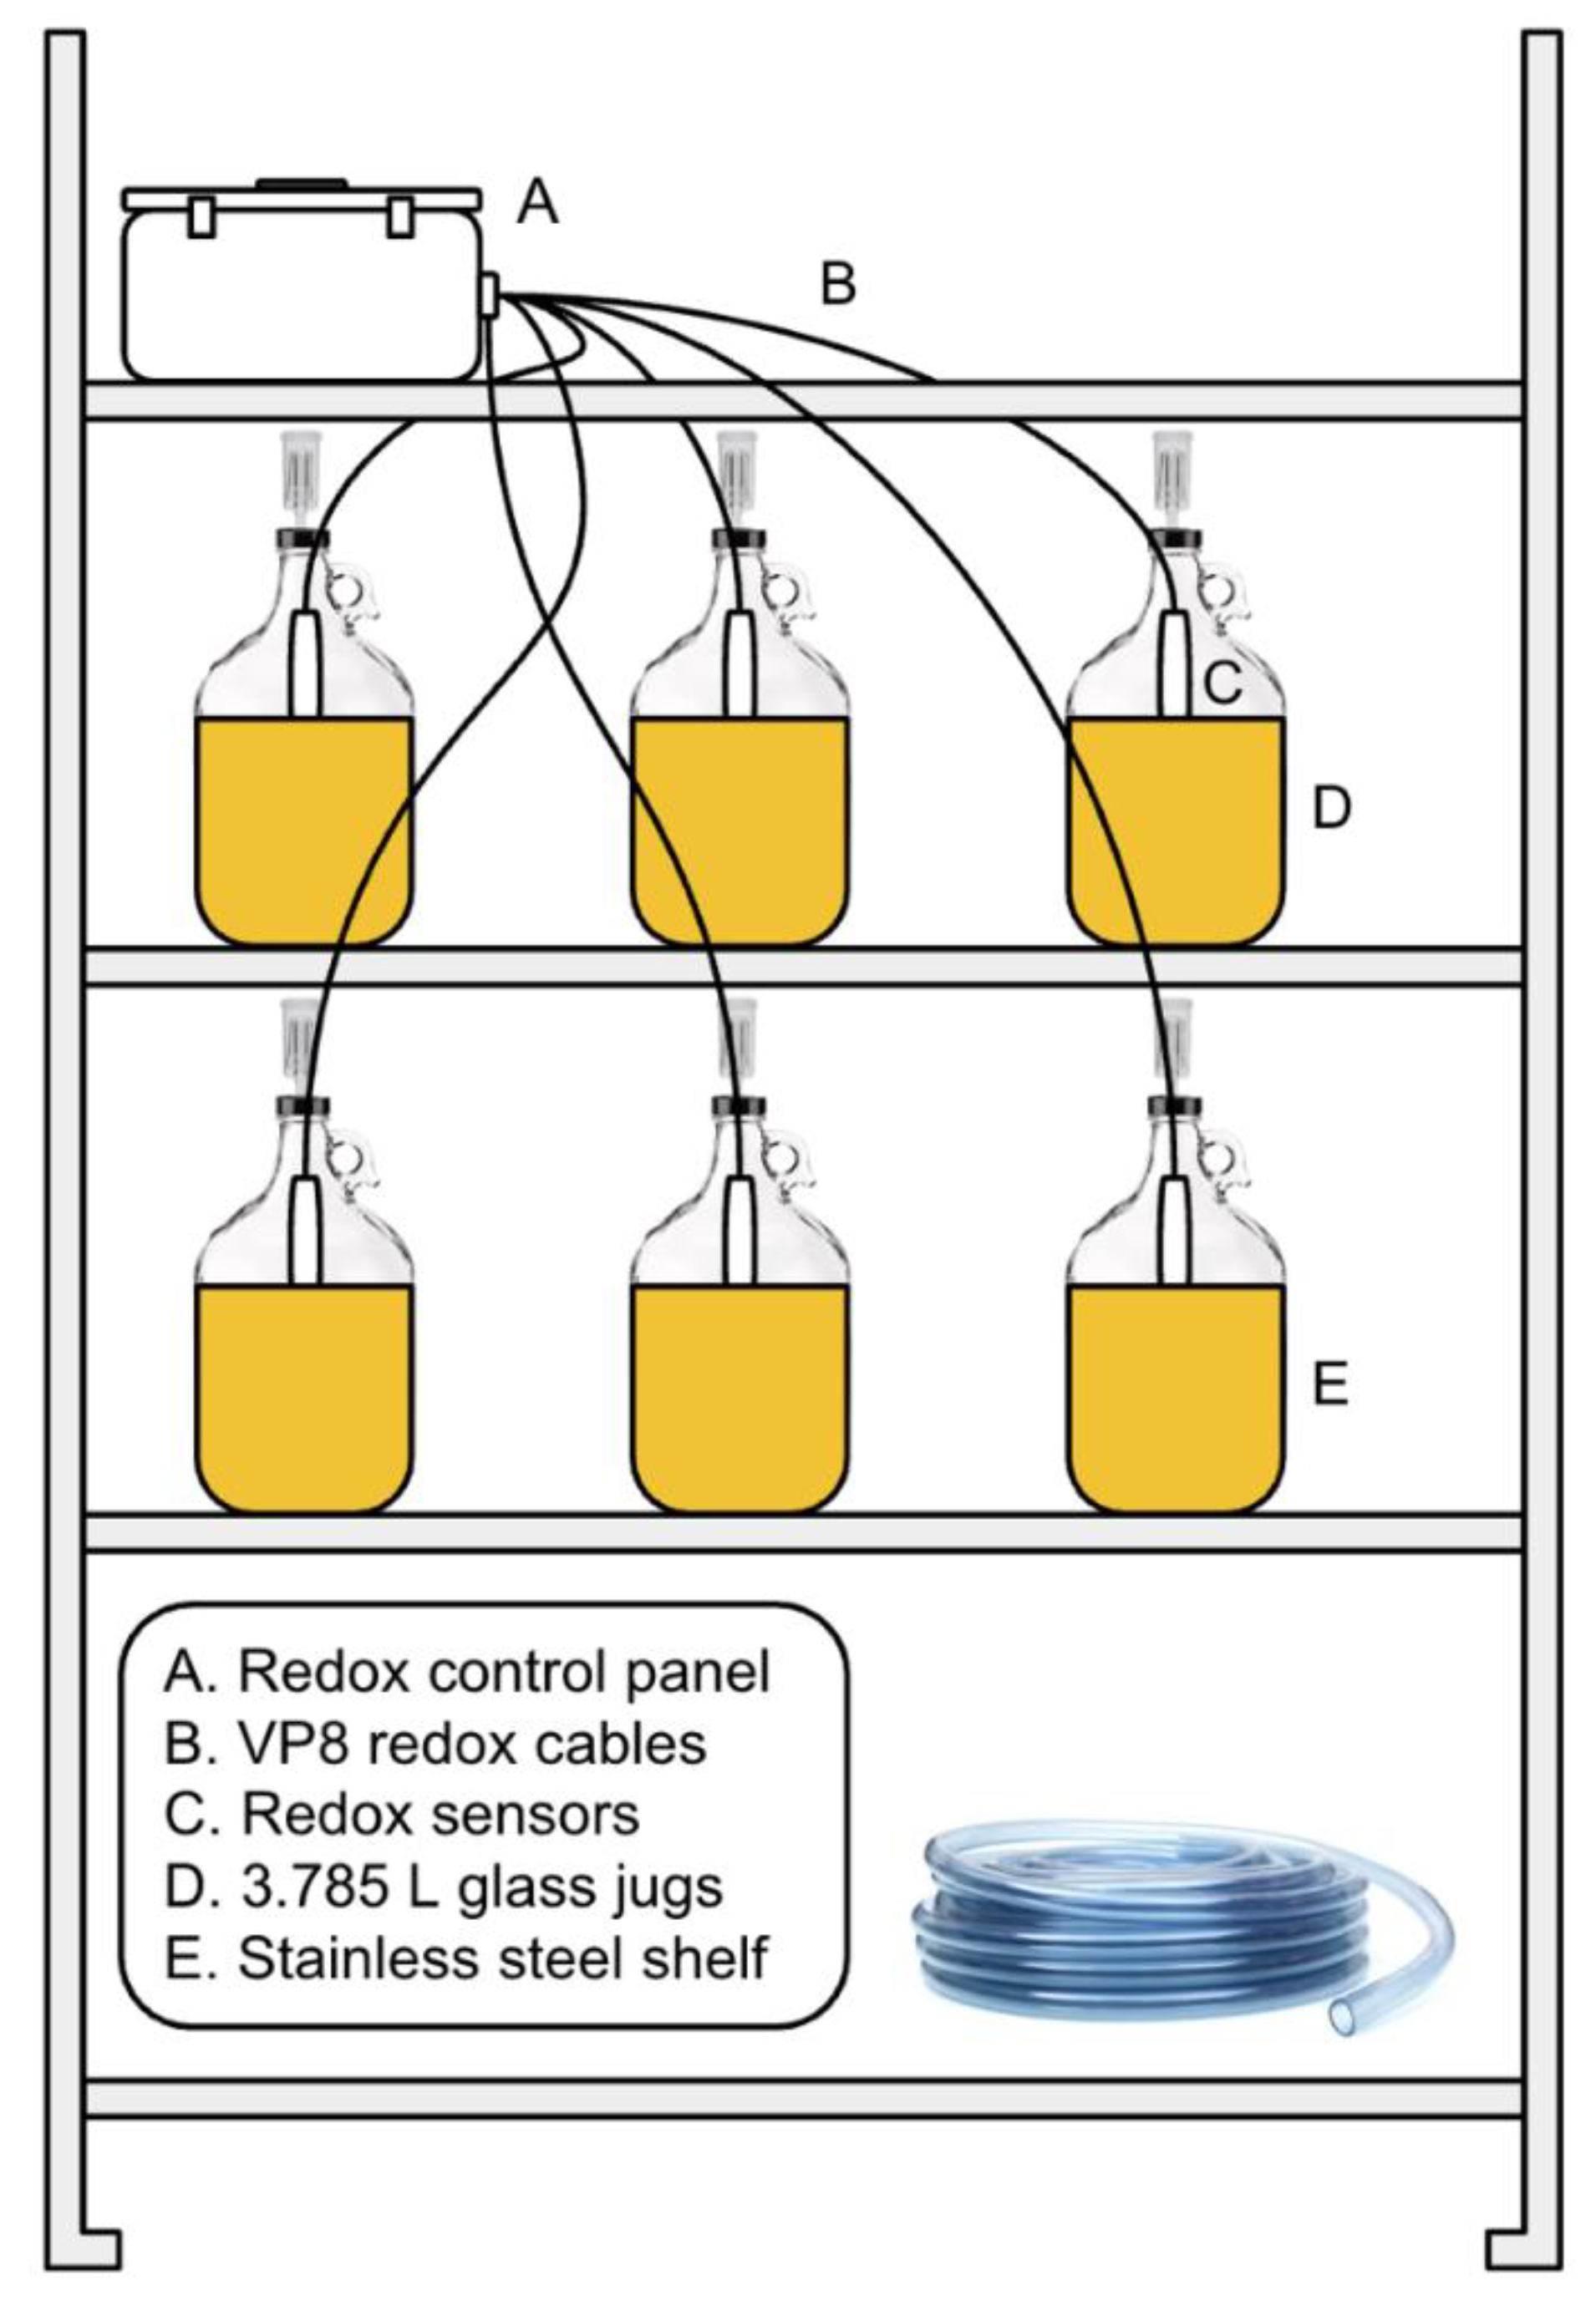
Figure 2.
Evolution of sugar consumption (measured in ºBrix) and temperature (°C) per day of alcoholic fermentation of apple cider from milling to racking. Data points represent the mean of three replicates (n = 3), and error bars represent the standard error of the mean.
Figure 2.
Evolution of sugar consumption (measured in ºBrix) and temperature (°C) per day of alcoholic fermentation of apple cider from milling to racking. Data points represent the mean of three replicates (n = 3), and error bars represent the standard error of the mean.
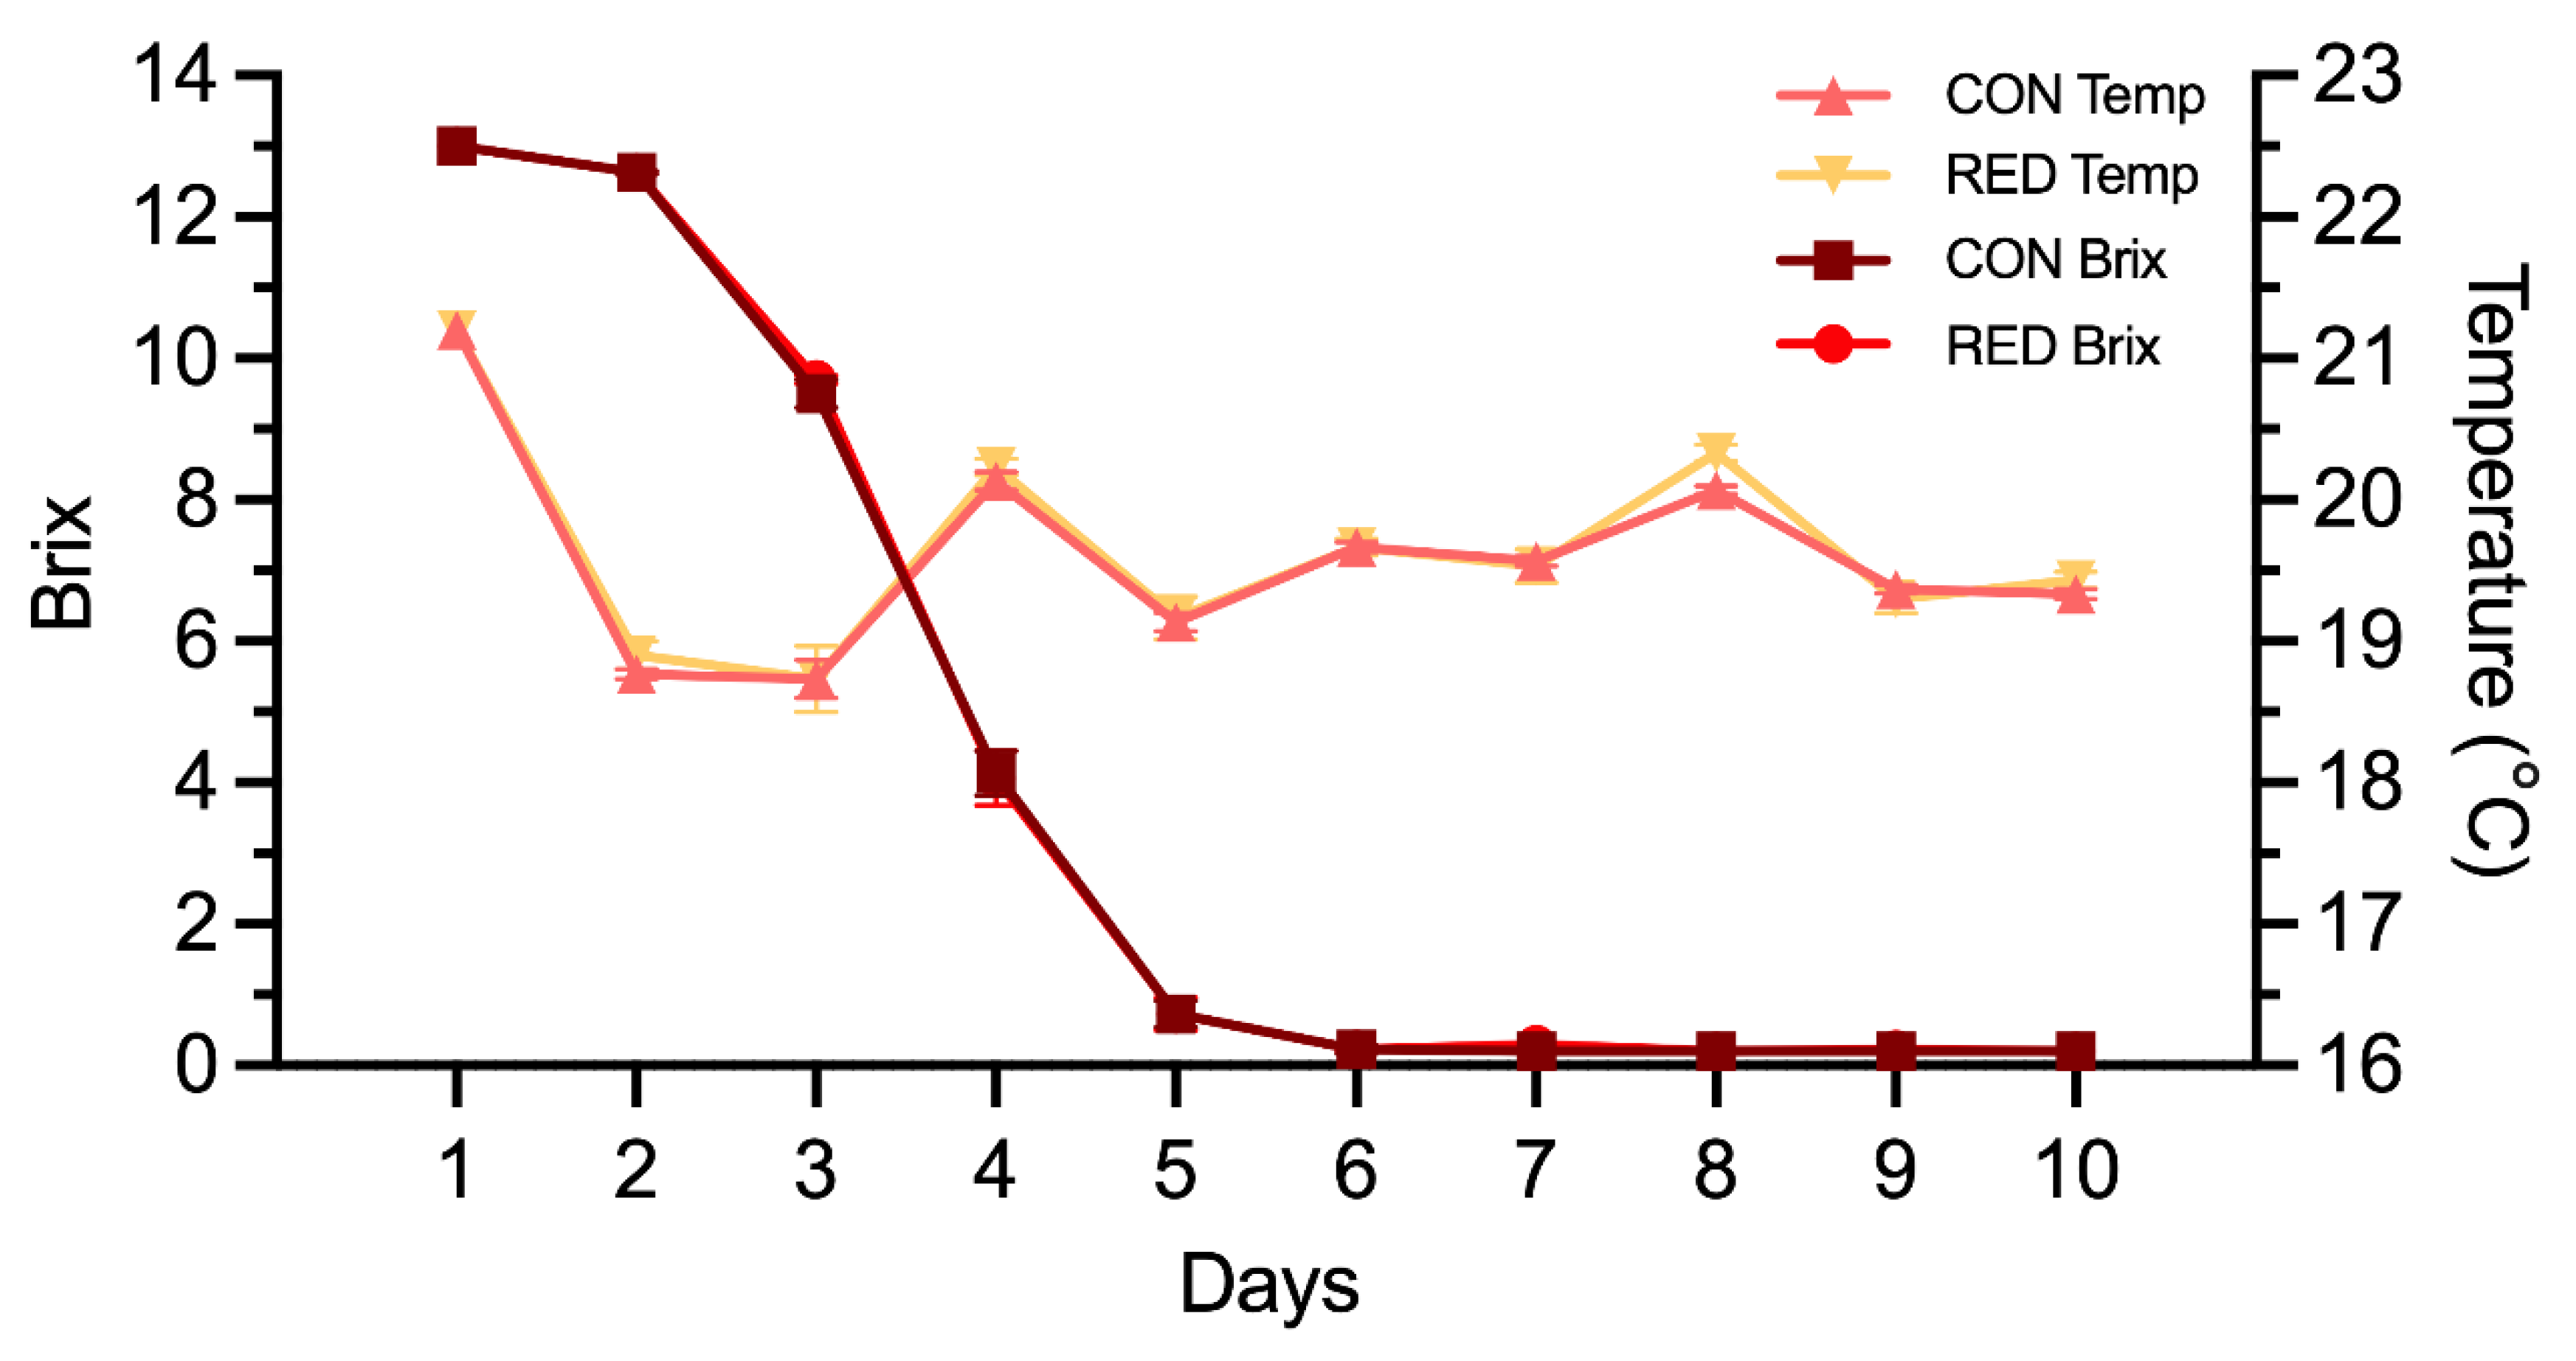
Figure 3.
The oxidation-reduction potential of CON and RED during alcoholic fermentation. Each line represents the average of three replicates (n = 3). Dark red and yellow lines denote the one-day moving averages, and the vertical light red and yellow lines denote the standard error of the mean.
Figure 3.
The oxidation-reduction potential of CON and RED during alcoholic fermentation. Each line represents the average of three replicates (n = 3). Dark red and yellow lines denote the one-day moving averages, and the vertical light red and yellow lines denote the standard error of the mean.
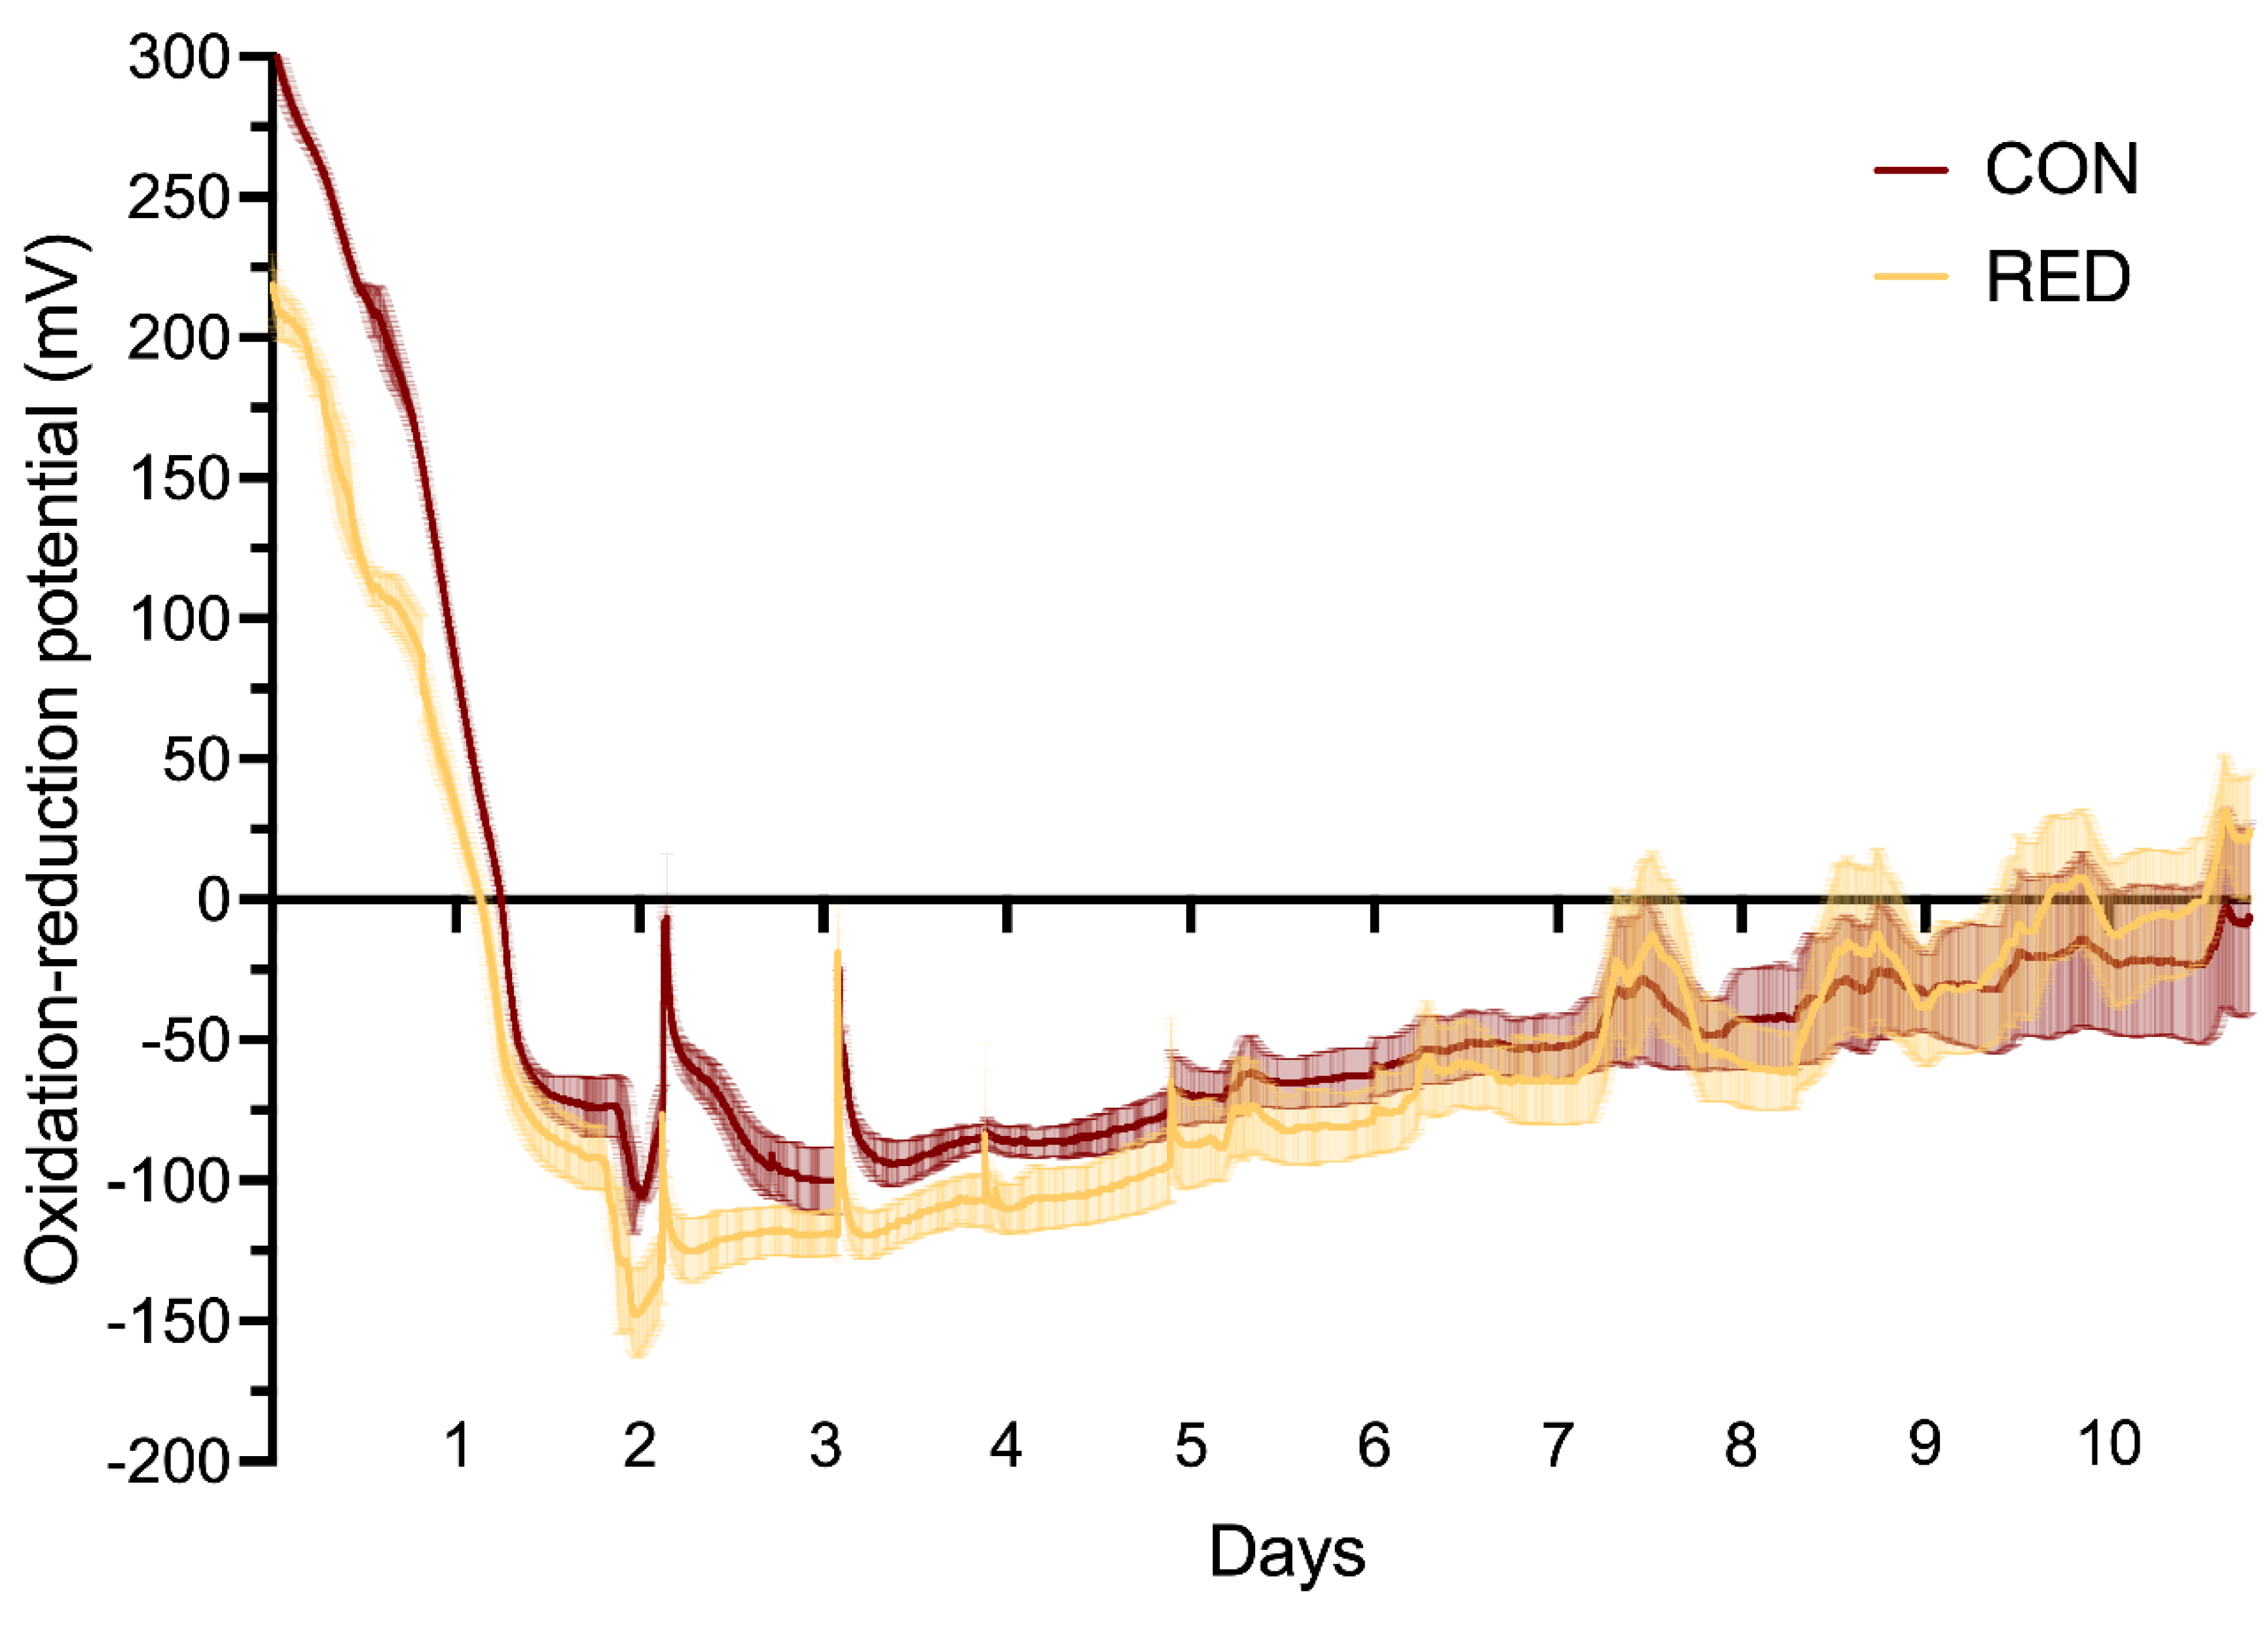
Figure 4.
Phenolic and color composition of apple cider at racking. A), B), and C) represent tannins, total phenolics in mg/L, and total color at 420 nm in absorbance units, respectively.
Figure 4.
Phenolic and color composition of apple cider at racking. A), B), and C) represent tannins, total phenolics in mg/L, and total color at 420 nm in absorbance units, respectively.
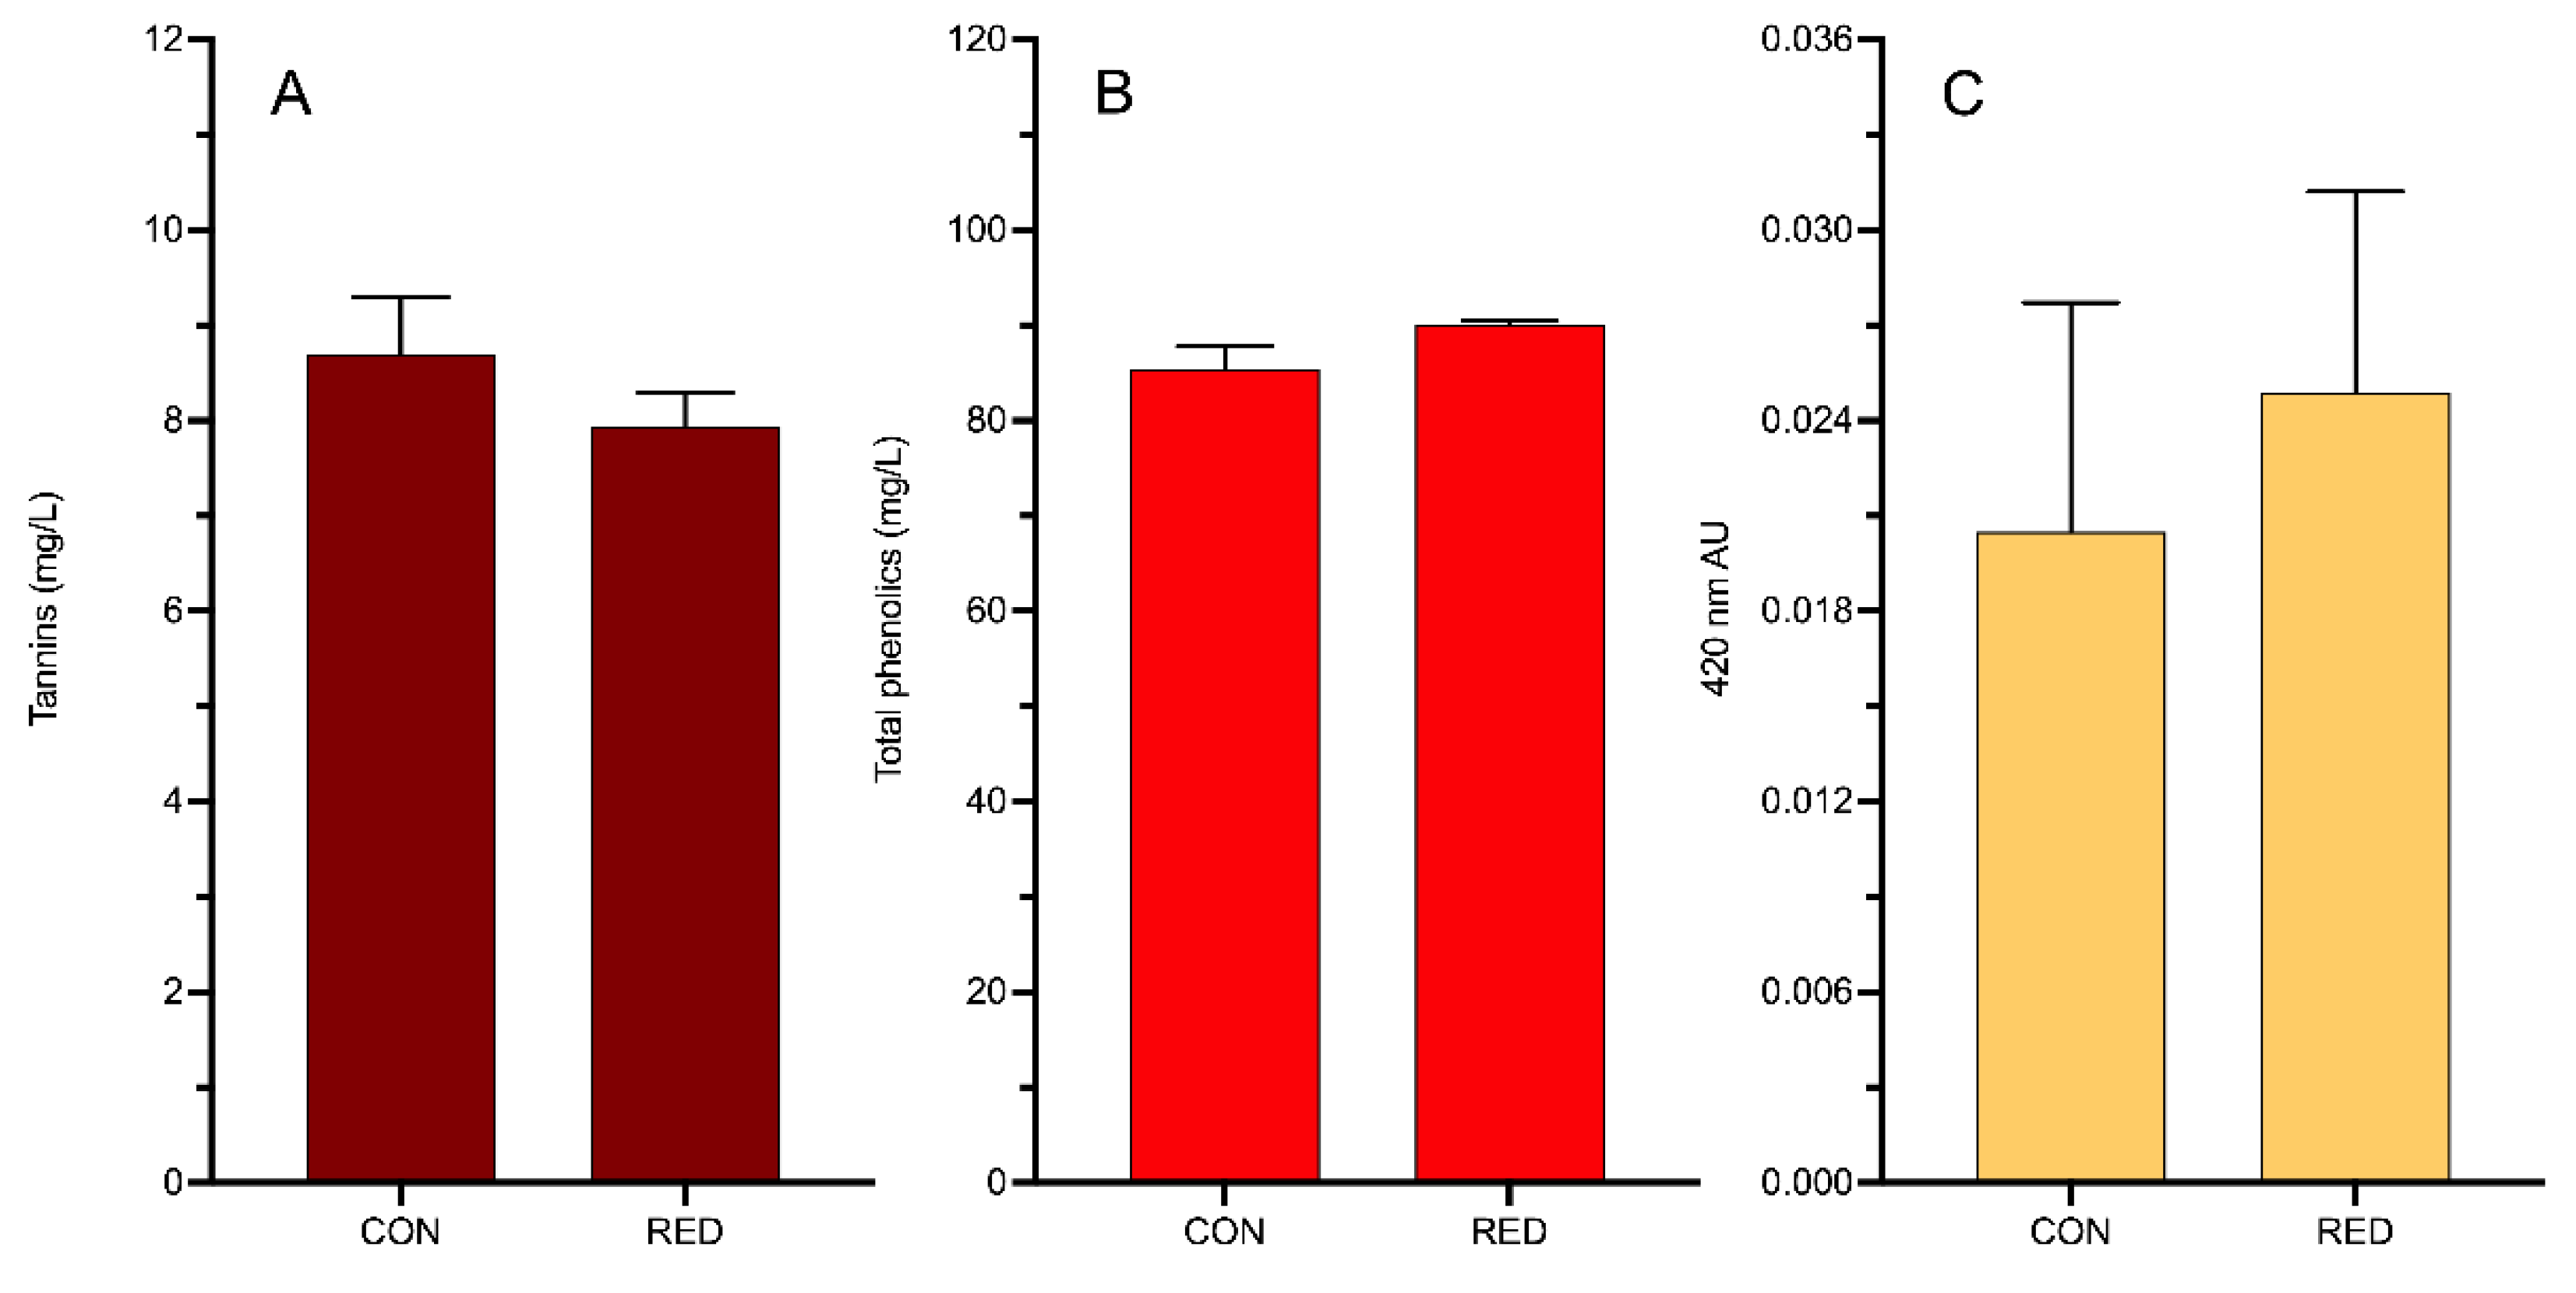
Figure 5.
Flavan-3-ol composition of the apple cider at racking, in mg/L.
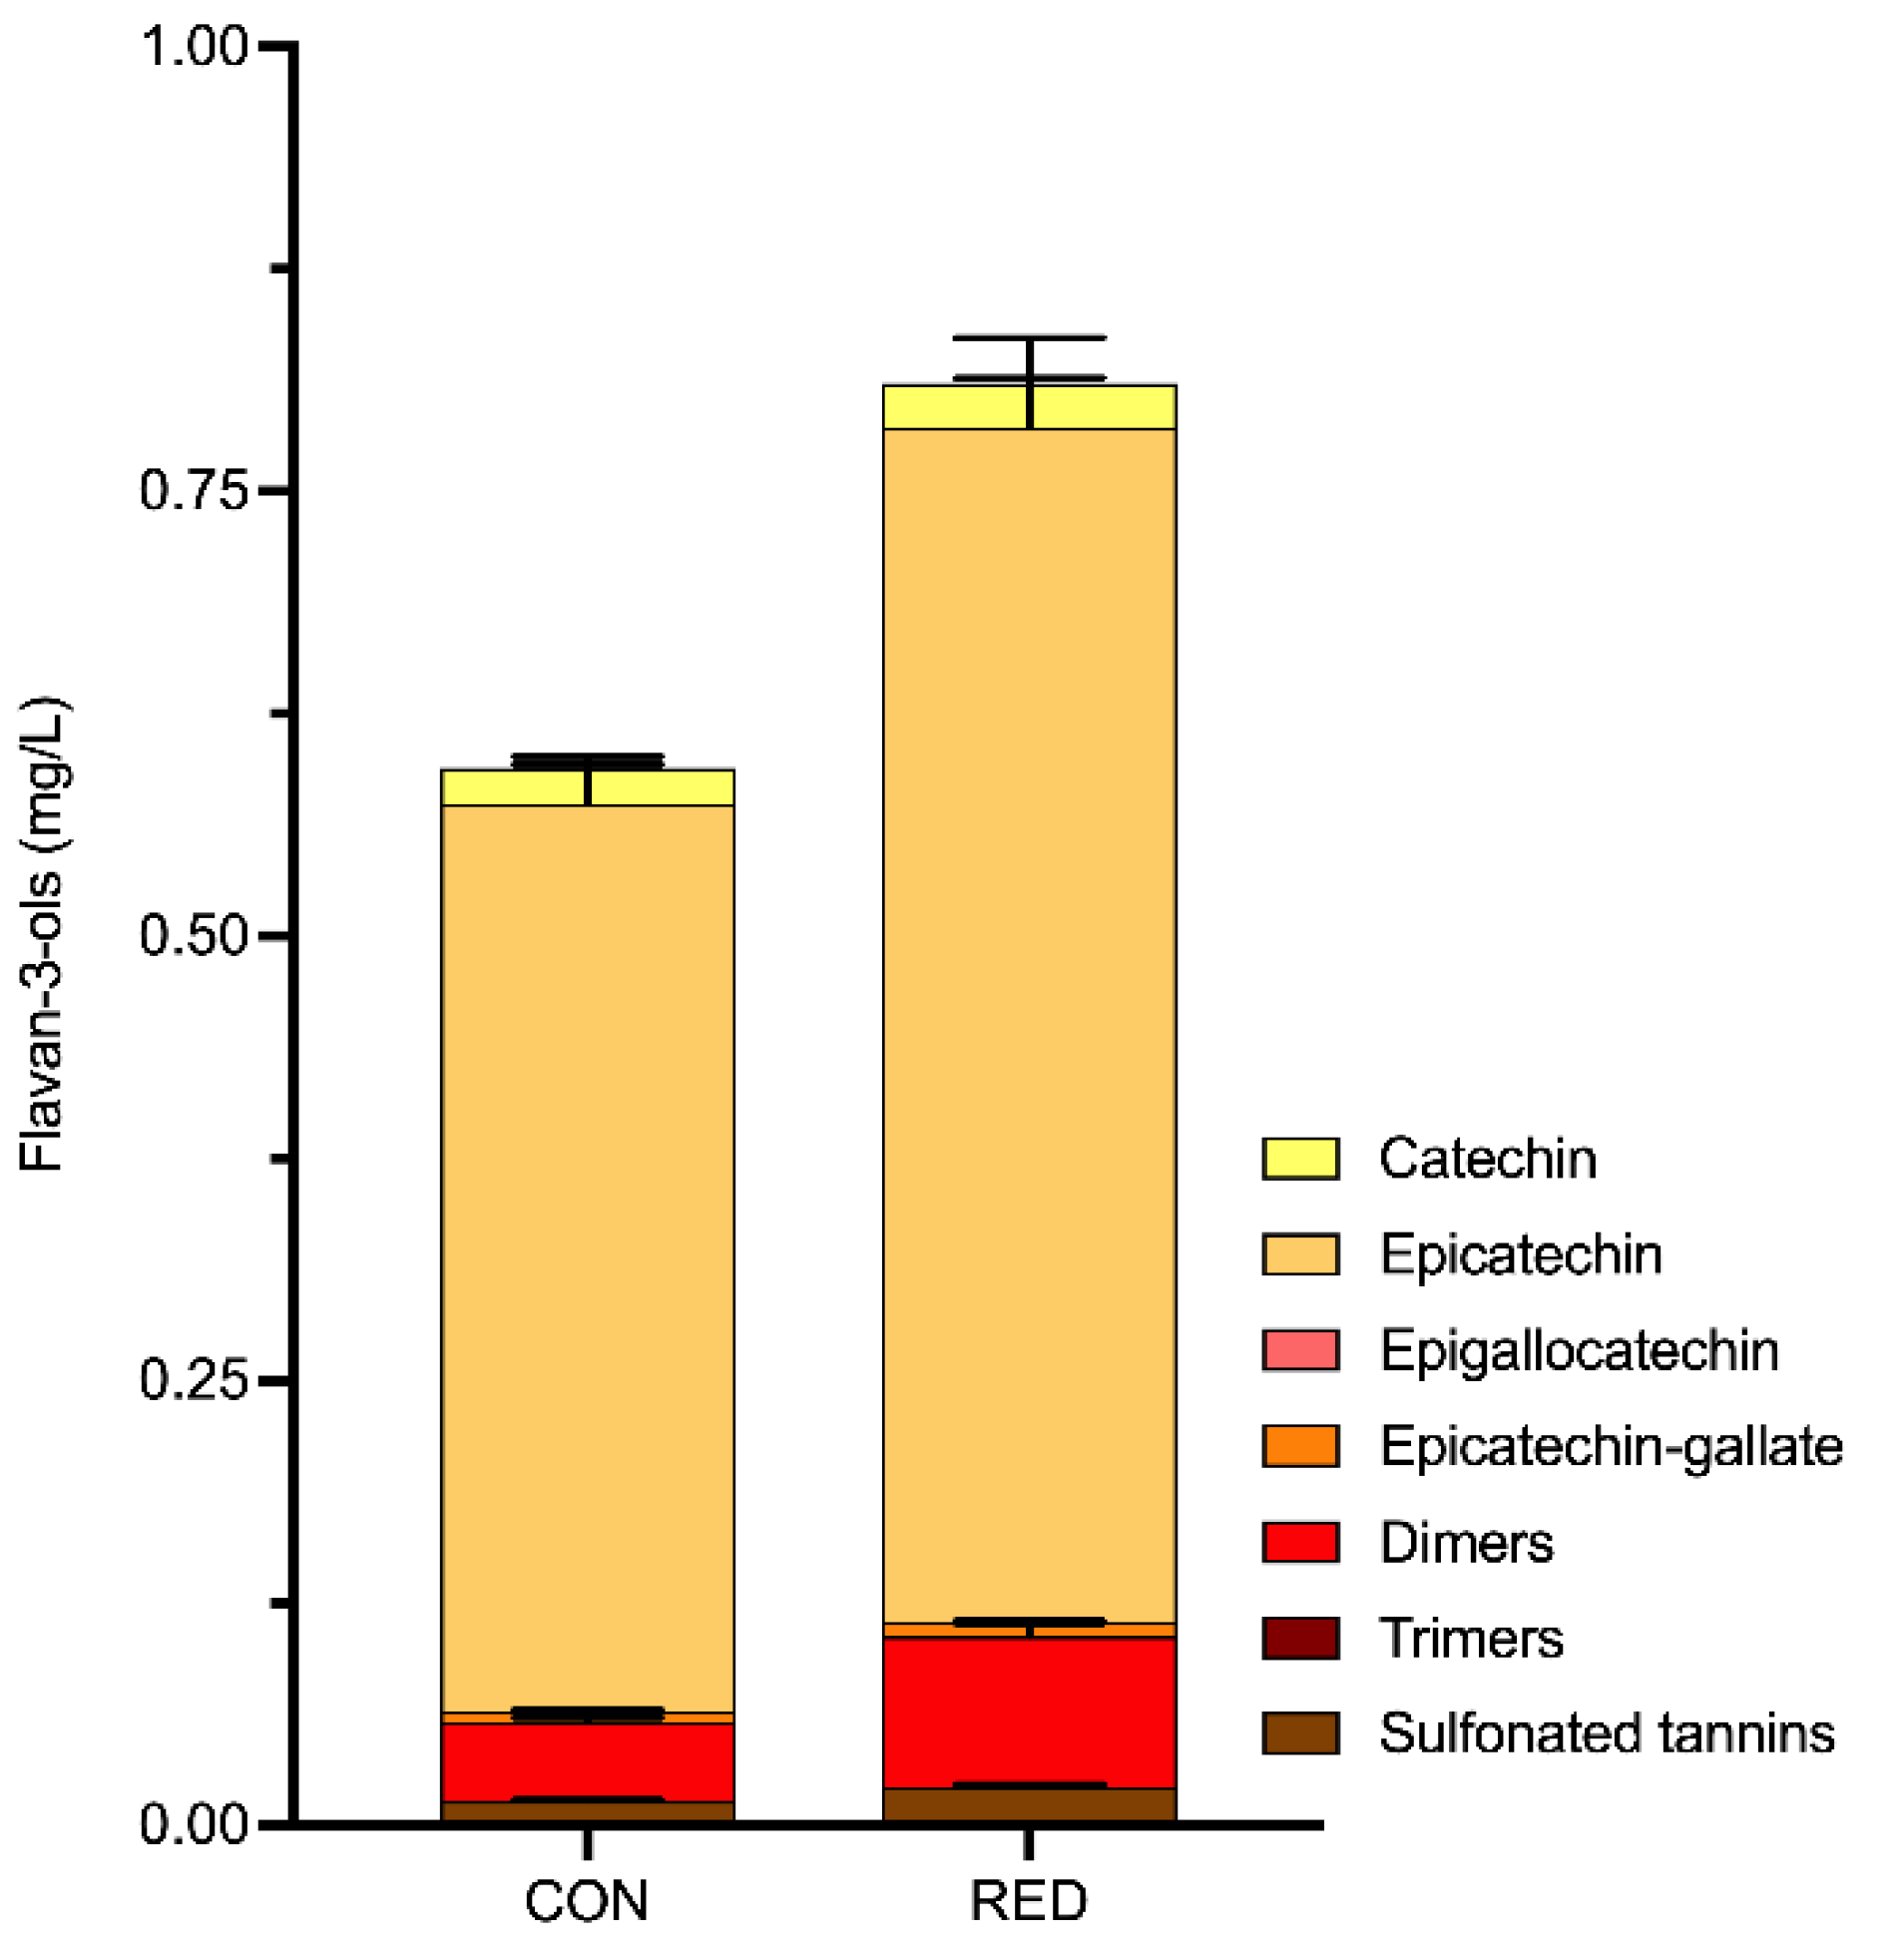
Figure 6.
A) Esters, and B) terpenoids of the apple cider at racking, expressed in µg/L. The pie charts atop illustrate the percentage contribution of each volatile relative to the total volatile composition.
Figure 6.
A) Esters, and B) terpenoids of the apple cider at racking, expressed in µg/L. The pie charts atop illustrate the percentage contribution of each volatile relative to the total volatile composition.
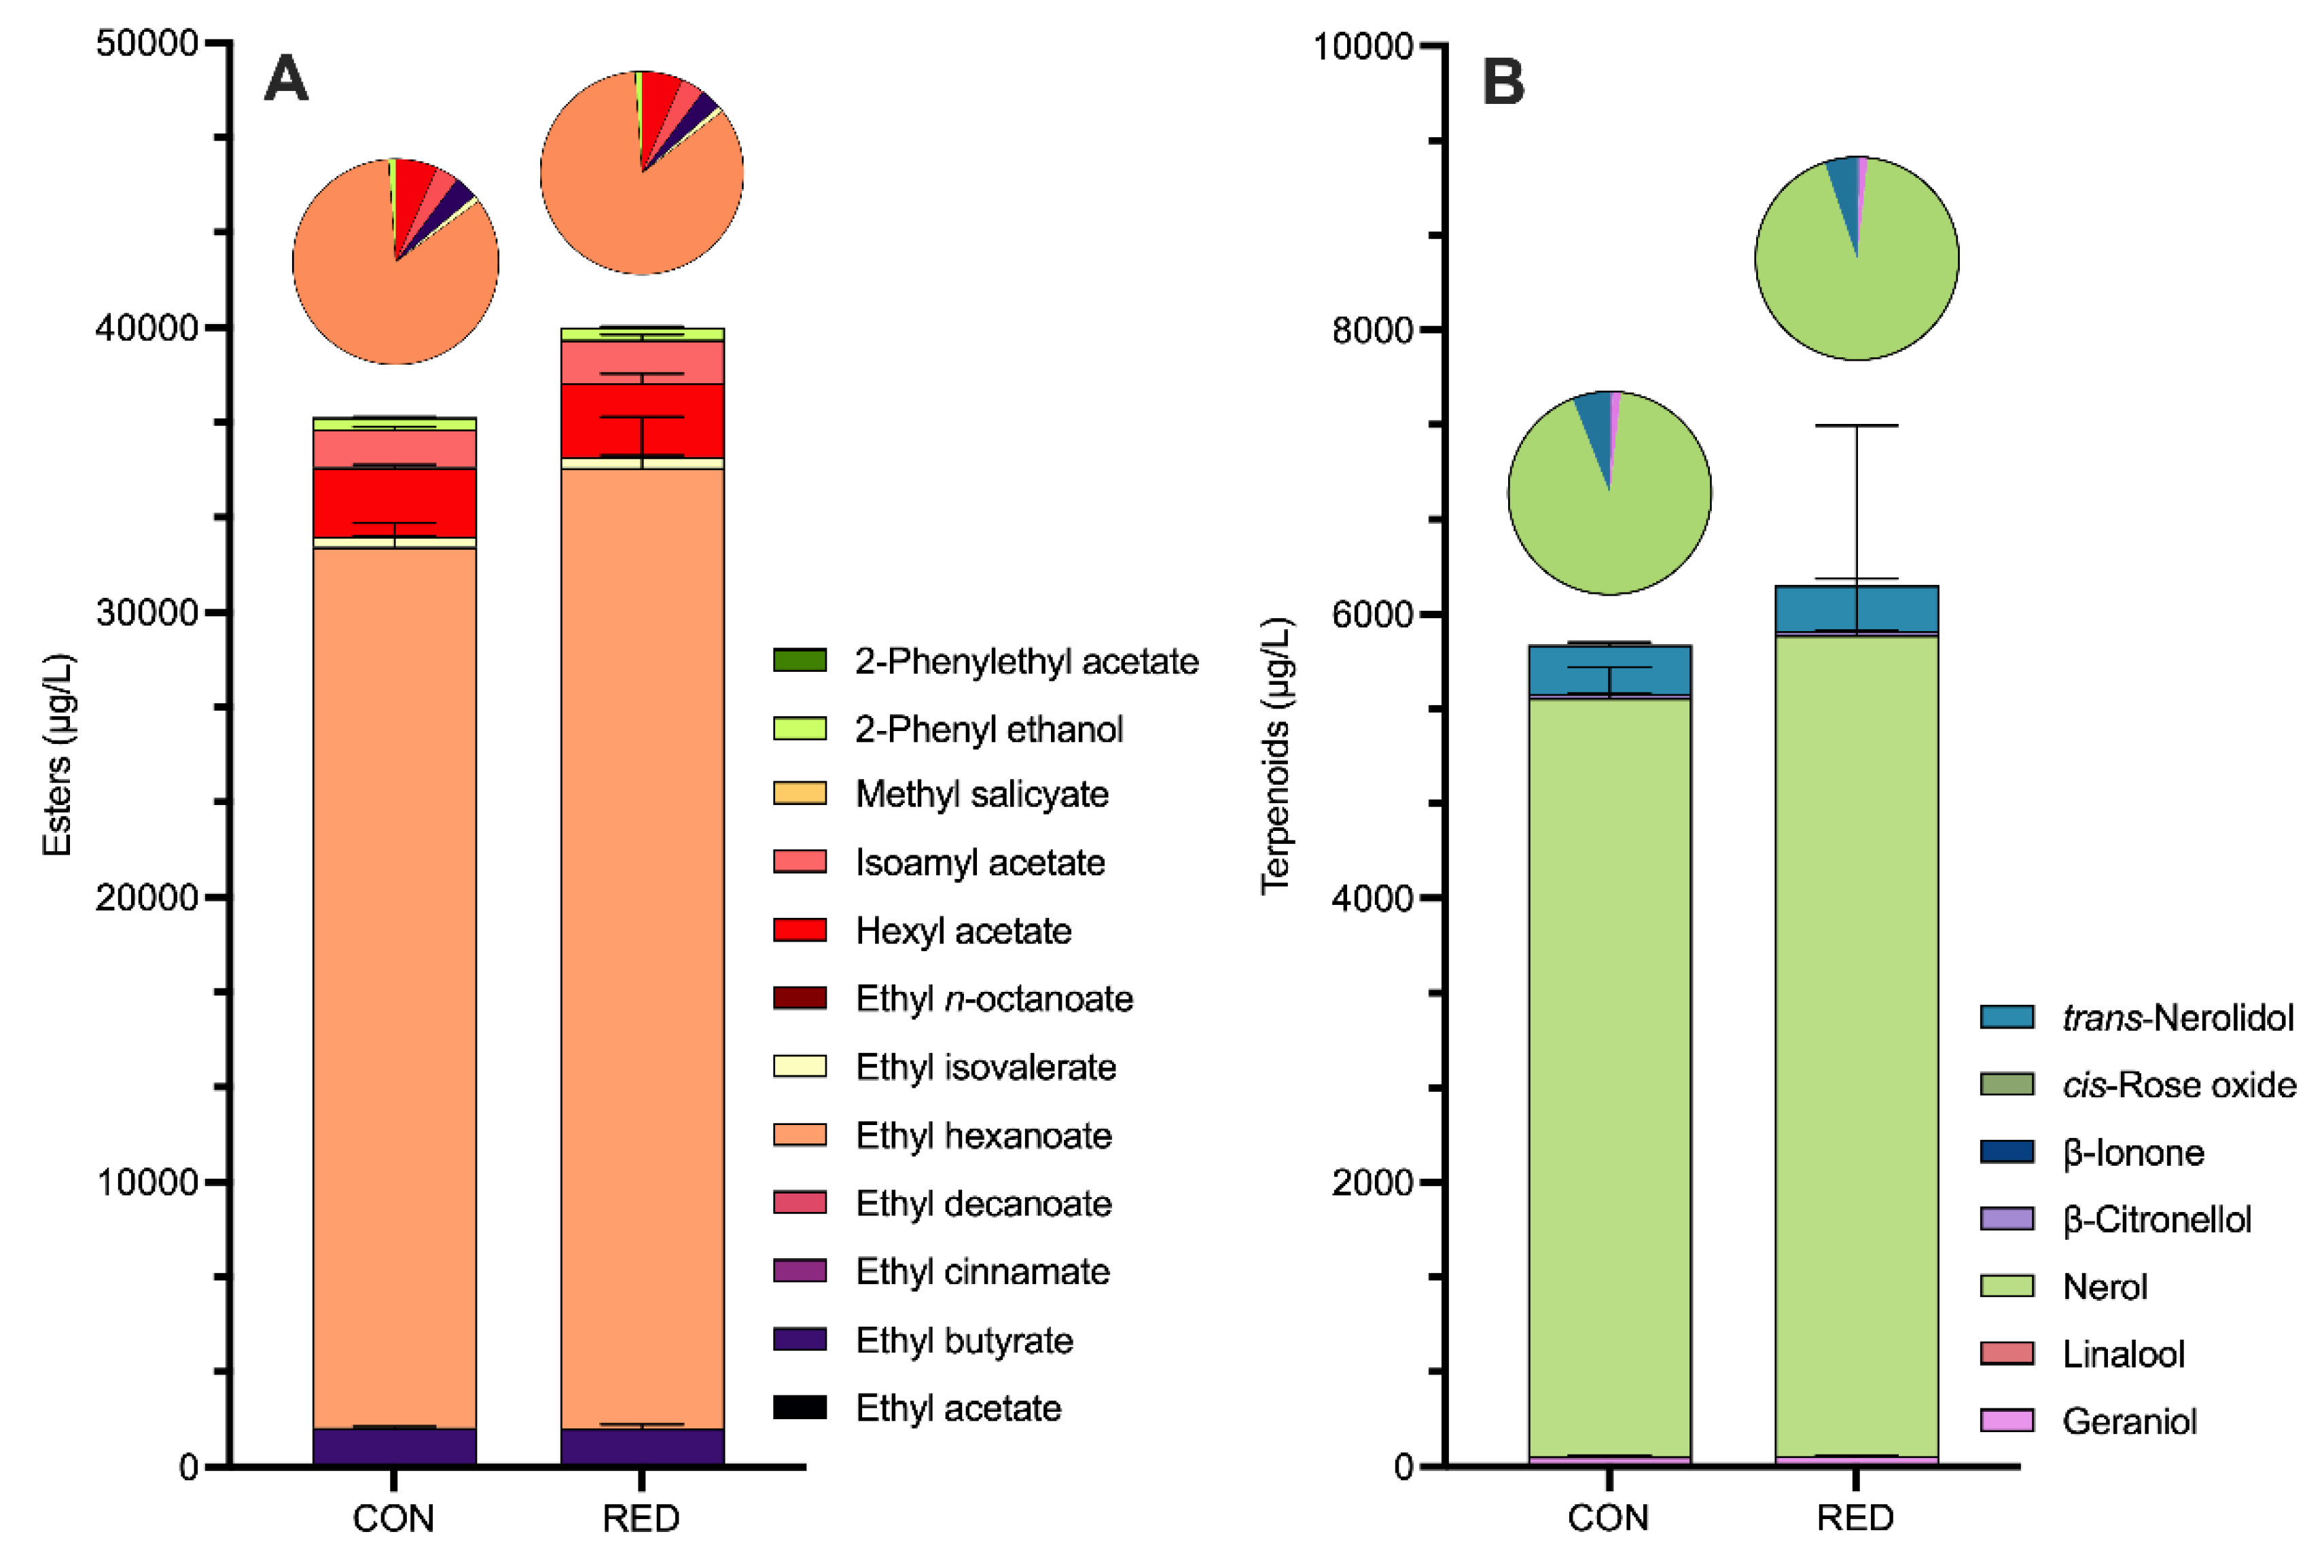
Figure 7.
Spider plots presenting aroma and flavor of CON and RED apple ciders evaluated by a sensory panel (n = 11).
Figure 7.
Spider plots presenting aroma and flavor of CON and RED apple ciders evaluated by a sensory panel (n = 11).
Disclaimer/Publisher’s Note: The statements, opinions and data contained in all publications are solely those of the individual author(s) and contributor(s) and not of MDPI and/or the editor(s). MDPI and/or the editor(s) disclaim responsibility for any injury to people or property resulting from any ideas, methods, instructions or products referred to in the content. |
© 2026 by the authors. Licensee MDPI, Basel, Switzerland. This article is an open access article distributed under the terms and conditions of the Creative Commons Attribution (CC BY) license (http://creativecommons.org/licenses/by/4.0/).
Copyright: This open access article is published under a Creative Commons CC BY 4.0 license, which permit the free download, distribution, and reuse, provided that the author and preprint are cited in any reuse.


