
Submitted:
16 July 2026
Posted:
17 July 2026
You are already at the latest version
Abstract
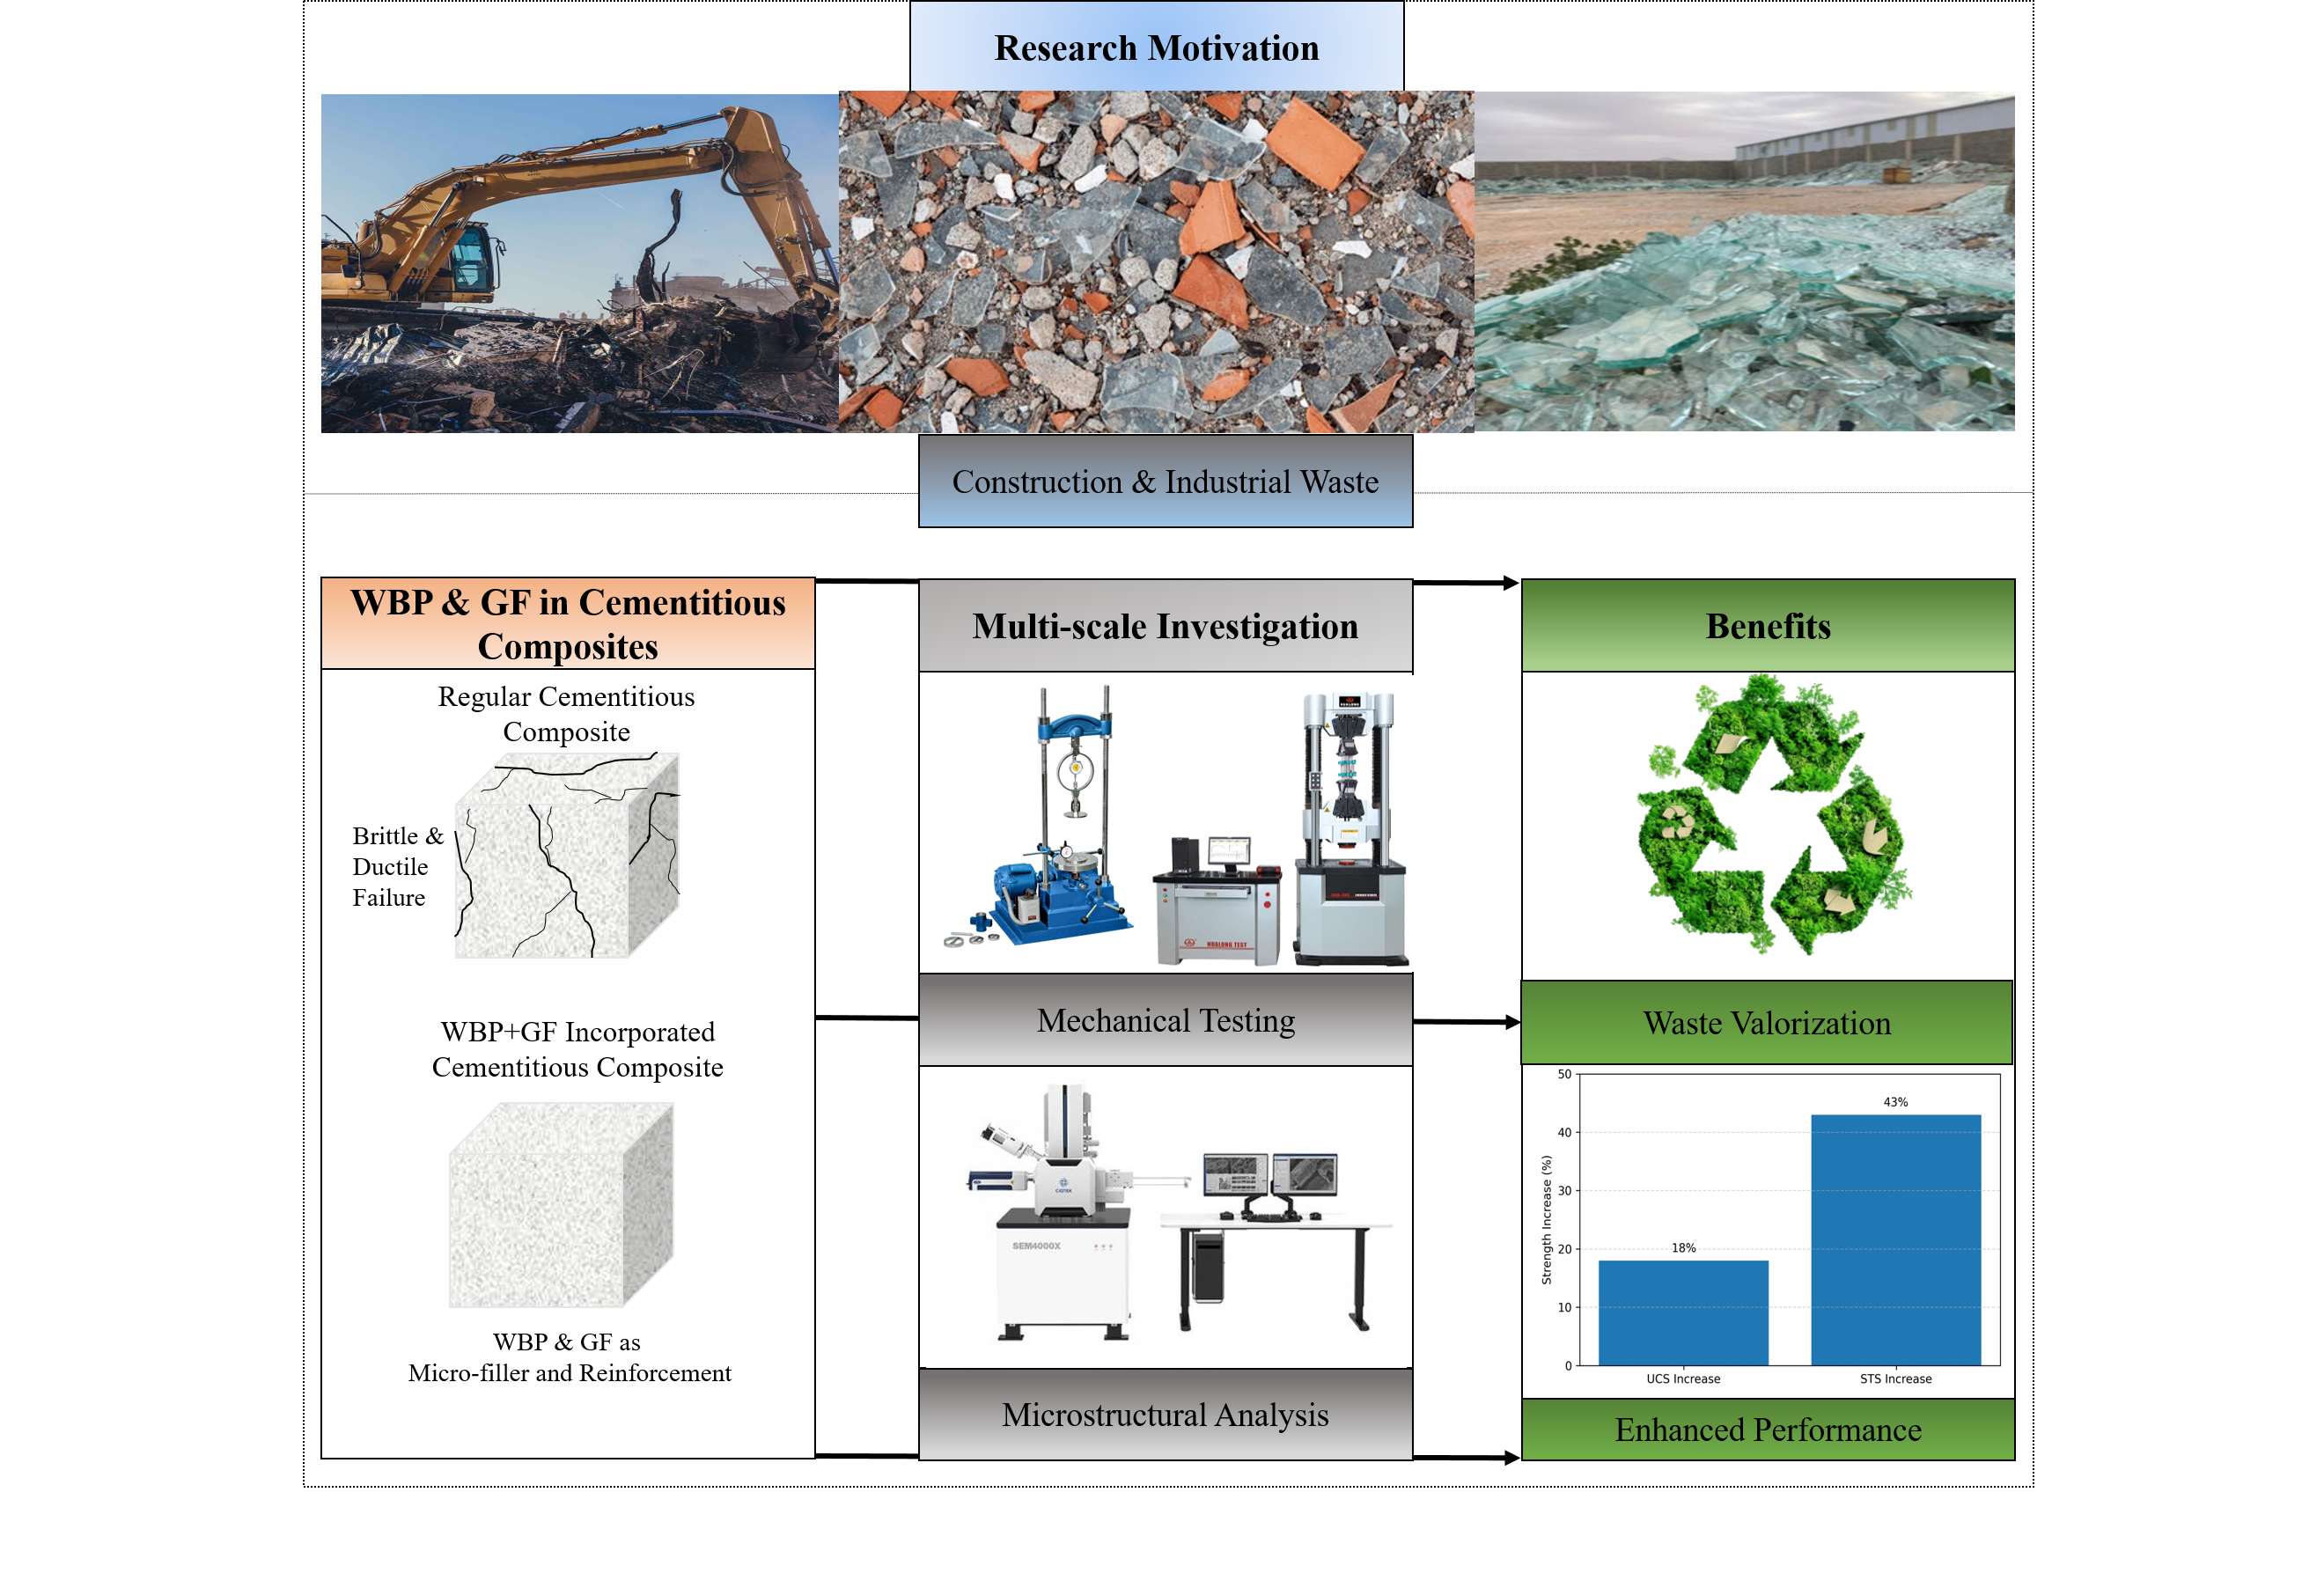
Cement-stabilized soil is widely used for ground improvement but suffers from brittleness and low tensile strength. This study investigates a sustainable composite integrating waste brick powder (WBP, 5%) and glass fiber (GF, 0–2.0%) to enhance mechanical performance and microstructural integrity. Unconfined compressive strength (UCS), splitting tensile strength (STS), and scanning electron microscopy were evaluated at 3, 14, and 28 days. Results reveal stress-state-dependent reinforcement: UCS peaked at 2.0% GF with gains of 18.1%, 7.3%, and 9.1%, while STS maximized at 1.5% GF (43% increase), declining 14.3% at 2.0% due to fiber agglomeration. Post-peak ductility improved markedly, with the residual strength ratio increasing from 12.4% to 43.2% and the ductility index from 1.18 to 1.85. Microstructural analysis confirmed that uniform fiber dispersion enables crack bridging and interfacial load transfer, whereas agglomeration creates localized weak zones. The composite avoids approximately 85 kg CO₂eq per cubic meter by valorizing construction waste. These findings establish quantitative, stress-state-dependent design guidance for sustainable cement-stabilized soil composites.
Keywords:
cement-stabilized soil
; waste brick powder
; glass fiber
; mechanical properties
; microstructure
; stress-state dependence
; sustainable composites
1. Introduction
The rapid advancement of urban–rural integration in China has intensified challenges of high energy consumption and environmental pollution in the construction industry, necessitating green, low-carbon building materials.[1] Cement-stabilized soil (cement-soil) is widely adopted for treating problematic soft soil subgrades characterized by high compressibility and low strength,[2] yet it suffers from low tensile strength, high brittleness, and excessive stiffness, restricting engineering applicability under tensile or flexural loading.[3]
Fiber reinforcement addresses these deficiencies: incorporating discrete fibers enhances compressive and tensile strength, improves toughness, and mitigates brittle failure.[4,5,6] Glass fiber (GF) is particularly notable for its high tensile strength, elastic modulus, and chemical stability.[7,8] Concurrently, construction generates substantial brick debris; processed into waste brick powder (WBP), this material serves as a supplementary cementitious material with pozzolanic reactivity.[9,10,11] The combined use of WBP and GF presents a dual benefit—improved mechanical performance and advanced waste recycling—aligning with circular economy principles (Figure 1).
Research on fiber-reinforced cementitious materials evolved from alkali-free glass fiber introduction in the late 1950s [12] to industrial production in the 1970s [13] and fiber–matrix interaction studies in the early 1990s.[14] With growing emphasis on sustainable construction, research expanded to include WBP utilization. International studies confirmed GF effectiveness in enhancing tensile strength and toughness in cement-soil composites,[7,8,15] with systematic investigations into fiber content, geometry, and curing effects.[4,5,16] Wang et al. (2022) demonstrated that synergistic cement–fiber action significantly improves strength and deformation behavior.[16]
Chinese research began in the early 2000s,[17,18] with systematic advances during the 2010s demonstrating GF enhancement of compressive strength through crack restriction and tensile strength through fiber-bridging mechanisms.[2,19,20] Triaxial tests revealed stabilizing effects under varying confining pressures,[21] while investigations identified optimal fiber dosages for soil stabilization applications.[22,23,24] However, synergistic WBP–GF interaction within a unified composite remains unexamined,[25] and gaps persist regarding reinforcement mechanisms and long-term durability.[26,27] Although recent studies have examined PVA fiber reinforcement in clayey soils,[28] ecological sustainability across global construction industries,[29] and composite-cemented backfill for ultra-deep foundations,[30] none have integrated WBP and GF within a single cement-stabilized soil system. This study elucidates the mechanical and microstructural behavior of WBP–GF cement-stabilized soil. The objectives are: (1) quantify GF effects on strength development across curing stages; (2) identify fiber content optimizing peak strength and post-cracking toughness; and (3) analyze failure behavior and microstructural evolution, clarifying fundamental reinforcement mechanisms in this sustainable composite system.
2. Materials and Methods
2.1. Materials
2.1.1. Soil
Soft clay collected from a construction site at the North Campus of Zhongyuan University of Technology, Zhengzhou, Henan Province, China, was used as the base material for this study (shown in Figure. 2). The soil contained a small proportion of brick fragments originating from on-site construction activities. Prior to testing, the material was air-dried, crushed using a laboratory ball mill, and sieved through a 1 mm mesh to obtain a uniform particle size distribution. Representative subsamples were then tested to determine basic index properties, including natural moisture content, liquid limit, plastic limit, and density, following the procedures specified in GB/T 50123-2019(Chinese Standard for Geotechnical Testing Methods). The resulting physical and mechanical properties of the soil are summarized in Table 1.
2.1.2. Cementitious Binders
Ordinary Portland cement of strength class PO 42.5 was used as the cementitious binder in this study. The cement exhibited a compressive strength of 23.4 MPa at 3 days and 42.8 MPa at 28 days. Prior to specimen preparation, the cement was stored under dry conditions to prevent moisture ingress and ensure material stability. The physical and mechanical properties of the cement are summarized in Table 2.
To align with circular economy principles, waste brick powder (WBP) was produced from construction waste bricks collected from local demolition sites. The bricks were crushed using a laboratory crusher and sieved through a 1 mm mesh to obtain WBP with controlled particle size. The resulting powder was air-dried prior to specimen preparation to minimize the influence of residual moisture. WBP was incorporated as a supplementary cementitious material at a dosage of 5% by mass of the dry soil. Local tap water was used for all mixing and curing procedures.
2.1.3. Glass Fiber Reinforcement
Alkali-free glass fiber was used as the reinforcing material and was cut into uniform lengths of 6 mm, with a nominal fiber diameter of 7 μm. The fibers were supplied as a commercial construction-grade alkali-free product.
2.2. Test Specimen Design
2.2.1. Specimen Preparation
The mix proportions were designed to investigate the synergistic effects of the sustainable additives. A constant water-cement ratio of 0.5 was maintained. The cement content was fixed at 15% by mass of the dry soil, while waste brick powder (WBP) was incorporated at 5% as a supplementary cementitious material. Glass fiber (GF) content was varied as the key experimental variable at 0%, 0.5%, 1.0%, 1.5%, and 2.0% by mass of the dry soil.
To ensure sufficient material for specimen fabrication and to account for unavoidable losses during mixing and moulding, a correction factor of 1.3 was applied to the calculated mass of raw materials required for each batch. The mass of wet soil required for each batch was determined by multiplying the natural density of the soil by the total mould volume. Expressing this relationship formally, the wet soil mass equals the soil density multiplied by the soil volume:
Where is the mass of wet soil in kilograms, is the natural density of the soil expressed in kilograms per cubic metre (equivalent to 1.69 g cm⁻³), and is the bulk volume of soil in cubic metres.
Because the soil was sampled at its natural moisture content of 13.4%, but was subsequently air-dried to a moisture content of 1.2% prior to batching, the mass of air-dried soil needed for the mix was obtained by adjusting the wet mass to account for the difference between these two moisture states. The conversion is given by multiplying the wet soil mass by a ratio that corrects for the moisture change:
Where the mass of air-dried soil in kilograms is, is the natural moisture content of the soil (13.4%), and is the moisture content of the air-dried soil (1.2%).
Once the air-dried soil mass was established, the required cement mass was calculated as a fixed percentage of that soil mass:
Where is the mass of cement in kilograms and is the cement blending ratio (15%). The mixing water was then determined from the prescribed water-to-cement ratio of 0.5:
Where is the mass of water added in kilograms and (w/c) is the water-cement ratio (0.5). The WBP and GF masses were computed proportionally from the dry soil mass according to their designated percentages.
The resulting batch masses for each mixture, including the 1.3 correction factor to cover handling and moulding losses, are listed in Table 4.
During specimen preparation, soil, waste brick powder, cement, and glass fiber were added sequentially to a mechanical mixer and dry-mixed until a uniform distribution was achieved. Water was then gradually introduced while mixing continued to ensure homogeneous consistency. To minimize material segregation, mixing was briefly interrupted to manually homogenize material adhering to the base of the mixing container.
The prepared mixture was placed into lubricated cubic moulds in two layers, with each layer subjected to vibration until visible air bubbles ceased. After mould filling, specimen surfaces were levelled and sealed with plastic film to prevent moisture loss during initial setting. Specimens were carefully demoulded after initial hardening to avoid the formation of microcracks that could influence subsequent mechanical testing. The demoulded specimens were grouped and cured under standard conditions at a temperature of 20 °C and a relative humidity exceeding 95% for curing periods of 3, 14, and 28 days. Mechanical testing was conducted immediately upon completion of curing. For each mixture and curing age, three replicate specimens were fabricated and tested (n = 3), yielding a total of 45 specimens (5 mixtures × 3 ages × 3 replicates). An additional three specimens per mixture were reserved for microstructural analysis, bringing the total to 60 specimens. Figure 3 summarizes the four-stage specimen preparation workflow from material proportioning through to curing.
2.2.2. Testing Apparatus
Sample preparation and testing were conducted using standard laboratory equipment suitable for soil stabilization studies. Soil and waste brick materials were crushed and sieved using mechanical grinding and screening equipment to obtain controlled particle sizes. Mixing was performed using a planetary mixer capable of sequential dry and wet mixing to ensure uniform fiber dispersion. Specimens were moulded in cubic moulds with a side length of 70.7 mm and compacted using a vibration table to eliminate entrapped air.
Curing was carried out in a controlled-environment chamber maintained at a temperature of 20 °C and a relative humidity exceeding 95%. Mechanical testing was conducted using a microcomputer-controlled testing machine capable of applying controlled loading rates and recording load–displacement responses. Auxiliary equipment, including precision balances and standard measuring tools, was used to ensure accurate material proportioning and specimen preparation.
2.2.3. Testing Methodology
Unconfined compressive strength and splitting tensile strength tests were conducted on cubic specimens with dimensions of 70.7 mm × 70.7 mm × 70.7 mm. For unconfined compression testing, specimens were loaded at a constant displacement rate of 1 mm/min in accordance with ASTM D2166/D2166M and GB/T 50123-2019. Loading was continued until failure and subsequently extended to a deformation of 3 mm, while the load–deformation response was continuously recorded.
The unconfined compressive strength, denoted, was obtained by dividing the maximum applied load by the initial cross-sectional area of the specimen:
Where is the maximum applied load in newtons and = a² is the initial cross-sectional area in square millimeters, with a = 70.7 mm being the specimen side length. Test results deviating by more than 15% from the mean value were excluded prior to averaging.
To quantify the post-peak ductility imparted by fiber reinforcement, the residual load-bearing capacity at 1 mm of deformation beyond the peak was recorded and expressed as a percentage of the peak load. This residual strength ratio, written as , was computed as the post-peak load divided by the peak load, multiplied by 100%:
Where is the load recorded at 1 mm post-peak deformation. Additionally, the ductility index (DI) was computed as the ratio of the total energy absorbed up to 3 mm post-peak deformation to the elastic energy stored up to the peak load, obtained by numerical integration of the stress–strain curve.
Splitting tensile strength tests were performed in accordance with ASTM C496/C496M. Prior to loading, splitting lines were marked on specimen surfaces, and specimens were positioned between steel loading strips measuring 150 mm × 5 mm × 5 mm. Loading was applied at a constant rate of 8 mm/min until failure. The splitting tensile strength, denoted, was calculated by distributing the failure load over the nominal splitting plane of the cube:
Where P is the applied load at failure in newtons and a is the specimen side length in millimeters. Outlier treatment followed the same criteria applied to compressive strength results (n = 3, 15% exclusion rule, replacement from reserve specimens). Failure characteristics, including crack development and specimen fragmentation, were documented to compare fiber-reinforced and unreinforced specimens.
One-way analysis of variance (ANOVA) was performed to evaluate the effect of GF content (five levels: 0, 0.5, 1.0, 1.5, 2.0%) on UCS and STS at each curing age. The null hypothesis stated that GF content has no significant effect on mean strength. Where ANOVA yielded p < 0.05, Tukey’s honestly significant difference (HSD) post-hoc test was applied to identify statistically homogeneous subsets (α = 0.05). All statistical computations were performed using standard scientific software. The ANOVA results are reported in the Results section.
For microstructural analysis, selected fractured specimens were preserved in anhydrous ethanol to inhibit further hydration. Representative samples with dimensions of approximately 10 mm × 10 mm × 10 mm were prepared for scanning electron microscopy to examine fiber–matrix interaction, crack-bridging behavior, and microstructural features governing mechanical performance.
2.2.4. Quality Control and Summary
To ensure reproducibility, the following control measures were implemented: (i) soil and WBP were pre-sieved to <1 mm and stored in sealed containers, with cement used within 30 days of opening; (ii) mixing speed and duration were fixed, with visual inspection for fiber clumping and discarding of non-uniform batches; (iii) vibration time was standardized until air bubble cessation, with specimen height checked to ±1 mm tolerance; (iv) curing chamber temperature (20 °C) and relative humidity (>95%) were monitored continuously; and (v) the testing machine was calibrated periodically, with loading rate maintained within ±5% of target.
The experimental program comprised 60 specimens in total: 45 for mechanical testing (5 mixtures × 3 ages × 3 replicates) and 15 for microstructural analysis (5 mixtures × 3 replicates). All differences in measured performance can be attributed primarily to variations in GF content and curing age, as material sourcing, proportioning, mixing, curing, and testing were standardized throughout.
3. Results
3.1. Compressive Strength Development
The development of unconfined compressive strength (UCS) in the cement-stabilized soil composites, as influenced by glass fiber content and curing age, is presented in Figure 4. All reported values represent the mean of three replicate specimens, with error bars indicating ±1 standard deviation. The coefficient of variation (CV) across all test groups ranged from 4.2% to 11.8%, indicating acceptable repeatability.
Overall, the inclusion of glass fiber enhanced compressive strength at all curing stages, although the extent of improvement depended on fiber content and curing duration. At a fiber content of 0.5%, only limited enhancement was observed across all curing ages. Increasing the fiber content to 1.0% resulted in a pronounced improvement in early-age strength, with the compressive strength of 3-day cured specimens increasing by approximately 15.4% compared with the fiber-free reference mixture. At a fiber content of 1.5%, the most notable improvement occurred at 14 days, where compressive strength increased by approximately 7.3%. The greatest overall enhancement was achieved at a fiber content of 2.0%, corresponding to strength increases of approximately 18.1%, 5.4%, and 9.1% at curing ages of 3, 14, and 28 days, respectively, relative to specimens without glass fiber. Although compressive strength increased with curing time for all mixtures, the relative reinforcing contribution of glass fiber diminished at later ages, indicating that glass fiber addition is more effective in improving the compressive performance of early-age cement-soil, when the cementitious matrix is less mature and fiber–matrix interaction plays a more significant role.
Glass fiber–reinforced specimens exhibited fewer surface cracks with reduced crack widths at failure, whereas unreinforced specimens showed numerous wide cracks accompanied by surface spalling. As shown in Figure 5, the compressive load-bearing capacity of unreinforced specimens declined rapidly with increasing post-peak deformation, reflecting pronounced brittle failure behavior. In contrast, glass fiber–reinforced specimens exhibited a markedly reduced rate of strength degradation after peak load, demonstrating improved post-peak resistance and deformation tolerance.
The residual strength ratio at 1 mm post-peak deformation increased progressively with GF content, from 12.4% for the control to 43.2% at 2.0% GF, representing a 248% improvement in post-peak load-bearing capacity. The ductility index followed a similar trend, increasing from 1.18 to 1.85, confirming the transition from brittle to more ductile failure behavior.
3.2. Splitting Tensile Strength Development
The effectiveness of glass fiber reinforcement in mitigating the low tensile strength of cement-stabilized soil is shown in Figure 6. All values represent mean ± standard deviation (n = 3). On average, the splitting tensile strength (STS) increased by approximately 25% across all fiber contents compared with the fiber-free reference mixture.
The improvement was strongly dependent on fiber dosage. At a fiber content of 1.0%, the splitting tensile strength increased by approximately 36%, while a peak enhancement of about 43% was achieved at an optimal fiber content of 1.5%. Further increasing the glass fiber content to 2.0% resulted in a reduced reinforcing effect, with the splitting tensile strength increase declining to approximately 22.6%. This represents a reduction of around 14.3% relative to the peak performance observed at 1.5% fiber content, indicating that excessive fiber addition can adversely affect tensile performance. It should be noted that this trend differs from the compressive strength behavior, for which the highest strength values were generally obtained at a fiber content of 2.0% (Figure 4).
Unreinforced specimens exhibited pronounced brittle failure during splitting tensile testing, typically separating completely into two distinct halves. In contrast, glass fiber–reinforced specimens retained greater structural integrity owing to fiber bridging and bonding effects. Cracks developed without complete separation, and both crack width and depth were significantly reduced compared with unreinforced specimens.
3.3. Microstructural Analysis
Figure 8 shows the microstructural features of glass fiber–reinforced cement-soil. The glass fibers are embedded within the cementitious matrix and exhibit both mechanical interlocking and adhesive bonding with hydration products and soil particles. These interactions enable fibers to bridge developing microcracks by connecting particles across fracture surfaces, thereby restricting crack initiation and propagation. As shown in Figure 9, fibers located at crack interfaces during splitting tensile loading are subjected primarily to tensile and shear stresses. Owing to the comparatively high tensile and shear strength of glass fibers relative to the cement-soil matrix, fiber bridging provides an efficient load-transfer mechanism, resulting in a more pronounced improvement in splitting tensile strength than in compressive strength.
Minor variations in compressive strength observed for certain GF-reinforced specimens were attributed to fiber agglomeration arising from excessive fiber content or insufficient mixing. These agglomerates create localized weak zones with reduced interfacial bonding strength, promoting preferential crack initiation under compressive loading. When uniformly dispersed, however, glass fibers form a three-dimensional reinforcement network within the cement-soil matrix that restricts lateral deformation of soil particles and contributes directly to load sharing under compression, thereby enhancing overall strength. Evidence of this mechanism is provided in Figure 9, where cracking initiates preferentially at regions associated with fiber clustering following specimen failure.
Microstructural observations presented in Figure 10 further illustrate these contrasting effects. In specimens without glass fiber reinforcement, soil particles are loosely arranged and exhibit relatively weak antiparticle bonding, leading to crushing and partial detachment under compressive loading. In contrast, the presence of glass fibers enhances compressive strength by anchoring soil particles across developing cracks and promoting stress transfer through fiber bridging. These observations highlight the importance of achieving uniform fiber dispersion to fully mobilize fiber–matrix adhesion and maximize the reinforcing effectiveness of glass fibers in cement-soil composites.
4. Discussion
The synergistic integration of waste brick powder (WBP) and glass fiber (GF) produces stress-state-dependent reinforcement in cement-stabilized soil. Under compression, the optimal GF content is 2.0%, where a three-dimensional fiber network restricts lateral particle deformation and redistributes stresses, yielding an 18.1% strength increase at 3 days. Under tension, however, the optimum is 1.5%, producing a 43% splitting tensile strength increase via crack-face bridging and frictional load transfer. At 2.0% GF, tensile enhancement declines by 14.3% relative to the 1.5% peak because fiber agglomeration reduces effective interfacial bonding and creates preferential failure planes.
The relative contribution of GF reinforcement diminishes with curing age—from 18.1% at 3 days to 9.1% at 28 days—as the cementitious matrix matures and assumes a greater load-bearing proportion. This indicates that GF modification offers greatest advantage for early-age applications such as rapid subgrade stabilization. The failure mode transition from brittle fracture to controlled damage is quantified by the residual strength ratio increasing from 12.4% to 43.2% and the ductility index from 1.18 to 1.85 at 2.0% GF, confirming substantial energy dissipation through sequential fiber deboning, elongation, and pull-out.
Sustainability metrics validate the circular economy rationale: WBP substitution at 5% avoids approximately 85 kg CO₂ eq per cubic meter of composite. At project scale, a 1 km road subgrade would consume 110 t of WBP, divert 138 t of brick waste, and prevent 99 t of CO₂ emissions.
Design guidance follows directly from the stress-state dependence: 2.0% GF for compression-dominated applications (bearing layers) and 1.5% GF for tension-critical scenarios (subgrades, expansive soils). Limitations include unconfined testing conditions, unevaluated long-term durability, commercial rather than recycled GF, and absence of fiber mechanical data for micromechanical modelling. Addressing these gaps will advance field implementation of this waste-derived composite system.
5. Conclusions
This study demonstrated that the synergistic integration of waste brick powder (WBP) and glass fibers (GF) into cement-stabilized soil produces a superior, sustainable geomaterial with stress-state-dependent optimal dosages. The principal findings are as follows.
- Glass fiber reinforcement enhanced compressive strength most effectively at early ages, with a maximum increase of 18.1% at 2.0% GF and 3 days curing. The relative reinforcing contribution diminished at later ages as the cementitious matrix matured, indicating that GF modification is most advantageous for early-age strength development.
- Splitting tensile strength peaked at 1.5% GF with a 43% increase, whereas 2.0% GF caused a 14.3% reduction relative to this optimum due to fiber agglomeration. This divergence establishes distinct optimal dosages: 2.0% GF for compression-dominated applications and 1.5% GF for tension-critical scenarios.
- Fiber incorporation transformed the failure mode from brittle catastrophic fracture to controlled progressive damage. The residual strength ratio increased from 12.4% to 43.2% and the ductility index from 1.18 to 1.85 at 2.0% GF, confirming substantial energy dissipation through fiber debonding, elongation, and pull-out mechanisms.
- Microstructural analysis validated that uniform fiber dispersion enables crack bridging and interfacial load transfer, whereas agglomeration creates localized weak zones that compromise tensile performance.
- The composite advances circular economy objectives by valorizing construction waste: WBP substitution at 5% avoids approximately 85 kg CO₂ eq per cubic meter, with project-scale implementation diverting 138 t of brick waste and preventing 99 t of CO₂ emissions per kilometer of road subgrade.
Supplementary Materials
The following supporting information can be downloaded at the website of this paper posted on Preprints.org, See the supplementary material for complete batch composition calculations, equivalent mix proportions per unit volume, and the extended literature comparison table.
Author Contributions
Conceptualization, X.Y.; methodology, X.Y. and M.M.R.; investigation, M.M.R. and J.W.; data curation, A.M.; writing–review and editing, M.M.R. and J.W.; supervision, X.Y.; project administration, X.Y.; funding acquisition, X.Y. All authors have read and agreed to the published version of the manuscript.
Data Availability Statement
Some or all data, models, or code generated or used during the study are proprietary or confidential in nature and may only be provided with restrictions.
Acknowledgements
This research was funded by the Key Scientific Research Projects of Colleges and Universities in Henan Province (Grant No. 25A560002) and the Graduate Research Innovation Program of Zhongyuan University of Technology (Grant No. YKY2026ZK56).
Conflicts of Interest
The authors declare no conflicts of interest.
References
- Scrivener, K.L.; John, V.M.; Gartner, E.M. Eco-efficient cements: Potential economically viable solutions for a low-CO₂ cement-based materials industry. Cem. Concr. Res. 2018, 114, 2. [Google Scholar] [CrossRef]
- Liu, Z.; Ong, D.E.L.; Wang, S.; Oh, E.; Liu, Y.; Xu, Y. Mineralogical and microstructural characterization of cement-stabilized soft soils based on quantitative analyses. J. Mater. Civ. Eng. 2023, 35, 04022487. [Google Scholar] [CrossRef]
- Tamassoki, S.; Daud, N.N.N.; Nejabi, M.N.; Roshan, M.J.; Rahman, A. Fibre-reinforced soil mixed lime/cement additives: A review. Pertanika J. Sci. Technol. 2022, 31, 217–235. [Google Scholar] [CrossRef]
- Wang, D.; Wang, H.; Larsson, S.; Benzerzour, M.; Maherzi, W.; Amar, M. Effect of basalt fiber inclusion on the mechanical properties and microstructure of cement-solidified kaolinite. Constr. Build. Mater. 2020, 241, 118085. [Google Scholar] [CrossRef]
- Liang, L.; Xu, Y.; Hu, S. Bending and crack evolution behaviors of cemented soil reinforced with surface modified PVA fiber. Materials 2022, 15, 4799. [Google Scholar] [CrossRef] [PubMed]
- Khan, S.; Khattak, S.U.; Khan, H. Composite fibers in concrete: Properties, challenges, and future directions. Eng. Proc. 2023, 44, 17. [Google Scholar] [CrossRef]
- Yıldırım, M.; Bilir Özhan, H. Residual durability performance of glass fiber reinforced concrete damaged by compressive stress loads. Period. Polytech. Civ. Eng. 2023, 67, 392–401. [Google Scholar] [CrossRef]
- Sharo, A.A.; Alawneh, A.S.; Al Zghool, H.N.; Rabab’ah, S.R. Effect of alkali-resistant glass fibers and cement on the geotechnical properties of highly expansive soil. J. Mater. Civ. Eng. 2022, 34, 04021417. [Google Scholar] [CrossRef]
- He, Z.; Shen, A.; Wu, H.; Wang, W.; Wang, L.; Yao, C.; et al. Research progress on recycled clay brick waste as an alternative to cement for sustainable construction materials. Constr. Build. Mater. 2021, 274, 122113. [Google Scholar] [CrossRef]
- Hu, J.; Ahmed, W.; Jiao, D. A critical review of the technical characteristics of recycled brick powder and its influence on concrete properties. Buildings 2024, 14, 3691. [Google Scholar] [CrossRef]
- Yin, X.; Rahman, M.M.; Pan, H.; Ma, Y.; Sun, Y.; Wang, J. Experimental investigation of mechanical properties and microstructure in cement–soil modified with waste brick powder and polyvinyl alcohol fibers. Materials 2025, 18, 3586. [Google Scholar] [CrossRef] [PubMed]
- Brandt, A.M. Fibre reinforced cement-based (FRC) composites after over 40 years of development in building and civil engineering. Compos. Struct. 2008, 86, 3. [Google Scholar] [CrossRef]
- Fenu, L.; Forni, D.; Cadoni, E. Dynamic behaviour of cement mortars reinforced with glass and basalt fibres. Compos. Part B Eng. 2016, 92, 142–150. [Google Scholar] [CrossRef]
- Xiao, J.; Han, N.; Li, Y.; Zhang, Z.; Shah, S.P. Review of recent developments in cement composites reinforced with fibers and nanomaterials. Front. Struct. Civ. Eng. 2021, 15, 1. [Google Scholar] [CrossRef]
- Yin, X.; Li, C.; Tang, S.; Wang, J.; Rahman, M.M. Effects of basalt/glass fiber reinforcement on compressive strength of waste glass powder cement-soil. AIP Adv. 2025, 15, 065207. [Google Scholar] [CrossRef]
- Wang, W.; Kang, H.; Li, N.; Guo, J.; Girma, D.Y.; Liu, Y. Experimental investigations on the mechanical and microscopic behavior of cement-treated clay modified by nano-MgO and fibers. Int. J. Geomech. 2022, 22, 04022059. [Google Scholar] [CrossRef]
- Xiao, J.; Ding, T. Research on recycled concrete and its utilization in building structures in China. Front. Struct. Civ. Eng. 2013, 7, 215–226. [Google Scholar] [CrossRef]
- Dong, L. Study on treatment of loess subgrade disease by cement mixing pile. Vibroengineering Procedia 2022, 41, 42–47. [Google Scholar] [CrossRef]
- Liu, C.; Berard, C.; Deng, L. Engineering behavior of cement-treated stiff clay subjected to freezing/thawing cycles. Cold Reg. Sci. Technol. 2023, 206, 103743. [Google Scholar] [CrossRef]
- Abdallah, A.; Russo, G.; Cuisinier, C. Statistical and predictive analyses of the strength development of a cement-treated clayey soil. Geotechnics 2023, 3, 465–479. [Google Scholar] [CrossRef]
- He, S.H.; Ding, Z.; Goudarzy, M.; Sun, Y.; Yin, Z.Y. Effect of variable confining pressure on the long-term cyclic behaviour of calcareous sand: Experimental observation and microstructural interpretation. Can. Geotech. J. 2024, 61, 311–327. [Google Scholar] [CrossRef]
- Zhang, Z.; Omine, K.; Flemmy, F.S.O.; Li, C. The liquid limit as a factor in assessing the improvement of stabilized cement-based high water content clayey sediments. Materials 2022, 15, 7240. [Google Scholar] [CrossRef] [PubMed]
- Lu, L.; Ma, Q.; Hu, J.Y.; Li, Q. Mechanical properties, curing mechanism, and microscopic experimental study of polypropylene fiber coordinated fly ash modified cement–silty soil. Materials 2021, 14, 5441. [Google Scholar] [CrossRef] [PubMed]
- Tarabin, M.; Leblouba, M.; Barakat, S.; Zahri, M. Experimental and probabilistic analysis of the crack propagation in fiber reinforced concrete. Eng. Fail. Anal. 2023, 151, 107388. [Google Scholar] [CrossRef]
- Feng, Y.S.; Zhou, S.J.; Zhou, A.; Xia, W.Y.; Li, J.S.; Wang, S.; et al. Reuse of a contaminated soil stabilized by a low-carbon binder as roadway subgrade material and mechanical performance evaluation. Eng. Geol. 2022, 303, 106656. [Google Scholar] [CrossRef]
- Martinelli, F.; Ribeiro, F.R.C.; Marvila, M.T.; Monteiro, S.N.; da C.G. Filho, F.; de Azevedo, A.R.G. A review of the use of coconut fiber in cement composites. Polymers 2023, 15, 1309. [Google Scholar] [CrossRef] [PubMed]
- Xu, J.; Liu, Y.; Simi, A.; Zhang, J. Recycling and reuse of construction and demolition waste: From the perspective of national natural science foundation-supported research and research-driven application. Case Stud. Constr. Mater. 2022, 16, e00876. [Google Scholar] [CrossRef]
- Huang, T.; Hou, L.; Dai, G.; Yang, Z.Q.; Xiao, C. Investigation on strength and flexural behavior of PVA fiber-reinforced and cemented clayey soil. Buildings 2024, 14, 2433. [Google Scholar] [CrossRef]
- Liu, B.; Gao, Q.; Liang, L.; Sun, J.; Liu, C.; Xu, Y. Ecological relationships of global construction industries in sustainable economic and energy development. Energy 2021, 234, 121249. [Google Scholar] [CrossRef]
- Dong, X.; Wang, M.; Song, M.; Hou, N. Engineering properties and microscopic mechanisms of composite-cemented soil as backfill of ultra-deep and ultra-narrow foundation trenches. Appl. Sci. 2023, 13, 1952. [Google Scholar] [CrossRef]
Figure 1.
Sustainability rationale for glass fiber–reinforced waste brick powder cement-soil.
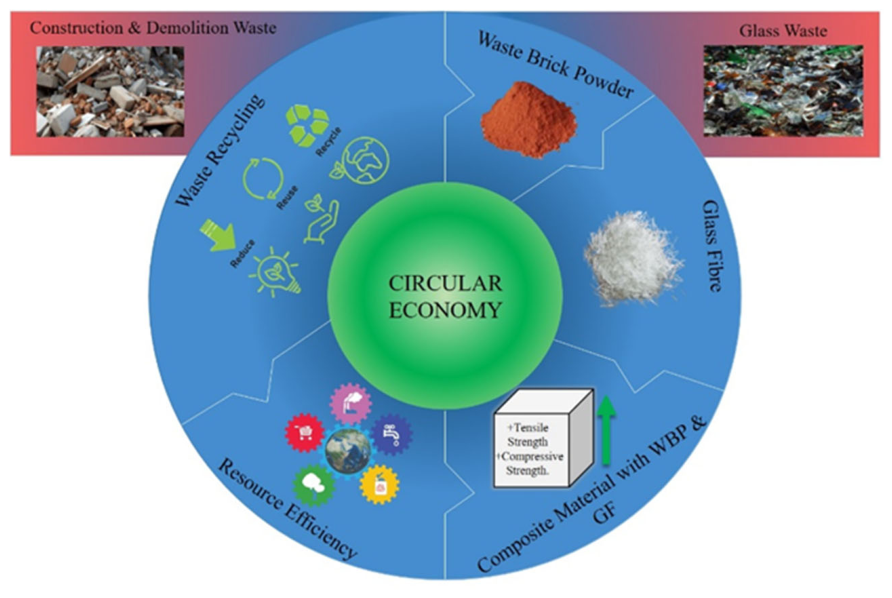
Figure 2.
Geolocation of the soil sampling site.
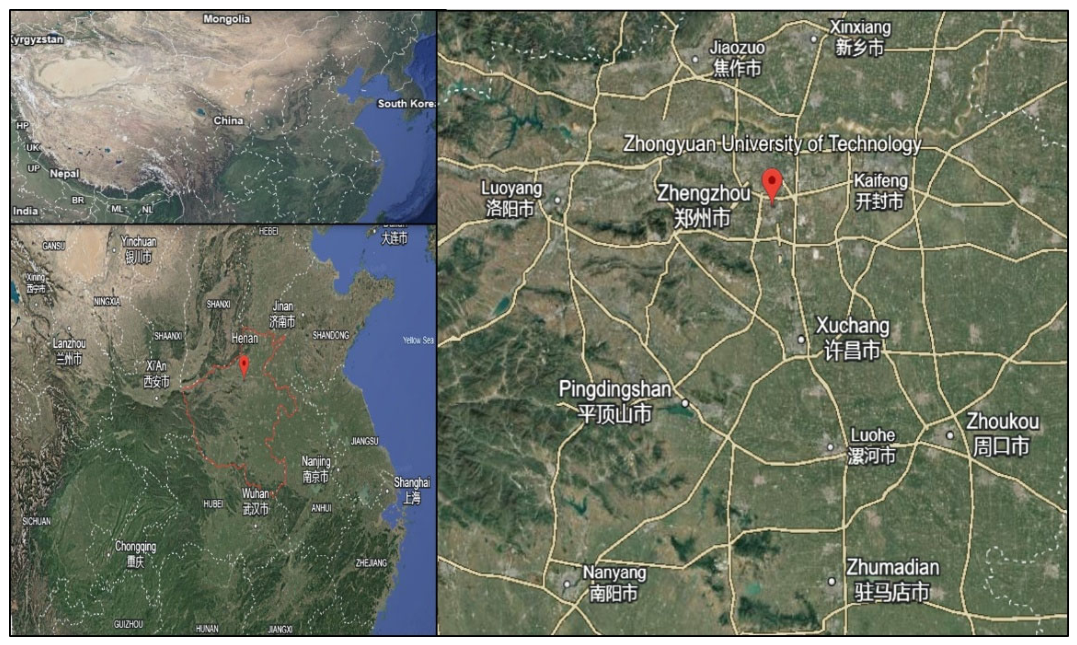
Figure 3.
Specimen preparation and testing procedure.
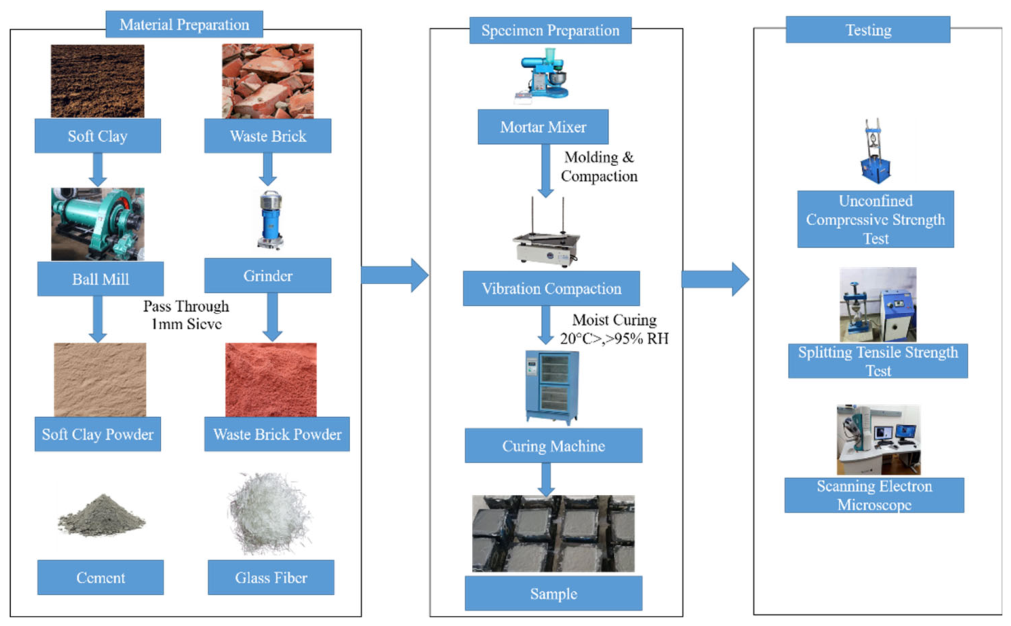
Figure 4.
Compressive strength of test blocks at different ages.
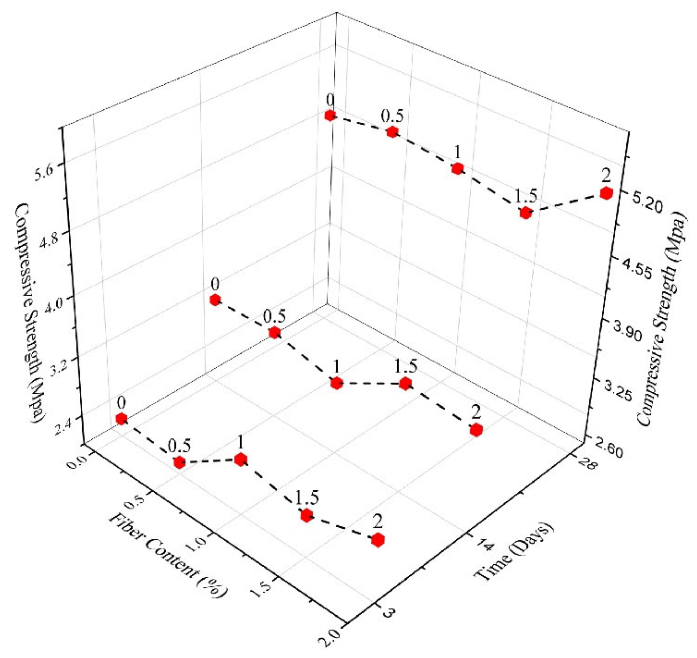
Figure 5.
Load capacity degradation rate after specimen failure.
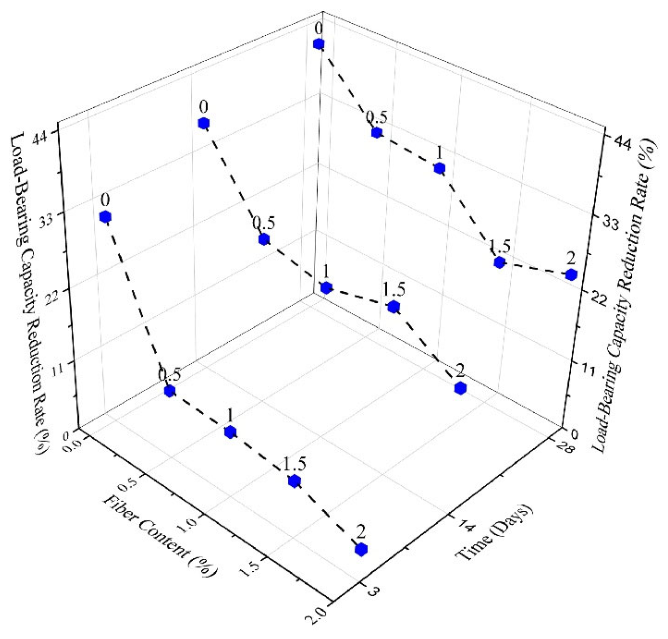
Figure 6.
Splitting tensile strength of specimens.
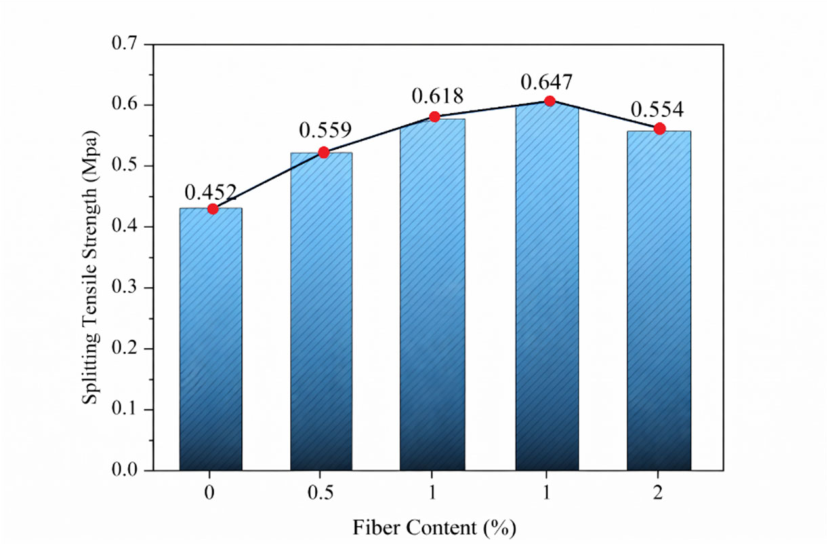
Figure 8.
SEM micrograph of glass fiber reinforcement mechanism.
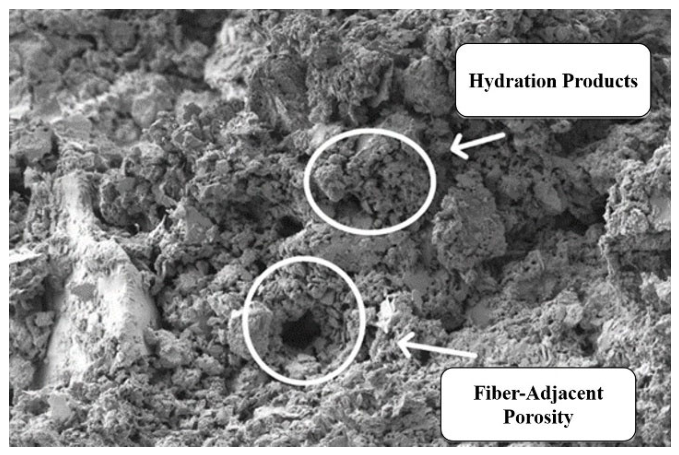
Figure 9.
SEM micrograph of glass fiber adhesion.
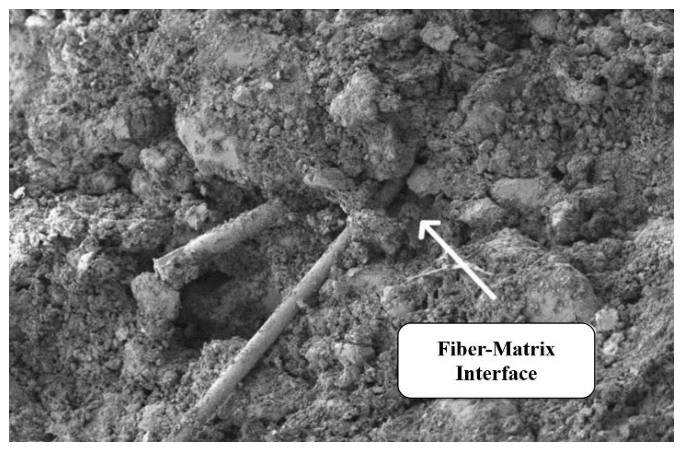
Figure 10.
SEM micrograph of soil particles in plain cement-treated soil.
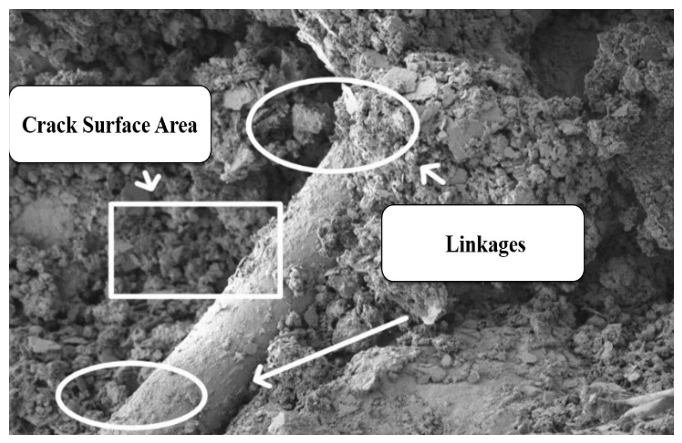

Table 1.
Basic physical properties of soil.
| Property | Value |
|---|---|
| Natural moisture content (%) | 13.4 |
| Moisture content of air-dried soil (%) | 1.2 |
| Soil density (g cm⁻³) | 1.69 |
| Plastic limit (%) | 18.0 |
| Liquid limit (%) | 27.34 |
Table 2.
Physical and mechanical properties of cement.
| Property | Value |
|---|---|
| Specific surface area (m² kg⁻¹) | 350 |
| Initial setting time (min) | 195 |
| Final setting time (min) | 250 |
| Soundness | Qualified |
| 3-day flexural strength (MPa) | 5.3 |
| 3-day compressive strength (MPa) | 23.4 |
| Loss on ignition (%) | 4.12 |
Table 3.
Geometric properties of glass fiber.
| Property | Value |
|---|---|
| Nominal diameter (μm) | 7 |
| Length (mm) | 6 |
| Aspect ratio (—) | ~857 |
Table 4.
Mix proportions per batch.
| GF Content (%) | Soil (g) | Cement (g) | WBP (g) | Glass fiber (g) | Water (g) |
|---|---|---|---|---|---|
| 0 | 1851 | 349 | 92 | 0 | 652 |
| 0.5 | 1851 | 349 | 92 | 9.2 | 652 |
| 1.0 | 1851 | 349 | 92 | 18.4 | 652 |
| 1.5 | 1851 | 349 | 92 | 27.6 | 652 |
| 2.0 | 1851 | 349 | 92 | 36.8 | 652 |
Disclaimer/Publisher’s Note: The statements, opinions and data contained in all publications are solely those of the individual author(s) and contributor(s) and not of MDPI and/or the editor(s). MDPI and/or the editor(s) disclaim responsibility for any injury to people or property resulting from any ideas, methods, instructions or products referred to in the content. |
© 2026 by the authors. Licensee MDPI, Basel, Switzerland. This article is an open access article distributed under the terms and conditions of the Creative Commons Attribution (CC BY) license.
Copyright: This open access article is published under a Creative Commons CC BY 4.0 license, which permit the free download, distribution, and reuse, provided that the author and preprint are cited in any reuse.


