
Submitted:
15 July 2026
Posted:
16 July 2026
You are already at the latest version
Abstract
Photovoltaic (PV) tilt optimization is commonly guided by latitude-based rules, but these heuristics do not explicitly account for sub-daily irradiance variability, diffuse-fraction behavior, or local atmospheric attenuation. This study presents FT-PVOT, a geometry-resolved framework that integrates National Solar Radiation Database (NSRDB) irradiance data with solar-position and plane-of-array (POA) transposition equations to identify irradiance-maximizing fixed and seasonal PV tilt angles. Direct normal irradiance, diffuse horizontal irradiance, and global horizontal irradiance were evaluated using a brute-force tilt sweep from 0° to 90° at 1° increments. The method was tested for Gainesville, Florida (29.65° N), using 2018-2023 NSRDB data and benchmarked against PVWatts tilt trends. The annual fixed optimum remained highly stable across the six-year period, ranging from 28° to 29° with a mean of approximately 28.8° and a standard deviation of approximately 0.41°. PVWatts produced an annual optimum of 29°, yielding a mean difference of approximately 0.17°. Relative to flat mounting, latitude tilt increased annual POA irradiation by approximately 9.2%, annual optimization by 9.6%, biannual adjustment by 13.5%, and monthly adjustment by 15.1%. However, monthly adjustment added only 1.6 percentage points, or approximately 27 kWh/m²/year, beyond biannual adjustment. Cloudy-sky conditions reduced annual POA irradiation by approximately 35.5% relative to the clear-sky case, but the annual optimum fixed tilt remained approximately 29°. These results show that high-resolution irradiance integration can convert latitude-based tilt guidance into a quantified, reproducible, location-specific design recommendation while preserving a clear distinction between irradiance optimization and full PV electrical-output prediction.
Keywords:
photovoltaic systems
; tilt optimization
; National Solar Radiation Database (NSRDB)
; solar geometry
; irradiance transposition
; PVWatts validation
; seasonal adjustment
1. Introduction
The global need to mitigate climate change and transition to sustainable energy has positioned photovoltaic (PV) technology as a central component of the renewable energy sector. PV systems offer a scalable, clean, and increasingly cost-effective method of power generation. However, realizing their full potential requires careful optimization of energy yield, which is strongly influenced by the geometric relationship between the PV module surface and the sun’s position.
Fixed-tilt PV systems remain widely deployed because of their simplicity, reduced maintenance requirements, and lower capital cost relative to tracking systems. For fixed installations, module orientation is the primary controllable geometric parameter influencing annual irradiance capture and energy yield.
Solar energy capture is governed largely by panel tilt angle, or inclination. An incorrectly oriented panel can reduce annual energy production. Although common heuristics recommend setting the tilt angle approximately equal to the installation latitude, this simplified approach does not account for seasonal solar-path variation, atmospheric conditions, or local climate patterns. Earlier studies are mathematically rigorous, but many rely on idealized geometric models or lower-resolution data that can limit practical application, data processing, and tool development.
Although simplified heuristics (e.g., β ≈ φ) are commonly used, these rules do not explicitly incorporate hourly irradiance variability, diffuse-fraction redistribution, or cloud-driven atmospheric effects. With the increasing availability of high-resolution irradiance datasets such as the National Solar Radiation Database (NSRDB) [1,2], it is now feasible to perform geometry-resolved optimization at hourly time resolution. Rather than modeling every local environmental parameter independently, the approach introduced here uses NSRDB data to support data-driven optimization without requiring complex tracking algorithms. This provides a reproducible pathway for stakeholders to select efficient fixed or seasonally adjusted tilt strategies that can improve solar generation while maintaining practical system simplicity.
This study addresses three questions: (1) how stable is the annual fixed optimum tilt across multiple years of high-resolution irradiance data; (2) how much additional POA irradiation is gained by annual, biannual, and monthly adjustment relative to flat and latitude-based mounting; and (3) whether cloudy-sky conditions shift the annual optimum tilt or primarily reduce irradiance magnitude.
The remainder of this paper is organized to move from established solar-geometry theory to a reproducible irradiance-based optimization workflow. Section 2 reviews prior work on solar geometry, tilted-surface irradiance transposition, seasonal tilt optimization, and validation needs. Section 3 and Section 4 present the FT-PVOT mathematical framework and NSRDB-based implementation. Section 5 and Section 6 describe the input data, preprocessing assumptions, and optimization procedure. Section 7 validates the tilt-selection behavior against PVWatts. Section 8 presents the Gainesville case study, and Section 9 discusses implications, limitations, and interpretation. Section 10 concludes the paper, and Section 11 identifies future research directions, including expansion to a multi-city climate-adjusted tilt and irradiance ranking framework.
2. Background and Related Work
2.1. Solar Geometry and Irradiance Transposition Models
Photovoltaic tilt optimization is fundamentally governed by solar geometry and the transposition of measured irradiance components onto inclined planes. The geometric basis for solar declination, hour angle, zenith angle, and incidence angle calculations is well established in classical solar engineering literature [2]. For fixed and adjustable PV surfaces, the central modeling requirement is the conversion of horizontal irradiance measurements into plane-of-array (POA) irradiance, which requires treatment of direct, diffuse, and ground-reflected components.
The earliest widely used diffuse transposition formulation is the isotropic sky model proposed by Liu and Jordan [3] which assumes uniform diffuse sky radiance. Although simplified, isotropic transposition remains common in comparative optimization studies because it is computationally efficient and yields stable relative comparisons when consistently applied. More advanced anisotropic diffuse models such as Klucher [4], Hay and Davies [5], and Perez [6] incorporate circumsolar and horizon brightening corrections and generally improve absolute irradiance estimation, particularly under partly cloudy conditions. Nevertheless, for optimization problems emphasizing relative Differences among tilt strategies rather than bankable absolute yield prediction, the isotropic formulation remains defensible as a baseline transposition approach.
A review of 240 journal articles and models by Hafez et al. [7] summarized existing approaches and their reported accuracies. One important distinction raised in that review is that optimizing PV tilt for maximum irradiation is not identical to optimizing tilt for maximum electrical power output. Irradiance-based optimization focuses on the solar energy incident on the module surface, whereas power-output optimization also depends on temperature, wind speed, ground reflectance, mounting configuration, and electrical conversion losses. For example, a flat panel near the equator may collect high irradiance at midday, but a slightly tilted, better-ventilated panel may produce more electricity if lower module temperature improves conversion efficiency.
The review also indicated that relatively few studies explicitly used day-of-year solar geometry, or the effective Earth-sun tilt relationship, as a direct input for optimal panel-tilt calculation.
Tiris and Tiris [8] derived an optimal collector slope based on latitude and day of year. Rather than relying only on a simple Earth-tilt approximation, their approach used a more complex relationship between daily and monthly irradiation to estimate the optimal tilt angle. This supports the premise that combining local latitude, seasonal solar geometry, and historical irradiance data can improve practical tilt-angle selection.
2.2. Annual and Seasonal PV Tilt Optimization Literature
A large body of research has examined annual and seasonal PV tilt optimization using empirical heuristics or deterministic POA irradiance modeling [5,9,10]. Many studies report that annual optimal tilt is near the local latitude, while seasonal adjustment improves yield but exhibits diminishing marginal returns as adjustment frequency increases. For instance, Despotovic and Nedic [11] compared annual, seasonal, and monthly tilt optimization and found that increasing the number of adjustments beyond seasonal intervals yields limited incremental energy gains. Similar findings have been reported for case studies in Tunisia [12], Baghdad [13,14], and Ethiopia [15], demonstrating that climate conditions affect total yield magnitude but do not necessarily justify high-frequency reorientation. Hussain et al. [16] also showed that increased panel temperature inversely affects panel performance; however, high seasonal irradiance can partially offset this efficiency loss, limiting its effect on the optimal tilt angle.
Moghadam et al. [10] challenged the assumption, used by Njoku [17] and others, that solar irradiance can be treated as constant throughout the day under an isotropic approximation. Moghadam et al. reported that this assumption can introduce an error of up to 5% in optimal panel inclination. Accordingly, the present study uses actual hourly irradiance data to reduce this source of error. Empirical models based on local datasets and machine-learning methods show promise, but they are often limited to local or regional applications [18]. The proposed model also uses empirical local data, but it draws from the broader NREL database, which covers locations across the continental United States. This allows the workflow to retain the advantages of empirical modeling without limiting the method to a single region.
More recent contributions have extended these findings by analyzing multi-reorientation strategies. Prunier et al. [19] evaluated optimal PV tilt angles for short periods and multiple reorientations, confirming that while additional adjustments can increase energy capture, the marginal benefit decreases rapidly beyond a limited number of changes per year. At a broader scale, Chen et al. [20] proposed a general method for determining recommended tilt and azimuth angles worldwide, emphasizing the importance of diffuse fraction and atmospheric conditions in optimal orientation selection. Similarly, Chinchilla et al. [23] developed a worldwide annual optimum-tilt model based on hourly inclined-surface irradiance submodels. Together, these studies indicate that annual optimal tilt is strongly constrained by solar geometry, while seasonal and monthly optimization provide progressively smaller gains. In contrast, the method presented here uses historical local irradiance data to optimize the tilt angle itself. Therefore, the framework is not intended to replace detailed PV performance tools for predicting final electrical output; rather, it is designed to identify irradiance-maximizing inclination angles.
A final relevant study is the work by Psomopoulos and Ioannidis [21], who compared three production-assessment software programs (PVGIS, PVWatts, and RETScreen) against data from three PV test sites in Greece. The study found that these systems generally estimated production within approximately 5% of measured values. Because all three tools use historical irradiation data to estimate PV electrical output, their accuracy depends in part on the proximity and representativeness of the available irradiance data. These software tools estimate electric energy production and therefore identify tilt angles for power output, not strictly for maximum incident irradiance.
2.3. High-resolution Irradiance Datasets and Validation Needs
Despite the maturity of tilt-optimization literature, many studies rely on monthly averages, limited-year datasets, or regression-based rules rather than direct multi-year integration of high-resolution irradiance components. The National Solar Radiation Database (NSRDB) provides hourly irradiance products at high spatial and temporal resolution, including GHI, DNI, and DHI [1]. The availability of NSRDB enables site-specific, geometry-resolved integration of irradiance at hourly resolution, supporting reproducible optimization workflows that incorporate realistic atmospheric variability.
Additionally, standardized benchmarking tools such as PVWatts [22] are widely used for PV system yield estimation and serve as useful external validation references for modeling consistency. However, explicit validation of tilt-optimization frameworks against PVWatts or similar reference tools remains inconsistent in the literature, with the work of Psomopoulos and Ioannidis [21] serving as a notable exception.
2.4. Contribution of the Present Study
The present study contributes to the existing body of literature by presenting a high-resolution, irradiance-driven tilt-optimization workflow that integrates hourly NSRDB DNI, DHI, and GHI components with explicit solar geometry equations and POA irradiance transposition. Unlike global predictive models designed to generate generalized tilt correlations [20,23], this work performs a brute-force parametric optimization of tilt angle across the full 0°–90° range at 1° resolution, enabling direct quantification of annual and seasonal optimum tilts. The study also evaluates multiple tilt strategies, including fixed, biannual, and monthly adjustment schedules, to quantify the diminishing marginal returns of increased adjustment frequency. Finally, validation against PVWatts provides an external consistency benchmark and supports reproducibility of the proposed framework.
Together, the literature indicates that annual fixed-tilt recommendations are strongly constrained by latitude and solar geometry, while seasonal and monthly adjustments provide progressively smaller gains. However, many studies rely on simplified averages, regional rules, or predictive performance tools rather than direct integration of high-resolution local irradiance components. The present study addresses this gap by applying an explicit, data-driven, and reproducible tilt sweep to hourly NSRDB irradiance data and by separating incident-irradiance optimization from full PV electrical-output prediction.
3. Methodology: Solar Geometry and Plane-of-Array Irradiance Model
This section defines the solar-geometry and plane-of-array irradiance equations used by FT-PVOT. The objective is to calculate, for each candidate tilt angle, the cumulative irradiance incident on a south-facing PV plane over a selected evaluation period. The formulation is intentionally transparent: it uses standard solar declination, zenith-angle, incidence-angle, and isotropic diffuse transposition relationships so that the optimization result can be reproduced and audited.
The modeling framework follows classical solar-geometry and irradiance-transposition methods using hourly NSRDB irradiance components to compute plane-of-array irradiance for candidate photovoltaic panel tilt angles. The method is based on standard tilted-surface radiation formulations, including the isotropic diffuse model introduced by Liu and Jordan [3] and the hourly tilted-surface radiation model comparisons presented by Reindl et al. [24].
The purpose of the method is to identify the tilt angle that maximizes incident solar irradiance on the panel plane. The model does not estimate final electrical output from a photovoltaic system. Electrical output depends on additional factors, including module efficiency, cell temperature, inverter efficiency, wiring losses, soiling, shading, degradation, and system-loss assumptions.
This distinction is central to the present study: FT-PVOT optimizes incident plane-of-array irradiance, whereas tools such as PVWatts estimate electrical energy output after applying additional PV-system performance corrections.

Table 1.
Variables and symbols used in the FT-PVOT model.
| Symbol | Definition | Unit |
|---|---|---|
| n | Day of year, where n = 1 corresponds to January 1 | dimensionless |
| t | Time step index | dimensionless |
| ts | Local solar time | hours |
| φ | Site latitude | degrees |
| δ | Solar declination angle | degrees |
| ω | Solar hour angle | degrees |
| θz | Solar zenith angle | degrees |
| θi | Incidence angle between the incoming solar beam and the normal to the tilted PV surface | degrees |
| β | Panel tilt angle measured from the horizontal plane | degrees |
| β* | Optimal panel tilt angle that maximizes cumulative plane-of-array irradiation | degrees |
| GHI(t) | Global horizontal irradiance at time t | W/m2 |
| DNI(t) | Direct normal irradiance at time t | W/m2 |
| DHI(t) | Diffuse horizontal irradiance at time t | W/m2 |
| GT(β,t) | Total plane-of-array irradiance on a surface tilted at angle β at time t | W/m2 |
| Gb,T(β,t) | Direct-beam irradiance component on the tilted plane | W/m2 |
| Gd,T(β,t) | Sky-diffuse irradiance component on the tilted plane | W/m2 |
| Gr,T(β,t) | Ground-reflected irradiance component on the tilted plane | W/m2 |
| HT(β) | Cumulative plane-of-array irradiation for tilt angle β over the evaluation period | kWh/m2 |
| ρg | Ground-reflectance coefficient, also called albedo | dimensionless |
| Δt | Duration of each irradiance time step | hours |
| N | Total number of time steps in the evaluation period | dimensionless |
| cos(θi)+ | Nonnegative incidence-angle correction, defined as max [0, cos(θi)] | dimensionless |
3.1. Solar Declination, Solar Time, and Zenith Angle
For each time step, the day of year is denoted by n, where n = 1 corresponds to January 1. The solar declination angle, δ, is approximated as:
where δ is the solar declination angle in degrees and n is the day of year.
δ = 23.45° sin [360°(284 + n) / 365]
The solar hour angle, ω, represents the angular displacement of the sun from local solar noon and is calculated as:
where ts is the local solar time in hours. Negative values of ω occur before solar noon, and positive values occur after solar noon.
ω = 15°(ts − 12)
The solar zenith angle, θz, is calculated as:
where θz is the solar zenith angle, φ is the site latitude, δ is the solar declination angle, and ω is the solar hour angle.
cos(θz) = sin(φ)sin(δ) + cos(φ)cos(δ)cos(ω)
Only time steps with cos(θz) > 0 are considered for direct-beam irradiance. When the sun is below the horizon, the direct-beam contribution is set to zero.
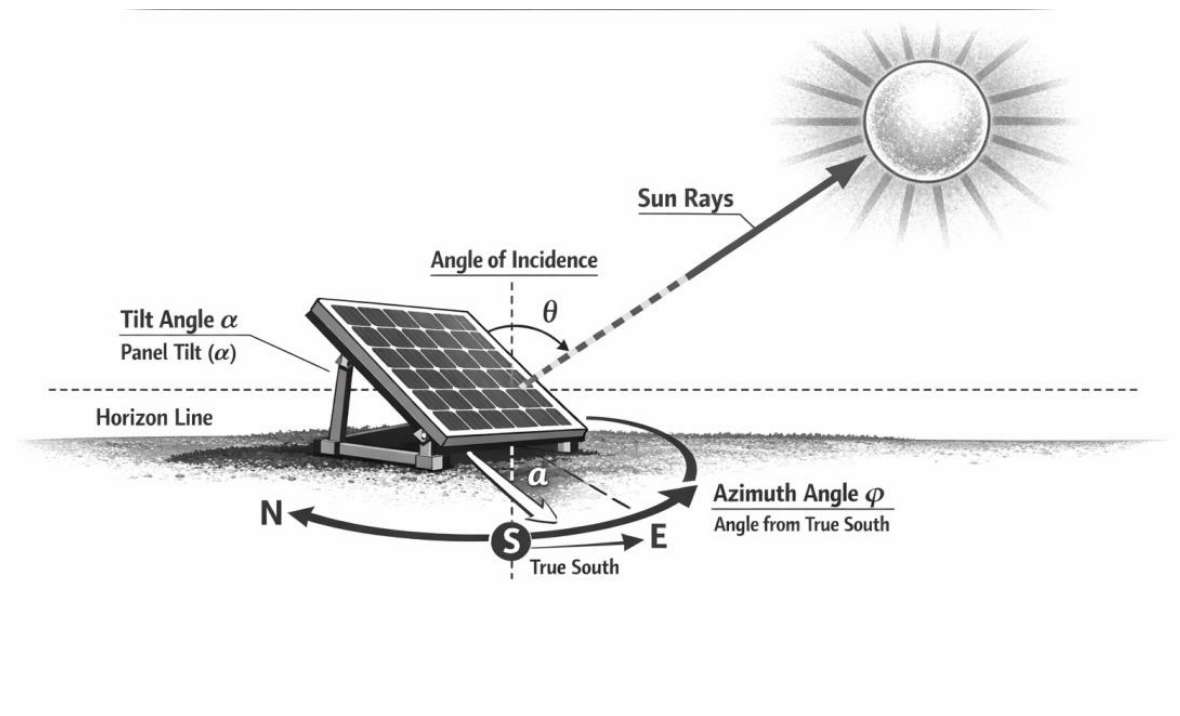
Figure 1.
Solar geometry and fixed-panel orientation schematic.
3.2. Incidence Angle on a Tilted Surface
The incidence angle, θi, is the angle between the incoming direct solar beam and the normal vector perpendicular to the PV module surface. For a fixed south-facing surface in the northern hemisphere, the surface azimuth is assumed to be zero, and the cosine of the incidence angle may be written as:
where θi is the incidence angle on the tilted surface, φ is the latitude, β is the panel tilt angle measured from the horizontal plane, δ is the solar declination angle, and ω is the solar hour angle.
cos(θi) = sin(δ)sin(φ − β) + cos(δ)cos(φ − β)cos(ω)
The candidate tilt angle β is evaluated over the feasible domain:
0° ≤ β ≤ 90°
A tilt of 0° represents a horizontal panel, while a tilt of 90° represents a vertical panel.
For numerical implementation, the direct-beam contribution is limited to nonnegative incidence values:
cos(θi)+ = max [0, cos(θi)]
This prevents physically unrealistic negative direct-beam irradiance when the sun is behind the panel plane.
3.3. Horizontal Irradiance Relationship
The NSRDB dataset provides global horizontal irradiance, direct normal irradiance, and diffuse horizontal irradiance. These quantities are related by:
where GHI(t) is global horizontal irradiance, DNI(t) is direct normal irradiance, DHI(t) is diffuse horizontal irradiance, and θz is the solar zenith angle at time t.
GHI(t) = DNI(t)cos(θz) + DHI(t)
This relationship is used as a consistency reference for the horizontal irradiance components. The optimization itself uses DNI, DHI, and GHI from NSRDB to compute irradiance incident on each candidate tilted surface.
3.4. Plane-of-Array Irradiance Using the Isotropic Diffuse Model
For each candidate panel tilt angle, total plane-of-array irradiance is computed as the sum of direct-beam, sky-diffuse, and ground-reflected components. Using the isotropic diffuse transposition model, the total irradiance incident on a tilted surface is:
where GT(β,t) is the total plane-of-array irradiance on a surface tilted at angle β at time t.
GT(β,t) = Gb,T(β,t) + Gd,T(β,t) + Gr,T(β,t)
The direct-beam component is:
Gb,T(β,t) = DNI(t)max [0, cos(θi)]
The sky-diffuse component is:
Gd,T(β,t) = DHI(t)[(1 + cosβ) / 2]
The ground-reflected component is:
Gr,T(β,t) = ρgGHI(t)[(1 − cosβ) / 2]
Thus, total plane-of-array irradiance is:
where ρg is the ground-reflectance coefficient, or albedo. Unless site-specific albedo data are available, a representative value such as ρg = 0.20 may be used for general ground conditions.
GT(β,t) = DNI(t)max [0, cos(θi)] + DHI(t)[(1 + cosβ) / 2] + ρgGHI(t)[(1 − cosβ) / 2]
This formulation captures the dominant geometric effects of panel tilt while maintaining computational transparency. More advanced anisotropic diffuse models may improve absolute POA estimates, particularly under partly cloudy conditions, but the isotropic formulation provides a defensible baseline for comparing relative Differences among tilt strategies, seasonal, and monthly time windows to evaluate alternative adjustment schedules.
3.5. Integrated Irradiation and Objective Function
For each candidate tilt angle, hourly plane-of-array irradiance values are integrated over the selected optimization window. The cumulative irradiation for a candidate tilt angle is calculated as:
where HT(β) is the cumulative plane-of-array irradiation for tilt angle β, GT(β,t) is the plane-of-array irradiance at time step t, Δt is the time-step duration in hours, and the summation is performed across all time steps in the evaluation period.
HT(β) = Σ GT(β,t)Δt
If irradiance is expressed in W/m2 and Δt is expressed in hours, cumulative irradiation may be converted to kWh/m2 as:
HT(β) = (1 / 1000) Σ GT(β,t)Δt
The optimal tilt angle is obtained by brute-force parametric search:
where β* is the tilt angle that maximizes cumulative incident irradiation over the selected time window.
β* = arg max HT(β), for 0° ≤ β ≤ 90°
The same optimization procedure is repeated for annual, biannual, seasonal, and monthly evaluation windows. In each case, the selected tilt angle is the one that maximizes cumulative incident plane-of-array irradiation, not final AC electrical energy output.
4. Proposed FT-PVOT Inclination Method Using NSRDB Data
The proposed FT-PVOT workflow applies the solar-geometry and plane-of-array irradiance equations described in Section 3 to high-resolution NSRDB irradiance data. Rather than relying on annual or monthly average irradiance values, the method evaluates the irradiance incident on a tilted PV surface at each hourly or sub-hourly time step.
For each location and time step, NSRDB provides direct normal irradiance, diffuse horizontal irradiance, and global horizontal irradiance. These measured or modeled irradiance components already embed much of the local atmospheric variability, including cloud cover, aerosol effects, water vapor, and seasonal irradiance variation. The role of the FT-PVOT model is therefore not to recreate atmospheric conditions independently, but to transpose the available horizontal and direct-normal irradiance components onto candidate tilted surfaces.
The computational workflow proceeds as follows. First, the solar declination, hour angle, zenith angle, and tilted-surface incidence angle are calculated for each time step. Second, plane-of-array irradiance is computed for each candidate tilt angle using the direct-beam, sky-diffuse, and ground-reflected irradiance components. Third, the resulting plane-of-array irradiance values are integrated over the selected evaluation window. Finally, the candidate tilt angle with the highest cumulative irradiation is selected as the optimum tilt for that period.
Because the model uses hourly or sub-hourly irradiance data, no separate weighting factor is required to emphasize midday solar conditions. Higher irradiance periods, such as late morning and early afternoon, naturally contribute more strongly to the cumulative irradiation total through the time-series integration.
The method was implemented as a brute-force search over candidate tilt angles from 0° to 90° at 1° increments. This approach was selected because it is transparent, reproducible, computationally efficient, and avoids the need for nonlinear optimization routines. The same procedure can be applied to annual, biannual, seasonal, or monthly adjustment schedules.
The resulting workflow is therefore best understood as a first-stage tilt-screening method. It does not replace full PV production simulators, but it provides a defensible irradiance-maximizing angle that can be used as an input to PVWatts, SAM, PVsyst, or future storage and economic analyses.
5. Data Sources and Preprocessing
Hourly irradiance and meteorological data were obtained from the National Solar Radiation Database (NSRDB) provided by NREL. The dataset includes Global Horizontal Irradiance (GHI), Direct Normal Irradiance (DNI), and Diffuse Horizontal Irradiance (DHI), along with supporting meteorological variables.[1]
The mathematical model was evaluated using both clear-sky and cloudy-sky irradiance datasets. The clear-sky dataset was used to verify the geometric behavior of the tilt-optimization routine under idealized irradiance conditions. The cloudy-sky dataset was then used to evaluate sensitivity to realistic atmospheric attenuation. The purpose of this comparison was to determine whether cloudiness changes the annual optimum fixed tilt angle or primarily reduces total irradiance magnitude.
In the FT-PVOT framework, cloudiness was expected to reduce annual irradiance totals without materially changing the annual optimum fixed tilt angle. This expectation was tested directly by comparing clear-sky and cloudy-sky simulations. Because the annual optimum angle is controlled primarily by latitude, solar declination, and the annual distribution of incidence geometry, the simulations were expected to produce similar annual optimum tilt values even when the total irradiance magnitude changed.
The dataset was selected for Gainesville, Florida, to minimize error associated with distance between the irradiance data source and the modeled test location. Gainesville also represents a hot, humid, partly cloudy environment in a university setting, making it a useful case study for later comparison with measured PV performance data from the University of Florida region.
The original model was not accurate for latitudes below 24 degrees because some tilt-angle calculations became negative and the program could not adapt to those values. Subsequent refinements used absolute angle values, allowing the model to compute panel tilt angles for a broader range of locations. However, accuracy may decrease as the modeled site becomes farther from the historical data source location.
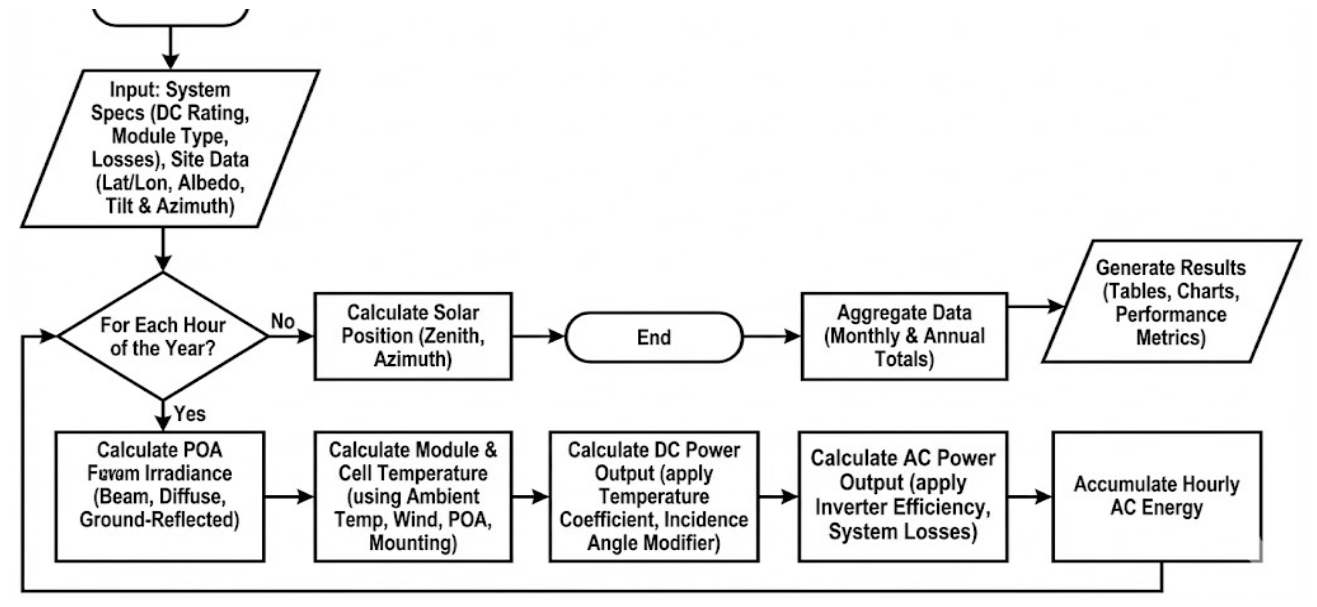
- PVWatts is an online calculator that estimates the electrical energy output of a PV system using standard module, inverter, and system-loss assumptions. It does not directly optimize panel tilt for a given system; rather, it reports estimated annual electrical energy for user-specified tilt and azimuth inputs. PVWatts calculations include the following steps [22]:
- ∙ Calculate the hourly plane-of-array (POA) solar irradiance from the horizontal irradiance, latitude, longitude, and time in the solar resource data, and from the array type, tilt and azimuth inputs.
- ∙ Calculate the effective POA irradiance to account for reflective losses from the module cover depending on the solar incidence angle.
- ∙ Calculate the cell temperature based on the array type, POA irradiance, wind speed, and ambient temperature. The cell temperature model assumes a module height of 5 meters above the ground and an installed nominal operating cell temperature (INOCT) of 49 °C for the fixed roof mount option (appropriate for approximately 4-inch standoffs), and of 45 °C for the other array type options.
- ∙ Calculate the array’s DC output from DC system size at a reference POA irradiance of 1,000 W/m2, and the calculated cell temperature, assuming a reference cell temperature of 25 °C, and temperature coefficient of power of -0.47%/°C for the standard module type, -0.35%/°C for the premium type, or -0.20%/°C for the thin film type.
- ∙ Calculate the system’s AC output from the calculated DC output and system losses and nominal inverter efficiency input (96% by default) with a part-load inverter efficiency adjustment derived from empirical measurements of inverter performance.
Through repeated simulations across candidate tilt angles, PVWatts can be used to infer best-performing tilt configurations. However, PVWatts reports electrical energy output, not incident irradiance on the module surface. Therefore, in this study PVWatts was used only as a validation benchmark for best-performing tilt trends; PVWatts energy estimates were not treated as the primary study outcome.
This data structure allows FT-PVOT to evaluate the geometric effect of tilt while preserving the observed or modeled atmospheric variability already embedded in the NSRDB irradiance components. As a result, high-irradiance periods naturally receive greater weight during integration, and no separate midday weighting factor is required.
6. Optimization Framework
The FT-PVOT optimization procedure evaluates candidate tilt angles using a brute-force search over the feasible domain. For each candidate tilt, plane-of-array irradiance is computed for all time steps and integrated to obtain cumulative irradiance. The tilt corresponding to the maximum cumulative irradiance is selected as optimal.
Tilt optimization was performed using brute-force parametric search over β ∈ [0°,90°] at 1° increments. Six tilt strategies were evaluated: flat mounting, fixed latitude tilt, biannual heuristic tilt (latitude ± 11.7°), annual optimized tilt, biannual optimized tilt, and monthly optimized tilt.
Because the model uses 15-minute or hourly time steps, no additional value-weighting system was required to account for the higher irradiance typically observed between approximately 10:00 a.m. and 2:00 p.m. The FT-PVOT workflow captures this temporal variability directly through the irradiance time series.
The same brute-force procedure was applied to each adjustment schedule, ensuring that Differences among strategies reflect the time window over which irradiance is accumulated rather than Differences in optimization method. This makes the strategy comparison directly interpretable.
7. Validation
Validation was performed by benchmarking selected model configurations against PVWatts reference outputs. PVWatts was selected because it is a widely used NREL-based photovoltaic performance calculator and provides an external reference for evaluating whether the proposed tilt-selection workflow produces reasonable and reproducible results.
Prior validation studies have examined the ability of PVWatts to estimate PV irradiance and optimize solar-panel inclination. For example, Psomopoulos and Ioannidis [21] compared measured production from three PV systems in Greece with outputs from PVGIS, PVWatts, and RETScreen. PVWatts showed a reasonable annual energy deviation relative to measured PV output, although the authors noted that the lack of local irradiance data in Greece likely contributed to the deviation. This prior work supports the use of PVWatts as a design-relevant benchmark, particularly when the comparison is framed as model-consistency validation rather than direct proof of absolute electrical-output accuracy.
Accordingly, PVWatts was used in this study as an external consistency benchmark for tilt-angle trends. Agreement between the FT-PVOT irradiance-based optimum and the PVWatts energy-based optimum supports confidence in the solar-geometry formulation, irradiance integration procedure, and brute-force tilt sweep. Differences between the two methods, especially at monthly resolution, are interpreted as expected second-order effects rather than as model failure.
Simulation runs were performed in PVWatts and compared with the FT-PVOT results. Figure 2 summarizes the basic logic flow used to accumulate the comparison results.
Figure 2.
PVWatts validation workflow.
The first validation comparison evaluated annual fixed-tilt optimization. The optimum annual tilt was calculated using FT-PVOT with clear-sky data, then compared with the tilt producing the highest annual output in PVWatts.
Figure 3.
Annual optimum fixed tilt: FT-PVOT versus PVWatts.
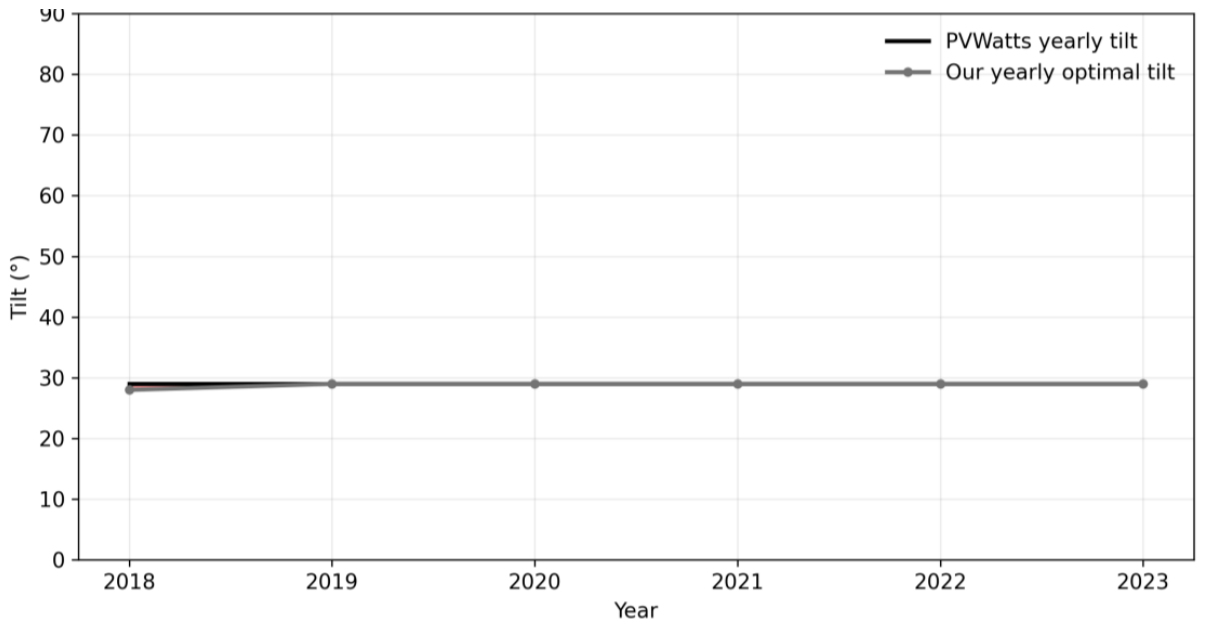
The annual fixed-tilt comparison showed strong agreement. Both methods identified an annual optimum within approximately one degree of each other. This result is important because annual fixed-tilt selection is the primary use case for the proposed framework. It indicates that the simplified irradiance-integration method captures the dominant geometric relationship between latitude, solar declination, and fixed-panel inclination.
The simulation was then repeated using the cloudy-sky dataset in FT-PVOT.
Figure 4.
Cloudy-sky annual fixed-tilt validation: FT-PVOT versus PVWatts.
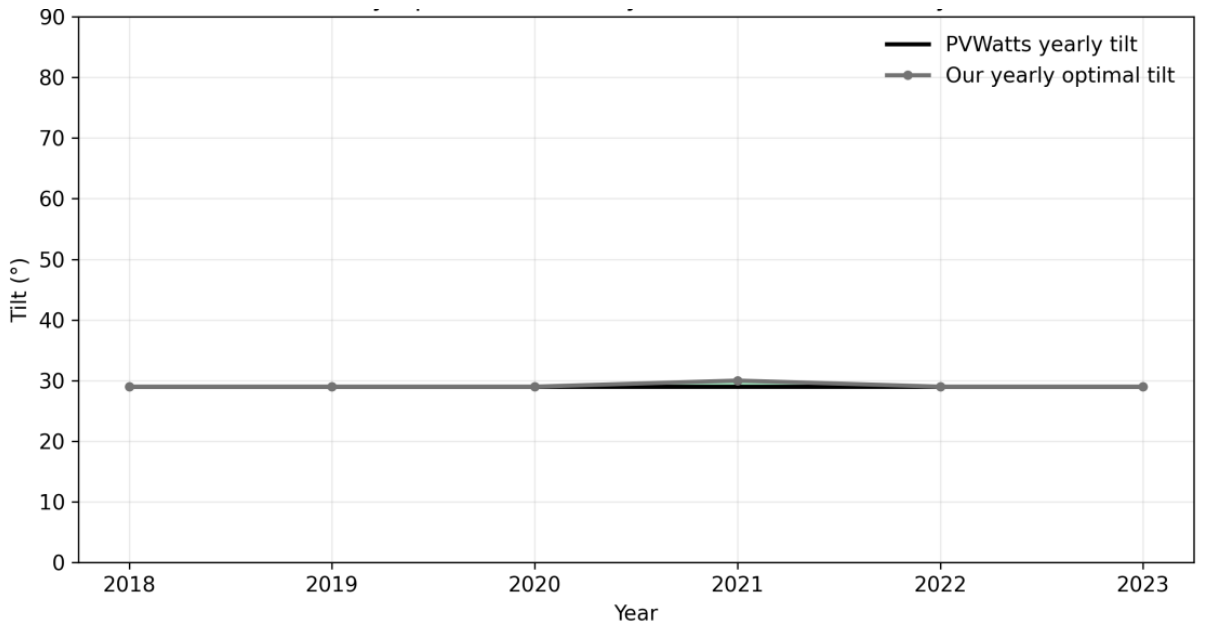
Table 2.
Annual fixed-tilt validation against PVWatts, clear-sky and cloudy-sky datasets.
| Mode | Year | FT-PVOT (deg) | PVWatts (deg) | Difference |
|---|---|---|---|---|
| clear | 2018 | 28 | 29 | 1 |
| clear | 2019 | 29 | 29 | 0 |
| clear | 2020 | 29 | 29 | 0 |
| clear | 2021 | 29 | 29 | 0 |
| clear | 2022 | 29 | 29 | 0 |
| clear | 2023 | 29 | 29 | 0 |
| cloudy | 2018 | 29 | 29 | 0 |
| cloudy | 2019 | 29 | 29 | 0 |
| cloudy | 2020 | 29 | 29 | 0 |
| cloudy | 2021 | 30 | 29 | 1 |
| cloudy | 2022 | 29 | 29 | 0 |
| cloudy | 2023 | 29 | 29 | 0 |
The cloudy-sky comparison confirmed that the optimal annual tilt remains stable even when total irradiance magnitude changes. Cloud conditions reduced the calculated irradiance total, but they did not materially alter the annual fixed-tilt optimum. This supports the interpretation that annual fixed-tilt selection is governed primarily by solar geometry, while atmospheric conditions mainly affect the magnitude of energy incident on the module plane.
The validation was then extended to monthly tilt optimization.
Figure 5.
Monthly optimum tilt comparison: clear-sky FT-PVOT versus PVWatts.
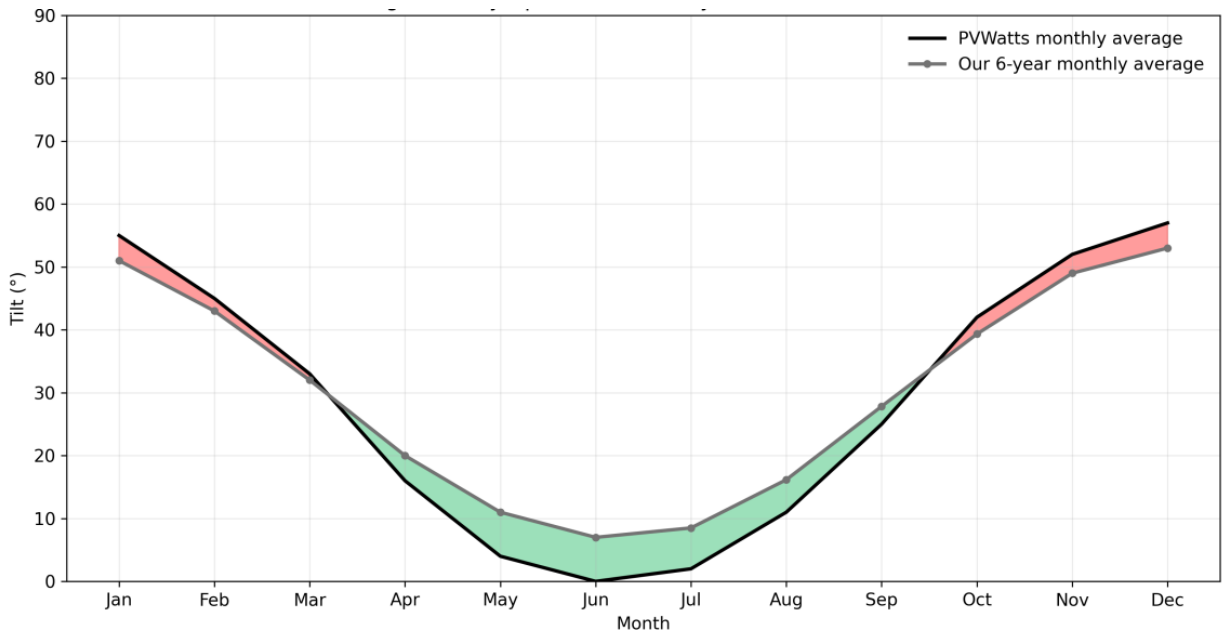
The monthly comparison showed larger Differences between FT-PVOT and PVWatts. During colder months, PVWatts produced optimal tilt angles up to approximately 5 degrees higher than the FT-PVOT result. During summer months, PVWatts produced optimal tilt angles up to approximately 8 degrees lower. This pattern is consistent with the fact that PVWatts applies additional hourly performance corrections, including incidence-angle effects, diffuse and reflected irradiance treatment, temperature effects, and system-loss assumptions.
Figure 6.
Monthly optimum tilt comparison: cloudy-sky FT-PVOT versus PVWatts.
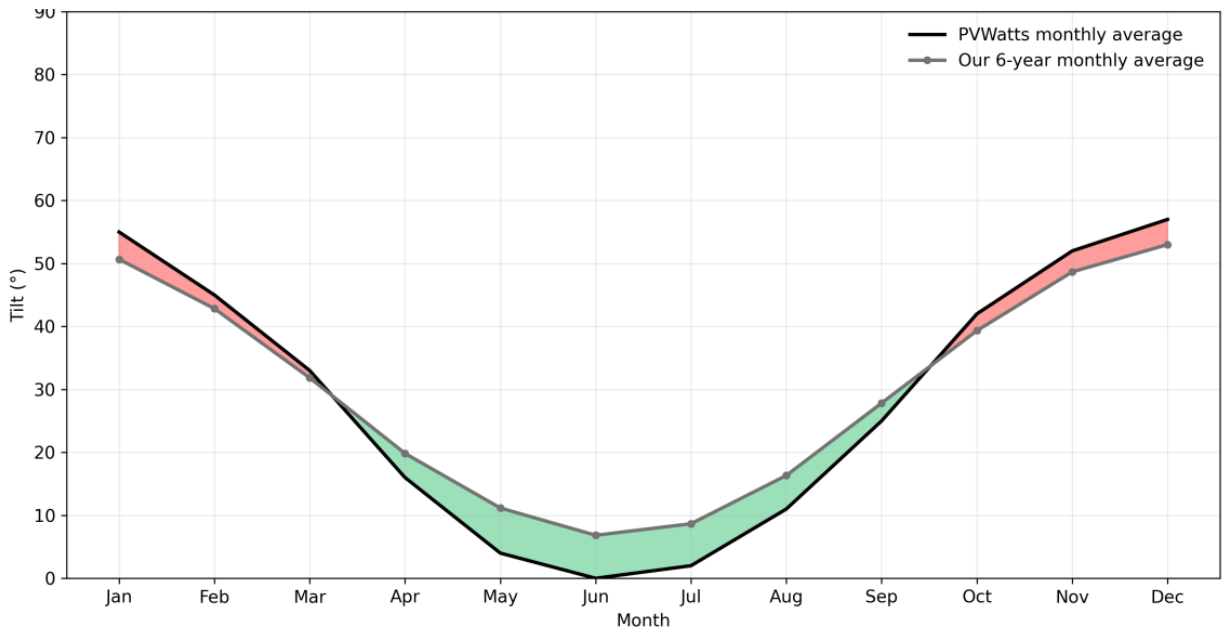
The cloudy-sky comparison confirmed that atmospheric attenuation reduces total irradiance magnitude without materially changing the annual fixed optimum tilt identified by FT-PVOT. This result is consistent with the model structure: the optimum fixed annual tilt is controlled primarily by solar geometry, while cloudiness changes the amount of irradiance available at each time step.
At monthly resolution, Differences between FT-PVOT and PVWatts should be interpreted differently. PVWatts includes additional PV-system performance corrections, including incidence-angle modifier effects, temperature effects, inverter assumptions, and system losses. Therefore, monthly Differences between FT-PVOT and PVWatts do not imply that cloudy-sky data should substantially change the FT-PVOT optimum angle. Rather, they show that monthly electrical-output optimization is more sensitive to second-order performance effects than annual irradiance-based fixed-tilt optimization.
The validation results support the use of FT-PVOT for annual fixed-tilt selection and early-stage seasonal screening. Agreement with PVWatts at the annual fixed-tilt scale indicates that FT-PVOT captures the dominant geometry of the problem. Larger Differences at monthly resolution are expected because PVWatts estimates electrical energy after applying additional performance corrections, whereas FT-PVOT optimizes incident irradiance only.
8. Results: Case Study of Gainesville, Florida
Gainesville, Florida (29.65° N) was selected as the primary case study location because it combines a moderate subtropical latitude with a humid, partly cloudy solar-resource environment. This makes it a useful test case for evaluating whether high-resolution irradiance data materially alter fixed and seasonal tilt recommendations relative to common latitude-based rules. The FT-PVOT model was applied to NSRDB irradiance data using the solar-geometry and plane-of-array transposition framework described in Section 3 and Section 4. Candidate tilt angles from 0° to 90° were evaluated at 1° increments, and the angle producing the highest cumulative plane-of-array irradiation was selected for each optimization window.
The results are organized around the three questions introduced earlier in the paper. First, how stable is the annual fixed optimum tilt across multiple years of irradiance data? Second, how much additional irradiance is gained by moving from flat mounting to latitude tilt, annual optimization, biannual adjustment, and monthly adjustment? Third, does cloudy-sky irradiance data change the annual optimum tilt angle, or does it primarily reduce the magnitude of available irradiance? These questions structure the following subsections and provide the basis for interpreting the Gainesville case study.
8.1. Gainesville case Study Parameters
Table 3 summarizes the baseline modeling assumptions used for the Gainesville case study. The optimization target is cumulative plane-of-array irradiation rather than final AC electrical output. The results therefore represent irradiance-maximizing tilt recommendations, not complete PV production forecasts. This boundary is intentional: FT-PVOT is designed to isolate the geometric and irradiance effects of tilt selection, whereas tools such as PVWatts also incorporate module temperature, inverter efficiency, incidence-angle modifiers, and system-loss assumptions.
Table 3.
Gainesville case study parameters and modeling assumptions.
| Parameter | Value |
|---|---|
| Location | Gainesville, Florida |
| Latitude | 29.65° N |
| Dataset period | 2018-2023 |
| Data source | NSRDB |
| Irradiance inputs | GHI, DNI, DHI |
| Tilt search range | 0° to 90° |
| Tilt increment | 1 degree |
| Primary optimization target | Cumulative POA irradiation |
| Electrical-output modeling | Not included in FT-PVOT result |
8.2. Annual Fixed-Tilt Optimization
The annual fixed-tilt analysis shows that the Gainesville optimum is highly stable across the 2018-2023 dataset. The FT-PVOT annual optimum ranged from 28° to 29°, with a mean of approximately 28.8° and a standard deviation of approximately 0.41°. PVWatts produced an optimum of 29° for the same annual fixed-tilt comparison, yielding an average Difference of approximately 0.17°. This narrow range indicates that normal interannual variation in irradiance magnitude has little design-relevant effect on the annual fixed optimum tilt angle.
Figure 7.
Annual fixed optimum tilt for Gainesville, 2018-2023.
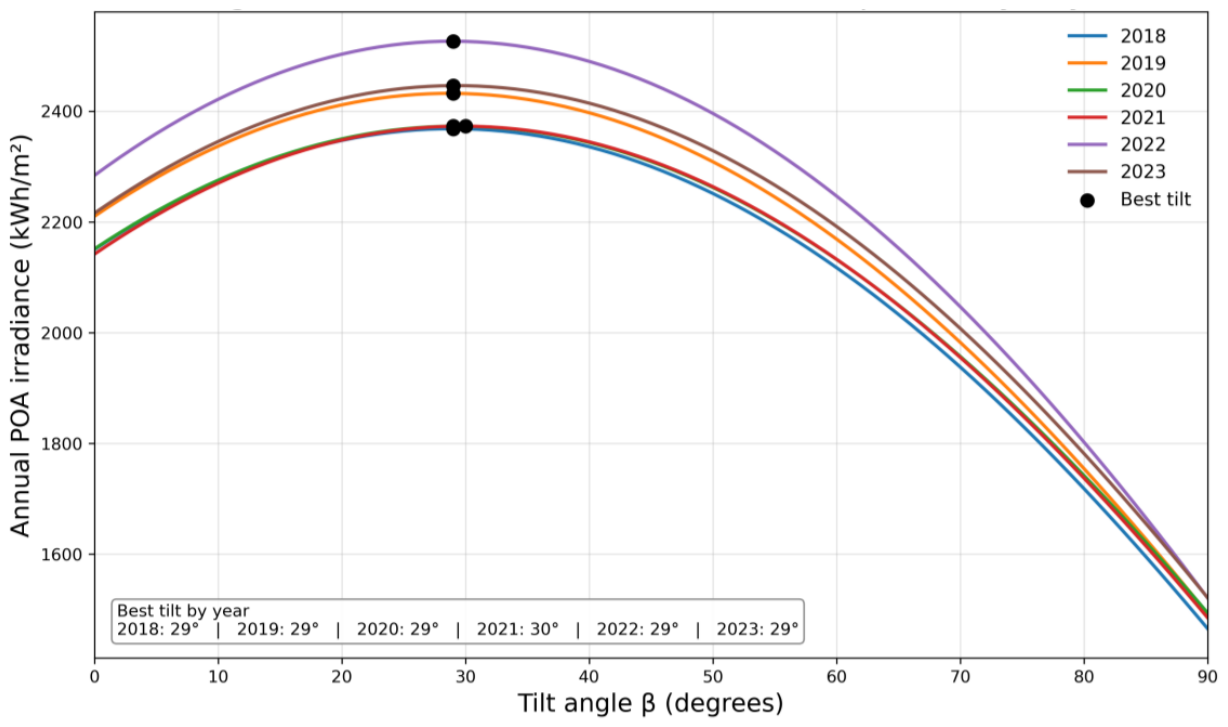
This result supports the first major finding of the case study: for fixed annual systems, the optimum tilt is controlled primarily by latitude and annual solar geometry. Although the total annual irradiance changes from year to year, the best fixed inclination remains essentially unchanged. For implementation-relevant PV design, this means that a single annual fixed-tilt recommendation near local latitude is robust for Gainesville under normal year-to-year irradiance variability.
Table 4.
Annual fixed-tilt stability for Gainesville, 2018-2023.
| Mode | Year | FT-PVOT optimum tilt (degrees) | PVWatts optimum tilt (degrees) | Difference (degrees) |
|---|---|---|---|---|
| Clear sky | 2018 | 28 | 29 | 1 |
| Clear sky | 2019 | 29 | 29 | 0 |
| Clear sky | 2020 | 29 | 29 | 0 |
| Clear sky | 2021 | 29 | 29 | 0 |
| Clear sky | 2022 | 29 | 29 | 0 |
| Clear sky | 2023 | 29 | 29 | 0 |
| Summary | 2018-2023 | Mean = 28.8; SD ≈ 0.41 | 29 | Mean Difference ≈ 0.17 |
8.3. Comparison of Tilt Strategies
The tilt-strategy comparison provides the main practical result of the Gainesville case study. Flat mounting produced the lowest annual POA irradiation. Setting the panel near the local latitude increased annual irradiation by approximately 9.2% relative to flat mounting, while annual optimization increased the gain only slightly to approximately 9.6%. This small Difference indicates that the latitude heuristic is already close to the calculated annual optimum for Gainesville.
Figure 8.
Annual POA irradiation and improvement by tilt strategy for Gainesville.
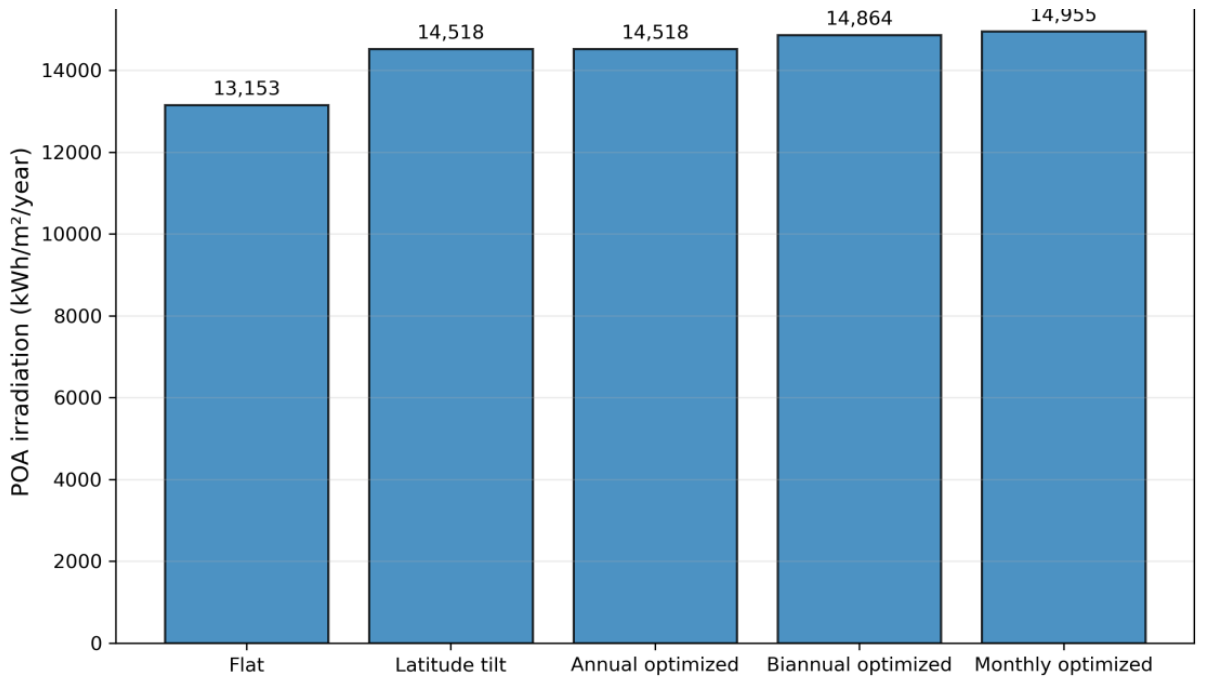
Biannual adjustment produced a larger improvement, increasing annual POA irradiation by approximately 13.5% relative to flat mounting. Monthly adjustment produced the highest total irradiation, at approximately 15.1% above flat mounting, but the incremental gain over biannual adjustment was only about 1.6 percentage points, or approximately 27 kWh/m2/year. This pattern demonstrates diminishing marginal returns: most of the available improvement is captured by fixed or low-frequency seasonal adjustment, while monthly adjustment adds operational complexity for a comparatively small additional gain.
For practical design, this result suggests that monthly adjustment is mathematically beneficial but may not be operationally justified for many fixed or manually adjusted systems. Biannual adjustment offers a more attractive balance between performance gain and complexity, while latitude-based fixed tilt remains a strong low-complexity option because it captures nearly all of the annual optimized fixed-tilt benefit.
Table 5.
Annual POA irradiation and improvement by tilt strategy for Gainesville.
| Tilt strategy | Annual POA irradiation (kWh/m2/year) | Improvement relative to flat mounting |
|---|---|---|
| Flat mounting (0°) | 1733 | Baseline |
| Latitude tilt (~28 degrees) | 1893 | +9.2% |
| Annual optimized | 1899 | +9.6% |
| Biannual optimized | 1967 | +13.5% |
| Monthly optimized | 1994 | +15.1% |
| Monthly minus biannual | +27 kWh/m2/year | +1.6 percentage points |
8.4. Clear-Sky and Cloudy-Sky Sensitivity
The clear-sky/cloudy-sky comparison tested whether atmospheric attenuation changes the annual optimum fixed tilt angle or primarily reduces the magnitude of available irradiance. The results support the second interpretation. Both clear-sky and cloudy-sky simulations produced an annual optimum tilt of approximately 29°, while the cloudy-sky annual POA irradiation was approximately 35.5% lower than the clear-sky value.
Figure 9.
Clear-sky versus cloudy-sky annual POA magnitude and optimum tilt.
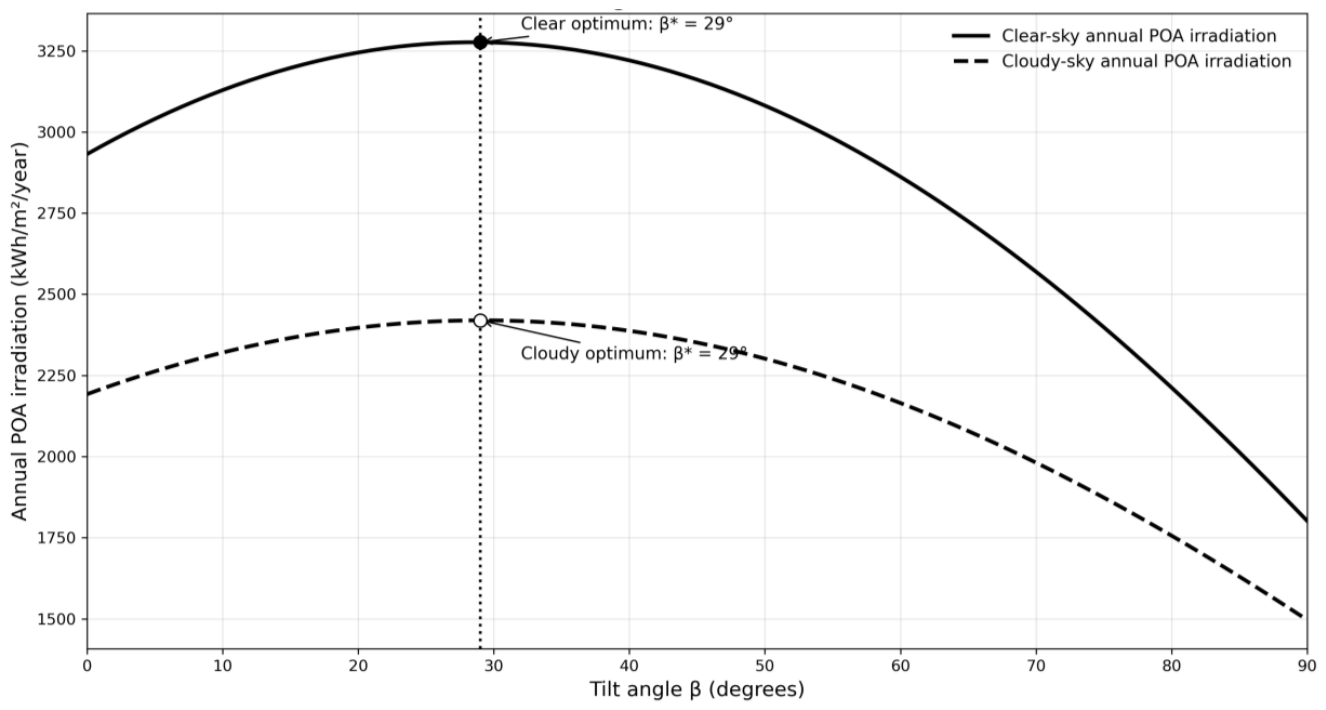
This finding clarifies the role of cloudiness in the FT-PVOT model. Cloudiness reduces the amount of solar energy available, but it does not materially change the annual fixed optimum tilt angle. The annual optimum remains governed primarily by latitude, solar declination, and the yearly distribution of solar incidence geometry. The cloudy-sky dataset changes the magnitude of the time-series irradiance values, but it does not shift the geometric condition that determines the best annual fixed inclination. Additional ±10% perturbation testing of DNI and DHI changed the annual optimum tilt by less than 1°, further supporting the stability of the fixed-tilt recommendation.
Table 6.
Clear-sky and cloudy-sky sensitivity for Gainesville.
| Dataset | Annual optimum tilt | Annual POA irradiation | Difference from clear sky |
|---|---|---|---|
| Clear sky | 29 degrees | 3,276.6 kWh/m2/year | Baseline |
| Cloudy sky | 29 degrees | 2,419.7 kWh/m2/year | -35.5% |
The Gainesville results answer the three case-study questions directly. First, the annual fixed optimum tilt remained highly stable across 2018-2023 and aligned closely with local latitude. Second, latitude-based fixed tilt captured most of the fixed-system gain relative to flat mounting, while biannual adjustment captured most of the additional gain available from reorientation. Third, cloudy-sky conditions substantially reduced annual POA irradiation but did not materially shift the annual fixed optimum tilt. These findings support FT-PVOT as a transparent early-stage screening framework for fixed and low-frequency seasonal PV tilt selection.
Table 7.
Summary metrics for validation and sensitivity comparisons.
| Metric | Reported Value |
|---|---|
| Annual optimum tilt Difference | 0.17° |
| Monthly mean absolute error (MAE) | 4.10–4.19° |
| Monthly bias | +1.25 to +1.32° |
| Monthly RMSE | 4.52–4.61° |
| Clear-sky vs. cloudy-sky annual optimum tilt shift | 0.33° |
| Clear-sky vs. cloudy-sky irradiance change | 35.48% |
9. Discussion
The Gainesville case study shows that high-resolution irradiance integration strengthens, rather than overturns, the practical value of latitude-based fixed-tilt guidance. The FT-PVOT results quantify why this heuristic works: annual fixed tilt is dominated by site latitude and the yearly distribution of solar incidence geometry. However, the model also clarifies where additional value exists. A biannual adjustment captures a meaningful share of the remaining irradiance gain, while monthly adjustment produces only a small incremental benefit beyond the biannual case.
The clear-sky and cloudy-sky results strengthen this interpretation. Atmospheric attenuation reduced the total POA irradiation available to the system, but it did not materially alter the annual fixed-tilt recommendation. This distinction is important: atmospheric conditions affect the amount of solar energy available, while annual fixed-tilt geometry is governed primarily by latitude, declination, and the yearly distribution of solar incidence angles.
Limitations of this approach include the use of irradiance as a proxy for energy yield without explicit modeling of module temperature, inverter clipping, soiling, shading, mounting height, or other system losses. These factors can be incorporated in future extensions.
Future work should connect the irradiance-maximizing tilt angles identified here to economic and system-design outcomes. For example, the approximately 9% gain from latitude-based tilt and the additional gain from biannual adjustment should be compared with mounting-structure cost, roof-access constraints, maintenance requirements, and expected system lifetime. This step is especially relevant for residential and community-scale PV deployment, where modest design changes may improve performance without adding complex tracking hardware.
The principal limitation of the present framework is intentional: it optimizes incident POA irradiance, not final AC electrical output. Module temperature, inverter efficiency, soiling, shading, wiring losses, degradation, mounting height, and economic cost are outside the current optimization objective. This limitation should not be treated as a weakness of the model, but as a boundary condition. FT-PVOT identifies the geometric irradiance optimum; subsequent tools can then evaluate whether that optimum is economically and electrically preferable for a specific PV system.
10. Conclusions
This study developed and evaluated FT-PVOT, a transparent optimization framework for selecting fixed and seasonally adjusted PV panel tilt angles using high-resolution NSRDB irradiance data. The framework integrates direct normal irradiance, diffuse horizontal irradiance, global horizontal irradiance, solar-geometry equations, and plane-of-array irradiance transposition to identify the tilt angle that maximizes cumulative incident irradiation over user-defined time windows. The study’s central contribution is not a replacement for full PV production simulators, but a focused method for isolating the geometric irradiance-capture problem before detailed electrical-output modeling is performed.
Table 8.
Summary of key findings and conclusion significance.
| Finding | Quantitative result | Conclusion significance |
|---|---|---|
| Annual fixed optimum tilt is highly stable | FT-PVOT optimum range: 28°–29°; mean about 28.8 degrees; SD about 0.41 degrees across 2018-2023. | This is the strongest evidence that normal year-to-year irradiance variation does not meaningfully change the annual fixed-tilt recommendation for Gainesville. |
| Latitude heuristic is nearly optimal for fixed systems | Latitude tilt increased POA irradiation by about 9.2%; annual optimization increased it by about 9.6%. | The common latitude rule performs well for annual fixed tilt, but FT-PVOT quantifies and validates that result instead of assuming it. |
| Biannual adjustment captures most practical reorientation benefit | Biannual optimized tilt increased annual POA irradiation by about 13.5% relative to flat mounting. | A low-frequency adjustment strategy may offer a better performance/complexity balance than monthly adjustment. |
| Monthly adjustment has diminishing returns | Monthly optimization reached about 15.1% above flat mounting, but only 1.6 percentage points, or about 27 kWh/m2/year, above biannual adjustment. | This is the principal finding for practical design: monthly adjustment is mathematically best, but the incremental gain may not justify operational complexity. |
| Cloudiness changes magnitude, not annual fixed optimum | Clear-sky and cloudy-sky annual optimum tilt remain about 29 degrees; cloudy-sky POA is about 35.5% lower. | The tilt recommendation is geometrically stable even when atmospheric attenuation changes total available irradiance. |
| PVWatts comparison supports model consistency | PVWatts and FT-PVOT annual fixed-tilt recommendations differ by about 0.17 degrees on average. | This helps defend FT-PVOT as a valid early-stage tilt screening tool while acknowledging that PVWatts estimates electrical output. |
| Research value is reproducibility | The workflow uses public NSRDB data, explicit equations, and a brute-force 0°–90° tilt sweep at 1° resolution. | This makes the method useful for students, researchers, and practitioners who need transparent location-specific tilt guidance. |
For Gainesville, Florida, the annual fixed optimum tilt was highly stable across the 2018-2023 NSRDB dataset. FT-PVOT identified an optimum range of 28°-29°, with a mean of approximately 28.8° and a standard deviation of approximately 0.41°. PVWatts produced an annual fixed optimum of approximately 29°, yielding a mean difference of about 0.17°. This close agreement supports the conclusion that annual fixed-tilt selection is governed primarily by latitude and annual solar geometry rather than by normal year-to-year variation in irradiance magnitude.
The strategy comparison provides the main design insight. Latitude-based tilt increased annual POA irradiation by approximately 9.2% relative to flat mounting, while full annual optimization increased the gain only slightly to approximately 9.6%. Biannual adjustment increased annual POA irradiation by approximately 13.5%, and monthly optimization produced the highest total gain at approximately 15.1%. However, monthly adjustment added only about 1.6 percentage points, or approximately 27 kWh/m2/year, beyond the biannual strategy. This result identifies the practical diminishing-return threshold: monthly adjustment is mathematically optimal, but biannual adjustment captures most of the useful reorientation benefit with less operational complexity.
The clear-sky and cloudy-sky comparison further clarifies the role of atmospheric attenuation. Cloudy-sky conditions reduced annual POA irradiation by approximately 35.5% relative to the clear-sky case, but both datasets produced an annual fixed optimum of approximately 29°. Additional DNI and DHI perturbation testing changed the annual optimum tilt by less than 1°. These results indicate that cloudiness strongly affects the magnitude of available solar energy but does not materially shift the annual fixed-tilt recommendation for the Gainesville case study.
The findings reinforce a necessary distinction between irradiance optimization and electrical-output prediction. FT-PVOT optimizes incident plane-of-array irradiation only. Final PV electricity production depends on module efficiency, cell temperature, inverter behavior, soiling, shading, wiring losses, degradation, mounting height, and other site-specific assumptions. Therefore, the framework is best used as an early-stage screening tool that produces a reproducible tilt recommendation for subsequent evaluation in PVWatts, SAM, PVsyst, or project-specific techno-economic models.
Overall, the study converts a common rule of thumb into a quantified, auditable, location-specific design result. For Gainesville, annual fixed tilt should remain close to local latitude; biannual adjustment captures most of the additional value available from reorientation; and cloudy conditions reduce irradiance magnitude without changing the annual fixed optimum. Because FT-PVOT relies on public irradiance data, explicit equations, and a simple 0°-90° brute-force tilt sweep, the workflow can be replicated by students, researchers, and practitioners for other locations and future comparative studies.
11. Future Research
Future research should extend FT-PVOT from a single-site Gainesville case study to a multi-city national evaluation. The companion research direction is a climate-adjusted irradiance and fixed-tilt assessment across approximately 54 U.S. cities. That study would test whether the Gainesville findings generalize across arid, humid, coastal, high-altitude, northern, and subtropical environments and would identify where latitude-based tilt remains sufficient and where climate-sensitive adjustments provide measurable value.
The second-stage framework should combine annual optimum fixed tilt, total POA irradiation, seasonal adjustment benefit, and climate modifiers such as cloudiness, humidity, aerosol/dust loading, temperature, and altitude. The purpose would not be only to compute an optimal tilt angle for each city, but to produce a ranked PV suitability and irradiance-performance comparison. Such a framework would address the gap identified in the literature review: existing studies provide strong methods for irradiance mapping, tilted-surface modeling, and climate-effect analysis, but they do not appear to provide an integrated U.S. city-level ranking that combines fixed-tilt optimization with climate modifiers.
Additional technical extensions should compare the isotropic diffuse model used in the present study with anisotropic transposition models such as Hay-Davies, Klucher, Reindl, or Perez formulations. This comparison would determine whether more detailed diffuse-radiance treatment changes annual fixed tilt, seasonal tilt, or only the absolute POA magnitude. A multi-model comparison would be especially useful in humid and partly cloudy regions where diffuse fraction is higher.
A further research path is to connect irradiance-maximizing tilt recommendations to electrical-output, storage, and economic outcomes. FT-PVOT can provide the geometric input angle, while PVWatts, SAM, PVsyst, or project-specific models can evaluate module temperature, inverter losses, system cost, storage sizing, and payback. This would allow future studies to distinguish the mathematically optimal irradiance angle from the economically optimal PV-system design.
Finally, future work should produce an open dataset and reproducible code repository so that students, researchers, designers, and planners can replicate the workflow for additional locations. A public implementation would strengthen the educational value of the method and support broader use in residential, community-scale, and early-stage utility PV planning.
12. Data and Code Availability
The NSRDB input data are publicly available from NREL. The FT-PVOT code, processed Gainesville datasets, and figure-generation scripts will be deposited in a public repository upon publication.
References
- Sengupta, M.; Xie, Y.; Lopez, A.; Habte, A.; Maclaurin, G.; Shelby, J. The National Solar Radiation Database (NSRDB). Renew. Sustain. Energy Rev. 2018, 89, 51–60. [Google Scholar] [CrossRef]
- Duffie, J.A.; Beckman, W.A. Solar Engineering of Thermal Processes; Wiley: Hoboken, NJ, USA, 1982. [Google Scholar]
- Liu, B.Y.H.; Jordan, R.C. The interrelationship and characteristic distribution of direct, diffuse and total solar radiation. Sol. Energy 1960, 4(3), 1–19. [Google Scholar] [CrossRef]
- Klucher, T.M. Evaluation of models to predict insolation on tilted surfaces. Sol. Energy 1979, 23(2). [Google Scholar] [CrossRef]
- Davies, J.A.; Abdel-Wahab, M.; McKay, D.C. Estimating solar irradiation on horizontal surfaces. Int. J. Sol. Energy 1984, 2(5), 405–424. [Google Scholar] [CrossRef]
- Perez, R.; et al. Modeling daylight availability and irradiance components from direct and global irradiance. Sol. Energy 1990, 44, 271–289. [Google Scholar] [CrossRef]
- Hafez, A.Z.; Soliman, A.; El-Metwally, K.A.; Ismail, I.M. Tilt and azimuth angles in solar energy applications: A review. Renew. Sustain. Energy Rev. 2017, 77, 147–168. [Google Scholar] [CrossRef]
- Tiris, M.; Tiris, C. Optimum collector slope and model evaluation: Case study for Gebze, Turkey. Energy Convers. Manag. 1998, 39(3–4), 167–172. [Google Scholar] [CrossRef]
- Malicdem, E. Optimal tilt of solar panels in the Philippines. In Schadow1 Expeditions; 2015. [Google Scholar]
- Moghadam, H.; Nouri, J.; Samimi, M. Angle optimization of home solar panels for urban energy management. Int. J. Hum. Cap. Urban Manag. 2024. [Google Scholar] [CrossRef]
- Despotovic, M.; Nedic, V. Comparison of optimum tilt angles of solar collectors determined at yearly, seasonal and monthly levels. Energy Conversion and Management, 2015. [Google Scholar]
- Tlijani, H.; Abir, A.; Younes, R.B. Optimization of tilt angle for solar panel: Case study Tunisia. Indones. J. Electr. Eng. Comput. Sci. 2017. [Google Scholar] [CrossRef]
- Al-Shammari, S.A.; Karamallah, A.H.A.; Aljabair, S. Optimization of tilt angle and experimental study of standalone PV system for clean energy home supply in Baghdad. FME Trans. 2021, 49. [Google Scholar]
- Hussain, H.H. Estimation of optimum tilt angles of grid-tied PV solar systems via PVsyst program in Baghdad. Iraqi J. Sci. Technol. 2021. [Google Scholar] [CrossRef]
- Ashetehe, A.A.; Gessesse, B.B.; Shewarega, F. A generalized approach for the determination of optimum tilt angle for solar photovoltaic modules with selected locations in Ethiopia as illustration examples. Sci. Afr. 2022. [Google Scholar] [CrossRef]
- Hussain, H.M. Performance evaluation of photovoltaic modules at different tilt angles and orientations. Energy Convers. Manag. 2003, 45, 2441–2452. [Google Scholar]
- Njoku, H.O. Tilt angles for optimizing energy reception by fixed and periodically adjusted solar-irradiated surfaces in Nigeria. Int. J. Energy Water Resour. 2020, 4, 437–452. [Google Scholar] [CrossRef]
- Pereira, S. Prediction of global solar irradiance on parallel rows of tilted surfaces including the effect of direct and anisotropic diffuse shading. Energies 2024, 17, 3444. [Google Scholar] [CrossRef]
- Prunier, C.; et al. Optimization of photovoltaic panel tilt angle for short periods of time or multiple reorientations. Energy Convers. Manag. X 2023, 100417. [Google Scholar] [CrossRef]
- Chen, X.; Yang, H.; Lu, L. General method to obtain recommended tilt and azimuth angles for photovoltaic systems worldwide. Sol. Energy 2018, 172, 1–14. [Google Scholar] [CrossRef]
- Psomopoulos, C.S.; Ioannidis, G.C. A comparative evaluation of photovoltaic electricity production assessment software (PVGIS, PVWatts and RETScreen). Environ. Process. 2015, S175–S189. [Google Scholar]
- Dobos, A.P. PVWatts Version 5 Manual; Available online; National Renewable Energy Laboratory: Golden, CO, USA, 2014. [Google Scholar] [CrossRef] [PubMed]
- Chinchilla, M.; Polo, J.; Alonso-García, M.C. Worldwide annual optimum tilt angle model for solar collectors and photovoltaic systems. Appl. Energy 2020, 114539. [Google Scholar]
- Reindl, D.T.; Beckman, W.A.; Duffie, J.A. Evaluation of hourly tilted-surface radiation models. Sol. Energy 1990, 45(1), 9–17. [Google Scholar] [CrossRef]
Disclaimer/Publisher’s Note: The statements, opinions and data contained in all publications are solely those of the individual author(s) and contributor(s) and not of MDPI and/or the editor(s). MDPI and/or the editor(s) disclaim responsibility for any injury to people or property resulting from any ideas, methods, instructions or products referred to in the content. |
© 2026 by the authors. Licensee MDPI, Basel, Switzerland. This article is an open access article distributed under the terms and conditions of the Creative Commons Attribution (CC BY) license (http://creativecommons.org/licenses/by/4.0/).
Copyright: This open access article is published under a Creative Commons CC BY 4.0 license, which permit the free download, distribution, and reuse, provided that the author and preprint are cited in any reuse.