

Submitted:
14 July 2026
Posted:
16 July 2026
You are already at the latest version
Abstract
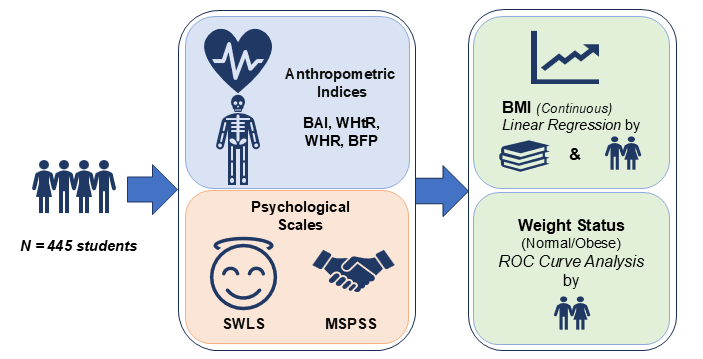
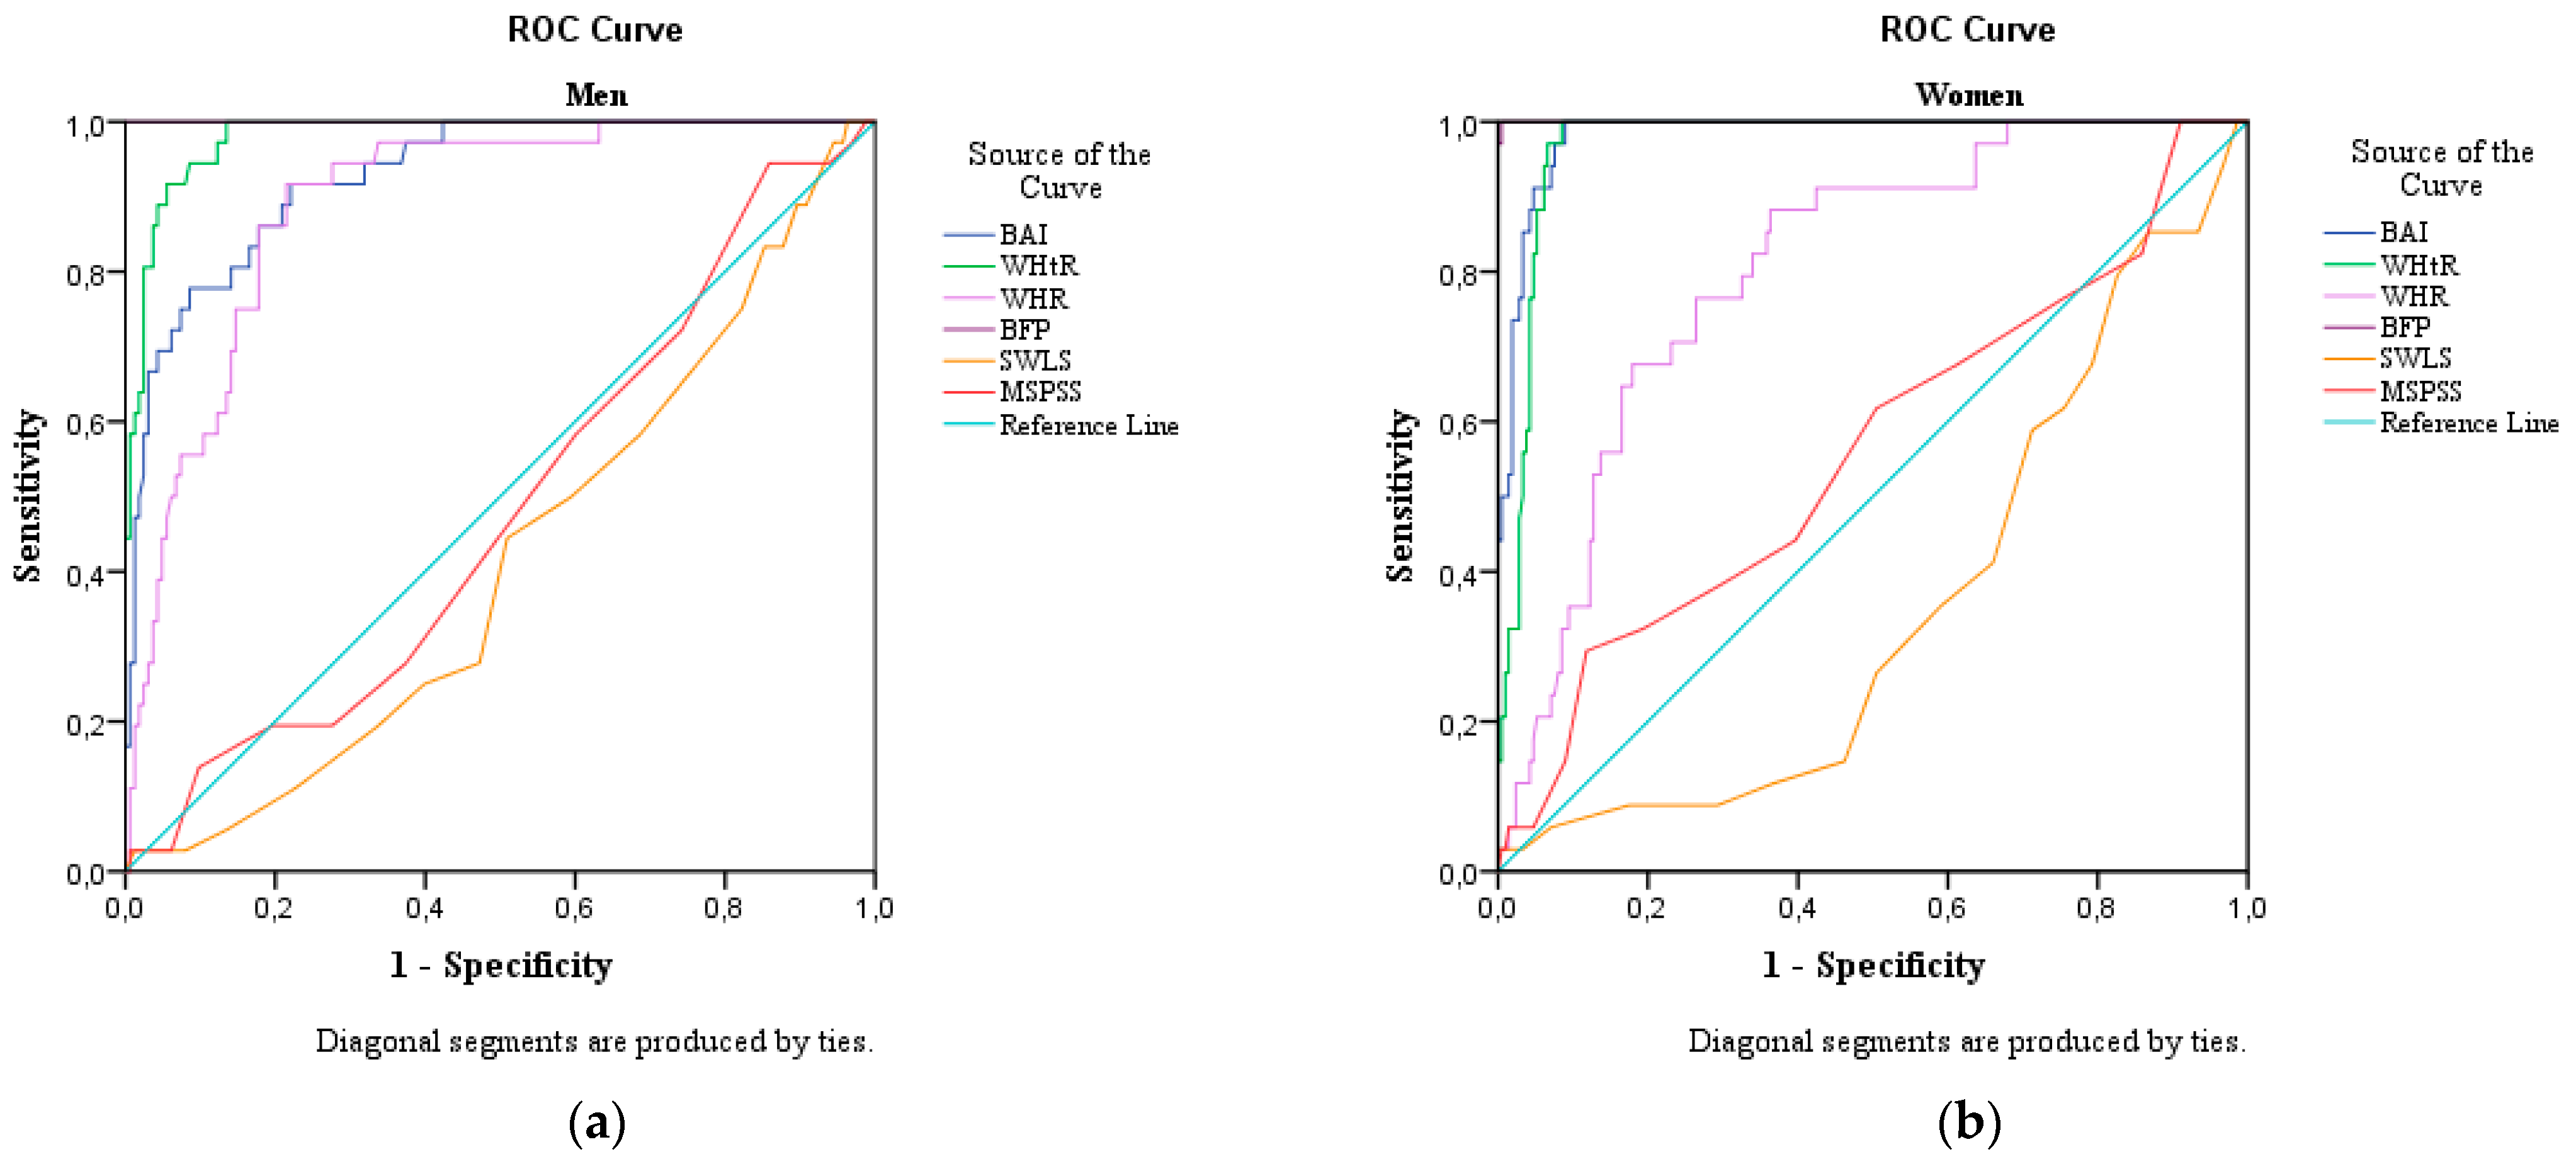
Background: Evaluating obesity among young adults requires precise anthropometric screening methods alongside a clear understanding of the psychosocial impact of this pathology. This study evaluated the predictive capacity of several biometric indicators—Body Fat Percentage (BFP), Waist-to-Height Ratio (WHtR), Body Adiposity Index (BAI), and Waist-to-Hip Ratio (WHR)—and psychosocial scales—Satisfaction with Life Scale (SWLS) and Multidimensional Scale of Perceived Social Support (MSPSS)—in identifying obesity established by Body Mass Index (BMI), stratified by sex and academic programs. Methods: A cross-sectional study was conducted on 445 university students. Statistical analyses included multiple comparisons (ANOVA) based on sex and academic program, multilinear regression equations to predict BMI, and Receiver Operating Characteristic (ROC) curve analysis to determine the Area Under the Curve (AUC). Optimal cut-off points were identified using the Youden index. Results: Multilinear regression revealed that WHtR was the strongest positive predictor for BMI across all academic programs: Biomedical Sciences (BS) (β = 1.725, t = 7.822, p < .001), Computer Science and Engineering (CSE) (β = 1.986, t = 11.172, p < .001), and Social Sciences and Physiotherapy (SSP) (β = 1.695, t = 11.259, p < .001). Conversely, WHR and BAI exhibited strong inverse relationships with BMI across BS, CSE, and SSP programs (p < .001). BFP was a significant but weaker positive predictor for BS (β = .142, p < .02) and CSE (β = .136, p < .02), but not for SSP (p = .24). Social support had a small effect on BMI in BS (p < .04) and CSE (p < .01), while SWLS was irrelevant across all programs. In sex-stratified ROC analysis, biometric parameters demonstrated excellent discrimination. BFP was the strongest predictor with an AUC of 1.000 for both sexes (cut-off: 24.38% for men, 35.43% for women). WHtR proved robust, outperforming WHR (AUCMen = 0,980; AUCWomen = 0,969), with optimal cut-offs of 0.56 (men) and 0.53 (women). Conversely, MSPSS and SWLS showed no predictive capacity or statistical significance relative to obesity (p > .05, AUC ≈ 0.50). Conclusions: While modern anthropometric markers (BFP and WHtR) represent infallible and rapid clinical screening tools, the psychosocial dimension evolves independently of weight status. This demonstrates psychological resilience among the sampled youth and refutes the stereotype of automatic quality-of-life degradation in the context of obesity.
Keywords:
1. Introduction
- Hypothesis 1 (H1): Body composition indicators and regional anthropometric indices (BFP, WHtR, BAI, WHR) exhibit a highly statistically significant predictive capacity (p < 0.05) in identifying BMI-defined obesity across both sexes and distinct academic programs.
- Hypothesis 2 (H2): Anthropometric indicators that evaluate central adiposity (such as WHtR) demonstrate superior diagnostic accuracy (higher AUC) compared to the traditional waist-to-hip ratio (WHR), showing greater predictive stability across sexes.
- Hypothesis 3 (H3): The optimal cut-off thresholds for body composition markers (BFP, BAI) and regional indices (WHtR, WHR) vary significantly by sex, directly reflecting natural biological dimorphism.
- Hypothesis 4 (H4): The psychosocial dimension, evaluated through SWLS scores, possesses significant predictive value regarding weight status, with obese subjects displaying predictably lower well-being scores.
- Hypothesis 5 (H5): MSPSS scores exert a statistically valid discriminative capacity regarding the presence or absence of obesity in both sexes, suggesting a direct dynamic relationship between social support networks and body mass index.
2. Materials and Methods
2.1. Participants
2.2. Psychosocial Measures
2.3. Anthropometric Measurements and Working Procedure
2.4. Study Design and Procedure
- Enrolment in academic programs other than the three selected specializations;
- Failure to state age or falling outside the designated 20–25 age bracket;
- Failure to indicate biological sex;
- Formally diagnosed chronic metabolic and/or cardiovascular diseases;
- Non-completion or partial completion of the psychosocial scales.
2.5. Ethical Considerations
2.6. Statistical Data Analysis
3. Results
3.1. Descriptive Statistics and Distribution Analysis
3.2. Comparative Analysis of Anthropometric Health Indicators
3.3. Predictors of BMI Among Students
4. Discussion
4.1. Practical Recommendations for Clinicians and Educational Institutions
- Implementation of Rapid Screening Protocols: It is highly recommended to integrate WHtR into university and school healthcare services as a primary screening metric. WHtR represents a simple, cost-effective, and substantially more reliable tool than WHR, enabling healthcare providers to rapidly identify young adults exhibiting elevated metabolic risks.
- Utilization of Sex-Specific Diagnostic Thresholds: Anthropometric evaluations in youth populations must strictly utilize differentiated cut-off thresholds rather than generalized values. Within the context of the investigated cohort, the optimal clinical demarcation points are established at 0.56 for men and 0.53 for women regarding WHtR, and at 24.38% for men and 35.43% for women regarding BFP.
- Adoption of a Holistic and Non-Stigmatizing Approach: Given that obesity status did not predict a decline in either life satisfaction or perceived social support, nutritional and metabolic intervention programs must remain focused strictly on physical health and biometric biomarkers. Clinical frameworks should actively avoid intervention strategies built upon the erroneous premise that young adults with obesity universally suffer from a global psychological decline.
- Deployment of Complementary Independent Evaluations: In the clinical management of obesity, psychological dimensions (such as SWLS) and relational resources (such as MSPSS) should be evaluated independently as potential therapeutic coping assets to support treatment compliance, rather than being treated as automatic or direct consequences of an elevated body mass index.
4.2. Limitations of the Study
- Cross-Sectional Research Design: Because data were collected at a single point in time, this study cannot establish definitive temporal or long-term causal relationships between changes in body composition and the evolution of psychosocial factors.
- Specificity of the Sample Cohort: The investigation was conducted on a specific group of young adults (university students). Consequently, the direct extrapolation of the exact calculated cut-off thresholds to the general population or to other distinct age groups (such as children or the elderly) must be approached with caution.
- Self-Reported Nature of Psychometric Data: The SWLS and MSPSS scales are psychometric instruments based entirely on the subjective perception of the participants. Therefore, the potential influence of social desirability bias on the collected responses cannot be completely ruled out.
5. Conclusions
- Absolute Accuracy of Body Composition Metrics: BFP was confirmed as a highly robust and stable predictor of BMI-defined obesity across both sexes, demonstrating perfect or near-perfect diagnostic performance. The identified cut-off thresholds successfully capture biological constitutional dimorphisms and can serve as rigorous, population-specific clinical benchmarks.
- Superiority of Modern Anthropometric Indices: The study demonstrates that WHtR represents a highly reliable and robust screening tool, significantly outperforming the traditional WHR, particularly among female participants. The calculated optimal cut-off points underscore the utility of WHtR as a rapid, cost-effective, and non-invasive indicator for evaluating excessive adiposity.
- Validation of the Body Adiposity Index: BAI represents an excellent predictor for both cohorts, displaying superior diagnostic performance in women compared to men. This index is validated as a viable alternative screening modality in clinical settings where direct body weight measurement is challenging or unfeasible.
- Independence of the Psychosocial Dimension: In sharp contrast to the physical and biometric parameters, the investigated psychological and relational factors—namely MSPSS and SWLS—demonstrated no predictive capacity or statistical significance relative to obesity status.
- Clinical Implications and Destigmatization of Stereotypes: The total absence of predictive value from the SWLS and MSPSS scales constitutes a major conceptual conclusion of this study. These data firmly demonstrate that, within the investigated cohort, an elevated weight status does not automatically trigger an impairment in perceived happiness or a degradation of social support networks. This functional independence implies the presence of complex psychological resilience mechanisms among young adults, indicating that obesity does not follow a linear association with a decline in the subjective quality of life.
- Sex- and Academic Program-Specific Multi-Predictive Frameworks: The predictive models for BMI differ fundamentally based on sex and academic program. While BMI reflects a purely compositional dimension (driven strictly by BFP) for the male population and female students in technical fields, BMI variations are significantly shaded by non-compositional factors among female students in biomedical and social/physical therapy programs. Specifically, psychosocial resources, namely life satisfaction and total social support, act as significant protective factors against an elevated BMI exclusively among female BS students. These findings highlight the critical need for holistic, tailored, and gender-specific approaches when evaluating and monitoring the health and body composition status of young university students.
Author Contributions
Funding
Institutional Review Board Statement
Informed Consent Statement
Data Availability Statement
Acknowledgments
Conflicts of Interest
Abbreviations
| BMI | Body Mass Index |
| BFP | Body Fat Percentage |
| WHtR | Waist-to-Height Ratio |
| WHR | Waist-to-Hip Ratio |
| BAI | Body Adiposity Index |
| SWLS | Satisfaction with Life Scale |
| MSPSS | Multidimensional Scale of Perceived Social Support |
| BS | Biomedical Sciences |
| CSE | Computer Science and Engineering |
| SSP | Social Sciences and Physiotherapy |
| ANOVA | Analysis of Variance |
| ROC | Receiver Operating Characteristic |
| AUC | Area Under the Curve |
| CI | Confidence Interval |
| SD | Standard Deviation |
| W | Weight |
| H | Height |
| WC | Waist Circumference |
| HC | Hip Circumference |
| NWO | Normal-Weight Obesity |
References
- Górnicka, M.; Szewczyk, K.; Białkowska, A.; Jancichova, K.; Habanova, M.; Górnicki, K.; Hamulka, J. Anthropometric Indices as Predictive Screening Tools for Obesity in Adults; The Need to Define Sex-Specific Cut-Off Points for Anthropometric Indices. Appl. Sci. 2022, 12, 6165. [Google Scholar] [CrossRef]
- Wu, Y.; Li, D.; Vermund, S.H. Advantages and Limitations of the Body Mass Index (BMI) to Assess Adult Obesity. Int. J. Environ. Res. Public Health 2024, 21, 757. [Google Scholar] [CrossRef] [PubMed]
- Jabłonowska-Lietz, B.; Wrzosek, M.; Włodarczyk, M.; Nowicka, G. New indexes of body fat distribution, visceral adiposity index, body adiposity index, waist-to-height ratio, and metabolic disturbances in the obese. Kardiol. Pol. 2017, 75, 1185–1191. [Google Scholar] [CrossRef] [PubMed]
- Pluta, W.; Dudzińska, W.; Lubkowska, A. Metabolic Obesity in People with Normal Body Weight (MONW)-Review of Diagnostic Criteria. Int. J. Environ. Res. Public Health 2022, 19, 624. [Google Scholar] [CrossRef] [PubMed]
- Kagawa, M. Differences in the obesity screening ability of 19 anthropometric parameters in young Japanese females: Comparisons of direct measurements, conventional and novel indices. Int. J. Kinanthropom. 2021, 1, 41–52. [Google Scholar] [CrossRef]
- Emon, H.H.; Sarker, S.; Lima, M.S.A.; Tasnim, F.A.; Al Nabil, A.; Azam, M.I.; et al. Prevalence of overweight and obesity and their impact on academic performance and psychological well-being among university students in 2024 in Bangladesh. PLoS ONE 2024, 19, e0315321. [Google Scholar] [CrossRef] [PubMed]
- Ramírez-Manent, J.I.; López-González, Á.A.; Tomás-Gil, P.; Riutord-Sbert, P.; Garrido-Sepulveda, L.; Vicente-Herrero, M.T. Relationship between Abdominal Volume Index and Body Adiposity Index and Scales of Insulin Resistance and Metabolic Syndrome. Diagnostics 2023, 13, 3356. [Google Scholar] [CrossRef] [PubMed]
- Okunogbe, A.; Nugent, R.; Spencer, G.; Powis, J.; Ralston, J.; Wilding, J. Economic impacts of overweight and obesity: current and future estimates for 161 countries. BMJ Glob. Health 2022, 7, e009773. [Google Scholar] [CrossRef] [PubMed]
- Purnell, J.Q. What is Obesity? Definition as a Disease, with Implications for Care. Gastroenterol. Clin. North Am. 2023, 52, 261–275. [Google Scholar] [CrossRef] [PubMed]
- Radu, F.; Potcovaru, C.G.; Salmen, T.; Filip, P.V.; Pop, C.; Fierbințeanu-Braticievici, C. The Link between NAFLD and Metabolic Syndrome. Diagnostics 2023, 13, 614. [Google Scholar] [CrossRef] [PubMed]
- Jiang, K.; Zhang, Z.; Fullington, L.A.; Huang, T.T.; Kaliszewski, C.; Wei, J.; Zhao, L.; Huang, S.; Ellithorpe, A.; Wu, S.; et al. Dietary Patterns and Obesity in Chinese Adults: A Systematic Review and Meta-Analysis. Nutrients 2022, 14, 4911. [Google Scholar] [CrossRef] [PubMed]
- Moriconi, D.; D’Alessandro, C.; Giannese, D.; Panichi, V.; Cupisti, A. Diagnosis, Prevalence and Significance of Obesity in a Cohort of CKD Patients. Metabolites 2023, 13, 196. [Google Scholar] [CrossRef] [PubMed]
- Jeong, S.M.; Lee, D.H.; Rezende, L.F.M.; Giovannucci, E.L. Different correlation of body mass index with body fatness and obesity-related biomarker according to age, sex and race-ethnicity. Sci. Rep. 2023, 13, 3472. [Google Scholar] [CrossRef] [PubMed]
- Wells, R.K.; Torres, A.; Mau, M.K.; Maunakea, A.K. Racial–Ethnic Disparities of Obesity Require Community Context-Specific Biomedical Research for Native Hawaiians and Other Pacific Islanders. Nutrients 2024, 16, 4268. [Google Scholar] [CrossRef] [PubMed]
- Bray, G.A. Beyond BMI. Nutrients 2023, 15, 2254. [Google Scholar] [CrossRef] [PubMed]
- Deusdará, R.; de Moura Souza, A.; Szklo, M. Association between Obesity, Overweight, Elevated Waist Circumference, and Insulin Resistance Markers among Brazilian Adolescent Students. Nutrients 2022, 14, 3487. [Google Scholar] [CrossRef] [PubMed]
- Zhu, Y.; Wang, Z.; Maruyama, H.; Onoda, K.; Huang, Q. Body Fat Percentage and Normal-Weight Obesity in the Chinese Population: Development of a Simple Evaluation Indicator Using Anthropometric Measurements. Int. J. Environ. Res. Public Health 2022, 19, 4238. [Google Scholar] [CrossRef] [PubMed]
- Alghawrien, D.; Al-Hussami, M.; Ayaad, O. The impact of obesity on self-esteem and academic achievement among university students. Int. J. Adolesc. Med. Health 2020, 34, 10.1515/ijamh-2019-0137. [Google Scholar] [CrossRef] [PubMed]
- Kılıç, M.E.; Özcan, S.; Koç, B.T. Relationship between obesity, body image, self-esteem and cyber victimization. Turk. Med. Stud. J. 2023, 10, 26–31. [Google Scholar] [CrossRef]
- do Vale, A.B.N.; Paineiras-Domingos, L.L. University Students’ Self-Image and Body Weight Gain During COVID-19: A Descriptive Study. Adolescents 2024, 4, 512–524. [Google Scholar] [CrossRef]
- Diener, E.D.; Emmons, R.A.; Larsen, R.J.; Griffin, S. The satisfaction with life scale. J. Pers. Assess. 1985, 49, 71–75. [Google Scholar] [CrossRef] [PubMed]
- Tomulescu, I.M.; Marian, M. New bio-psychological perspectives on obesity: the relevance of anthropometric health indicators in students. J. Psychol. Educ. Res. 2025, 33, 198–221. [Google Scholar]
- Zimet, G.D.; Dahlem, N.W.; Zimet, S.G.; Farley, G.K. The multidimensional scale of perceived social support. J. Pers. Assess. 1988, 52, 30–41. [Google Scholar] [CrossRef]
- Marian, M.; Chirodea, F.; Ţoca, C. Rethinking the analytical framework for European empirical psychological research on social support-one of the macro-indicators of social cohesion. J. Psychol. Educ. Res. 2024, 32, 136–149. [Google Scholar]
- Haroun, D.; Darwish, M.; Ehsanallah, A. Associations of body adiposity index, body mass index, waist circumference, and percentage of body fat in young female Emirati adults. PLoS ONE 2024, 19, e0302779. [Google Scholar] [CrossRef] [PubMed]
- Iyen, B.; Weng, S.; Vinogradova, Y.; Akyea, R.K.; Qureshi, N.; Kai, J. Long-term body mass index changes in overweight and obese adults and the risk of heart failure, cardiovascular disease and mortality: a cohort study of over 260,000 adults in the UK. BMC Public Health 2021, 21, 576. [Google Scholar] [CrossRef] [PubMed]
- Bergman, R.N.; Stefanovski, D.; Buchanan, T.A.; Sumner, A.E.; Reynolds, J.C.; Sebring, N.G.; Xiang, A.H.; Watanabe, R.M. A better index of body adiposity. Obesity 2011, 19, 1083–1089. [Google Scholar] [CrossRef] [PubMed]
- Kholmatova, K.; Krettek, A.; Dvoryashina, I.V.; Malyutina, S.; Cook, S.; Avdeeva, E.; Kudryavtsev, A.V. Waist-to-Height Ratio - Reference Values and Associations with Cardiovascular Risk Factors in a Russian Adult Population. Diabetes Metab. Syndr. Obes. Targets Ther. 2025, 18, 2641–2653. [Google Scholar] [CrossRef] [PubMed]
- Swainson, M.G.; Batterham, A.M.; Tsakirides, C.; Rutherford, Z.H.; Hind, K. Prediction of whole-body fat percentage and visceral adipose tissue mass from five anthropometric variables. PLoS ONE 2017, 12, e0177175. [Google Scholar] [CrossRef] [PubMed]
- Chen, N.; Hu, L.K.; Sun, Y.; Dong, J.; Chu, X.; Lu, Y.K.; Liu, Y.H.; Ma, L.L.; Yan, Y.X. Associations of waist-to-height ratio with the incidence of type 2 diabetes and mediation analysis: Two independent cohort studies. Obes. Res. Clin. Pract. 2023, 17, 9–15. [Google Scholar] [CrossRef] [PubMed]
- Mainous, A.G., 3rd; Yin, L.; Wu, V.; Sharma, P.; Jenkins, B.M.; Saguil, A.A.; Nelson, D.S.; Orlando, F.A. Body Mass Index vs Body Fat Percentage as a Predictor of Mortality in Adults Aged 20-49 Years. Ann. Fam. Med. 2025, 23, 337–343. [Google Scholar] [CrossRef] [PubMed]
- Deurenberg, P.; Weststrate, J.A.; Seidell, J.C. Body mass index as a measure of body fatness: age- and sex-specific prediction formulas. Br. J. Nutr. 1991, 65, 105–114. [Google Scholar] [CrossRef] [PubMed]
- Ashwell, M.; Gunn, P. National Diet and Nutrition Surveys: The British experience. Public Health Nutr. 2006, 9, 523–530. [Google Scholar] [CrossRef] [PubMed]
- Rickenbacher, M.; Gültekin, N.; Stanga, Z.; Bender, N.; Staub, K.; Wells, J.C.; Matthes, K.L.; Reber, E. The role of body height as a co-factor of excess weight in Switzerland. Am. J. Hum. Biol. 2022, 34, e23754. [Google Scholar] [CrossRef] [PubMed]
- Alammar, M.; Alsoghayer, S.; El-Abd, K.; Alkhenizan, A. Diagnostic Accuracy of Body Mass Index (BMI) When Diagnosing Obesity in a Saudi Adult Population in a Primary Care Setting, Cross Sectional, Retrospective Study. Diabetes Metab. Syndr. Obes. Targets Ther. 2020, 13, 2515–2520. [Google Scholar] [CrossRef] [PubMed]
- Jo, A.; Mainous, A.G., 3rd. Informational value of percent body fat with body mass index for the risk of abnormal blood glucose: a nationally representative cross-sectional study. BMJ Open 2018, 8, e019200. [Google Scholar] [CrossRef] [PubMed]
- Okorodudu, D.O.; Jumean, M.F.; Montori, V.M.; Romero-Corral, A.; Somers, V.K.; Erwin, P.J.; Lopez-Jimenez, F. Diagnostic performance of body mass index to identify obesity as defined by body adiposity: A systematic review and meta-analysis. Int. J. Obes. 2010, 34, 791–799. [Google Scholar] [CrossRef] [PubMed]
- Diverse Populations Collaborative Group. Weight-height relationships and body mass index: Some observations from the diverse populations collaboration. Am. J. Phys. Anthropol. 2005, 128, 220–229. [Google Scholar] [CrossRef] [PubMed]
- Wong, W.W.; Strizich, G.; Heo, M.; Heymsfield, S.B.; Himes, J.H.; Rock, C.L.; Gellman, M.D.; Siega-Riz, A.M.; Sotres-Alvarez, D.; Davis, S.M.; et al. Relationship between body fat and BMI in a US hispanic population-based cohort study: Results from HCHS/SOL. Obesity 2016, 24, 1561–1571. [Google Scholar] [CrossRef] [PubMed]
- Shukohifar, M.; Mozafari, Z.; Rahmanian, M.; Mirzaei, M. Performance of body mass index and body fat percentage in predicting metabolic syndrome risk factors in diabetic patients of Yazd, Iran. BMC Endocr. Disord. 2022, 22, 216. [Google Scholar] [CrossRef] [PubMed]
- Nevill, A.M.; Stewart, A.D.; Olds, T.; Holder, R. Relationship between adiposity and body size reveals limitations of BMI. Am. J. Phys. Anthropol. 2006, 129, 151–156. [Google Scholar] [PubMed]
- Hong, Y.H.; Kim, H.; Kim, J.-H.; Jo, Y.; Lee, Y.; Chung, S.; Kim, C.-H. Percentage Body Fat Corresponding to Korean BMI Classification for Obesity in a Nationally Representative Population. Nutrients 2026, 18*, 1935. [Google Scholar] [CrossRef] [PubMed]
- Anderson, K.C.; Hirsch, K.R.; Peterjohn, A.M.; Blue, M.N.M.; Pihoker, A.A.; Ward, D.S.; Ondrak, K.S.; Smith-Ryan, A.E. Characterization and prevalence of obesity among normal weight college students. Int. J. Adolesc. Med. Health 2020, 35, 81–88. [Google Scholar] [CrossRef] [PubMed]
- Romero-Corral, A.; Somers, V.K.; Sierra-Johnson, J.; Korenfeld, Y.; Boarin, S.; Korinek, J.; Jensen, M.D.; Parati, G.; Lopez-Jimenez, F. Normal weight obesity: A risk factor for cardiometabolic dysregulation and cardiovascular mortality. Eur. Heart J. 2009, 31, 737–746. [Google Scholar] [CrossRef] [PubMed]
- Maitiniyazi, G.; Chen, Y.; Qiu, Y.Y.; Xie, Z.X.; He, J.Y.; Xia, S.F. Characteristics of Body Composition and Lifestyle in Chinese University Students with Normal-Weight Obesity: A Cross-Sectional Study. Diabetes Metab. Syndr. Obes. Targets Ther. 2021, 14, 3427–3436. [Google Scholar] [CrossRef] [PubMed]
- Mitic, N.; Popovic, L.; Milic, M.; Radic, I.; Popovic, B. Prevalence of Overweight and Obesity among Students of University in Pristina/Kosovska Mitrovica, according to Different Anthropometric Indices. Iran. J. Public Health 2021, 50, 1919–1921. [Google Scholar] [CrossRef] [PubMed]
- Parfenteva, O.I.; Kulemin, N.A.; Bondareva, E.A.; Ahmetov, I.I. Prevalence and Predictors of Normal-Weight Obesity among Women. Nutrients 2024, 16, 2579. [Google Scholar] [CrossRef] [PubMed]
- Uchino, B.N. Social support and health: a review of physiological processes potentially underlying links to disease outcomes. J. Behav. Med. 2006, 29, 377–387. [Google Scholar] [CrossRef] [PubMed]
- Behera, S.; Mishra, A.; Esther, A., Sr.; Sahoo, A. Tailoring Body Mass Index for Prediction of Obesity in Young Adults: A Multi-Centric Study on MBBS Students of Southeast India. Cureus 2021, 13, e12579. [Google Scholar] [CrossRef] [PubMed]
- Gonçalves, I.d.S.A.; Filgueiras, M.D.S.; Moreira, T.R.; Thomé, M.S.; Paiva, G.L.D.; Almeida, G.P.d.; Cotta, R.M.M.; Campos, T.d.N.; Freitas, D.M.d.O.; Novaes, J.F.d.; et al. Interrelation of Stress, Eating Behavior, and Body Adiposity in Women with Obesity: Do Emotions Matter? Nutrients 2024, 16, 4133. [Google Scholar] [CrossRef] [PubMed]
- Priede, L.; Beitane, I.; Beitane, L. A Study of Relationships Between Mental Well-Being, Sleep Quality, Eating Behavior, and BMI: A Cross-Sectional Study Among University Students. Int. J. Environ. Res. Public Health 2025, 22, 1465. [Google Scholar] [CrossRef] [PubMed]
- Krakauer, N.Y.; Krakauer, J.C. A New Body Shape Index Predicts Mortality Hazard Independently of Body Mass Index. PLoS ONE 2012, 7, e39504. [Google Scholar] [CrossRef] [PubMed]
- Abdi Dezfouli, R.; Mohammadian Khonsari, N.; Hosseinpour, A.; Asadi, S.; Ejtahed, H.S.; Qorbani, M. Waist to height ratio as a simple tool for predicting mortality: a systematic review and meta-analysis. Int. J. Obes. 2023, 47, 1286–1301. [Google Scholar] [CrossRef] [PubMed]
- Medrano-Donlucas, G.; Hernández-Peña, C.; Juárez-Lozano, R.; López-López, C.; Flores, S.; Villalobos-Molina, R.; Gallardo-Ortíz, I. Overweight/Obesity in University Students from Mexico: Comparison Using Different Indices. J. Biosci. Med. 2024, 12, 151–159. [Google Scholar] [CrossRef]

| Academic program | Sex | N | Percent | χ2 | p |
|---|---|---|---|---|---|
| Biomedical sciences (N=144) |
Male | 37 | 25,70 | 27,319 | .0001 |
| Female | 107 | 74,30 | |||
| Computer Science and Engineering (N=159) |
Male | 102 | 64,15 | 11,716 | .0006 |
| Female | 57 | 35,85 | |||
| Social sciences and physiotherapy (N=142) |
Male | 60 | 42,25 | 3,308 | .06 |
| Female | 82 | 57,75 |
| Academic program |
Statistics | BAI | WHtR | WHR | BMI | BFP |
|---|---|---|---|---|---|---|
| Biomedical Sciences (N=144) |
Mean | 29.82 | .48 | .79 | 25.46 | 27.28 |
| SD | 5.43 | .07 | .08 | 5.48 | 7.15 | |
| Skewness | .846 | .32 | .68 | .54 | .59 | |
| Kurtosis | .598 | -.74 | -.15 | -.34 | .47 | |
| Min. | 19.43 | .34 | .65 | 16.69 | 10.24 | |
| Max. | 46.55 | .71 | 1.05 | 41.31 | 49.01 | |
| Computer Science and Engineering (N=159) |
Mean | 26.47 | .47 | .81 | 24.02 | 21.29 |
| SD | 4.56 | .07 | .07 | 4.75 | 6.80 | |
| Skewness | .58 | .76 | .27 | .80 | .62 | |
| Kurtosis | .08 | .49 | .19 | .79 | .30 | |
| Min. | 17.27 | .32 | .64 | 14.39 | 8.70 | |
| Max. | 39.68 | .70 | 1.08 | 42.12 | 41.09 | |
| Social Sciences and Physiotherapy (N=142) |
Mean | 27.49 | .46 | .79 | 23.99 | 23.58 |
| SD | 4.38 | .06 | .07 | 4.38 | 6.96 | |
| Skewness | .66 | 1.01 | .88 | 1.05 | .27 | |
| Kurtosis | .43 | .43 | .81 | .65 | -.19 | |
| Min. | 18.85 | .36 | .66 | 17.18 | 9.28 | |
| Max. | 39.92 | .67 | 1.04 | 37.71 | 41.36 |
| Sex | Biological parameters | F | p | Post-hoc (m diff.) |
|---|---|---|---|---|
| Male | BMI | 6.418 | .002 | BS> CSE BS>SSP CSE =SSP |
| WHtR | 6.283 | .002 | BS> CSE BS>SSP CSE =SSP |
|
| WHR | 5.964 | .003 | BS> CSE BS>SSP CSE =SSP |
|
| BFP | 7.369 | .001 | BS> CSE BS>SSP CSE =SSP |
|
| BAI | 4.541 | .01 | BS> CSE BS=SSP CSE =SSP |
|
| Female | BMI | 3.518 | .03 | BS> CSE BS=SSP CSE =SSP |
| WHtR | 2.834 | .06 | BS= CSE BS=SSP CSE =SSP |
|
| WHR | 0.708 | .49 | BS= CSE BS=SSP CSE =SSP |
|
| BFP | 3.718 | .02 | BS> CSE BS=SSP CSE =SPS |
|
| BAI | 4.106 | .01 | BS= CSE BS>SSP CSE =SSP |
| Academic program | Biological parameters |
BMI | BAI | WHtR | WHR |
|---|---|---|---|---|---|
| BS | BMI | 1 | |||
| BAI | .780** | 1 | |||
| WHtR | .924** | .697** | 1 | ||
| WHR | .577** | .104 | .775** | 1 | |
| BFP | .769** | .896** | .666** | .127 | |
| IES | BMI | 1 | |||
| BAI | .703** | 1 | |||
| WHtR | .914** | .649** | 1 | ||
| WHR | .608** | .081 | .797** | 1 | |
| BFP | .663** | .898** | .575** | .049 | |
| SSP | BMI | 1 | |||
| BAI | .733** | 1 | |||
| WHtR | .938** | .653** | 1 | ||
| WHR | .604** | .058 | .778** | 1 | |
| BFP | .646** | .825** | .548** | .034 |
| Academic program | R | R2 | F | df | p |
|---|---|---|---|---|---|
| Biomedical Sciences | .957 | .915 | 245.781 | 6 | .001 |
| Computer Science and Engineering | .949 | .901 | 230.077 | 6 | .001 |
| Social Sciences andPhysiotherapy | .964 | .929 | 295.821 | 6 | .001 |
| Academic program | Parameters | Unstandardized Coefficients | Standardized Coefficients | t | p | |
|---|---|---|---|---|---|---|
| B | Std. Err. | β | ||||
| Biomedical Sciences | (Constant) | 19.957 | 5.049 | 3.953 | .001 | |
| WHtR | 119.024 | 15.216 | 1.725 | 7.822 | .001 | |
| WHR | -47.935 | 10.289 | -.735 | -4.659 | .001 | |
| BAI | -.476 | .133 | -.472 | -3.580 | .001 | |
| BFP | .109 | .047 | .142 | 2.332 | .02 | |
| Life satisfaction | -.045 | .027 | -.047 | -1.682 | .09 | |
| Total social support | -1.044 | .517 | -.056 | -2.018 | .04 | |
| Computer Science and Engineering |
(Constant) | 24.618 | 4.030 | 6.108 | .001 | |
| WHtR | 132.979 | 11.903 | 1.986 | 11.172 | .001 | |
| WHR | -56.350 | 8.121 | -.939 | -6.939 | .001 | |
| BAI | -.655 | .116 | -.629 | -5.630 | .001 | |
| BFP | .095 | .041 | .136 | 2.292 | .02 | |
| Life satisfaction | -.013 | .022 | -.014 | -.558 | .57 | |
| Total social support | -1.070 | .437 | -.064 | -2.448 | .01 | |
| Social Sciences and Physiotherapy |
(Constant) | 14.041 | 3.381 | 4.154 | .001 | |
| WHtR | 111.312 | 9.887 | 1.695 | 11.259 | .001 | |
| WHR | -40.677 | 6.661 | -.695 | -6.106 | .001 | |
| BAI | -.376 | .094 | -.376 | -4.008 | .001 | |
| BFP | .032 | .027 | .050 | 1.180 | .24 | |
| Life satisfaction | -.009 | .023 | -.010 | -.384 | .70 | |
| Total social support | -.051 | .370 | -.003 | -.139 | .89 | |
| Academic program |
Sex | Predictors | Unstandardized Coefficients | Standardized Coefficients | t | p | |
|---|---|---|---|---|---|---|---|
| B | Std.Error | Beta | |||||
| Biomedical Sciences | Male | (Constant) | 2.197 | 9.556 | .230 | .820 | |
| BAI | .107 | .265 | .098 | .404 | .689 | ||
| WHtR | 6.031 | 28.567 | .091 | .211 | .834 | ||
| WHR | 4.818 | 16.621 | .068 | .290 | .774 | ||
| BFP | .582 | .116 | .751 | 5.024 | .000 | ||
| Life satisfaction |
.012 | .042 | .016 | .287 | .776 | ||
| Total social support | .873 | 1.079 | .049 | .809 | .425 | ||
| Female | (Constant) | 1.061 | .537 | 1.975 | .051 | ||
| BAI | .012 | .014 | .012 | .856 | .394 | ||
| WHtR | -1.684 | 1.999 | -.024 | -.842 | .402 | ||
| WHR | .407 | 1.207 | .005 | .337 | .737 | ||
| BFP | .835 | .008 | 1.008 | 108.353 | .000 | ||
| Life satisfaction |
-.007 | .003 | -.007 | -2.656 | .009 | ||
| Total social support | -.152 | .047 | -.008 | -3.254 | .002 | ||
| Computer Science and Engineering | Male | (Constant) | 10.483 | 2.752 | 3.809 | .000 | |
| BAI | -.016 | .094 | -.014 | -.166 | .868 | ||
| WHtR | -9.160 | 12.022 | -.131 | -.762 | .448 | ||
| WHR | 2.835 | 6.299 | .037 | .450 | .654 | ||
| BFP | .912 | .058 | 1.096 | 15.693 | .000 | ||
| Life satisfaction |
.001 | .014 | .001 | .082 | .935 | ||
| Total social support | .007 | .314 | .000 | .023 | .982 | ||
| Female | (Constant) | 1.369 | .777 | 1.762 | .084 | ||
| BAI | -.017 | .019 | -.016 | -.882 | .382 | ||
| WHtR | 1.902 | 3.080 | .029 | .617 | .540 | ||
| WHR | -1.163 | 1.899 | -.016 | -.613 | .543 | ||
| BFP | .824 | .014 | .998 | 59.013 | .000 | ||
| Life satisfaction |
-.001 | .004 | -.001 | -.192 | .849 | ||
| Total social support | -.028 | .095 | -.001 | -.293 | .771 | ||
| Social Sciences and Physiotherapy | Male | (Constant) | 9.355 | .524 | 17.860 | .000 | |
| BAI | .007 | .013 | .007 | .561 | .577 | ||
| WHtR | -.079 | 1.846 | -.001 | -.043 | .966 | ||
| WHR | .057 | .984 | .001 | .057 | .954 | ||
| BFP | .823 | .011 | .995 | 74.103 | .000 | ||
| Life satisfaction |
.000 | .003 | .000 | .103 | .918 | ||
| Total social support | .076 | .057 | .005 | 1.340 | .186 | ||
| Female | (Constant) | 1.675 | .532 | 3.151 | .002 | ||
| BAI | -.036 | .015 | -.035 | -2.310 | .024 | ||
| WHtR | 2.534 | 2.161 | .036 | 1.173 | .245 | ||
| WHR | -1.998 | 1.183 | -.026 | -1.689 | .095 | ||
| BFP | .841 | .010 | 1.013 | 80.447 | .000 | ||
| Life satisfaction |
.004 | .003 | .004 | 1.119 | .267 | ||
| Total social support | -.035 | .051 | -.002 | -.694 | .490 | ||
| Predictors | Sex | AUC | 95% CI | Cut-off | Sensibility | Specificity | p | Youden index |
|---|---|---|---|---|---|---|---|---|
| BFP | M | 1.000 | 1.000 - 1.000 |
24.38 | 100.0% | 100.0% | < .001 | 1.000 |
| F | 1.000 | 0.999 – 1.000 | 35.43 | 100.0% | 99.5% | < .001 | 0.995 | |
| WHtR | M | 0.980 | 0.964 – 0.996 | 0.56 | 91.7% | 94.5% | < .001 | 0.862 |
| F | 0.969 | 0.949 – 0.988 | 0.53 | 94.1% | 93.9% | < .001 | 0.880 | |
| BAI | M | 0.928 | 0.887 – 0.969 | 26.91 | 91.7% | 77.9% | < .001 | 0.696 |
| F | 0.982 | 0.969 – 0.995 | 34.41 | 91.2% | 95.3% | < .001 | 0.865 | |
| WHR | M | 0.890 | 0.839 – 0.940 | 0.88 | 91.7% | 78.5% | < .001 | 0.702 |
| F | 0.803 | 0.734 – 0.872 | 0.75 | 91.4% | 57.5% | < .001 | 0.489 | |
| MSPSS | M | 0.482 | 0.381 – 0.583 | 2.04 | 72.2% | 25.8% | .735 | -0.020 |
| F | 0.563 | 0.453 – 0.672 | 2.12 | 76.5% | 24.5% | .241 | 0.010 | |
| SWLS | M | 0.416 | 0.319 – 0.513 | 17.50 | 88.9% | 10.4% | .116 | -0.007 |
| F | 0.357 | 0.264 – 0.450 | 20.50 | 79.4% | 17.5% | .264 | -0.031 |
Disclaimer/Publisher’s Note: The statements, opinions and data contained in all publications are solely those of the individual author(s) and contributor(s) and not of MDPI and/or the editor(s). MDPI and/or the editor(s) disclaim responsibility for any injury to people or property resulting from any ideas, methods, instructions or products referred to in the content. |
© 2026 by the authors. Licensee MDPI, Basel, Switzerland. This article is an open access article distributed under the terms and conditions of the Creative Commons Attribution (CC BY) license (http://creativecommons.org/licenses/by/4.0/).


