
Submitted:
14 July 2026
Posted:
15 July 2026
You are already at the latest version
Abstract
Reflectance Transformation Imaging (RTI) has long been employed across multiple re-search domains to document surface textures, inscriptions, and fine morphological features, including in paleontology. However, RTI requires specialized equipment and controlled acquisition protocols that are often impractical in fieldwork or heterogeneous documentation contexts. To overcome these limitations, Virtual Reflectance Transfor-mation Imaging (VRTI), based on high-resolution 3D models acquired through photo-grammetry or structured light scanning, has emerged as a promising alternative. This study investigates whether VRTI offers an operationally simpler yet perceptually equivalent alternative to conventional RTI for dinosaur footprint interpretation, while providing a standardised FAIR-compliant VRTI workspace implemented in an open-source 3D environment. A comparative protocol was developed and validated through a classroom experiment involving paleobiology students, who performed footprint delineation and morphological interpretation using both RTI and VRTI da-tasets derived from a dinosaur footprint from the Geological Collection of the "Giovanni Capellini Museum" of the University of Bologna. The evaluation combines quantitative statistical analysis with qualitative expert assessment to compare interpretative per-formance, while optimal PTM-based raking lighting conditions are also investigated. The results indicate that VRTI achieves footprint readability comparable to conventional RTI without introducing perceptual bias. Building on this validation, the proposed workspace demonstrates satisfactory usability and offers a reproducible, interoperable, and scalable workflow for cultural heritage documentation.
Keywords:
Reflectance Transformation Imaging (RTI)
; Virtual Reflectance Transformation Imaging (VRTI)
; ichnology
; digital cultural heritage
; 3D documentation
; FAIR workflows
; photogrammetry
; structured light scanning
; usability evaluation
; perceptual transparency
1. Introduction
Reflectance Transformation Imaging (RTI) has long been employed across several research fields. In paleontology, it has proven particularly effective for the study of small specimens and dinosaur footprints, allowing researchers to identify morphological features that are not visible to the naked eye. In ichnological studies of dinosaur footprints for documentation purposes, there is still a high degree of interpretative variability. This is caused by the inherent difficulty in reliably discerning track morphology both on site and within digital 3D models. The use of raking light in combination with 2D imaging techniques has proven effective for the study of small fossils; it enhances morphological detail and reveals microstructures that would otherwise remain undetected. However, RTI requires specialized equipment and a controlled acquisition setup, which are often impractical in excavation and museum contexts. These limitations have encouraged the development of Virtual RTI (VRTI), in which the acquisition process is conducted within a virtual environment using 3D models. VRTI reproduces the principles of RTI within a digital 3D environment, allowing interactive relighting directly on reconstructed surfaces without requiring a physical acquisition setup. Despite its growing adoption, VRTI still lacks a standardized and validated workflow, resulting in heterogeneous and often case-specific implementations that limit reproducibility, transparency, and comparability across studies.
To address this challenge, a dedicated VRTI workspace was developed within the open-source software Blender (https://www.blender.org/) to implement a standardised workflow for virtual relighting and image generation. This development enables the investigation of the primary scientific objective of this work, which is to determine whether VRTI can provide an operationally simpler yet perceptually equivalent alternative to conventional RTI for dinosaur footprint interpretation. To this end, the proposed workflow is first validated through a controlled comparative protocol designed to evaluate footprint readability and perceptual transparency between RTI and VRTI. The methodology is assessed through a case study involving a dinosaur footprint from the Geological Collection of the “Giovanni Capellini Museum” of the University Museum Network, University of Bologna. Following the validation of the proposed methodology, the usability of the Blender workspace is evaluated through a pilot System Usability Scale (SUS) study to assess its suitability as a standardized FAIR-compliant digital asset for VRTI analysis.
The objectives of this study are therefore:
- to develop and implement a VRTI workflow through a dedicated virtual workspace in Blender, providing a reproducible environment for virtual relighting and image generation;
- to validate the scientific reliability of the proposed VRTI methodology by assessing whether it provides an operationally simpler yet perceptually equivalent alternative to conventional RTI for dinosaur footprint interpretation through a controlled comparative protocol;
- to evaluate the usability of the validated workspace through a pilot System Usability Scale (SUS) study, assessing its suitability for adoption by Cultural Heritage and ichnological practitioners.
2. Related Works
2.1 Introduction to the Study of Footprints and Documentation Problems
Ichnology, the study of fossil tracks and traces, is a discipline born in 1830s when Edward Hitchcock first described some dinosaurs tracks in the Jurassic sediments of Massachusetts, USA [2]. Tracks are three-dimensional surfaces that can be found as positive relief, or negative depressions. Since the beginning, it has been difficult to represent tracks in an objective way, and Hitchcock himself used different types of drawing, such as outlines, or blended black and white to underline the diagnostic characteristics of tracks [3]. Not to mention the difficulties in digging most of the tracksites: in the XIX century many efforts were made to extract tracks slabs from the fields and exhibit them in many museums where they are still available to researchers. However, from the XX century, this practice has been mostly abandoned, due to the elevated costs and increasing difficulties in reaching the newly discovered sites. Since then, molding, photography and hand sketches have been the only way to documents most ichnosites. Most the bibliography up to the 1990s still relies on black and white photos and tracks outlines, which represent interpretative reconstructions of the original data and are therefore strongly influenced by the researcher’s skill in depicting them [4].
From the new millennium, the digital revolution has greatly modified the study of ichnology: 3D scanning and photogrammetry techniques have become available to a wide range of re searchers and institutions [5,6]. Nowadays the creation of mathematically based 3D models of tracks provides an easier and more objective way to correlate data if the models and the associated acquisition metadata are available. To address the need for standardized documentation, in [4] a protocol is proposed for tracks and traces of digitization and representation in scientific publications. Although this proposal is valid, tracks remain difficult to interpret both on the fields and in digital models, and many details are difficult, if not impossible, to recognize under non-ideal light conditions. While track topography may preserve a direct record of the trackmaker’s anatomy, the final morphology of a track is more often influenced by complex foot–sediment interactions involving numerous variables. These include locomotion speed and substrate water content [7], making it challenging to identify the boundaries of the true track [8,9].
2.2 RTI and Virtual RTI: Limitations, Extensions, and Methodological Challenges
RTI is a mature imaging technique developed by the non-profit organization Cultural Heritage Imaging (https://culturalheritageimaging.org/). It defines it as “a computational photographic method that captures a subject’s surface shape and color and enables the interactive re-lighting of the subject from any direction, revealing details that are not visible to the naked eye” (https://culturalheritageimaging.org/Technologies/RTI/). RTI, along with other 2D imaging techniques, has long been used for documentation purposes across various research fields like archaeology, numismatic, and paleontology. This technique enhances surface visibility by using controlled lighting to capture how light interacts with an object’s surface. It is typically carried out in two ways: by manually moving a light source around a stationary camera (RTI) and subject; or by using a dome fitted with fixed light sources that illuminate the object in sequence while a static camera records the images (HRTI —Hemispherical Reflectance Transformation Imaging) [10]. In both cases, it is preferably having a dark lighting condition. While HRTI systematically samples illumination directions over a hemisphere, RTI provides more limited control over the origin of the light sources and the planning of the lighting configuration. However, HRTI is not always feasible due to the limited availability of appropriate equipment, as it requires a specialized dome that is often prohibitively expensive for museums and public institutions. In recent years, RTI has increasingly been combined with 3D models generated through techniques such as Structure from Motion (SfM) photogrammetry or Structured Light Scanning (SLS). This combination is primarily employed in the field of Cultural Heritage to document complex surfaces and enhance data readability. In [11] a comparative analysis of the main documentation techniques used for lithic materials is provided, including 2D drawings, 3D models, and RTI, evaluating them according to factors such as cost, acquisition time, ease of implementation, and output quality. The authors argue that, where full 3D metrics are not essential, RTI is the most effective method to document individual lithic artifacts, offering the best compromise between cost, time, portability, objective, and detailed visualization of micro-relief. However, RTI presents several limitations and critical issues related to its scalability. In particular, the technique is difficult to apply to large objects or extensive sites, as RTI acquisition requires controlled lighting conditions that are often challenging to achieve in archaeological contexts. This is especially true for large-scale archaeological sites or museum environments, where lighting conditions and spatial constraints are not easily adaptable [12]. To overcome the limited reproducibility of traditional RTI, VRTI is increasingly used. It is the result of an integrated approach between RTI techniques and 3D technologies that offer greater flexibility and precision in digital surface visualisation. Virtual methodology is often preferred due to the opportunity to reuse existing 3D data [13], combining a RTI Builder and the open-source 3D modelling software Blender, enable effective VRTI analysis 3D data for graffiti documentation, here applied due to the large size of the Catacombs of San Gennaro.
While for RTI/HRTI the results depend on the resolution of the camera and the density of the dataset, VRTI well outcome strongly depends on the 3D model resolution. VRTI can be applied to large and complex contexts where HRTI is not feasible, but such applications lack direct comparison with traditional RTI and focus mainly on rendering settings rather than methodological validation. Studies have compared 3D survey methodology and RTI in terms of acquisition time, showing that photogrammetric acquisition is significantly faster than RTI [11]. For this reason, photogrammetry is generally preferred in complex acquisition conditions, such as underwater environments. This is supported by [14], who successfully applied underwater photogrammetry following an on-site acquisition, demonstrating its suitability for challenging and constrained contexts. The core principle of VRTI is the reconstruction of the RTI acquisition workflow and its physical environment within a virtual domain in a virtual environment. Several studies have implemented this approach using different 3D software solutions. Blender is mainly adopted for dome generation and image rendering [13,15]and [16], whereas also employs Autodesk 3ds Max (https://www.autodesk.com/it/products/3ds-max/overview) for the same purposes [14]. However, even though VRTI is a methodology that can be easily replicated due to the extensive use of predominantly open-source software, a standardized pipeline is still lacking. There is no shared framework concerning rendering parameter selection and the automation of the acquisition and processing stages, and also still lacks protocols for assessing the results.
3. Materials and Methods
3.1. The Context
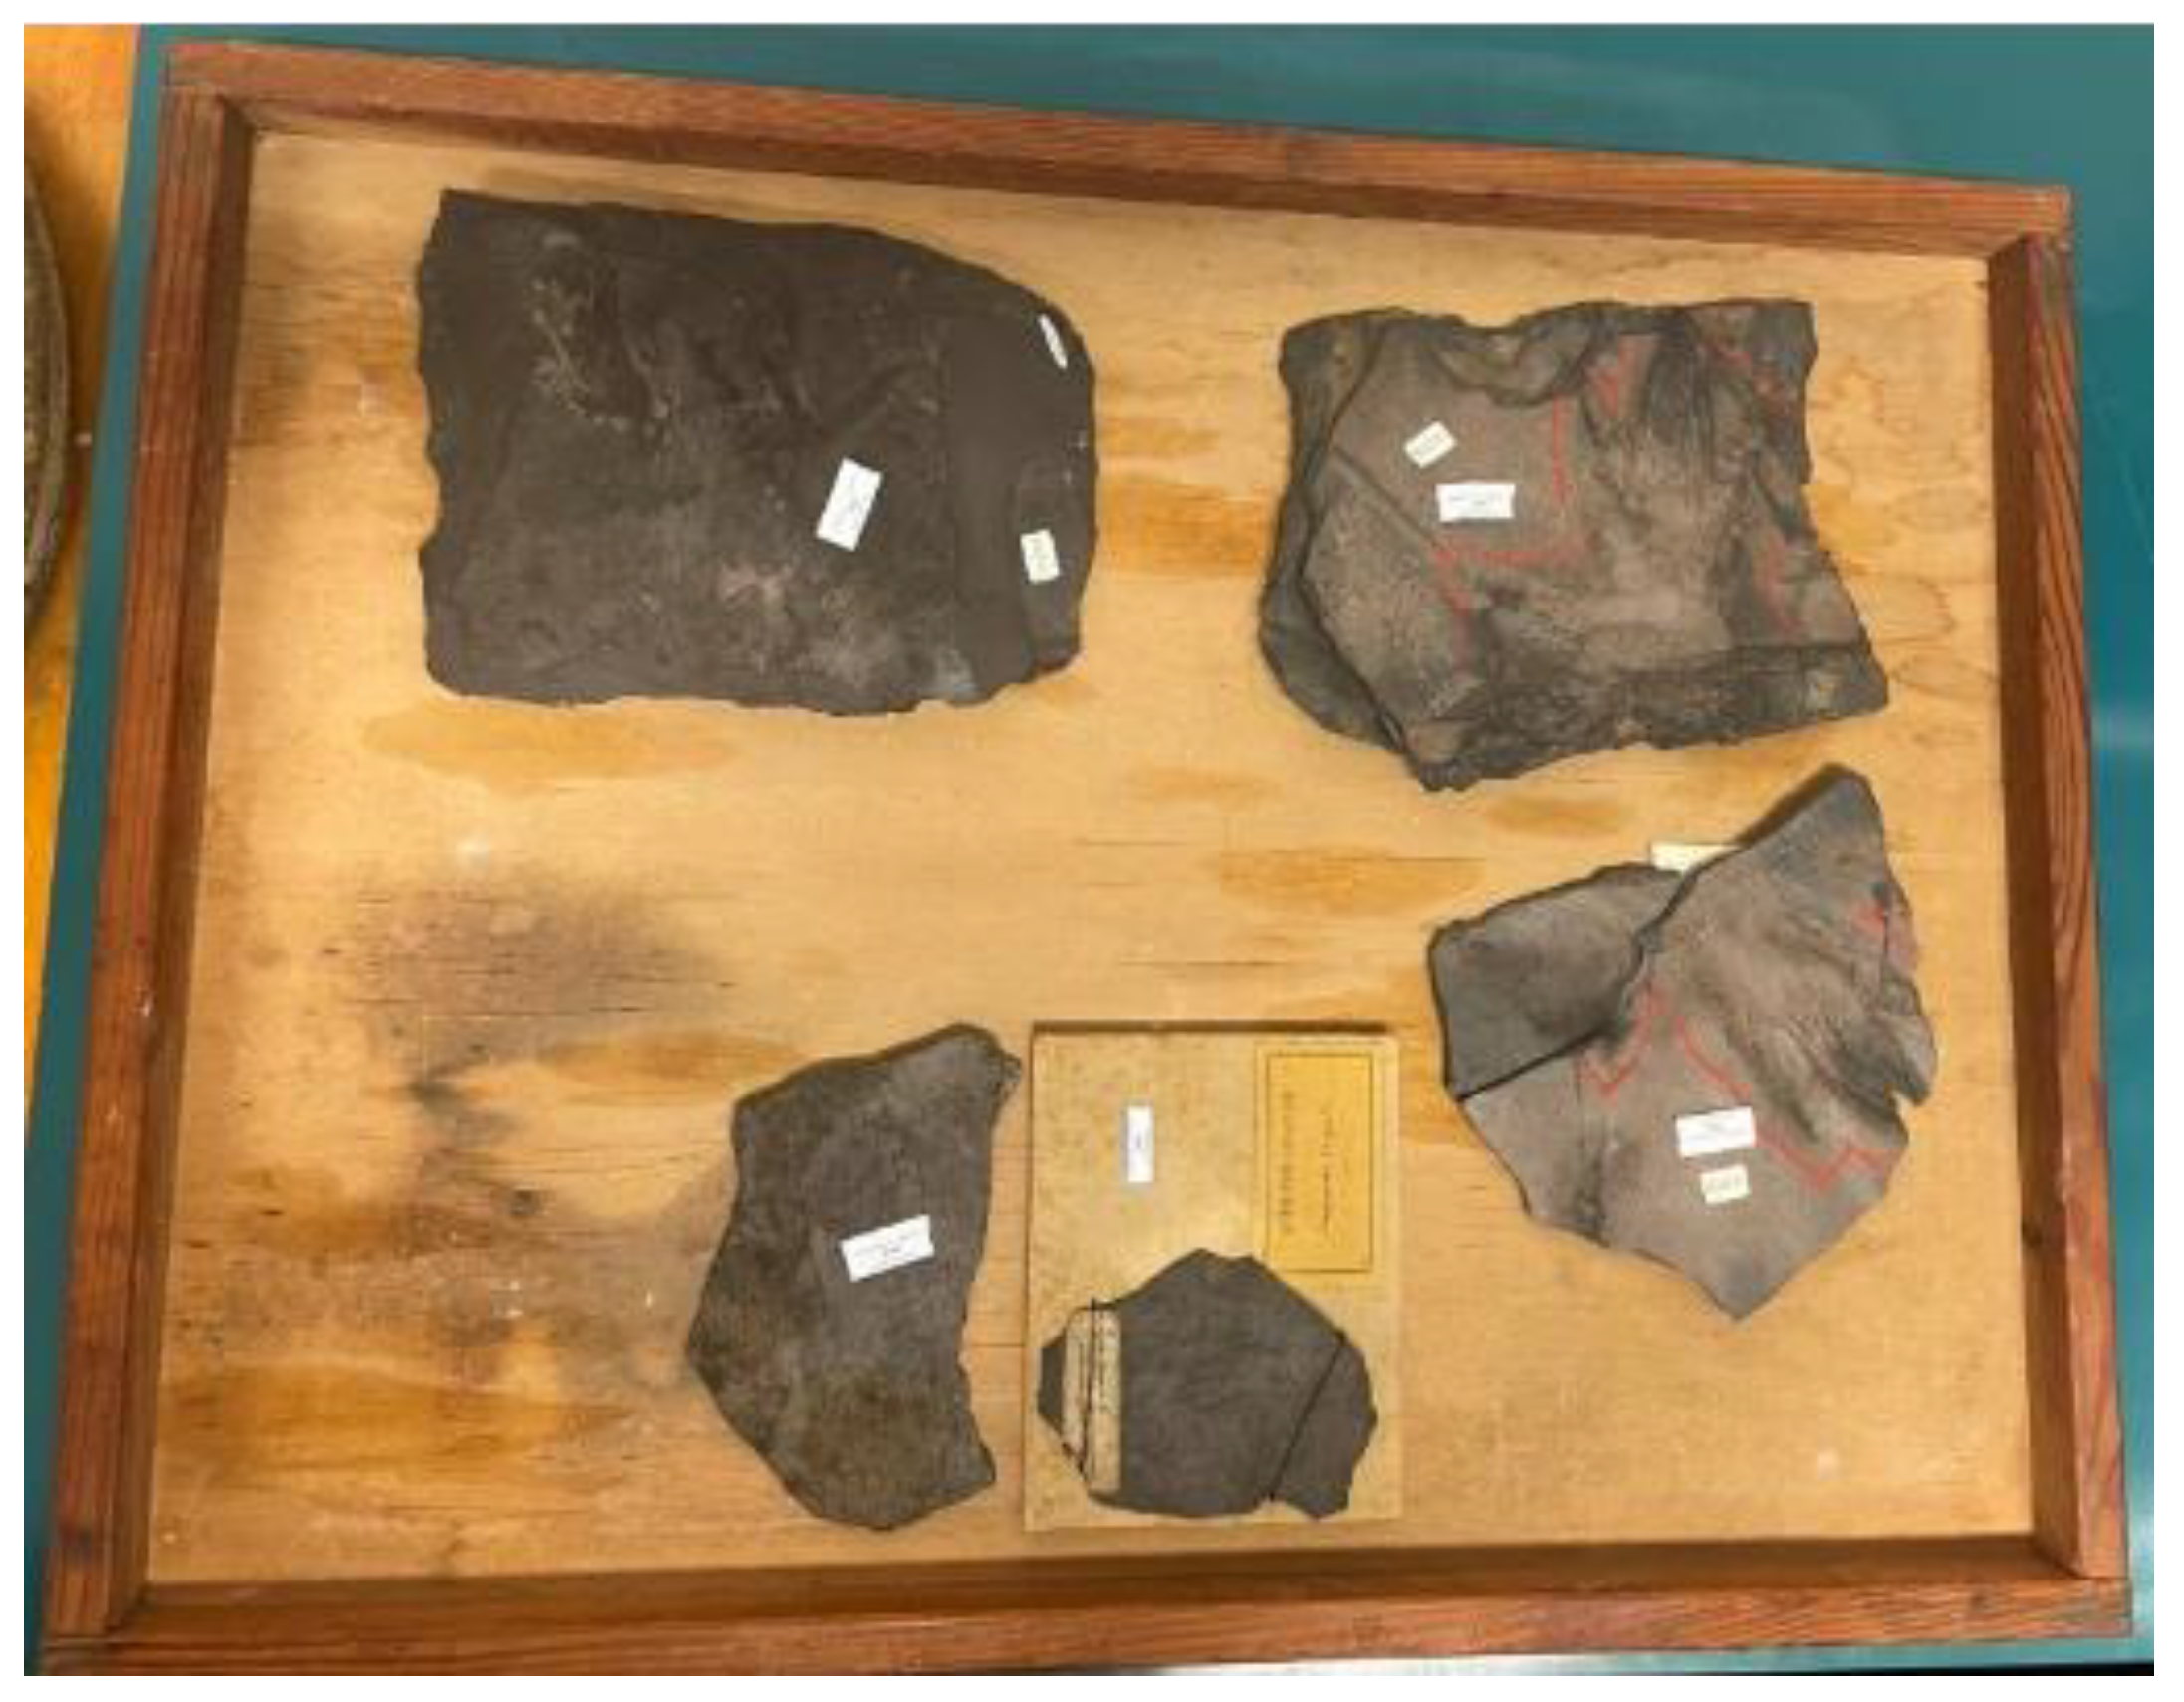
The specimens here tested for RTI are three dinosaur tracks donated by E. Hitchcock to Giovanni Capellini in 1863, at the end of his journey in North America [17]. Tracks were part of a collection of specimens from Massachusetts and Connecticut, now hosted at the Beneski Museum in Amherst College (Massachusetts, USA), which included the first footprints ever described by Hitchcock [3]. Capellini visited Hitchcock and his collection in 1863, and received some fossil track samples from his assistant, Prof. Shepard. These specimens originated from the Connecticut Valley, specifically from the Turners Falls Formation, a unit of the North American Newark Supergroup, which comprises erosional remnants of rift-basin strata formed during the Lower Jurassic at the initial stages of the breakup of Pangea [18]. The tracks have been historically attributed to the ichnogenus Anomoepus, originally diagnosed as “bipedal in gait, the manus impressing only when seated: pes tetradactyl, but functionally tridactyl, digitigrade with an elongated metatarsal segment in evidence when the animal rests” [19,20]. More recently, Anomoepus has been described as an Early Jurassic footprint genus produced by a relatively small, gracile ornithischian dinosaur [21]. It has a pentadactyl manus and a tetradactyl pes, but only three pedal digits normally impressed while the animal was walking. Anomoepus is diagnosed by having the metatarsal phalangeal pad of digit IV of the pes lying in line with the axis of digit III, in combination with a pentadactyl manus [21].
Figure 1.
Dinosaur footprint from Geological Collection of the “Giovanni Capellini Museum”.
3.2. RTI Acquisition
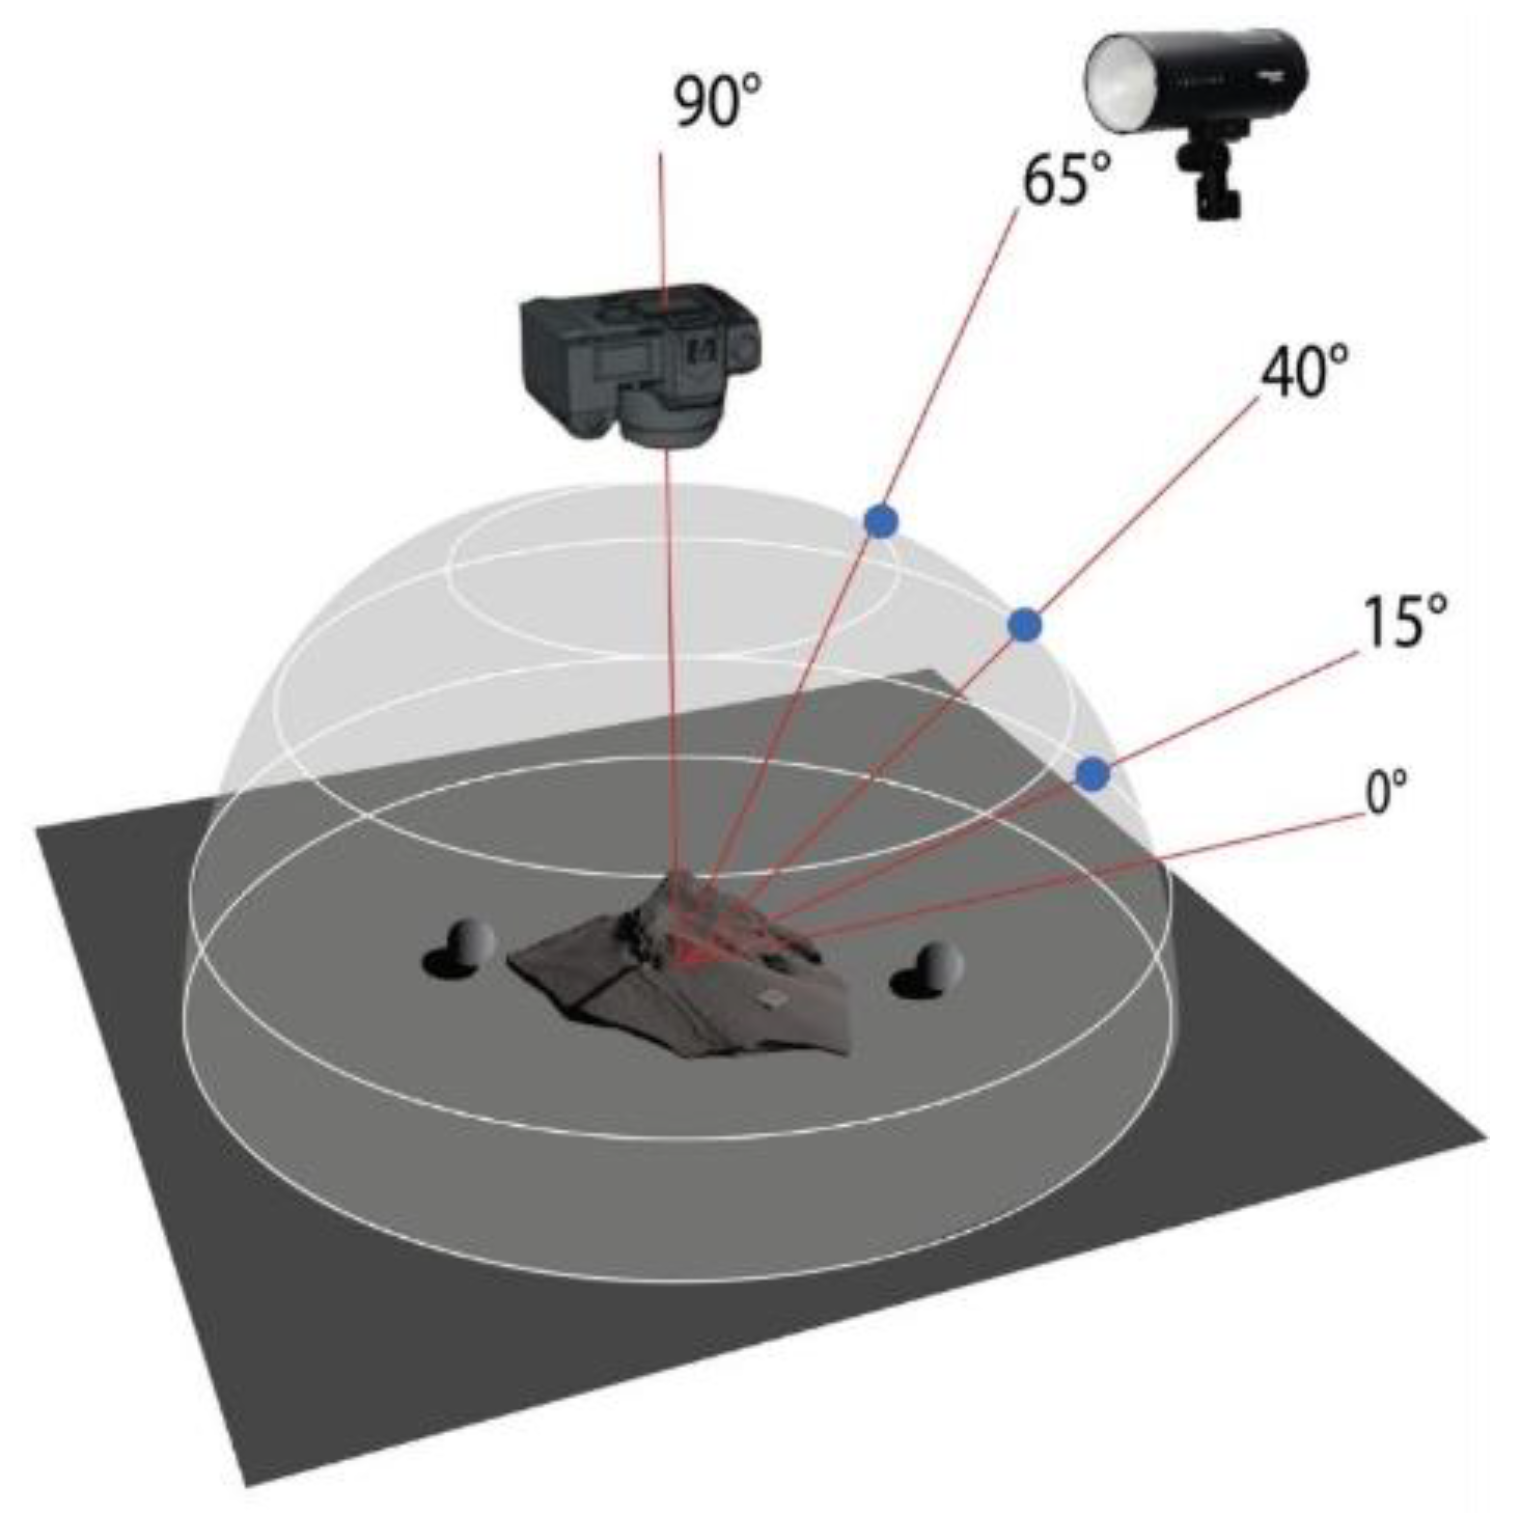
The RTI acquisition was conducted within the museum galleries and required the coordinated involvement of three operators, in addition to the collaboration of the museum curator. The RTI procedure was performed on the footprints using the Hasselblad X2D 100C equipped with a 38 mm lens (f/8, 1/30 s, ISO 400, –1.4 exposure compensation), without flash, in a completely dark environment. Images were recorded in RAW+JPEG format. Illumination was provided by a Profoto B10X Plus, which was manually moved along a circular trajectory around the object at three different heights, while maintaining a constant distance. The footprints (catalogue numbers: MGGC CNA1943, CNA1944, CNA1946) were positioned on a rotating platform against a neutral grey background. Two reflective black spheres were fixed adjacent to the object to enable relighting calculations. Due to the lack of a dome system, the light source had to be manually displaced at three distinct elevations around the object. To ensure a consistent and proportional distance between the light and the subject, a measuring cord attached to the lighting unit was used to maintain a fixed radius (Figure 2).
For each footprint, a dataset of approximately 40 images was acquired. However, during the acquisition of two of the three footprints, minor camera micro-movements occurred, making part of the dataset unusable and reducing the number of valid images to approximately 24 per footprint. An additional factor that negatively affected the surface normal calculation was the use of a matte grey background, which introduced visual interference and contrast issues with the object’s cast shadows during post-processing. The resulting raw files required a compression to be imported and processed in relighting software.
A second acquisition, aimed at obtaining a more accurate and precise dataset, was therefore carried out for one of the three footprints n. CNA1943, on which the assessment procedures were subsequently performed. This session employed a Canon EOS R3 with a 50 mm focal length lens (f/5.6, 1/60 s, ISO 640), again in a completely dark environment. The pipeline was otherwise identical to that previously described, with the exception of the use of a matte black background; the footprint was placed on a rotating platform, while the light was manually moved around the object at three different heights (93 cm, 53 cm, and 30 cm), for a total of 120 images (Figure 1). The resulting RAW images were then imported in Camera Raw software for white balance calibration.
Figure 3.
RTI acquisition scheme.
3.3. 3D Scanning and Virtual Dome: a Standardised Workspace for VRTI Workflow
3.3.1. 3D Acquisition Campaign
To obtain a morphologically accurate three-dimensional model of the three artefacts, an Artec Space Spider II was employed, supported by a turntable. The limited dimensions of the specimens, combined with the use of the round table, enabled a rapid and efficient acquisition of both sides of each artefact, while minimising occlusions and discontinuities between scans. Data were captured according to the parameters detailed in Table 1. During post-processing in Artec Studio 19, the scans underwent preliminary cleaning and alignment, with removal of high-deviation frames and exclusion of the few scans exceeding a 0.2 mm global error or considered substantially compromised to ensure the reliability of the geometric dataset. From the selected scans, highly dense meshes were generated through fusion (Table 1). Minor gap-filling operations were required, primarily in small recesses and undercuts located along the margins of the artefacts, which were not fully accessible to the scanner due to geometric constraints. These semi-automatic filling procedures concerned exclusively peripheral areas that fall outside the palaeontologist’s primary object of interest, namely the footprint. The footprint itself was acquired and processed in its entirety, maintaining full morphological coherence with the original surface and without any loss of geometric information. As discussed in [22], the adopted methodology is grounded in the preservation of multiple versions of the 3D model, differentiated according to their intended use. In the present case, where the dataset supports not only visualisation but also scientific analysis, geometrically dense models were deliberately retained, prioritising morphological resolution and completeness over optimisation for real-time applications. The resulting 3D model constitutes a robust documentary resource, suitable for metric analyses, metadata production and technical documentation, as well as for conservation purposes and long-term deterioration monitoring.
3.3.2. Virtual Dome Creation and Parameters Configuration
Following the generation of the 3D model, the VRTI was performed using the Virtual Dome (VD) specifically created to simulate RTI conditions [23] and generate the dataset required for the subsequent relighting phase (see 3.4). The VD was developed in Blender software. The dome comprised 60 virtual light sources arranged in three horizontal rings at varying heights and diameters, replicating the geometric distribution of the physical RTI dome. Each light was oriented between 40° and 65° relative to the surface, ensuring a consistent and sufficiently wide angular distribution to enhance the visibility of subtle morphological features during the virtual relighting process. Adjacent to the object, two black reference spheres (roughness value: 0.1) were positioned to enable accurate tracking of light vectors during subsequent processing. A fixed virtual camera was positioned at the top of the dome. Preliminary configurations explored different focal lengths, and multiple comparative testing of rendering parameters using the Cycles rendering engine led to the identification of the most suitable configuration in terms of stability, visual clarity, and methodological coherence [23]. In the final workspace, therefore, the virtual camera was configured with a 50 mm focal length, a 36 × 24 mm sensor, and an output resolution of 8K px for render. These parameters have been embedded within a standardized and shareable Blender workspace, with the aim of ensuring consistency across acquisitions and facilitating reproducibility of the virtual RTI protocol. Finally, a custom script was developed with the support of the LLM ChatGPT (https://chatgpt.com/), and integrated within the Blender workspace, to automate the rendering process. From a methodological perspective, the workflow requires: the import and centering of the 3D model (origin set to geometry; coordinates x = 0, y = 0, z = 0); alignment of the reference spheres along the X and Y axes on the same Z-plane as the object; proportional scaling of the predefined light groups (lights1, lights2, lights3) according to the object’s dimensions; and maintenance of a camera orientation perpendicular to the local surface of the object of interest. Camera focal length (default 50 mm), depth of field (focus set on the object), and output resolution (default 8K) are explicitly defined prior to execution but can be modified accordingly with the object of interest and the needed output. Within the script, the output file name and the directory should be manually specified to ensure controlled data storage and operating system consistency. The rendering logic is based on sequential activation of individual light sources: for each render, a single light is enabled while all others are automatically deactivated, thereby generating a complete image set in which each frame is illuminated by one source at a time. Light management relies on the hierarchical folder structure embedded in the Blender file, allowing systematic identification and control of illumination groups. In the present context of a methodological comparison between VRTI and RTI, based on footprint CNA1943, a strict spatial consistency was enforced within the Blender workspace by constraining the 3D model and virtual reference spheres to replicate the exact configuration of the RTI setup reference image. The RTI reference image was imported into Blender to guide the rotation and positioning of the model, ensuring perfect alignment in pixel space and spatial registration, maintaining geometric coherence between the physical and virtual datasets. After completing both the RTI and VRTI acquisition processes, the resulting data consisted respectively of photographic images and rendered images exported in JPG format. For each impression and for each technique, the two datasets were subsequently imported into Relight 2024 version (https://vcg.isti.cnr.it/vcgtools/relight//). The same processing workflow, described in paragraph 3.4, was systematically applied to both RTI and VRTI datasets to eliminate analytical bias and ensure a controlled and reproducible comparison between the two methodologies.
3.4. Relighting: RTI and VRTI
The processing phase consists of generating a .ptm file (Polynomial Texture Map), a reflectance representation format in which per-pixel luminance variation is modelled through polynomial functions of the incident light direction. This format enables interactive relighting of the surface, allowing users to simulate dynamic illumination conditions and thereby enhance the perception of fine morphological features. Prior to processing, the dataset undergoes a selection phase in which RAW images are reviewed, and any out-of-focus captures are excluded. The remaining RAW files are subsequently imported into the Relight 2024 software environment (Figure 4). The initial operation involves manually selecting the two reflective spheres visible in the first image; these spheres are then automatically detected across the remaining image set.
This step is critical for assessing the success of the RTI acquisition process, as even minimal micro-movements may alter the position of the spheres, resulting in images unsuitable for accurate relighting reconstruction. This limitation does not apply to VRTI rendering results, which are obtained within a fully virtual and controlled environment. When the sphere was selected in all the images the operator selects in each image the light source reflected on the sphere, now automatic enabled from Relight 2025 version. Finally, the .ptm file is computed.
3.5. User-Based Evaluation on Footprint Readability
Given the primary aim of this study, namely the development of a tool to support domain experts in the interpretation of paleontological footprints, comparative assessment of footprint readability was conducted between RTI and VRTI. The resulting evaluation protocol was subsequently published on Protocols.io [24]. The aim of the assessment is to quantitatively evaluate whether RTI and VRTI differ in their ability to support the interpretation and delineation of morphological features by palaeontology experts and scholars. Footprint identification in palaeontology typically relies on the delineation (often manual) of the footprint perimeter and the identification of morphological features such as fingers, palm and digit pads. Accordingly, the present assessment was designed to replicate, as closely as possible, the operational conditions and analytical workflow of a professional palaeontologist. A total of 39 users (RTI: n = 19; VRTI: n = 20), were asked to manually delineate selected features of fossilized dinosaur footprints in the CNA1943 case study. After an initial exploration phase using an RTI viewer, where they were asked to identify the coordinates of the best light perspective in their opinion to observe morphological features, participants traced contours on a tablet device (iPad) using Adobe Photoshop (https://www.adobe.com/products/photoshop.html). Two tasks were designed to represent two levels of increasing interpretative complexity:
A. Global contour: outline of the footprint;
B. Local detail: contour of a finer anatomical feature of the second digits (phalanges).
Participants were explicitly instructed to trace only those regions they considered reliable, allowing omissions to reflect interpretative uncertainty.
3.5.1. Materials
The ground truth was established through expert annotation. For each RTI and VRTI file in .ptm format, two high-resolution snapshots (6000×4000px) were captured from the RTI Viewer. These images were subsequently imported into Adobe Photoshop, spatially aligned, and re-exported at a resolution of 3249×2160 pixels under two lighting conditions: (i) diffuse illumination and (ii) raking light (x = 0.71, y = -0.37). A domain expert was asked to evaluate the two lighting conditions and select the one most suitable for morphological interpretation aimed at identifying the footprint perimeter and digital pad features. The raking light condition was selected for subsequent annotation (Figure 5).
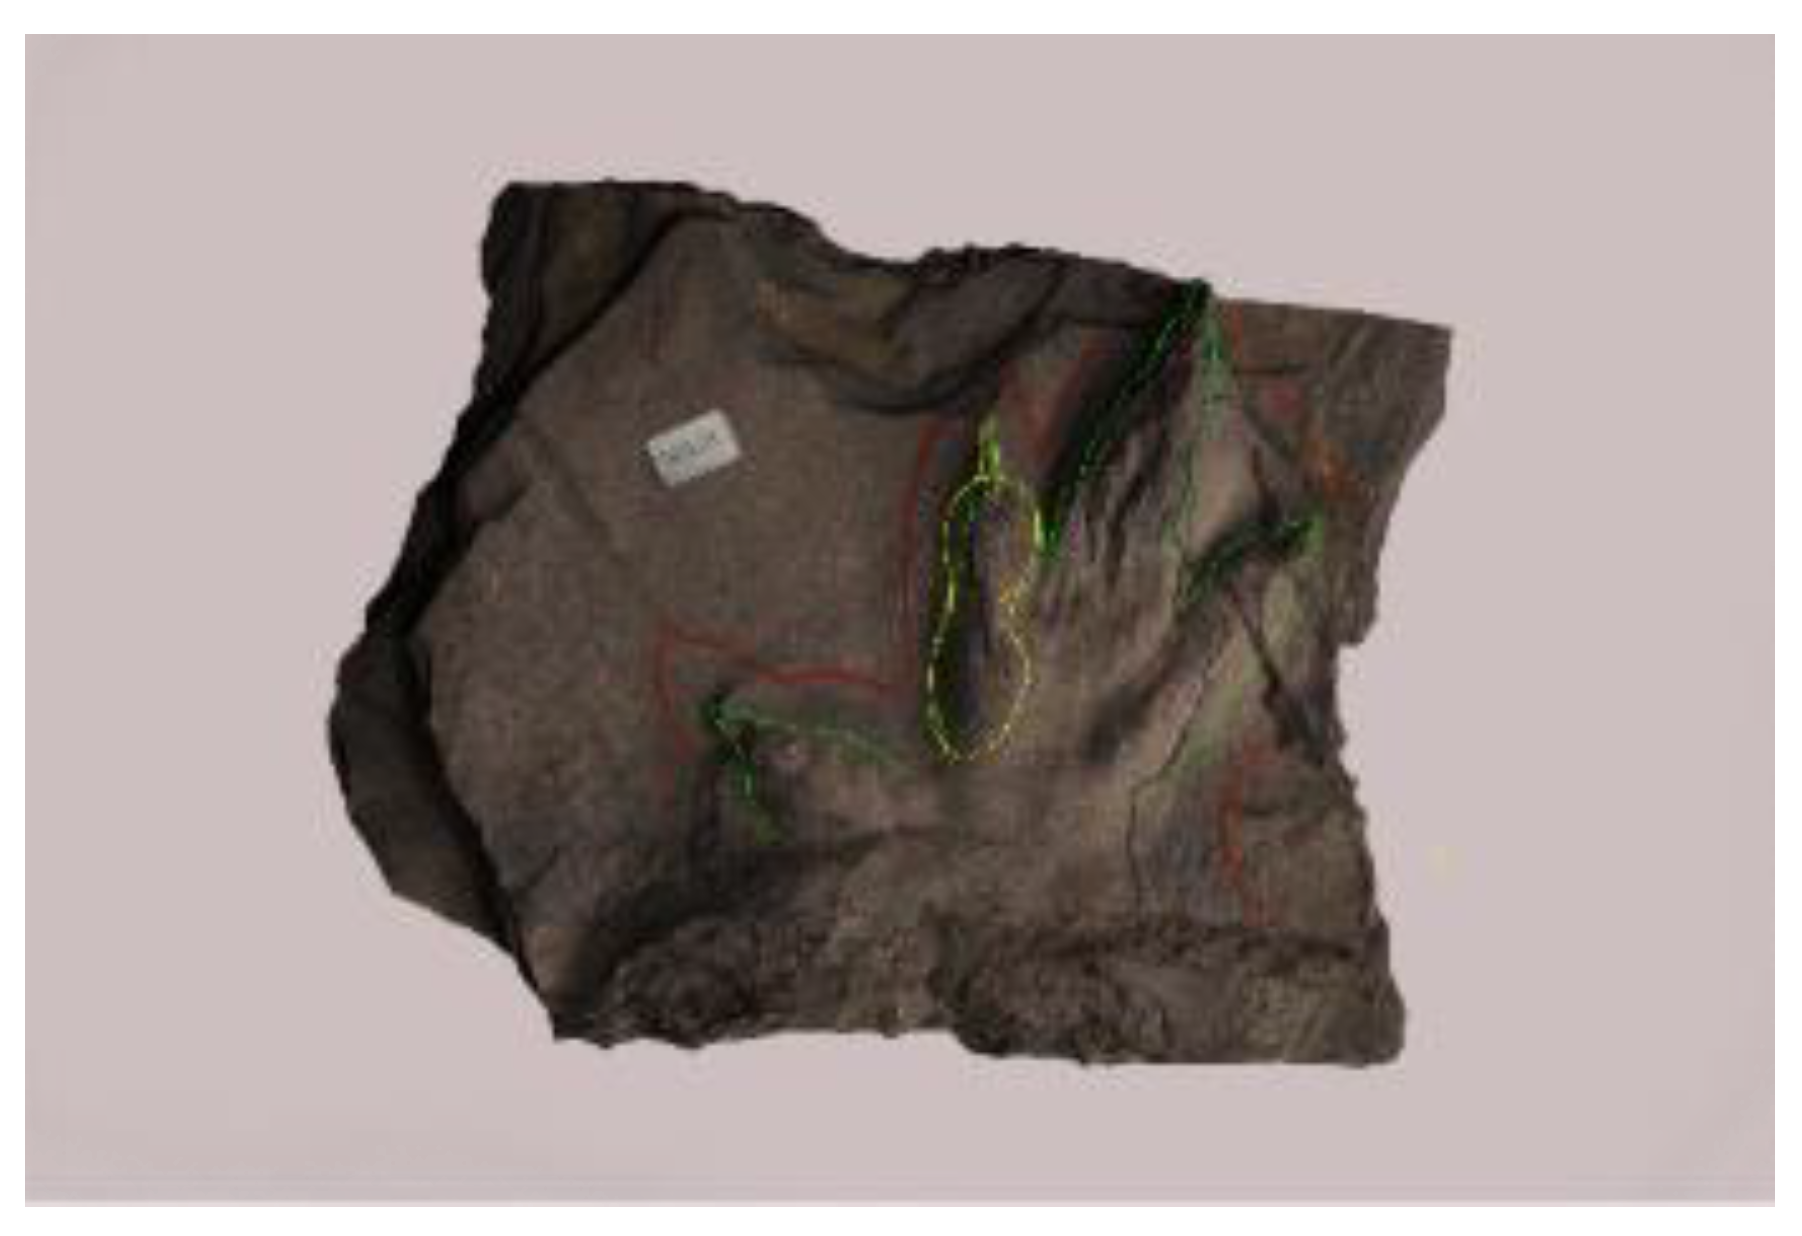
To ensure consistency, particular attention was given to the precise spatial correspondence and resolution matching the generated images, allowing annotations to be directly overlaid without geometric discrepancies. The selected image was then used by the expert to define the ground truth, annotating it in Adobe Photoshop using two separate layers (Figure 6): one for the footprint perimeter [a] and one for the pads of the second digit [b]. Tracing was carried out on an iPad using an Apple Pencil, with standardized and absolute color coding:
A. Green for the footprint perimeter with value RGB (0, 255, 0);
B. Yellow for the digit pad with value RGB (255, 255. 0).
Figure 6.
Ground Truth data: [a] footprint perimeter (green) and [b] local detail (yellow).
3.5.2. Participants and Procedure
Following ground truth definition, the assessment was extended to a cohort of undergraduate students from the master’s degree in Biodiversity and Evolution. A total of 39 fourth-year students attending the Paleobiology course participated in the study. Participants were divided into two groups: RTI (n = 20) and VRTI (n = 19). To ensure a comparable level of domain knowledge, the assessment was conducted during regular class hours at the midpoint of the course. Before starting the testing and illustrative image of the same procedure carried out on a different footprint CNA1946 was shown (Figure 7).
The assessment consisted of two sequential phases carried out by both groups in parallel in accordance with the specific methodology assigned to them:
Phase 1: Interactive Exploration and Lighting Selection
Participants were individually provided with a tablet running RTI Viewer and given 2 minutes to explore the footprint morphology by interactively adjusting the direction of the lighting (Figure 8). At the end of the exploration period, participants were instructed to capture a screenshot representing the lighting configuration they considered most suitable for morphological interpretation (Figure 9).
Phase 2: Morphological Annotation
Participants, divided into RTI and VRTI groups, were then moved to a separate workstation equipped with an iPad and Apple Pencil. A pre-configured Adobe Photoshop file was provided, containing the footprint image on a neutral background and a set of transparent annotation layers. The number of layers corresponded to twice the number of participants, organized in pairs corresponding to (A) perimeter and (B) digit pad annotation.
Each participant was assigned a unique pair of layers and instructed to replicate the expert annotation procedure: tracing the footprint perimeter on layer (A) using a green brush tool and marking the pads of the second digit on layer (B) using a yellow one (Figure 10).
3.5.3. Evaluation Framework
The following section outlines the analytical framework adopted to evaluate the results, combining both quantitative and qualitative approaches. To ensure transparency and reproducibility, a GitHub repository was specifically created for this project (https://github.com/VIDILAB-UNIBO/VRTIandRTI_project/blob/main/VRTIvalidation_workflow_notebook.ipynb). This repository contains a Jupyter Notebook detailing the full analysis workflow step by step, including all scripts used and the resulting datasets. In the interest of full disclosure, it is noted that Large Language Models (LLMs) were used as collaborative tools to support the development and optimization of the Python scripts provided in the analysis.
Three complementary evaluation strategies were employed:
a. Quantitative analysis, based on the comparison between contours traced by participants and the expert-defined ground truth (in both Tasks A global footprint outline and B local anatomical detail). This comparison was implemented through a custom Python pipeline, enabling data analysis and statistical assessment of the comparability between RTI and VRTI as interpretative support tools.
b. Qualitative analysis, based on expert evaluation. The paleontologist who defined the ground truth reviewed the outputs using a 5-point Likert scale, providing domain-specific insights and interpretative commentary. This qualitative layer supports the quantitative findings by contextualizing the observed patterns and highlighting relevant morphological considerations. The analysis of the qualitative scores given by the expert to results has been included in the same Jupyter Notebook, to guarantee completeness of the data obtained.
c. Finally, the preferred lighting perspective selected by participants was analyzed as a secondary integrative layer. By recording the specific light source coordinates (X, Y) chosen to best highlight morphological features, visual perception and subjective interpretation were evaluated across both mediums through statistically significant assessment.
a. Quantitative analysis—data preparation and processing
For what concerns the quantitative analysis approach, first, all contours were exported as PNG images (Figure 11) and processed using a custom Python pipeline. Manually traced contours were isolated based on predefined RGB color values (green for Task A and yellow for Task B) and subsequently converted into spatial data, represented as 2D point sets stored in XYZ format. Each point was defined within a Cartesian coordinate system, where pixel positions were mapped onto the X and Y axes, while the Z coordinate was set to zero.
Following the conversion of raster images into spatial coordinates, a grid-based subsampling [25] was applied to all generated point clouds. This step was necessary to normalize point density across datasets. Subsampling ensures that variations in contour length or thickness do not introduce bias into distance-based metrics such as RMSE. In particular, it prevents longer or denser segments from disproportionately influencing the results. Additionally, it mitigates noise introduced by anti-aliasing effects, ensuring that the statistical comparison reflects geometric accuracy rather than rendering artifacts.
Distance computation
Since students were instructed to delineate only the morphological features they deemed most reliable, two complementary analytical approaches to evaluate their performance were adopted. Both methods rely on cKDTree, a space-partitioning data structure that allows for high-speed Nearest Neighbor (NN) searches [26]. By organizing the point clouds into a binary tree, the algorithm efficiently identifies the minimum distance between any point in the student’s dataset and the corresponding ground truth.
- Unidirectional distance (primary metric)
The primary metric is a unidirectional analysis that calculates the distance from each point in the student’s tracing to the nearest point in the ground truth. This approach is highly consistent with our testing protocol, as it evaluates the accuracy of the traced regions without penalizing omissions. In this context, omitted segments were considered indicators of interpretative uncertainty rather than errors; thus, this metric focuses strictly on the precision of the data provided.
- Bidirectional Chamfer distance (complementary analysis)
As a secondary analysis, a bidirectional (Chamfer) distance was computed [27]. This metric incorporates both local accuracy and contour completeness by calculating distances in both directions: from student to ground truth and vice versa. This enables the assessment of omitted regions, providing a broader overview of how much of the original footprint was successfully identified and traced.
The combined use of unidirectional and bidirectional distance measures allows for a more nuanced interpretation of participant performance. While the unidirectional metric captures local geometric accuracy, the bidirectional metric highlights differences in contour completeness. This distinction can be potentially relevant in contexts where users are encouraged to selectively interpret uncertain features, as it enables the separation of perceptual accuracy from the overall interpretative strategy of the participants. While the current paper details the results of the unidirectional analysis, the corresponding Jupyter Notebook includes the bidirectional script block (provided as commented code). This allows for future reuse and verification, enabling researchers to switch metrics if their objectives prioritize contour completeness over interpretative precision. Furthermore, both the unidirectional and bidirectional CSV datasets have been made available in the project repository.
Statistical analysis and visualization
Distance distributions were summarized using the following metrics:
- Root Mean Square Error (RMSE): used as the primary metric, as it preserves the original measurement units (pixels) while penalizing larger deviations, providing a robust measure of overall geometric accuracy.
- 90th percentile (P90): Calculated to identify the error threshold for 90% of the tracing, offering a reliable representation of typical performance by reducing the influence of extreme outliers.
- Standard Deviation (StdDev): Used to assess the consistency and variability of the tracing stroke across each participant’s dataset.
Maximum distance (Max) and simple mean distance were excluded from the final analysis to avoid sensitivity to isolated input errors (outliers) and to focus on more statistically significant indicators of performance.
Statistical comparisons between RTI and VRTI conditions were performed separately for each task (A and B). Prior to the analysis, the normality of the distributions was assessed using the Shapiro-Wilk test [28]. The test revealed that the primary metric (RMSE) for Task A deviated significantly from normality (p < 0.05). Consequently, a non-parametric Mann–Whitney U test [29] was employed to assess differences between two independent samples (RTI and VRTI). This test was maintained across all comparisons, including those where normality was not strictly violated, to ensure methodological consistency and to provide a robust, conservative estimate given the relatively small sample size (n ≈ 20). Following common practice, a significance threshold of (p < 0.05) was adopted. Additional descriptive statistics (e.g., mean, max and standard deviation) were also computed for each metric to characterize the distribution of contour deviations, enabling a more complete overview within the published CSV datasets.
To compare RTI and VRTI conditions, RMSE values were visualized using boxplots combined with jittered scatter plots. This representation was chosen to provide a transparent view of the entire dataset, displaying medians, interquartile ranges, and individual participant distributions (see Figure 12 in 4.1). This approach is suited for our sample size and aligns with the non-parametric statistical framework adopted, as it does not assume a normal distribution of the data.
b. Qualitative analysis – data preparation and evaluation approach
Regarding the qualitative analysis, a comprehensive presentation was prepared, containing all student results to be reviewed by the domain expert who created the ground truth. The expert was asked to examine each tracing and provide a formal evaluation. The assessment process was structured using a 5-point Likert scale, where a score of 1 is an outline very distant from track morphology and 5 is an optimum outline, corresponding to expert interpretation. To synthesize these findings, mean scores were calculated for each group and task and visualized via comparative bar charts to highlight performance trends and interpretative consistency.
c. Integrating interpretative data: lighting perspective
As a secondary, integrative layer of the evaluation framework, the study provides the analysis of the lighting perspective selected by participants at the end of their exploration phase as best highlighting the morphological characteristics of the artifact.
The lights coordinates were subsequently extracted from the captured screenshots and compiled into a numerical dataset for each participant and condition. Unlike the RMSE metric analysis, which measured execution accuracy relative to the Ground Truth, this study focuses on visual perception and subjective interpretation. The analysis aims to: Identify patterns: Determine whether a shared “optimal light” consensus exists or if the choice is purely subjective.
Evaluate visualization medium impact: Test if the VRTI shifts or distorts the perception of relief compared to traditional RTI visualization. Consistent with the previous analysis, the normality of the lighting coordinate distribution was first verified using the Shapiro-Wilk test, which confirmed a non-normal distribution for several variables. Consequently, statistical significance was assessed using the Mann-Whitney U Test, chosen for its robustness against outliers and its suitability for small, non-normally distributed datasets.
3.6. Validation and Standardisation of the Workspace
After evaluating the readability of the VRTI in comparison with the RTI, a usability evaluation of the virtual workspace developed in Blender was conducted. The primary objective of this assessment was to verify that the workspace ensured a high degree of scalability and adaptability across different types of 3D models, while effectively addressing the needs of Cultural Heritage professionals working with Blender and related 3D technologies. To this end, a heterogeneous group of participants was recruited, including professionals involved in Cultural Heritage digitization as well as users with at least a basic level of familiarity with Blender.
In the first round of testing, six responses were collected from domain professionals. Although this sample is insufficient to ensure statistical validity, it provided valuable preliminary feedback. Subsequently, the test was administered to a class of students enrolled in the second year of Digital Humanities and Digital Knowledge Master’s Degree at the University of Bologna, attending the laboratory of 3D modeling and visualization in Cultural Heritage. Participants were provided with an overview of both the research project and the tool developed prior to testing.
The testing procedure required:
- approximately 15 minutes to set up the workspace and launch the VRTI rendering process;
- approximately 1 hour for rendering, depending on hardware specifications and selected output resolution. This phase did not require active user intervention and could be executed in the background;
- no more than 15 minutes to complete a final anonymous questionnaire.
The questionnaire incorporated the System Usability Scale (SUS), a validated ten-item instrument designed to assess perceived usability [30] (Blattgerste et al. 2022), with the intent of evaluating the usability of the workspace itself rather than the technical performance or expertise of the participants. Before completing the SUS, users were asked to generate a self-selected identification code that did not reveal their identity. Additional questions collected information regarding prior familiarity with the RTI technique and level of experience with Blender, enabling contextual interpretation of the results. An open-ended comments section was included to gather qualitative feedback, complementing the quantitative SUS scores, and supporting a more comprehensive evaluation of the tool. Participants were also invited to share the dataset generated through their VRTI test via SwissTransfer (https://www.swisstransfer.com/it), attaching the folder labelled with their chosen ID. SwissTransfer was selected because it does not store the sender’s email address; the ID served exclusively to associate the submitted dataset with the corresponding questionnaire responses while ensuring full anonymity. In addition to its original functionalities, the script was further extended to automatically export the resulting images in .jpg format along with a .txt paradata file containing the following information: focal length, sensor fit, camera position (XYZ), render engine, resolution, Cycles sample count, and an exported image list (including each filename and the corresponding light name).
4. Results
4.1. Quantitative Results: Unidirectional Point Clouds Analysis
The primary metric used to assess tracing accuracy was the unidirectional RMSE, which measures the distance from each point of the student’s tracing to the nearest point on the Ground Truth. The results obtained are summarized in Figure 12 and Table 2. This approach was chosen to avoid the penalization of intentional omissions. However, it is noteworthy that even when applying the complementary bidirectional metric, the statistical comparison between RTI and VRTI remained non-significant (p > 0.05) for both tasks. This consistency across different analytical approaches confirms that the visualization medium does not fundamentally bias either the accuracy of the tracing or the interpretative completeness of the documentation.
Figure 12.
Distribution of RMSE for Tasks A and B. The boxplots display the median (horizontal line), the interquartile range (box), and the mean (green triangle) for both RTI and VRTI conditions. Distance is expressed in pixels.
Figure 12.
Distribution of RMSE for Tasks A and B. The boxplots display the median (horizontal line), the interquartile range (box), and the mean (green triangle) for both RTI and VRTI conditions. Distance is expressed in pixels.
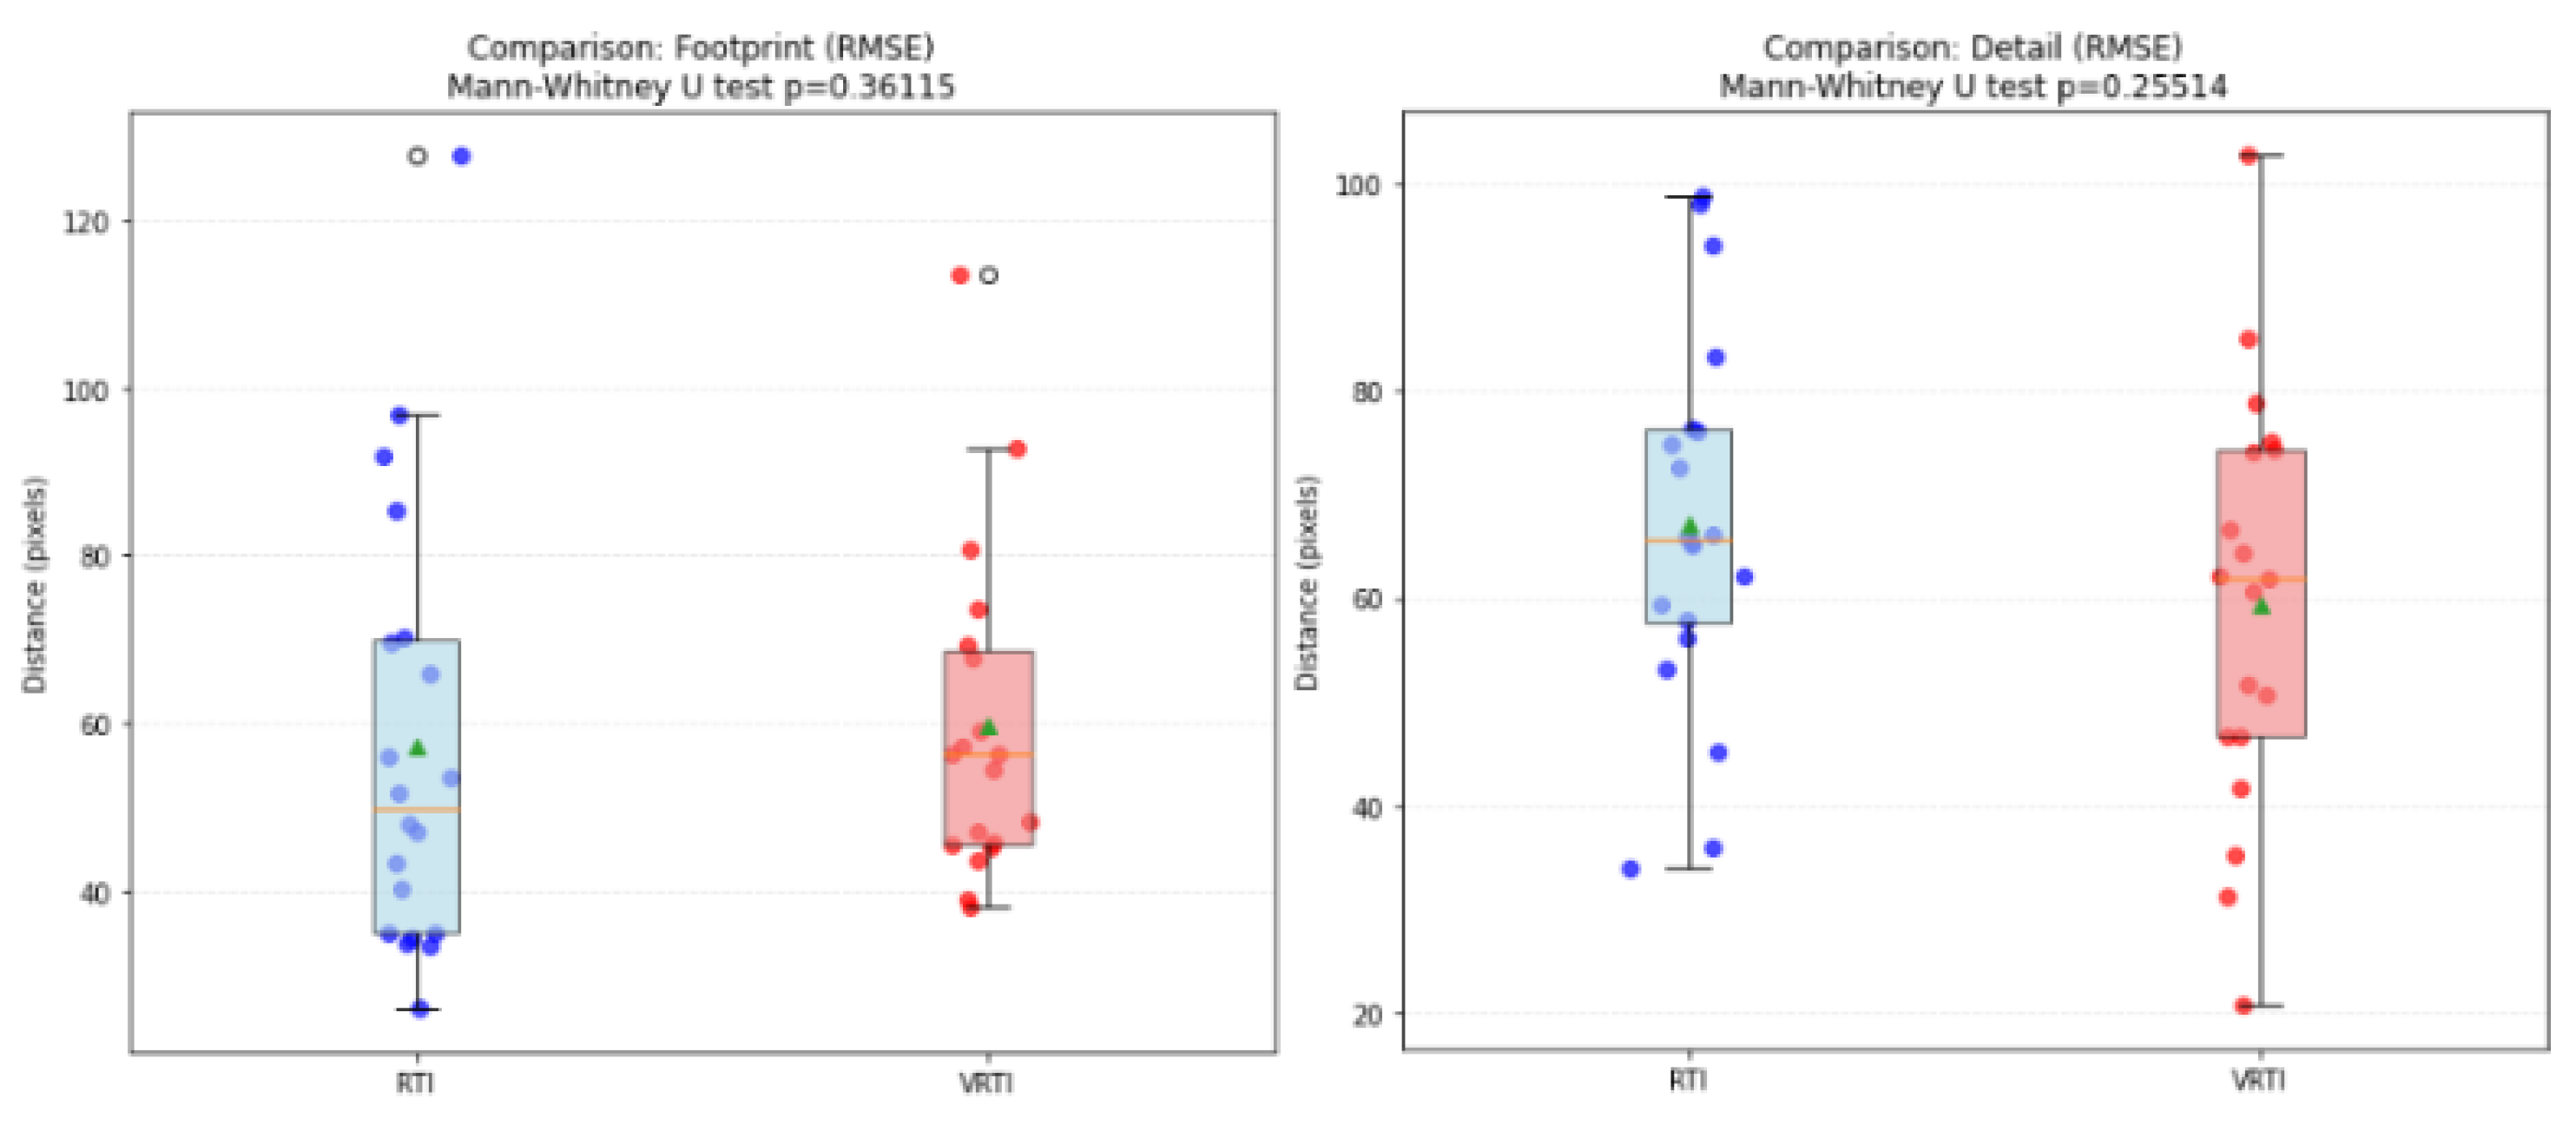
Task A (Footprint): The analysis showed consistency between the two groups. The boxplot (Figure 12) illustrates the distribution of unidirectional RMSE values for the footprint tracing task, comparing the RTI and VRTI groups. Both groups exhibit a similar spread of data, with medians (the orange lines) positioned between 50 and 60 pixels. The interquartile ranges (IQR), represented by the height of the boxes, are largely overlapping, indicating that the overall precision of the participants remained consistent regardless of the visualization medium.
The green triangles indicate the mean values (RTI: 57.30; VRTI: 59.70). The proximity of these means suggests that the VRTI did not introduce any significant bias or distortion in the perception of the general perimeter. The Mann-Whitney U test yielded a p-value of 0.36115. Since this value is considerably higher than the standard significance threshold (p=0.05), it must be concluded that there is no statistically significant difference between RTI and VRTI for the footprint tracing task. Finally, the scatter points (jitter) show a few individual outliers in both groups (points above 100 pixels), which likely represent students who encountered specific interpretative difficulties. However, the core of both samples is concentrated in the lower-error zone (35-70 pixels), demonstrating a high level of “visualization medium transparency” for this specific task.
Task B (Detail): Interestingly, when removing the penalty for omitted regions, the performance gap narrows significantly. In fact, the complementary comparison with the bidirectional (Chamfer) metrics revealed significantly higher RMSE mean values for the Task B (RTI: 187.52; VRTI: 188.45). This discrepancy highlights a specific behavioral pattern: while participants maintained high geometric accuracy in the strokes they produced (low unidirectional RMSE), they frequently omitted complex segments of the detail. As shown by the boxplot (Figure 12), the detail tracing (Task B) reveals a higher degree of individual variability compared to the footprint (Task A), reflecting the increased complexity of interpreting fine morphological features. In this task, the VRTI group achieved a lower mean RMSE (59.46) compared to the RTI group (67.04), as indicated by the green triangles. Despite the lower mean in VRTI, the Mann-Whitney U test (p=0.25514) confirms that the difference is not statistically significant. The interquartile ranges (IQR) of both groups show a substantial overlap, reinforcing the conclusion that both RTI and VRTI are equally valid for high-detail documentation. The vertical spread of the data points (jitter) is more pronounced in this task results. In the VRTI group, a wider range of performance was observed, with some participants achieving exceptionally low error rates (around 20-30 pixels) while others reached over 100 pixels. This highlights that while the visualization medium is transparent, with the virtual rendering (VRTI) performing as reliably as the traditional reflectance data (RTI); the human interpretative factor remains the primary source of variability when dealing with complex morphological details. Given that the errors are measured in pixels, a mean distance of approximately 60 pixels across both groups represents a high level of precision for a manual tracing task performed on high-resolution RTI maps. The transition from Task A to Task B did not significantly increase the RMSE when using the unidirectional metric, proving that students maintained their spatial accuracy even when the subject became more difficult.
4.2. Qualitative Results: Expert Evaluation
The qualitative assessment, based on a 1-to-5 Likert scale provided by a domain expert, corroborates the quantitative trends and is summarized in Figure 13. Outcomes from the test had high variability, for both RTI and VRTI groups and tasks. According to the expert considerations, this result was quite expected as the sample interpretation was not straightforward, and students were at first experience on such topic.
To provide a clear overview of the performance, the bars represent the average score for each category, while the vertical lines (error bars) indicate the variability of the evaluations. A shorter vertical line suggests that the expert’s judgment was consistent across the samples, whereas a longer line reflects a higher degree of variation in the quality of the students’ tracings within that group. The data shows a high level of consistency across all groups, as indicated by the relatively short and uniform error bars. This suggests that the expert perceived a stable level of quality among the participants within each condition, with few extreme outliers, and confirm a substantial stability in interpretative quality between the two platforms for the general footprint (Task A), with mean scores of 2.80 for RTI and 2.63 for VRTI. However, a more pronounced divergence was observed in Task B (Detail). While the quantitative unidirectional RMSE suggested high spatial accuracy in VRTI, the expert assigned a lower qualitative score (2.21) compared to RTI (2.70). Crucially, this perceived ‘hesitation’ is not synonymous with inaccuracy. Complementary bidirectional metrics (Chamfer distance) show that omission rates were statistically equivalent across both groups. This suggests that the expert’s lower rating for VRTI may be a reaction to a more ‘analytical’ or ‘fragmented’ tracing style rather than a failure of the medium to convey morphological truth.
4.3. Lighting Perspective And Spatial Behavior
The statistical comparison of the selected lighting coordinates is summarized in Table 3. Figure 14 shows the representative lighting perspective generated by applying the mean lighting coordinates (x, y) to the dynamic light source.
The scatter plot (Figure 15) reveals a high degree of dispersion across the hemispherical domain. The absence of a single, dense “cluster” suggests that there is no universal standard shared point for illumination. Instead, students identified relevant details from a wide variety of angles, indicating that the perception of the artifact’s micro-topography is highly individual. A clear trend is observable as most selections (both RTI and VRTI) gravitate toward the edges of the unit circle (values approaching 1.0 or -1.0). This confirms a natural preference for low angle grazing light, which maximizes micro-shadows and enhances the legibility of the footprint’s surface relief. The p-values (0.36 and 0.34) are significantly above the threshold. This is a key finding: the visualization medium, whether real (RTI) or virtual (VRTI), does not statistically influence the lighting choice and the overall “spatial behaviour” remains comparable across both groups. Given the high variance, the Scatter Plot proves to be the most effective diagnostic tool.
4.4. SUS Results Of VRTI Workspace
Referring to paragraph 3.6, a pilot usability evaluation of the VRTI workspace in Blender was administered anonymously to eleven participants. The test was administered anonymously to a heterogeneous group in terms of proficiency with 3D tools for Cultural Heritage and RTI applications. The questionnaire begins with two preliminary questions aimed at assessing participants’ prior familiarity with both the RTI methodology and the Blender environment with ratings ranging from 1 to 5 (Figure 16).
The users involved answered an average of 2.4 to the first question related to the RTI, and 2.9 for Blender. Given the limited sample size, the results should be interpreted as preliminary evidence aimed at identifying usability trends and potential areas for improvement, with the average being heavily influenced by individual responses, resulting in a high dispersion of scores. In addition to the mean, the median was also calculated: 2 for RTI familiarity; and 3 for Blender proficiency, providing a more robust measure of central tendency. These questions were included to contextualize the usability results and evaluate the potential influence of previous technical expertise on user performance and confidence. Usability was evaluated through the standard 10-item System Usability Scale (SUS) (https://www.surveylab.com/blog/system-usability-scale-sus/). Responses were exported as CSV data and processed using the SUS scoring tool ( https://sus.mixality.de/). Following the standard SUS methodology, odd-numbered items were scored using the formula (x − 1), while even-numbered items were scored using (5 − x) due to their negative wording. The resulting values were normalized on a 0–10 scale and converted into a final SUS score on a 0–100 scale. The system obtained an average SUS score of 67.7/100, with a median value of approximately 66-67. According to standard SUS interpretation guidelines, this result indicates an acceptable and slightly above-average level of usability. Nevertheless, the distribution of responses revealed considerable variability among participants: half of the participants scored between 57-84; the minimum was 40 to the utmost 90. The user experience presents a high dispersion in resulting scores (Figure 17). This variability suggests that the user experience was probably strongly influenced by differences in prior familiarity with Blender and 3D environments.
As shown in Table 4, the lowest-scoring items were associated with user confidence and perceived complexity, particularly questions 8, 9, and 10, as shown in the radar graph. Question 9 (“I felt very confident using the system”) received the lowest normalized contribution score (5.45), indicating that less experienced users may have encountered uncertainty while interacting with the workflow. Qualitative feedback supports this interpretation, as several participants reported difficulties related not to the script itself, but to Blender-specific operations such as lighting setup, scaling, and camera configuration. At the end of the questionnaire, participants were invited to provide optional open-ended comments. The feedback highlighted both the perceived usefulness of the system and the importance of prior Blender expertise. While experienced users described the workflow as clear and straightforward, novice users suggested the inclusion of additional onboarding materials, such as short video tutorials or guided setup instructions, to facilitate the initial learning process.
Based on these findings, the finalized workspace was made publicly available through a dedicated GitHub repository (https://github.com/frafrabbiu/VRTI_dome) as a reusable FAIR-compliant digital resource. Its publication is intended to facilitate the adoption of the validated VRTI workflow, promote reproducibility, and support its reuse in future Cultural Heritage and ichnological applications. The repository includes the complete workspace together with a comprehensive README file providing step-by-step instructions for setting up the virtual dome and performing VRTI acquisitions on any 3D model, thereby facilitating both the implementation of the workflow and its reuse by future users.
5. Discussion
The evaluation of RTI and VRTI was structured around two complementary dimensions: an operational dimension, concerning acquisition procedures, workflow efficiency, and practical applicability; and an interpretative dimension, concerning the extent to which each visualization approach supports footprint readability and scientific analysis. This distinction allows both the methodological implications of the two techniques and their impact on the interpretative process to be considered. With respect to the operational dimension of RTI and VRTI workflows, the RTI acquisition of the footprints revealed significant acquisition constraints. In the context of the acquisition of the three footprints the initial dataset suffered from subtle micromovements during data capture, which compromised data consistency and necessitated a complete re-acquisition. This issue, while not unexpected, is particularly relevant given that the acquisition took place in a museum environment, which is considerably more controlled and adjustable than typical excavation contexts where footprints usually are documented. The second acquisition produced a higher number of images (120) and improved texture resolution; however, this outcome was achieved only through an iterative process. In contrast, the VRTI setup demonstrated substantially greater operational simplicity, requiring fewer adjustments and enabling a more stable and user-friendly acquisition workflow for the operator. Moreover, one of its main advantages compared to traditional RTI is that it can be applied retrospectively to existing 3D datasets, including models originally acquired for documentation or research purposes during fieldwork, excavation activities, or subsequent study phases. Provided that the model preserves a sufficiently detailed representation of the surface geometry, VRTI analyses can be replicated without the need for additional acquisition campaigns, thereby extending the scientific and analytical value of already available digital resource. Regarding the visual dimension, comparative studies are generally focused on technical aspects of image quality, such as rendering fidelity, or the analysis of normal maps derived from the acquisition process. While these approaches provide valuable information on the graphical and geometric characteristics of the resulting visualizations, they offer limited insight into how the visual medium affects the scientific interpretation of paleontological footprints, since such metrics and approach are not considered diagnostically relevant within ichnological studies. Instead, the comparative analysis between RTI and VRTI was based on footprint readability, thereby addressing the subjective and perceptual visualisation dimensions of footprint analysis that are central to ichnological interpretation. The results revealed a fundamental consistency in user performance across both techniques. This outcome suggests that the visualization medium is largely “transparent” to the operator, with interpretative results being minimally influenced by the choice of rendering approach. The combination of spatial data and expert feedback suggests that VRTI is a perceptually reliable tool, underscoring that, in the field of footprint research, the human interpretative factor is significantly more influential than the technological tool itself. Indeed, although the VRTI data is a synthetic reconstruction, it did not introduce any perceptual bias or geometric distortion. Students approached the virtual model with the same interpretative strategies as the real RTI data, confirming that the high-resolution 3D surface successfully preserves the critical information needed for paleontological documentation.
In Task B, therefore, where error rates vary widely (from 20 to over 100 pixels) within the same experimental group, it becomes clear that the complexity of the morphological details poses a cognitive challenge that transcends the digital interface. The wide range of performance highlights that when a subject is difficult to interpret (e.g., the fine details of a digital pad), the individual’s subjective perception and experience become the dominant variables. The fact that statistical testing (Mann-Whitney U, p > 0.05) showed no significant difference between the two groups validates the VRTI workflow as ‘perceptually transparent’, indicating that the technology integrates seamlessly into the user experience and does not draw attention away from the task being performed.
Although the VRTI data is a synthetic reconstruction, it did not introduce any perceptual bias or geometric distortion. Students approached the virtual model with the same interpretative strategies as the real RTI data, confirming that the high-resolution 3D surface successfully preserves the critical information needed for paleontological documentation. This human-centric finding is further supported by the lighting perspective analysis. The extreme subjectivity in choosing the “best” light angle (with choices scattered across the entire hemispherical domain) proves that there is no universal technological solution for perfect visibility. The ability to identify paleontological features remains a dialogue between the observer’s eye and the light, regardless of whether that light is calculated from physical reflectance or simulated through a virtual environment.
While technology is transparent in terms of accuracy, the lower qualitative scores from the expert and the omissions seen in the bidirectional data suggest that the virtual medium might still induce a more cautious or fragmented interpretative behavior. This may be due to the subtle differences in how shadows are rendered on a 3D mesh compared to a traditional RTI file, leading students to only trace what they felt was absolutely certain. The divergence may be induced by the dynamic lighting of the 3D environment, RTI was acquired through digital photography in ideal lighting conditions, whereas VRTI textures derived from scanning. For a deeper analysis of the results, the same evaluation process used for RTI and VRTI is likely to be applied between a traditional RTI acquisition and a hybrid VRTI acquisition based on structured light scanning combined with photogrammetry, in order to evaluate how much the texture photorealism impacts on the footprint readability and visual interpretation. However, while the expert perceived a more ‘hesitant’ style in VRTI, the quantitative data provides a necessary corrective to this subjective impression: the bidirectional metrics confirm that omissions were consistent across both platforms (RTI: 187.52; VRTI: 188.45). This proves that the challenge lies in the cognitive interpretation of the fossil itself (the ‘eye of the observer’) and that the VRTI medium preserves the same informational depth as traditional RTI without introducing additional interpretative bias on the footprint readability and visual interpretation. Despite the consistency of the results, the limited sample size of n ≈ 20 participants per group makes the study sensitive to individual variability. While the Mann-Whitney U test provided robust results, a larger sample might help turn the observed “trends” in Task B into definitive statistical significance.
The results of the comparative evaluation provided the methodological foundation for the subsequent usability assessment of the Blender workspace. Having demonstrated that VRTI does not compromise footprint readability or interpretative accuracy, the SUS evaluation was conducted to determine whether the proposed workflow could also meet the practical requirements of scalability, accessibility, and adoption by Cultural Heritage professionals. In terms of usability of the workspace for VRTI, the SUS evaluation suggests, at a pilot study level, that the proposed system achieves a satisfactory level of usability and integration within the Blender environment, while also highlighting the need for additional guidance for users with limited experience in 3D software workflows. The results indicate a generally positive perception of the interface, although a certain degree of variability emerged among participants’ evaluations. The aspects most positively perceived by participants were the usefulness of the workspace and its learnability after an initial familiarisation period. The main usability issues were reported by users with lower proficiency in Blender, who appeared to experience increased cognitive load and occasional disorientation when interacting with the different functionalities provided within the software environment, as observed during the evaluation session. It should also be noted that the workflow assumes a basic-to-intermediate familiarity with 3D modelling and visualization software, as VRTI analysis requires interaction with 3D models within modelling environments such as Blender. Therefore, the inclusion of participants without prior experience in 3D environments may have influenced the usability scores negatively. Overall, the workspace can be considered functional and sufficiently usable; the findings also suggest that further refinements could improve accessibility, reduce cognitive complexity, and support a higher overall level of usability. However, the sample size is very limited (n = 11), which restricts the reliability and generalisability of the findings. For robust and statistically sound conclusions, the sample would need to be substantially expanded. Consequently, these results should be interpreted as those of a preliminary pilot study.
6. Conclusion
This study contributes to the ongoing development of standardized and reproducible workflows for the analysis of paleontological footprints by introducing both a FAIR-compliant VRTI workspace and a structured protocol for comparing RTI and VRTI visualizations. RTI has proven to be a valuable tool for documentation of paleontological footprints. However, despite its widespread adoption, the lack of a standardized methodological framework for analysis and comparative interpretation remains a significant limitation. This study introduced structured evaluation protocols aimed at addressing key open challenges and defining a reproducible workflow for VRTI within a FAIR-compliant, open-source environment implemented in Blender. The comparative evaluation protocol (Ammirati et al. 2026) between RTI and VRTI confirms that both approaches yielded comparable performance in terms of footprint readability particularly under raking light conditions, supporting its central role in ichnological visualization workflows. Importantly, statistical analysis revealed no significant differences between the two modalities (Mann–Whitney U, p > 0.05), indicating that VRTI does not introduce measurable perceptual bias or loss of interpretative information. Overall, the results suggest that variability in interpretation is primarily driven by the cognitive complexity of the morphological features rather than by the choice of visualization technology. The proposed VRTI workspace demonstrated improved configurability and scalability across different acquisition scenarios, supported by standardized naming conventions and metadata structures to ensure reproducibility. The usability assessment (SUS) indicates an overall acceptable level of usability, although results from the pilot study (n = 11) highlight variability linked to prior experience with 3D software and suggest the presence of cognitive load during initial interaction, as well as the need for further testing with a larger and more diverse user base. These challenges could be mitigated through the integration of additional tutorials and supporting documentation. Ultimately, while the interpretation of footprints and tracks in ichnology inherently retains a degree of subjectivity, VRTI offers a promising complementary analytical tool for revising and comparing published material when 3D models are available. An important strength of VRTI lies in its ability to be applied retrospectively to existing high-resolution 3D datasets, enabling new analyses without requiring additional acquisition campaigns and thus maximizing the long-term scientific value of digital archives. This capability is particularly valuable when field acquisition conditions are less than optimal, as virtual relighting can enhance feature visibility and support more effective interpretation. Although the results provide encouraging evidence for both the scientific validity of VRTI and the usability of the proposed workspace, further validation involving larger and more diverse participant groups, together with a broader range of ichnological datasets, will help consolidate the statistical robustness and generalisability of the proposed methodology. This line of research will contribute to the consolidation of a standardized VRTI workflow and support its potential extension beyond paleontological applications into the broader field of Cultural Heritage documentation and analysis.
7. Patents
Author Contributions
Conceptualization, F.F.; methodology, F.F., A.B., L.A.; software, F.F.; validation, M.C., formal analysis, A.B.; investigation, F.F., A.B.; resources, M.C.; data curation, A.B., F.F; writing—original draft preparation, A.B., M.C., F.F; writing—review and editing, L.A., M.A., A.B., F.F.; visualization, A.B. All authors have read and agreed to the published version of the manuscript.” Please turn to the CRediT taxonomy for the term explanation. Authorship must be limited to those who have contributed substantially to the work reported.
Funding
This work has been partially funded by Project PE 0000020 CHANGES—CUP B53C22003780006, NRP Mission 4 Component 2 Investment 1.3, Funded by the European Union—NextGenerationEU.
Data Availability Statement
The PTM files used in this study are publicly available at Fabbri, F., Bordignon, A., Ammirati, L.& Contessi, M. (2026). PTM Files of Dinosaur Footprint CNA1943 (RTI and VRTI) [Graphic]. Zenodo. https://doi.org/10.5281/zenodo.21334701. The raw RTI and VRTI files, as well as the experimental datasets generated and analyzed during the current study, are not publicly available because this work reports the results of a pilot study with a limited number of participants. The data are available from the corresponding author upon reasonable request.
Acknowledgments
The authors would like to express their sincere gratitude to Professor Federico Fanti of the University of Bologna for generously dedicating his time and making his students available for the user-based evaluation. During the preparation of this manuscript, the authors used a large language model (LLM)-based tool to support language editing and paraphrasing for clarity and readability, and to assist in the formulation of a provisional paper title. All outputs generated with the assistance of these tools were carefully reviewed, verified, and revised by the authors. The authors take full responsibility for the content of the manuscript.
References
- Won, S.; Kong, D.-Y. Application of RTI to Improve Image Clarity of a Trace Fossil Cochlichnus Found from the Jinju and Haman Formations. Econ. Environ. Geol. 2023, 56, 397–408. [Google Scholar] [CrossRef]
- Hitchcock, E. Ornithichnology. Description of the Foot Marks of Birds Ornithichnites) on New Red Sandstone in Massachusetts.; 1836. [Google Scholar]
- Hitchcock, E. Ichnology of New England: A Report on the Sandstone of the Connecticut Valley, Especially Its Fossil Footmarks. 1858.
- Falkingham, P.L.; Bates, K.T.; Avanzini, M.; Bennett, M.; Bordy, E.M.; Breithaupt, B.H.; Castanera, D.; Citton, P.; Díaz-Martínez, I.; Farlow, J.O.; et al. A Standard Protocol for Documenting Modern and Fossil Ichnological Data. Palaeontology 2018, 61, 469–480. [Google Scholar] [CrossRef]
- Falkingham, P.L. LOW COST 3D SCANNING USING OFF-THE-SHELF VIDEO GAMING PERIPHERALS. [CrossRef] [PubMed]
- Belvedere, M.; Bennett, M.R.; Marty, D.; Budka, M.; Reynolds, S.C.; Bakirov, R. Stat-Tracks and Mediotypes: Powerful Tools for Modern Ichnology Based on 3D Models. PeerJ 2018, 6, e4247. [Google Scholar] [CrossRef] [PubMed]
- Thulborn, T. Dinosaur Tracks; Chapman & Hall, 1990. [Google Scholar]
- Graversen, O.; Milàn, J.; Loope, D.B. Dinosaur Tectonics: A Structural Analysis of Theropod Undertracks with a Reconstruction of Theropod Walking Dynamics. J. Geol. 2007, 115, 641–654. [Google Scholar] [CrossRef] [PubMed]
- Milàn, J.; Loope, D.B. Preservation and Erosion of Theropod Tracks in Eolian Deposits: Examples from the Middle Jurassic Entrada Sandstone, Utah, U.S.A. J. Geol. 2007, 115, 375–386. [Google Scholar] [CrossRef]
- Greaves, A.M.; et al. Field Trials of Virtual Reflectance Transformation Imaging (VRTI): A New Technique for Reading and Recording Rock-Cut Inscriptions. University of Liverpool Repository. 2020. Available online: https://livrepository.liverpool.ac.uk/3087505/ (accessed on 8 July 2026).
- Looten, J.; Gravina, B.; Muth, X.; Villaeys, M.; Bordes, J.-G. Towards a More Robust Representation of Lithic Industries in Archaeology: A Critical Review of Traditional Approaches and Modern Techniques. Peer Community J. 2025, 5, e52. [Google Scholar] [CrossRef]
- Mytum, H.; Peterson, J.R. The Application of Reflectance Transformation Imaging (RTI) in Historical Archaeology. Hist. Arch. 2018, 52, 489–503. [Google Scholar] [CrossRef]
- Minucci, E.; Bosco, A.; De Luca, D. Virtual RTI Application on 3D Model for Documentation of Ancient Graffiti: Proposal of a Methodology for Complex Archaeological Sites. AeC 2023, 34, 59–68. [Google Scholar] [CrossRef]
- Hairy, I.; Abdelaziz, M.; Elsayed, M. 3D Technologies on the Underwater Archaeological Site of the Ancient Lighthouse of Alexandria (Egypt). Digit. Herit. 2025. [Google Scholar] [CrossRef]
- Di Iorio, F.; Es Sebar, L.; Croci, S.; Taverni, F.; Auenmüller, J.; Pozzi, F.; Grassini, S. The Use of Virtual Reflectance Transformation Imaging (V-RTI) in the Field of Cultural Heritage: Approaching the Materiality of an Ancient Egyptian Rock-Cut Chapel. Appl. Sci. 2024, 14, 4768. [Google Scholar] [CrossRef]
- Dulecha, T.G.; Fanni, F.A.; Ponchio, F.; Pellacini, F.; Giachetti, A. Neural Reflectance Transformation Imaging. Vis. Comput 2020, 36, 2161–2174. [Google Scholar] [CrossRef]
- Capellini, G. Ricordi Di Un Viaggio Scientifico Nell’America Settentrionale Nel 1863; Bologna.
- Olsen, P.E. STRATIGRAPHIC RECORD OF THE EARLY MESOZOIC BREAKUP OF PANGEA IN THE LAURASIA-GONDWANA RIFT SYSTEM. [CrossRef] [PubMed]
- Hitchcock, E. An Attempt to Discriminate and Describe the Animals That Made the Fossil Footmarks of the United States, and Especially of New England. In Memoirs of the American Academy of Arts and Sciences; 1848. [Google Scholar]
- Lull, R.S. Fossil Footprints of the Jura–Trias of North America. In Memoirs of the Boston Society of Natural History; 1904. [Google Scholar]
- Olsen, P.; Rainforth, E. The Early Jurassic Ornithischian Dinosaurian Ichnogenus Anomoepus. 2003, 2. [Google Scholar] [PubMed]
- Barzaghi, S.; Bordignon, A.; Collina, F.; Fabbri, F.; Fanini, B.; Ferdani, D.; Gualandi, B.; Heibi, I.; Mariniello, N.; Massari, A.; et al. A Reproducible Workflow for the Creation of Digital Twins in the Cultural Heritage Domain. Transform. A DARIAH J. 2025, 1. [Google Scholar] [CrossRef]
- Ammirati, L.; Bordignon, A.; Collina, F.; Fabbri, F.; Ferdani, D.; Rega, M.F.; Sullini, M. 3D Digitisation for Geological and Paleontological Specimens: Challenges and Solutions. Digit. Herit. 2025. [Google Scholar] [CrossRef]
- Ammirati, L.; Bordignon, A.; Contessi, M.; Fabbri, F. Comparative Assessment Protocol of Readability Using RTI and VRTI. 2026. protocols 2026. [Google Scholar] [CrossRef] [PubMed]
- Lyu, W.; Ke, W.; Sheng, H.; Ma, X.; Zhang, H. Dynamic Downsampling Algorithm for 3D Point Cloud Map Based on Voxel Filtering. Appl. Sci. 2024, 14, 3160. [Google Scholar] [CrossRef]
- Nikolic, I. Neighborhood Analysis, KD-Trees, and Octrees for Meshes and Point Clouds in Python. Medium. 2022. Available online: https://medium.com/data-science/neighborhood-analysis-kd-trees-and-octrees-for-meshes-and-point-clouds-in-python-19fa96527b77 (accessed on 8 July 2026).
- Barrow, H.G.; Tenenbaum, J.M.; Bolles, R.C.; Wolf, H.C. Parametric Correspondence and Chamfer Matching: Two New Techniques for Image Matching. In Proceedings of the Proceedings of the 5th international joint conference on Artificial intelligence—; Morgan Kaufmann Publishers Inc.: San Francisco, CA, USA, 1977; Volume 2, pp. 659–663. [Google Scholar]
- Shapiro, S.S.; Wilk, M.B. An Analysis of Variance Test for Normality (Complete Samples). Biometrika 1965, 52, 591. [Google Scholar] [CrossRef]
- Mann, H.B.; Whitney, D.R. On a Test of Whether One of Two Random Variables Is Stochastically Larger than the Other. Ann. Math. Stat. 1947, 18, 50–60. [Google Scholar] [CrossRef]
- Blattgerste, J.; Behrends, J.; Pfeiffer, T. A Web-Based Analysis Toolkit for the System Usability Scale. In Proceedings of the Proceedings of the 15th International Conference on PErvasive Technologies Related to Assistive Environments; Association for Computing Machinery: New York, NY, USA, 2022; pp. 237–246. [Google Scholar]
Figure 2.
RTI acquisition process.
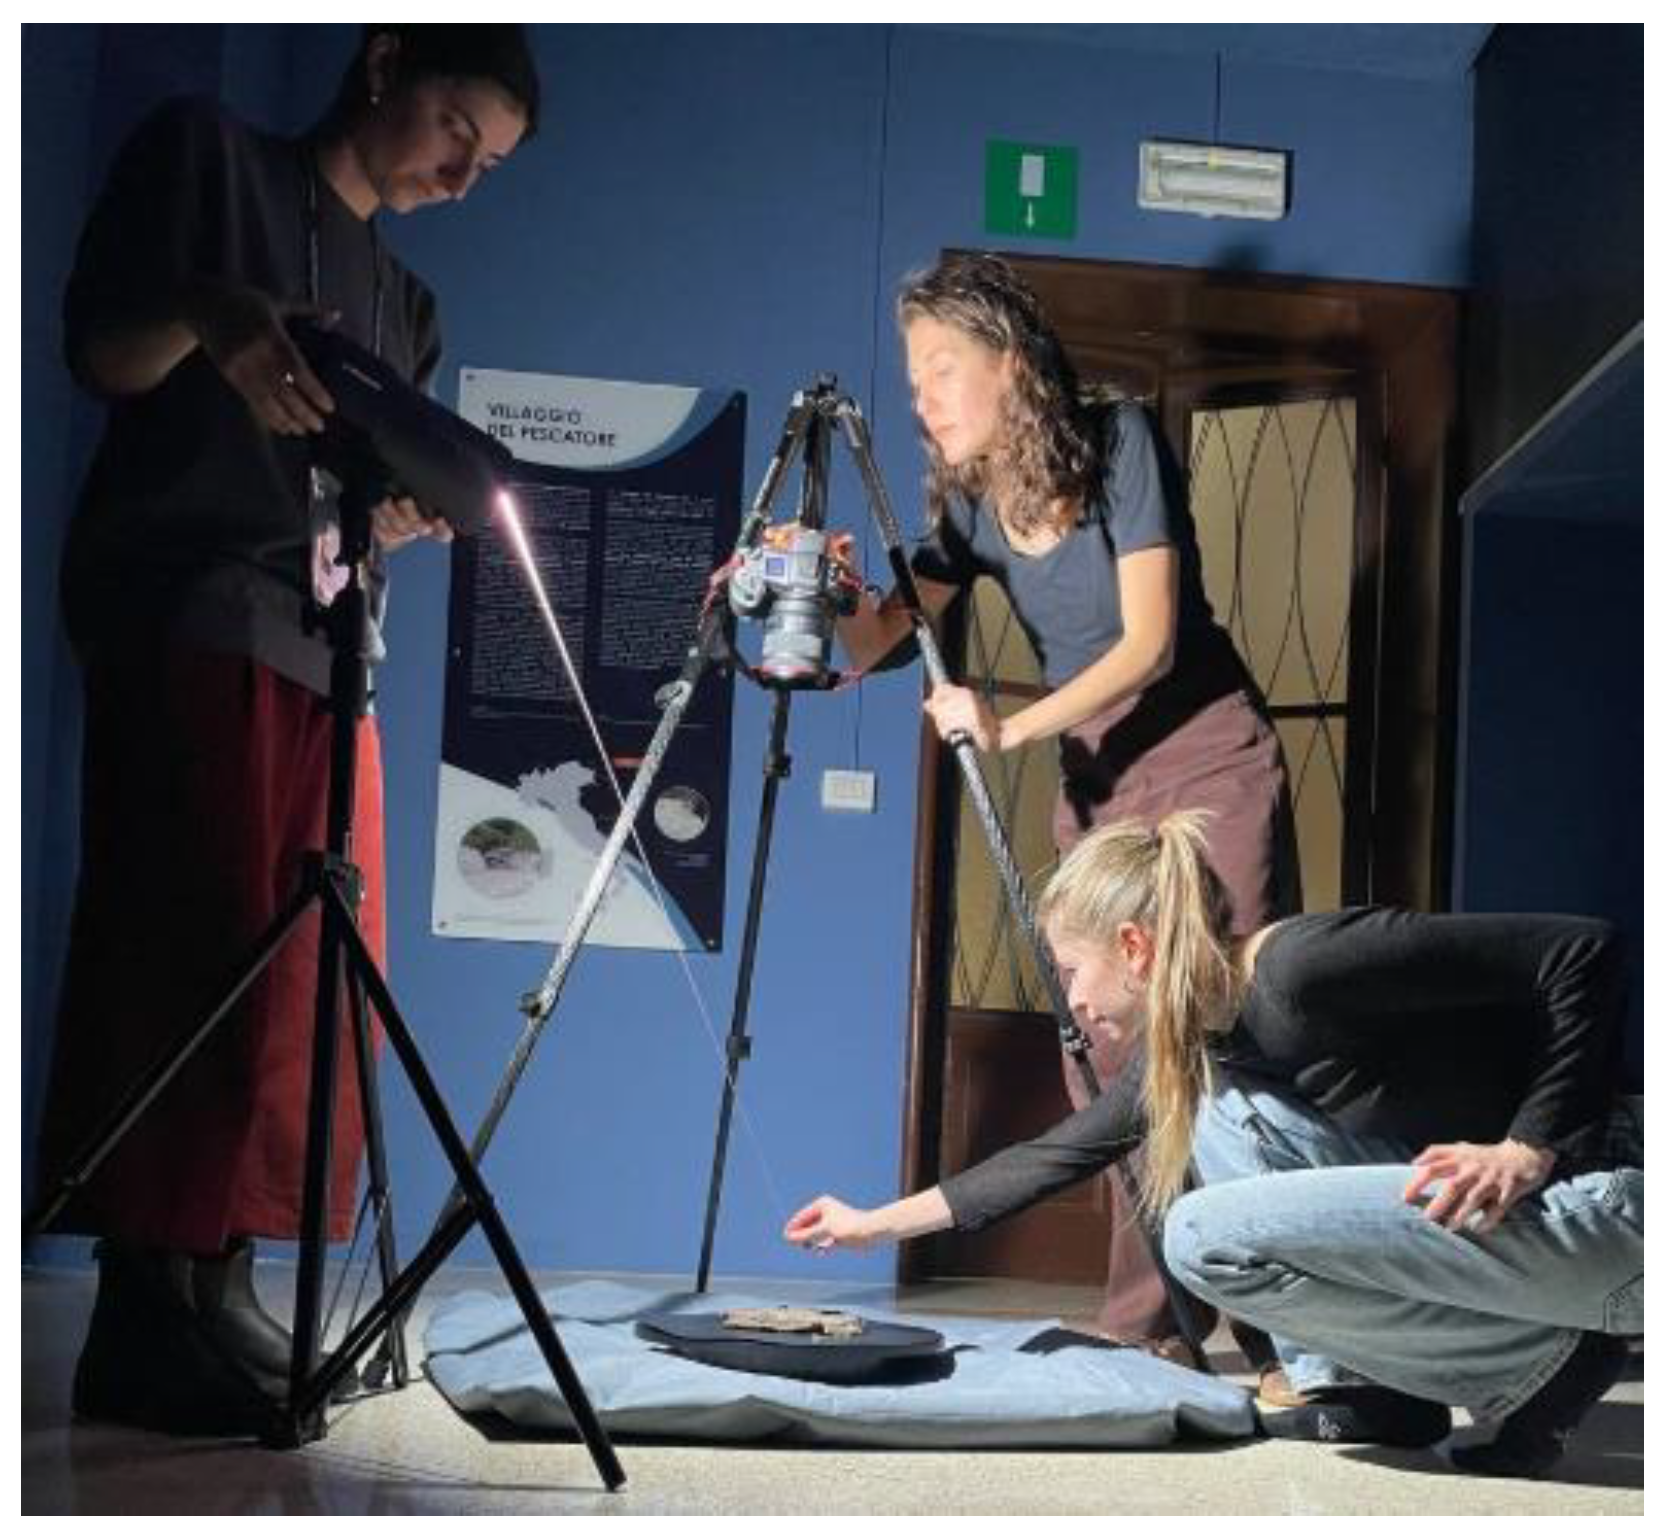
Figure 4.
RTI acquisition scheme.
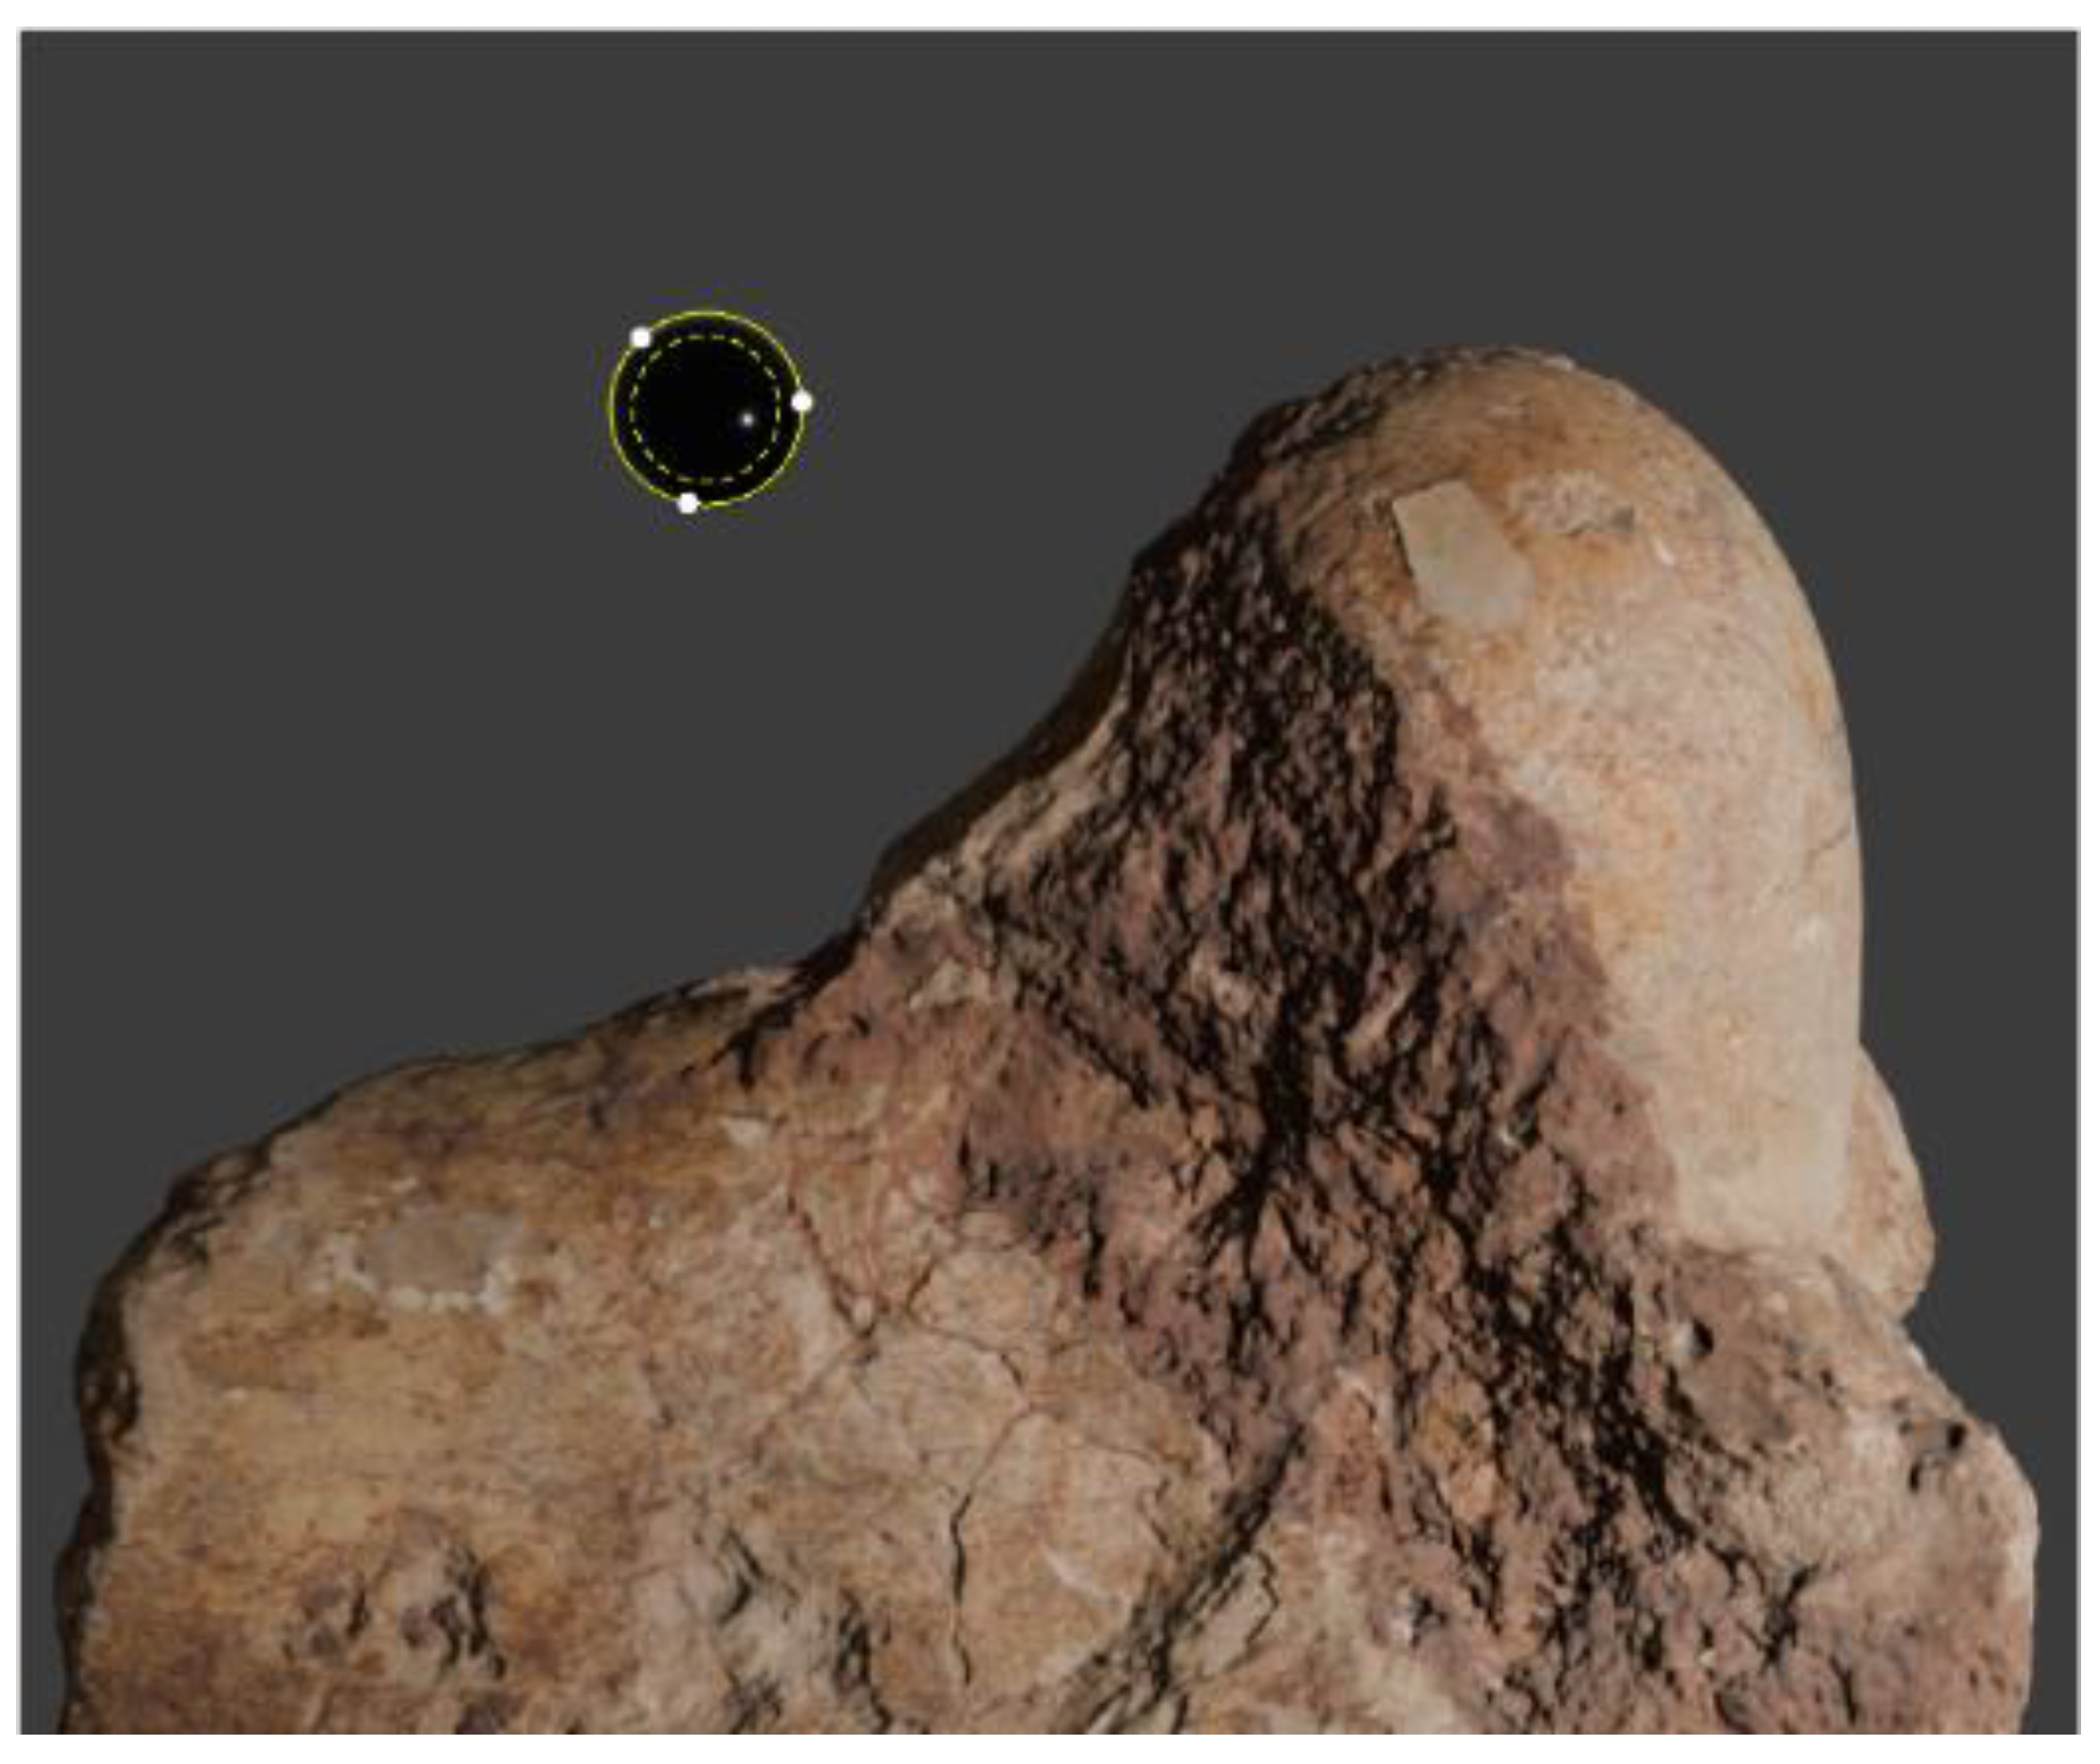
Figure 5.
high-resolution snapshot from RTI viewer of RTI footprint (left) and VRTI footprint (right) under raking light condition.
Figure 5.
high-resolution snapshot from RTI viewer of RTI footprint (left) and VRTI footprint (right) under raking light condition.
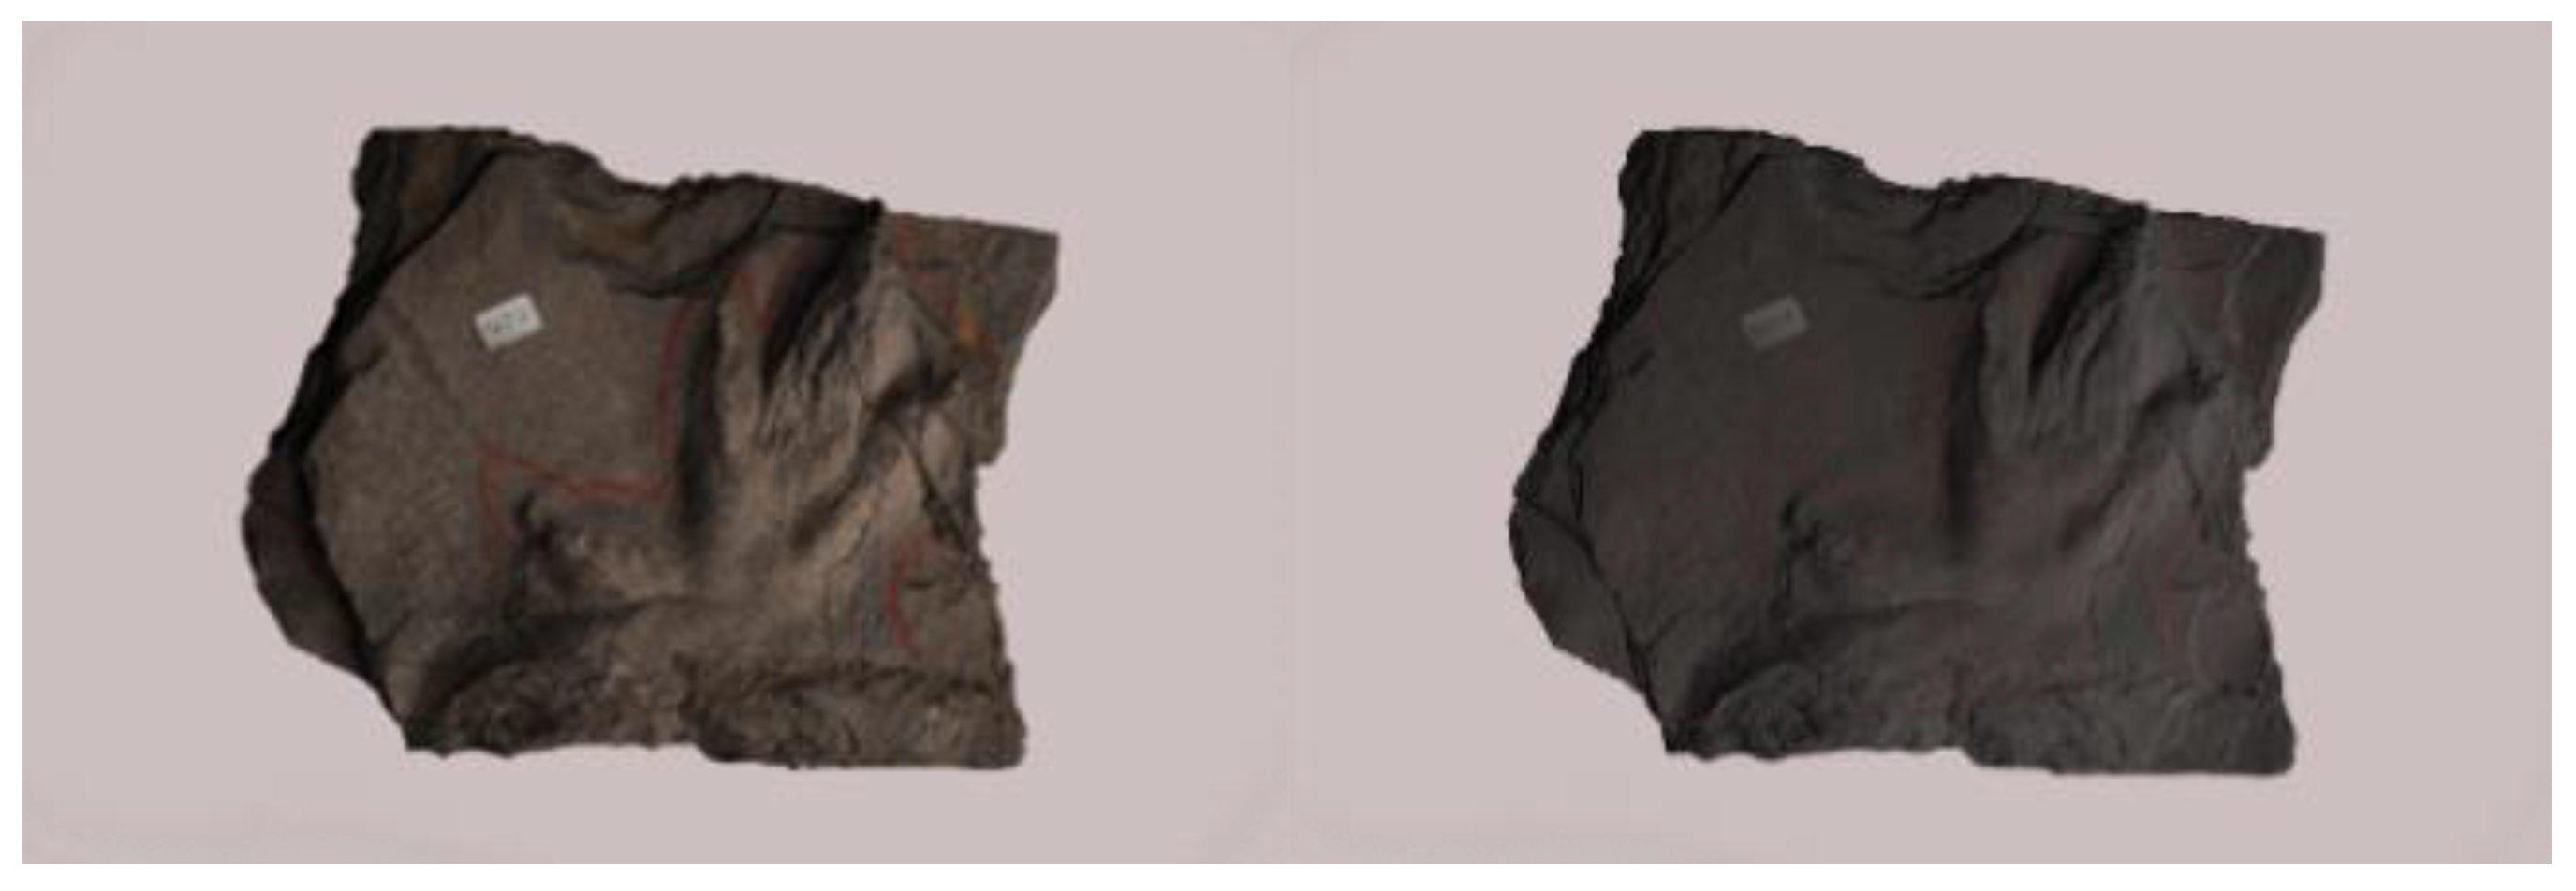
Figure 7.
Example of a footprint CAN 1946 countour (left) and digit pad identification (right).
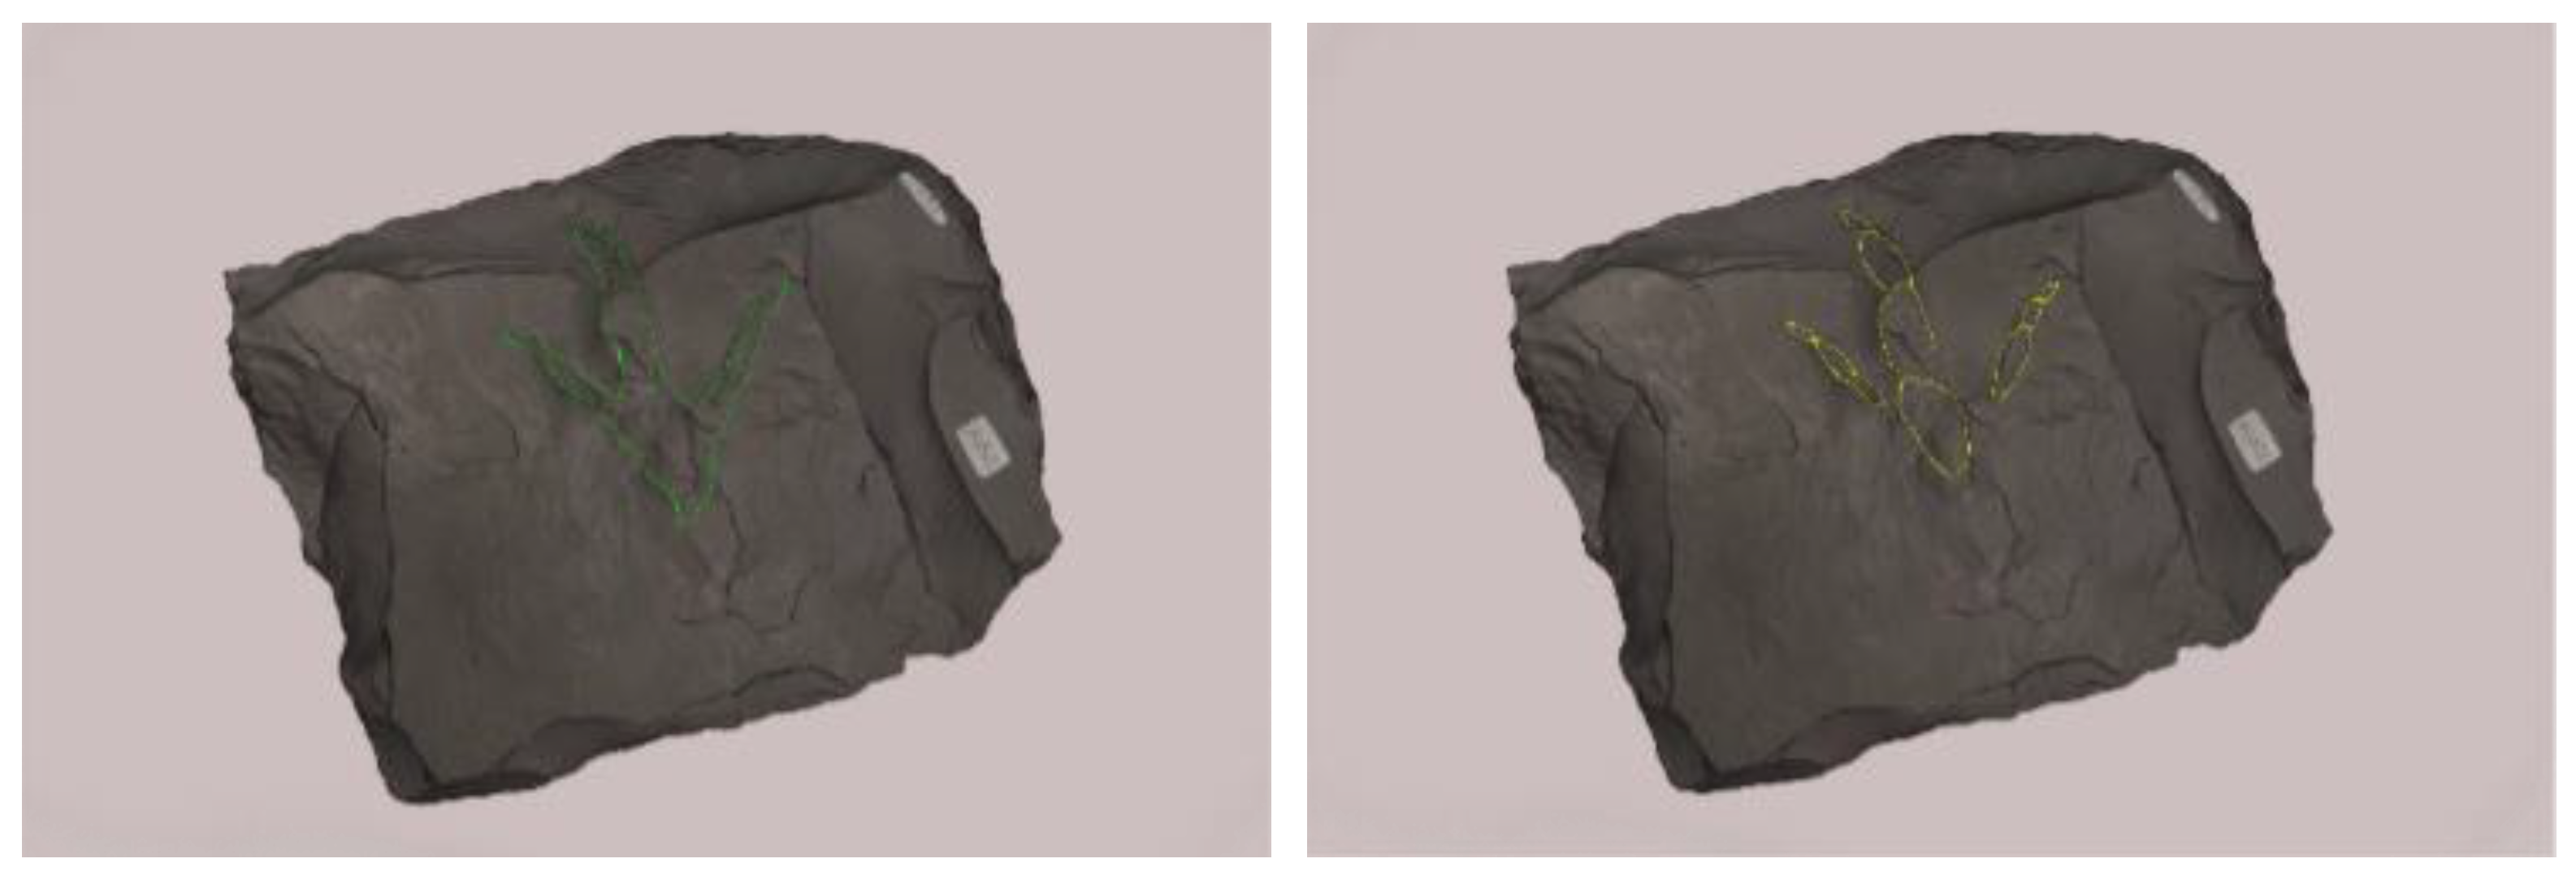
Figure 8.
Interactive Exploration and Lighting Selection, phase 1.
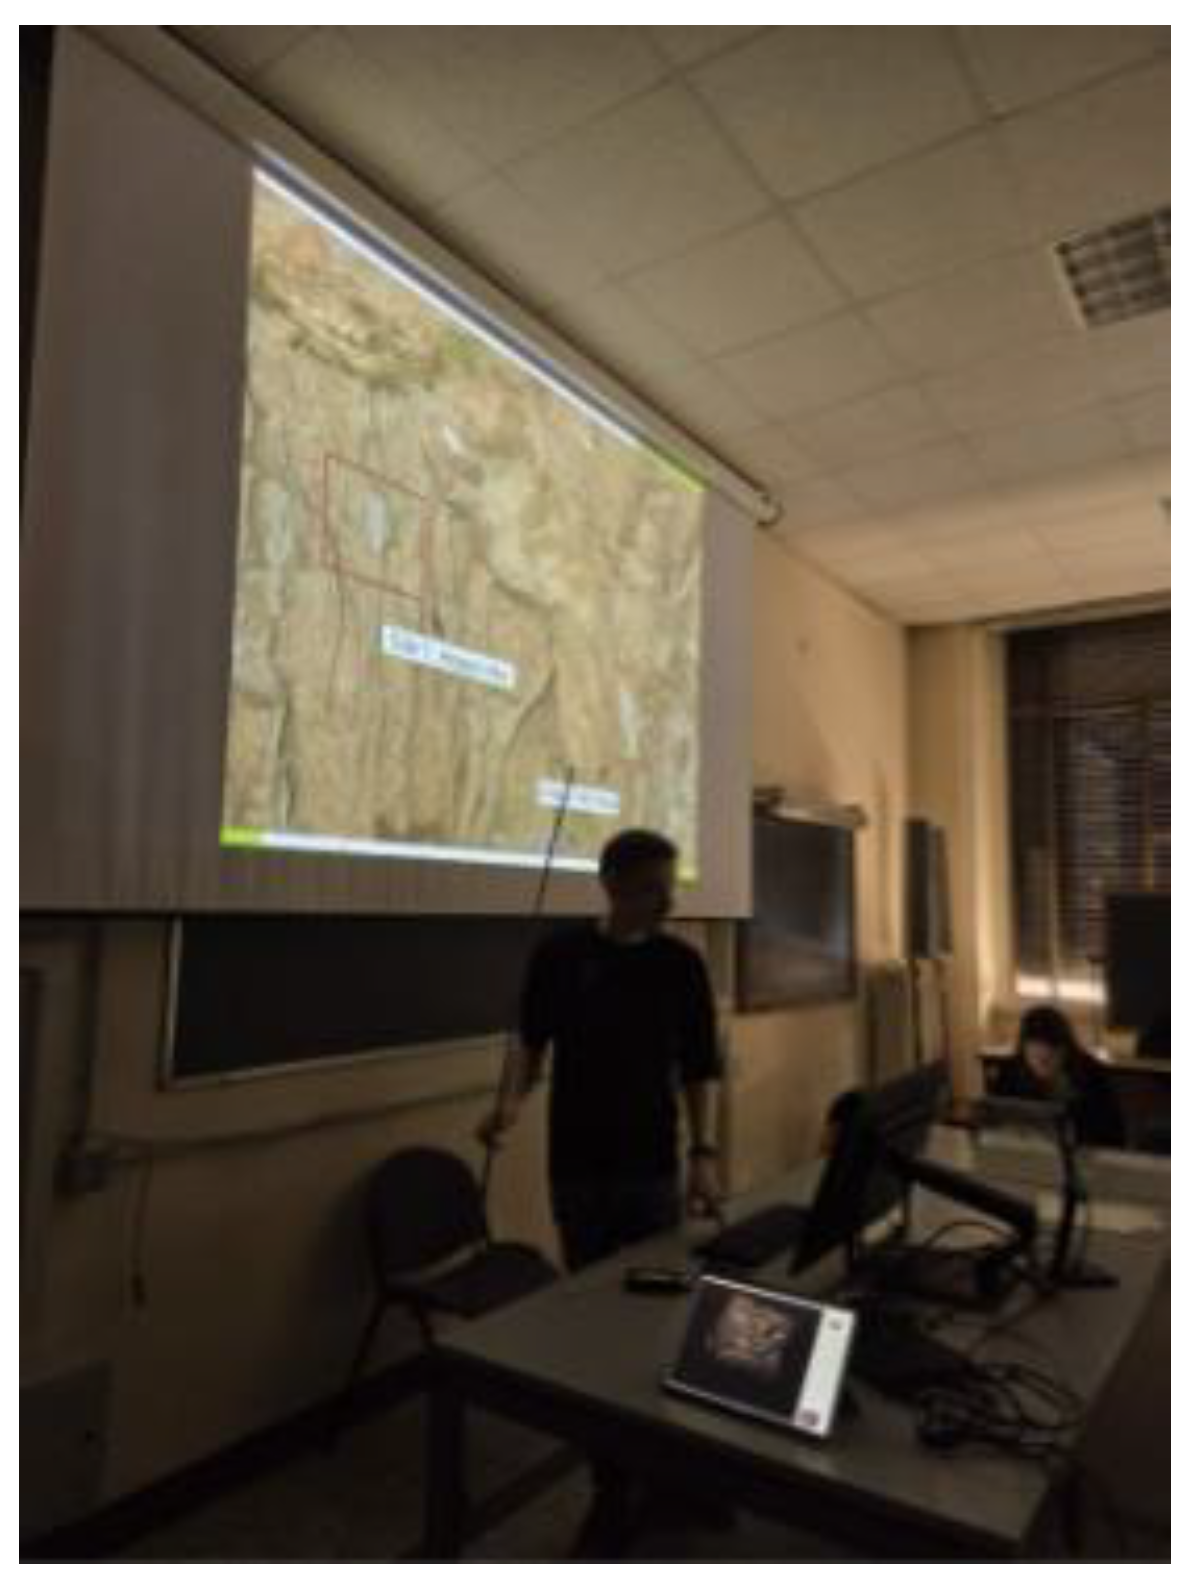
Figure 9.
examples of light perspectives screenshot—RTI (on the top) and VRTI (above).
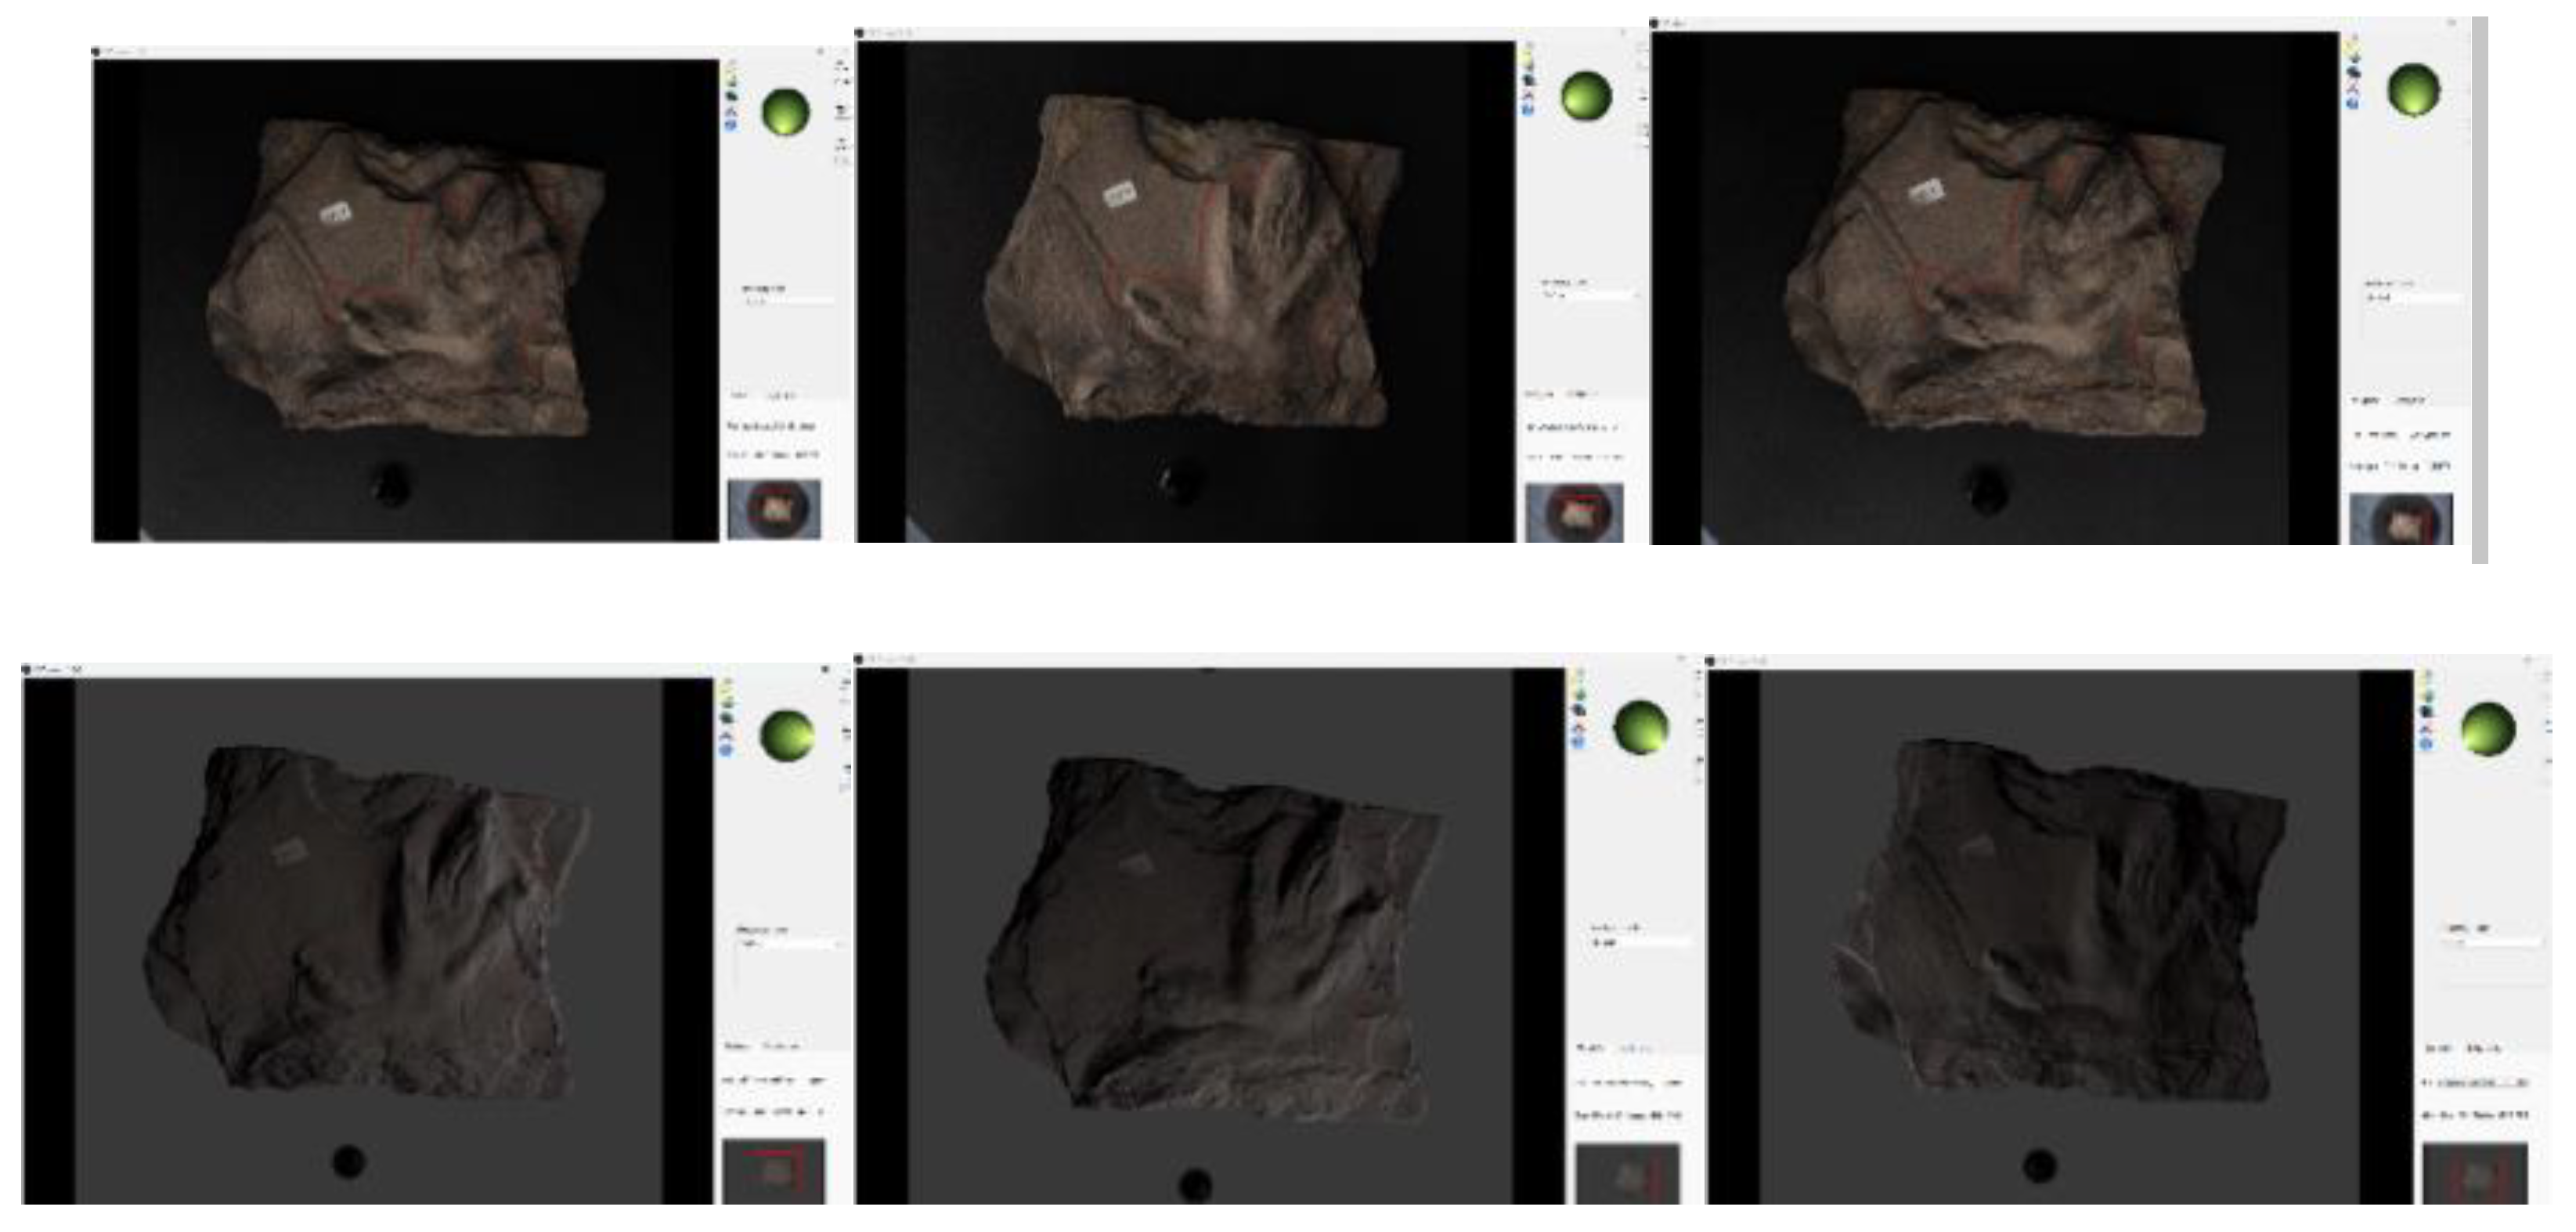
Figure 10.
The test workspace in Adobe Photoshop.
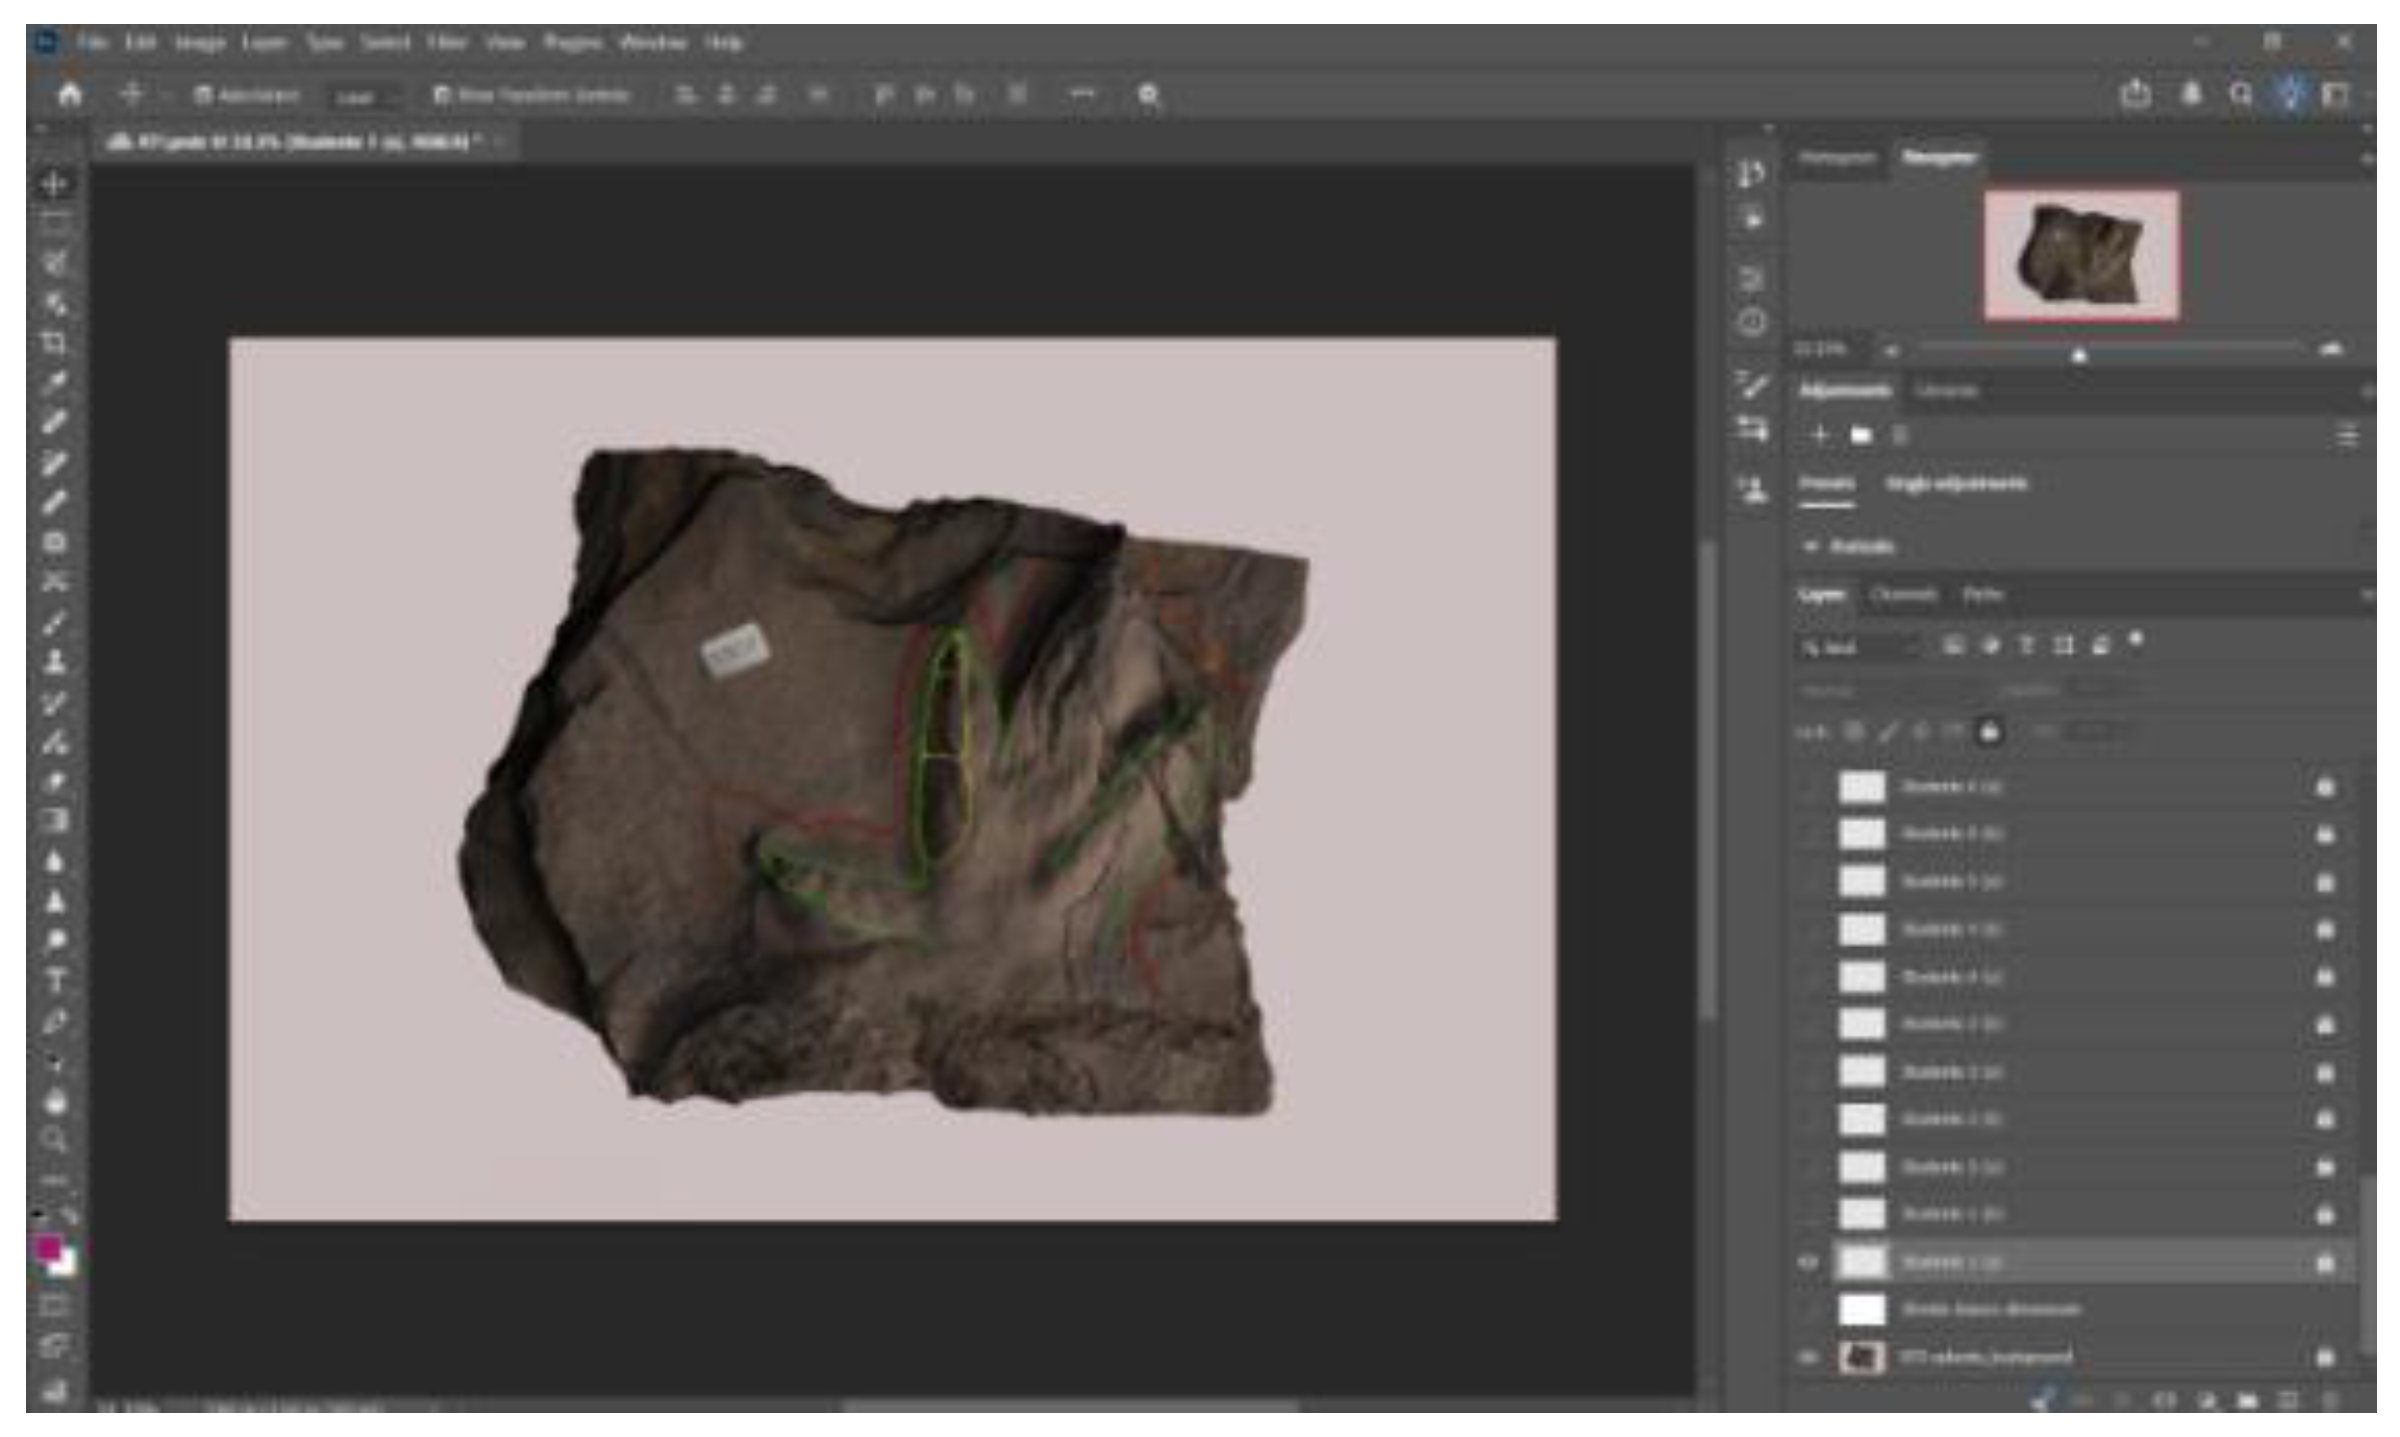
Figure 11.
Visual summary of footprint and digit pad tracing for RTI (left) and VRTI (right) groups. Ground Truth is in red for visualisation purposes.
Figure 11.
Visual summary of footprint and digit pad tracing for RTI (left) and VRTI (right) groups. Ground Truth is in red for visualisation purposes.
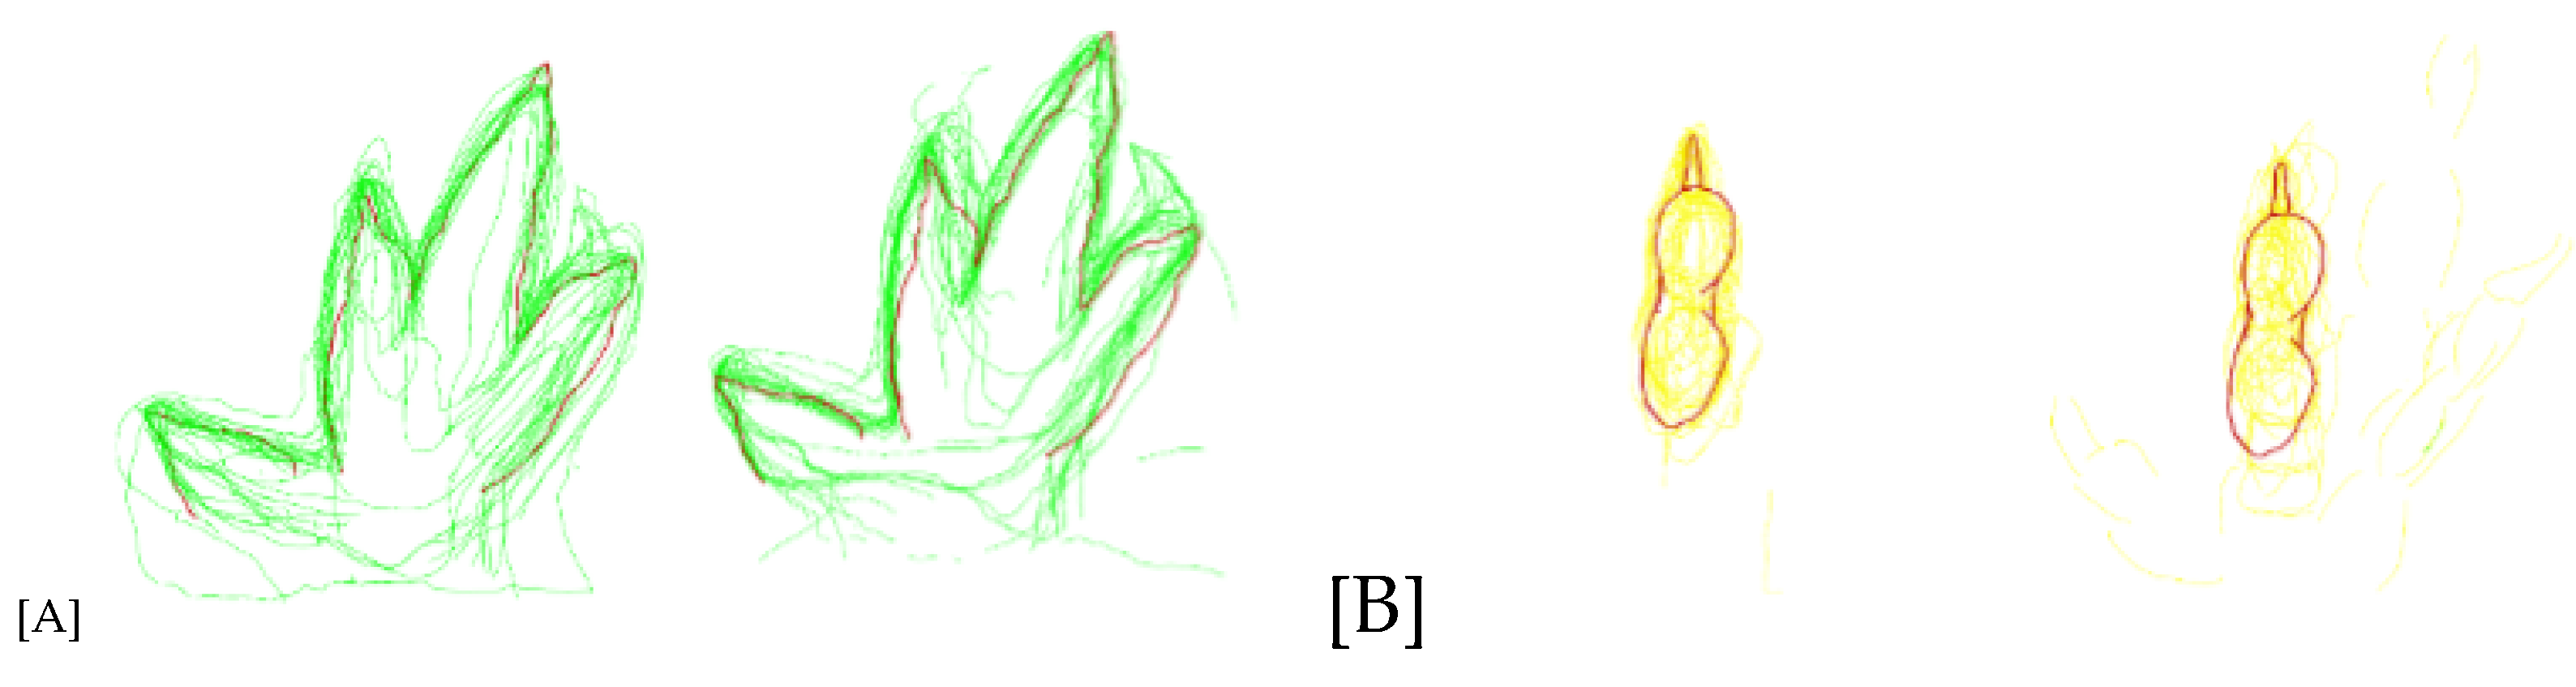
Figure 13.
Qualitative expert evaluation results. The bars represent the mean Likert scores (1-5) for RTI and VRTI across both tasks.
Figure 13.
Qualitative expert evaluation results. The bars represent the mean Likert scores (1-5) for RTI and VRTI across both tasks.
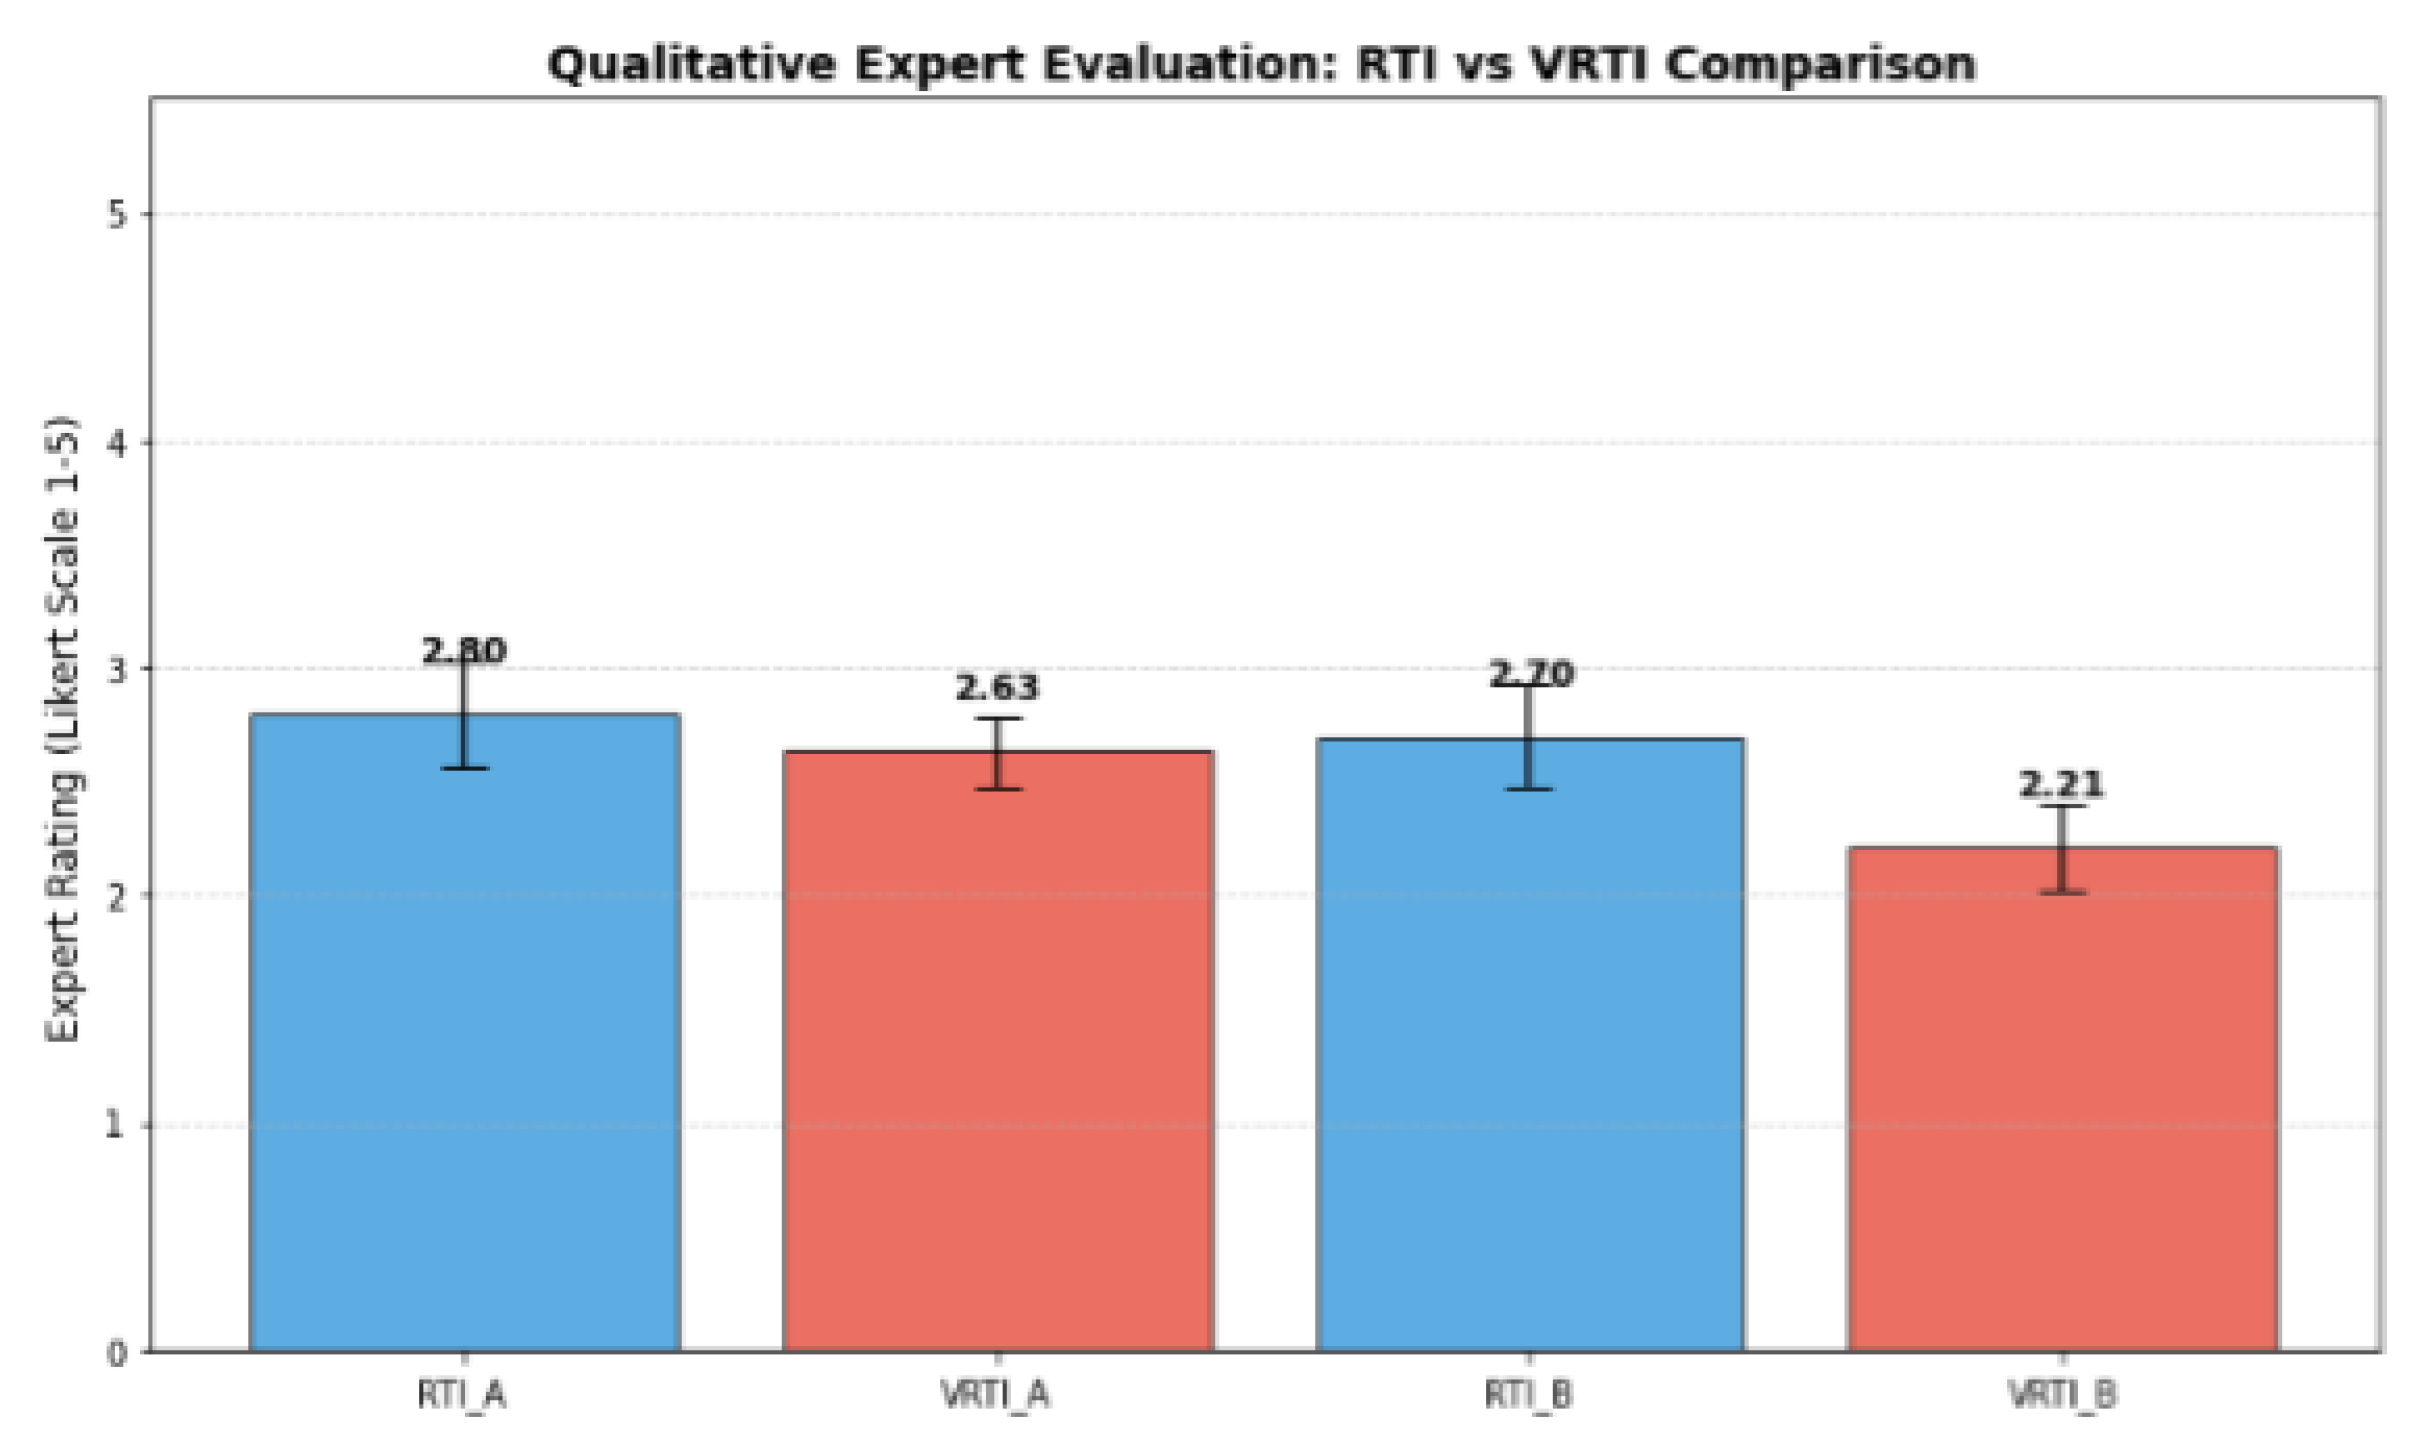
Figure 14.
Mean of the chosen best lighting perspective for RTI (left) and VRTI (right).
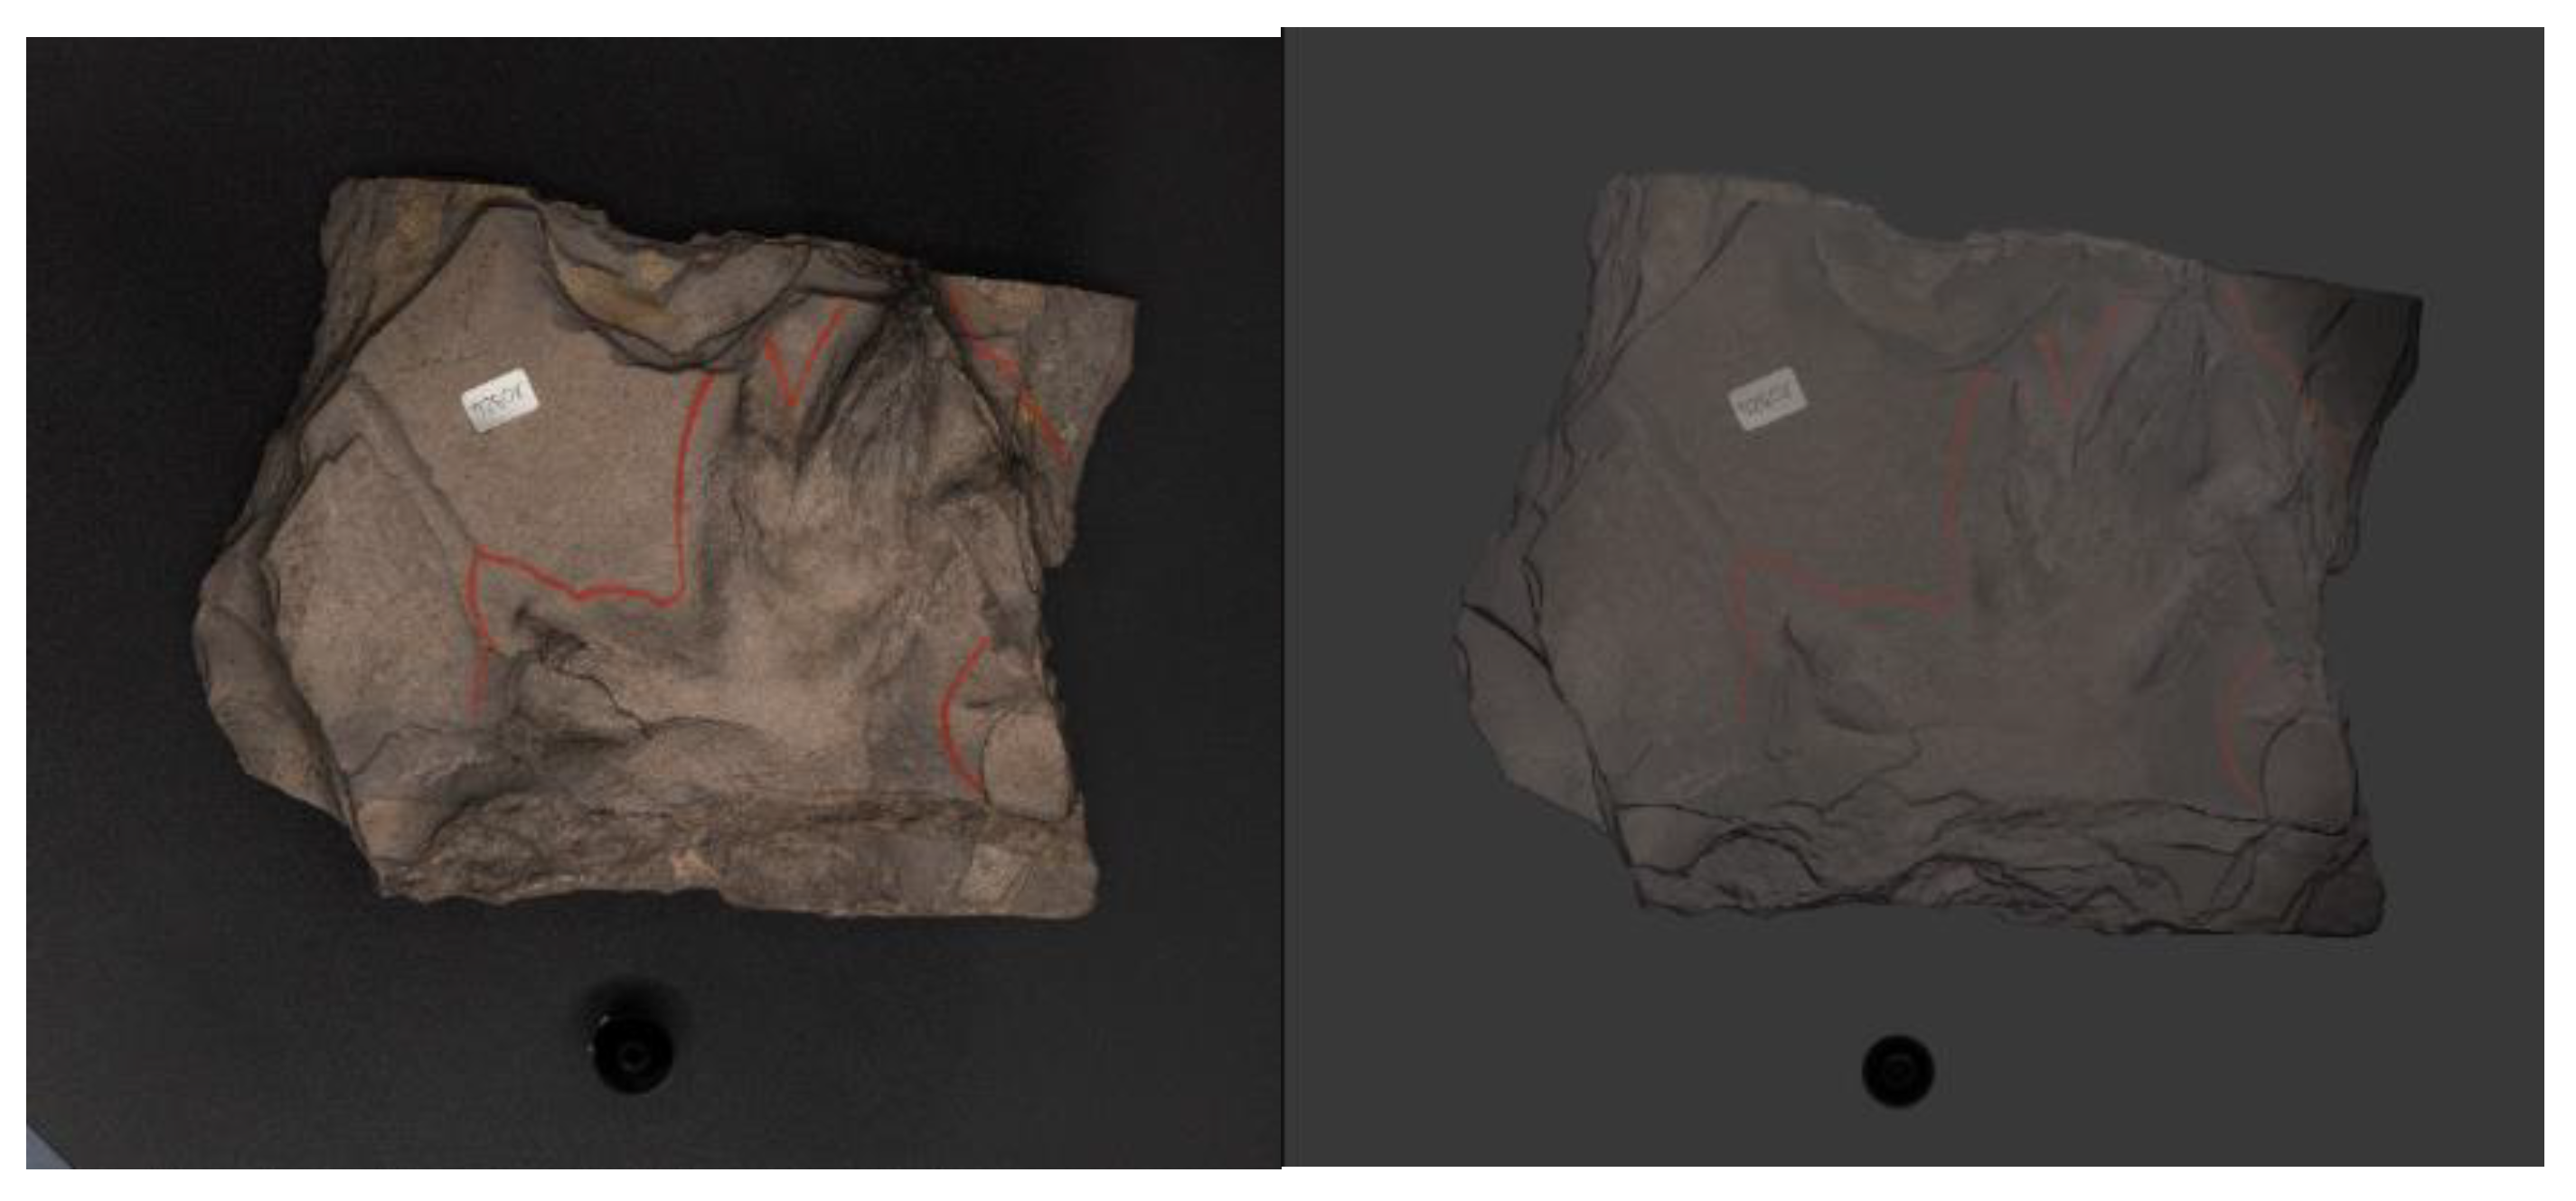
Figure 15.
Scatter Plot presenting the distribution of chosen dynamic light perspective for morphological identification.
Figure 15.
Scatter Plot presenting the distribution of chosen dynamic light perspective for morphological identification.
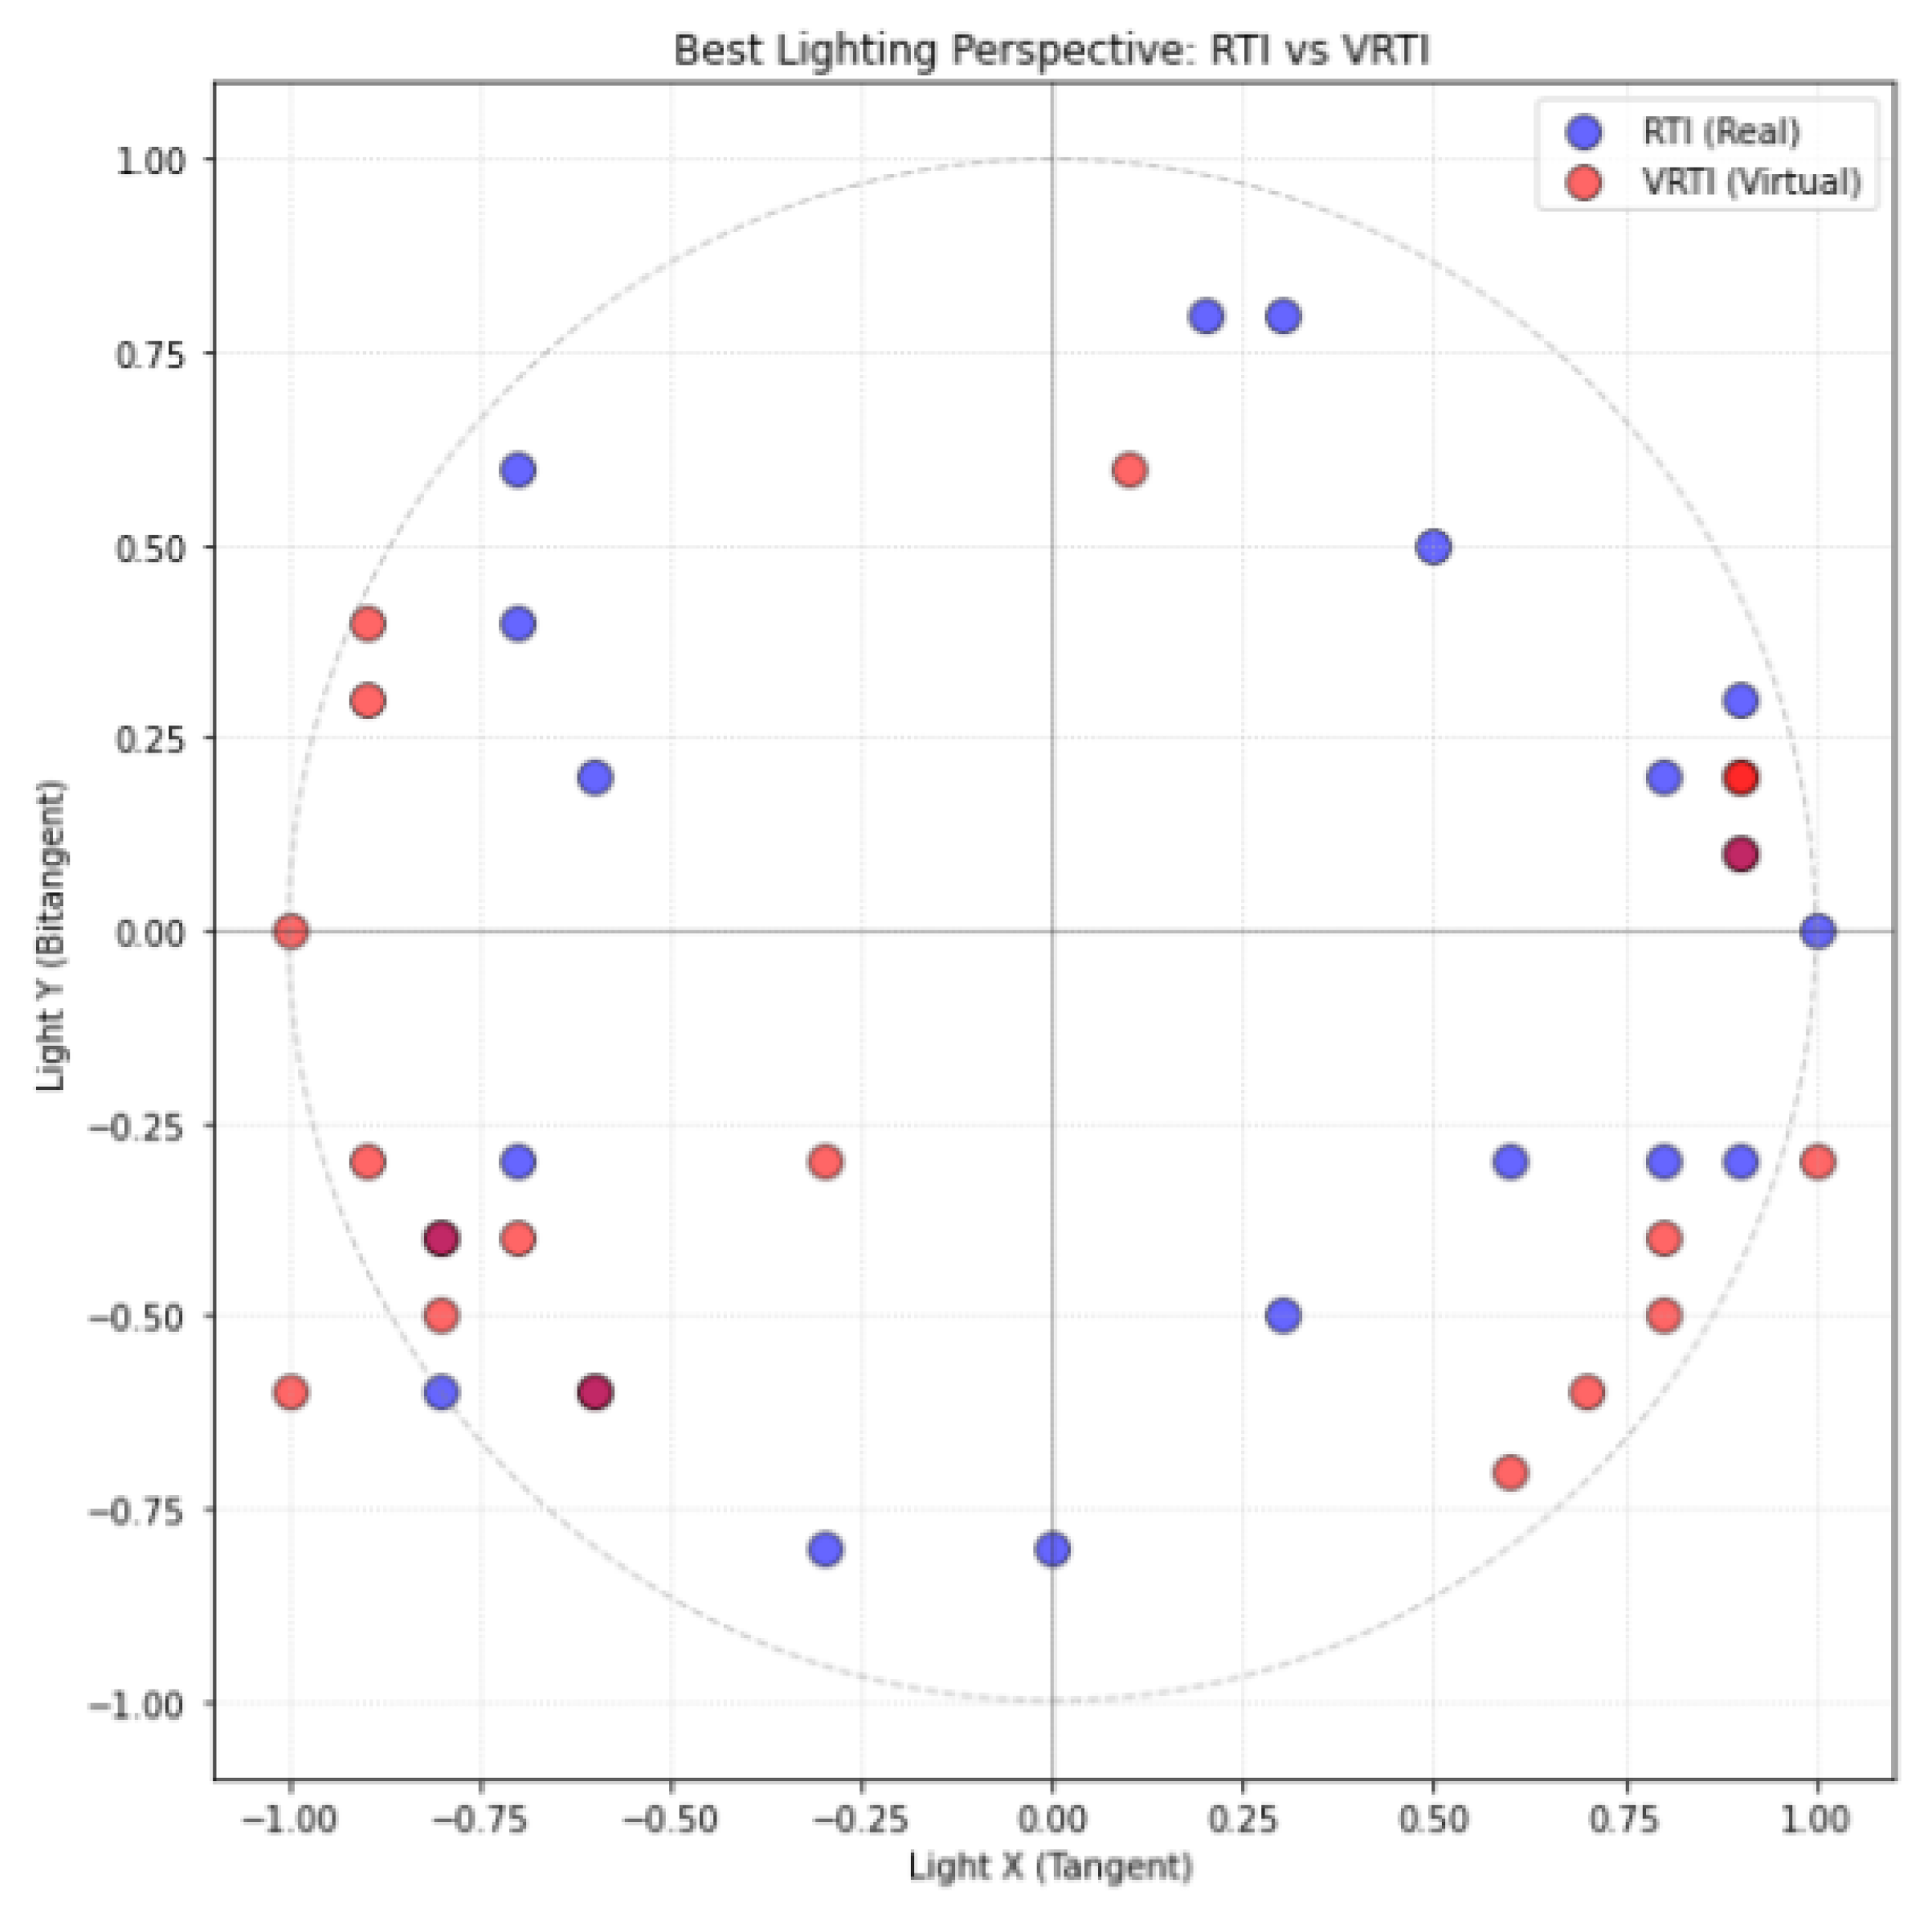
Figure 16.
Distribution of participants’ prior familiarity with RTI methodology and Blender environment.
Figure 16.
Distribution of participants’ prior familiarity with RTI methodology and Blender environment.
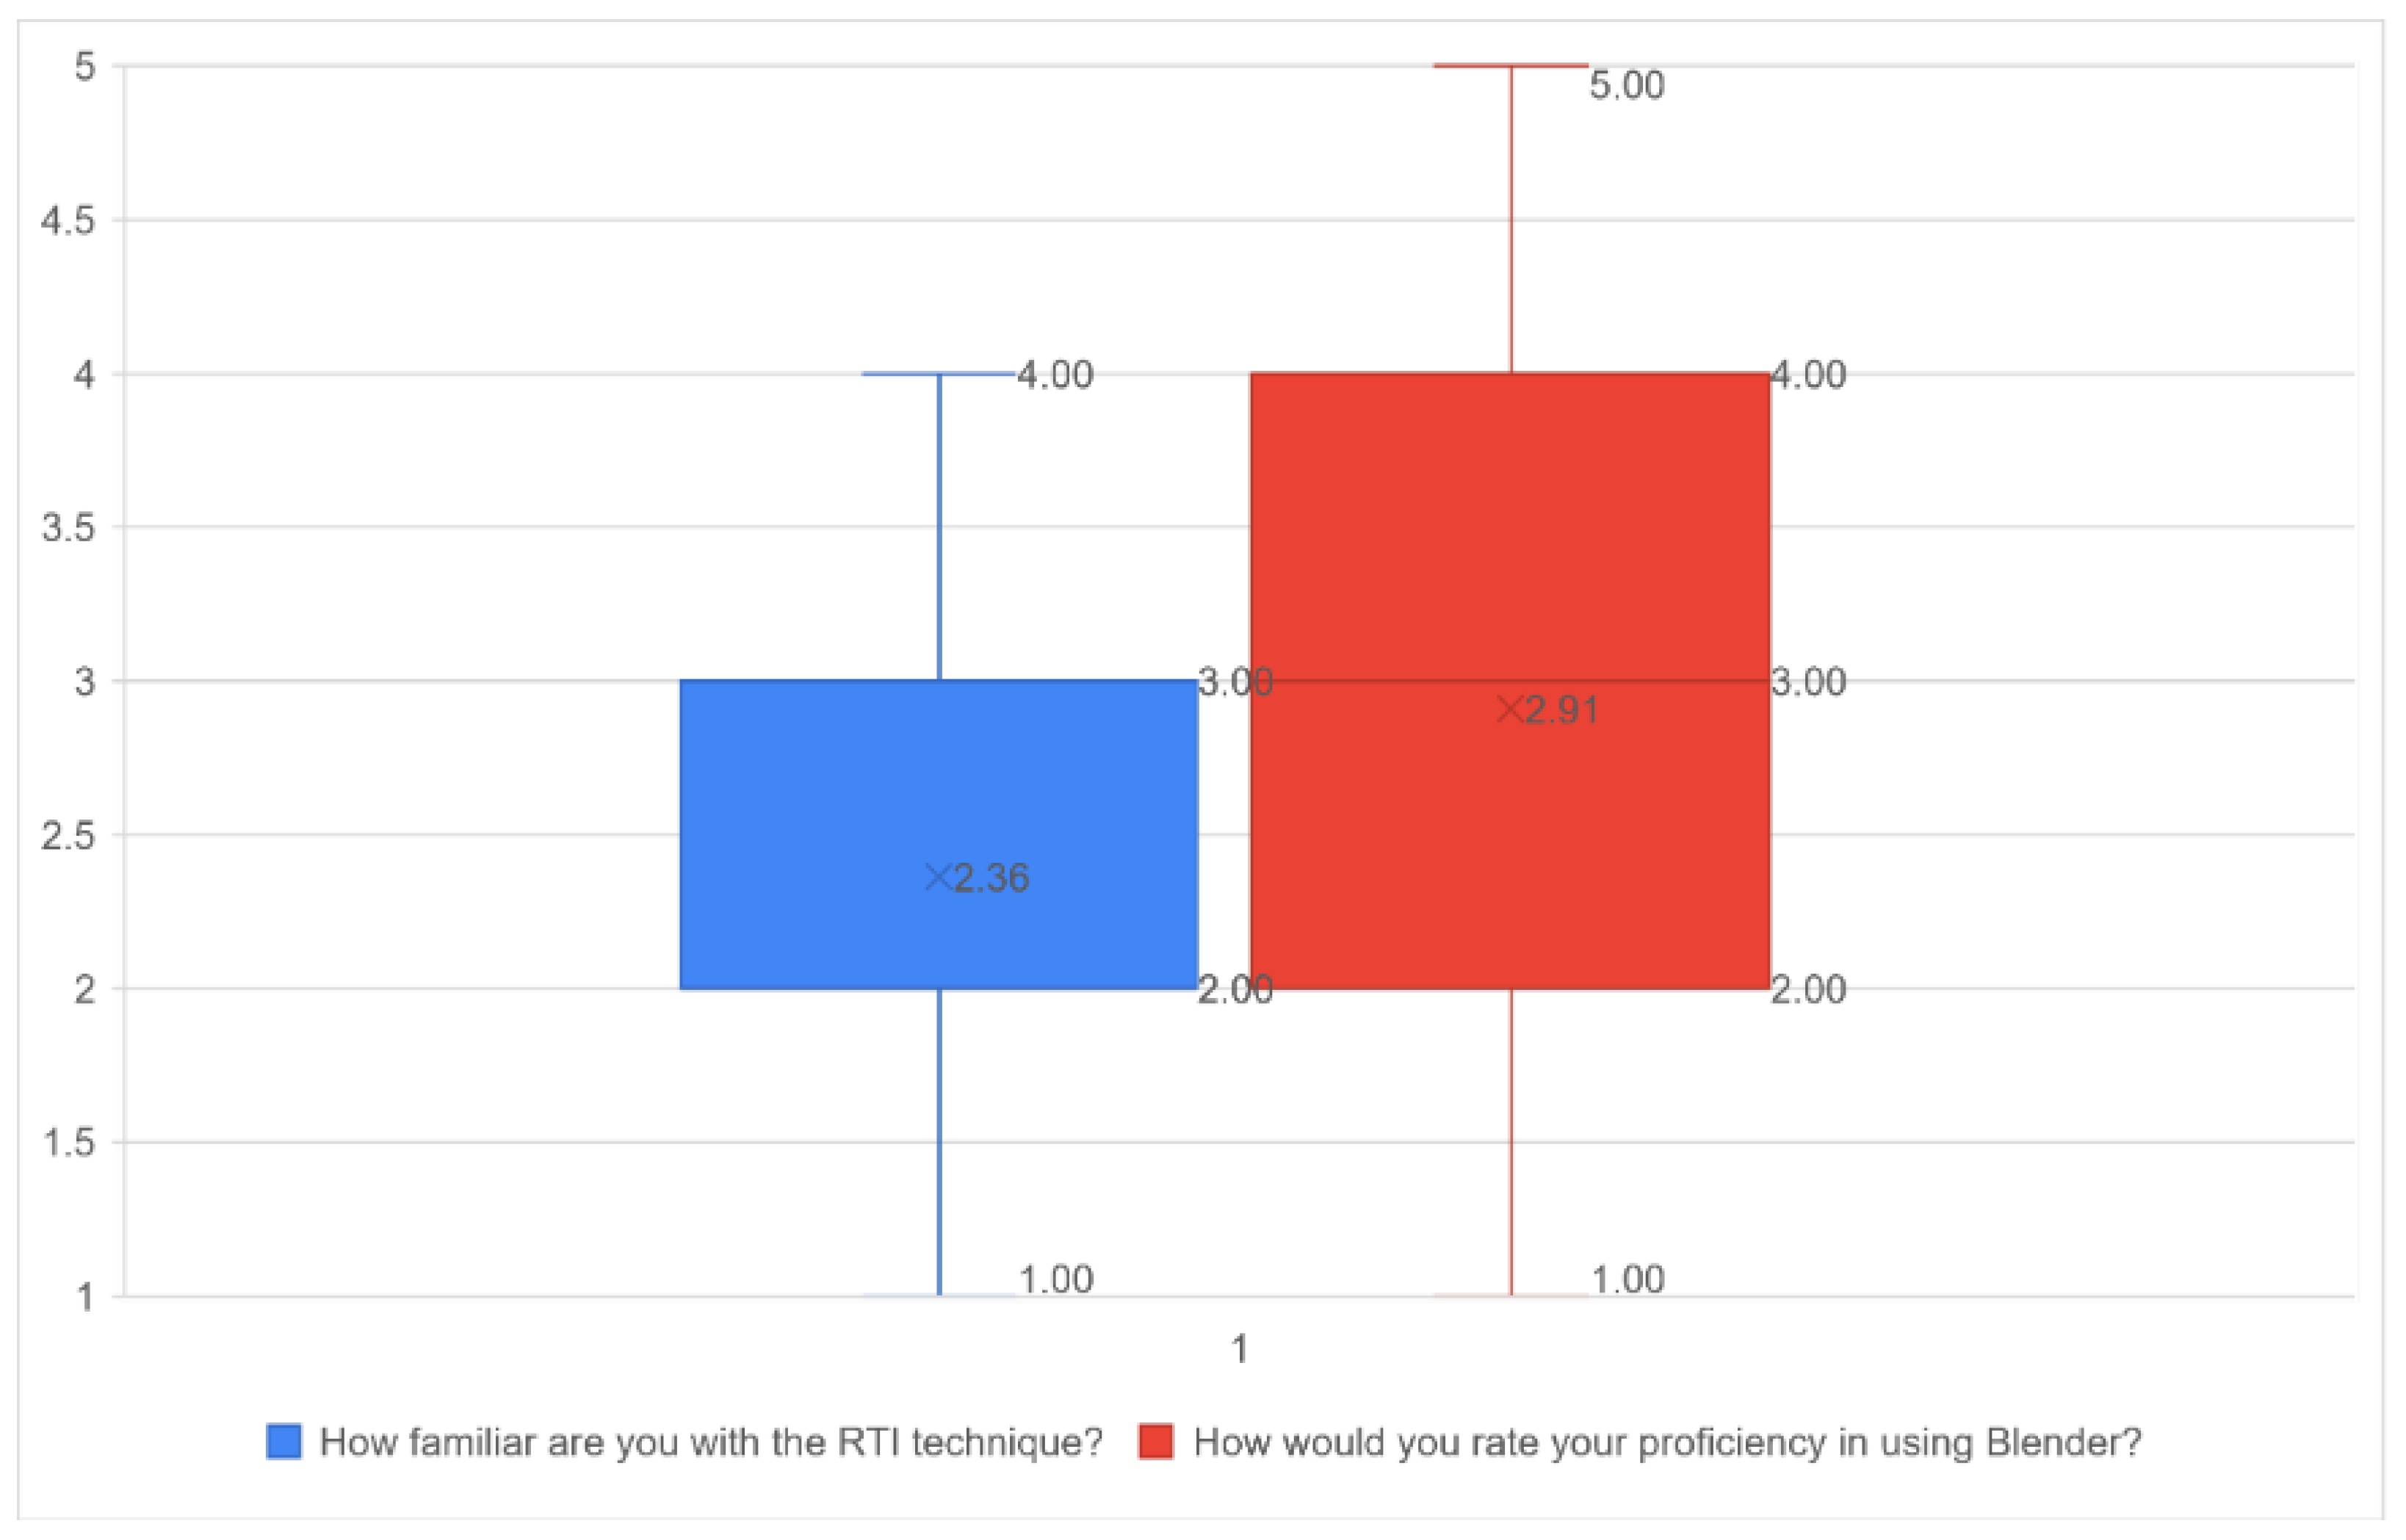
Figure 17.
Distribution of SUS score for VRTI workspace.
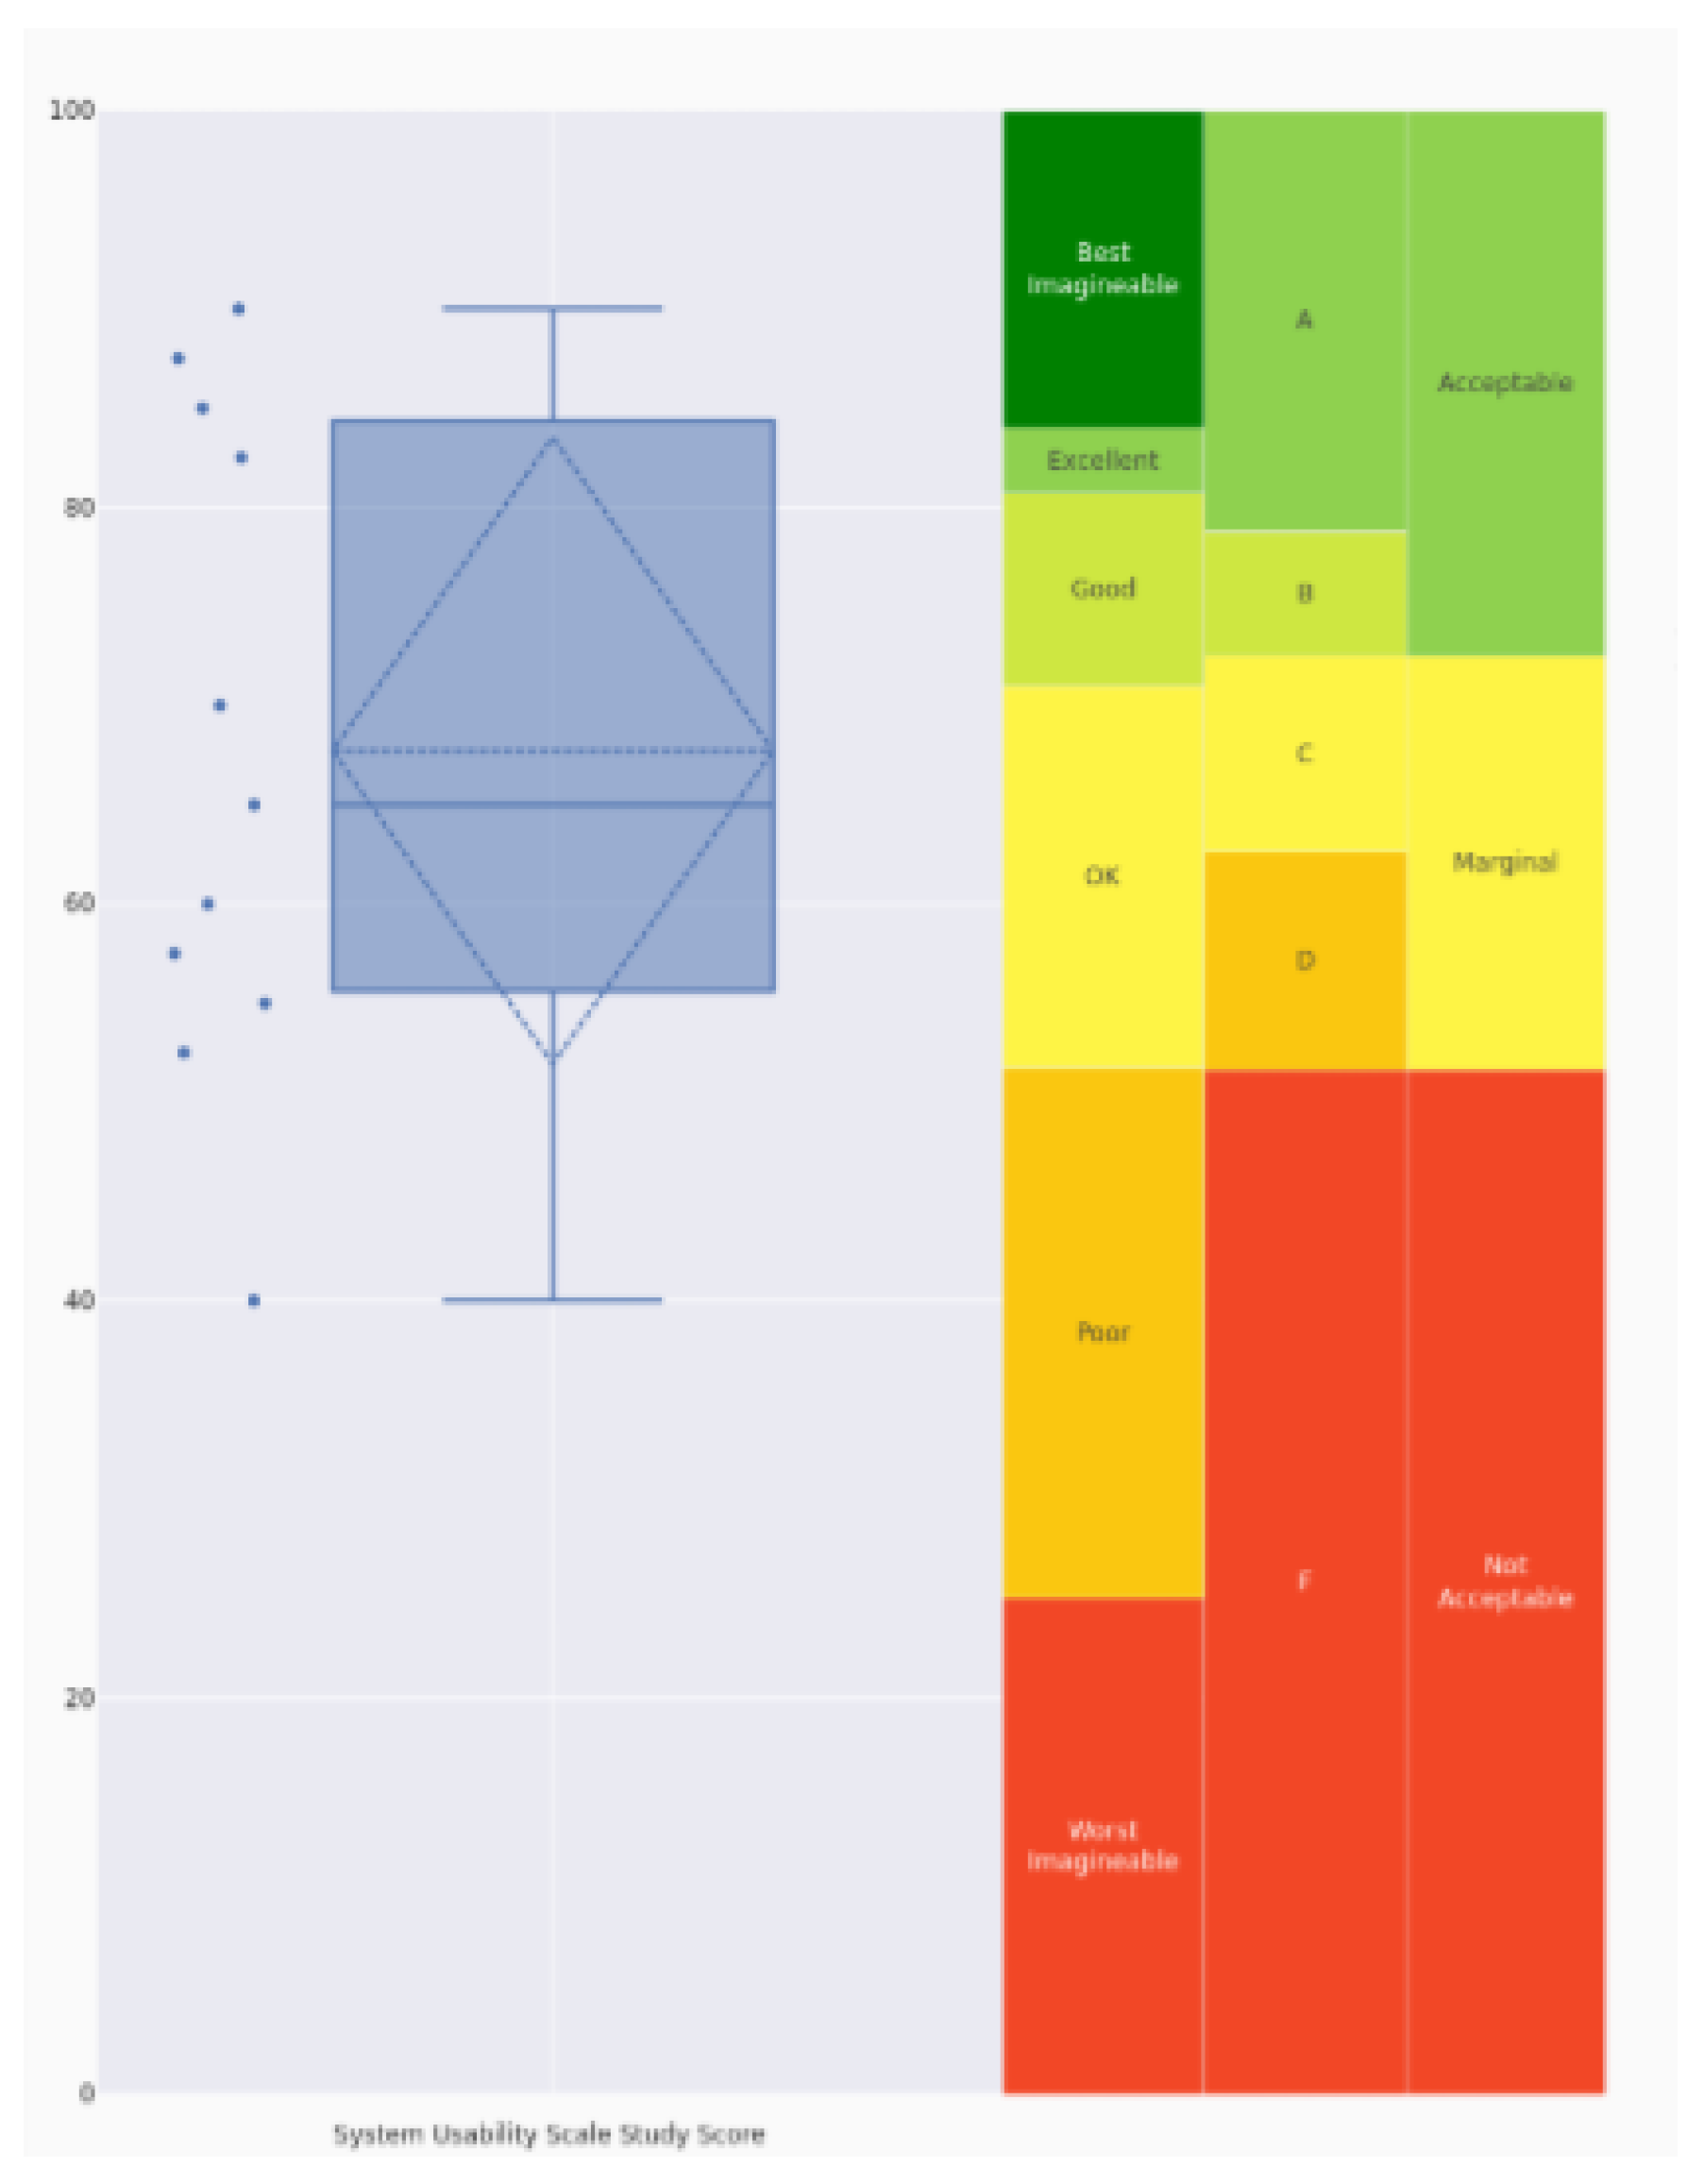

Table 1.
Acquisition and 3D model metadata of the three footprints (CNA1943, CNA1944, CNA1946).
| Scanner: Artec Spider II | Source scans | Maximum error (Resolution) | Tracking mode | FPS | Triangular mesh | 3D model size |
| CS1 (CNA1943) | 10 | 0.2mm | Geometry + texture | 8 | 2,900,000 | 65MB |
| CS2 (CNA1944) | 8 | 0.2mm | Geometry + texture | 8 | 2,570,807 | 56MB |
| CS3 (CNA1946) | 3 | 0.2mm | Geometry + texture | 8 | 2,997,132 | 65MB |
Table 2.
Summary of quantitative metrics (RMSE, P90, and StdDev) for footprint (Task A) and detail (Task B) tracing. All values are expressed in pixels. The p-values refer to the Mann-Whitney U test comparison between RTI and VRTI conditions. .
Table 2.
Summary of quantitative metrics (RMSE, P90, and StdDev) for footprint (Task A) and detail (Task B) tracing. All values are expressed in pixels. The p-values refer to the Mann-Whitney U test comparison between RTI and VRTI conditions. .
| Task | Group | RMSE | P90 | StdDev | p-value |
|---|---|---|---|---|---|
| A (Footprint) | RTI | 57.30 | 96.86 | 42.42 | 0.361 |
| VRTI | 59.70 | 104.98 | 43.36 | ||
| B (Detail) | RTI | 67.04 | 123.85 | 47.41 | 0.255 |
| VRTI | 59.46 | 105.54 | 37.96 |
Table 3.
RTI and VRTI mean and median metrics in best lighting perspective selection.
| Axis | RTI Mean | VRTI Mean | RTI Median | VRTI Median | p-value |
|---|---|---|---|---|---|
| X | 0.10 | -0.06 | 0.25 | -0.30 | 0.366 |
| Y | -0.05 | -0.20 | -0.15 | -0.30 | 0.344 |
Table 4.
SUS item responses (Likert scale 1–5) and normalized values average results (0-10).
| SUS question | Normalized average values (0-10) |
|---|---|
|
6.36 |
|
7.73 |
|
6.82 |
|
7.27 |
|
7.73 |
|
7.73 |
|
6.36 |
|
6.14 |
|
5.45 |
|
6.14 |
Disclaimer/Publisher’s Note: The statements, opinions and data contained in all publications are solely those of the individual author(s) and contributor(s) and not of MDPI and/or the editor(s). MDPI and/or the editor(s) disclaim responsibility for any injury to people or property resulting from any ideas, methods, instructions or products referred to in the content. |
© 2026 by the authors. Licensee MDPI, Basel, Switzerland. This article is an open access article distributed under the terms and conditions of the Creative Commons Attribution (CC BY) license (http://creativecommons.org/licenses/by/4.0/).
Copyright: This open access article is published under a Creative Commons CC BY 4.0 license, which permit the free download, distribution, and reuse, provided that the author and preprint are cited in any reuse.


