
Submitted:
14 July 2026
Posted:
15 July 2026
You are already at the latest version
Abstract
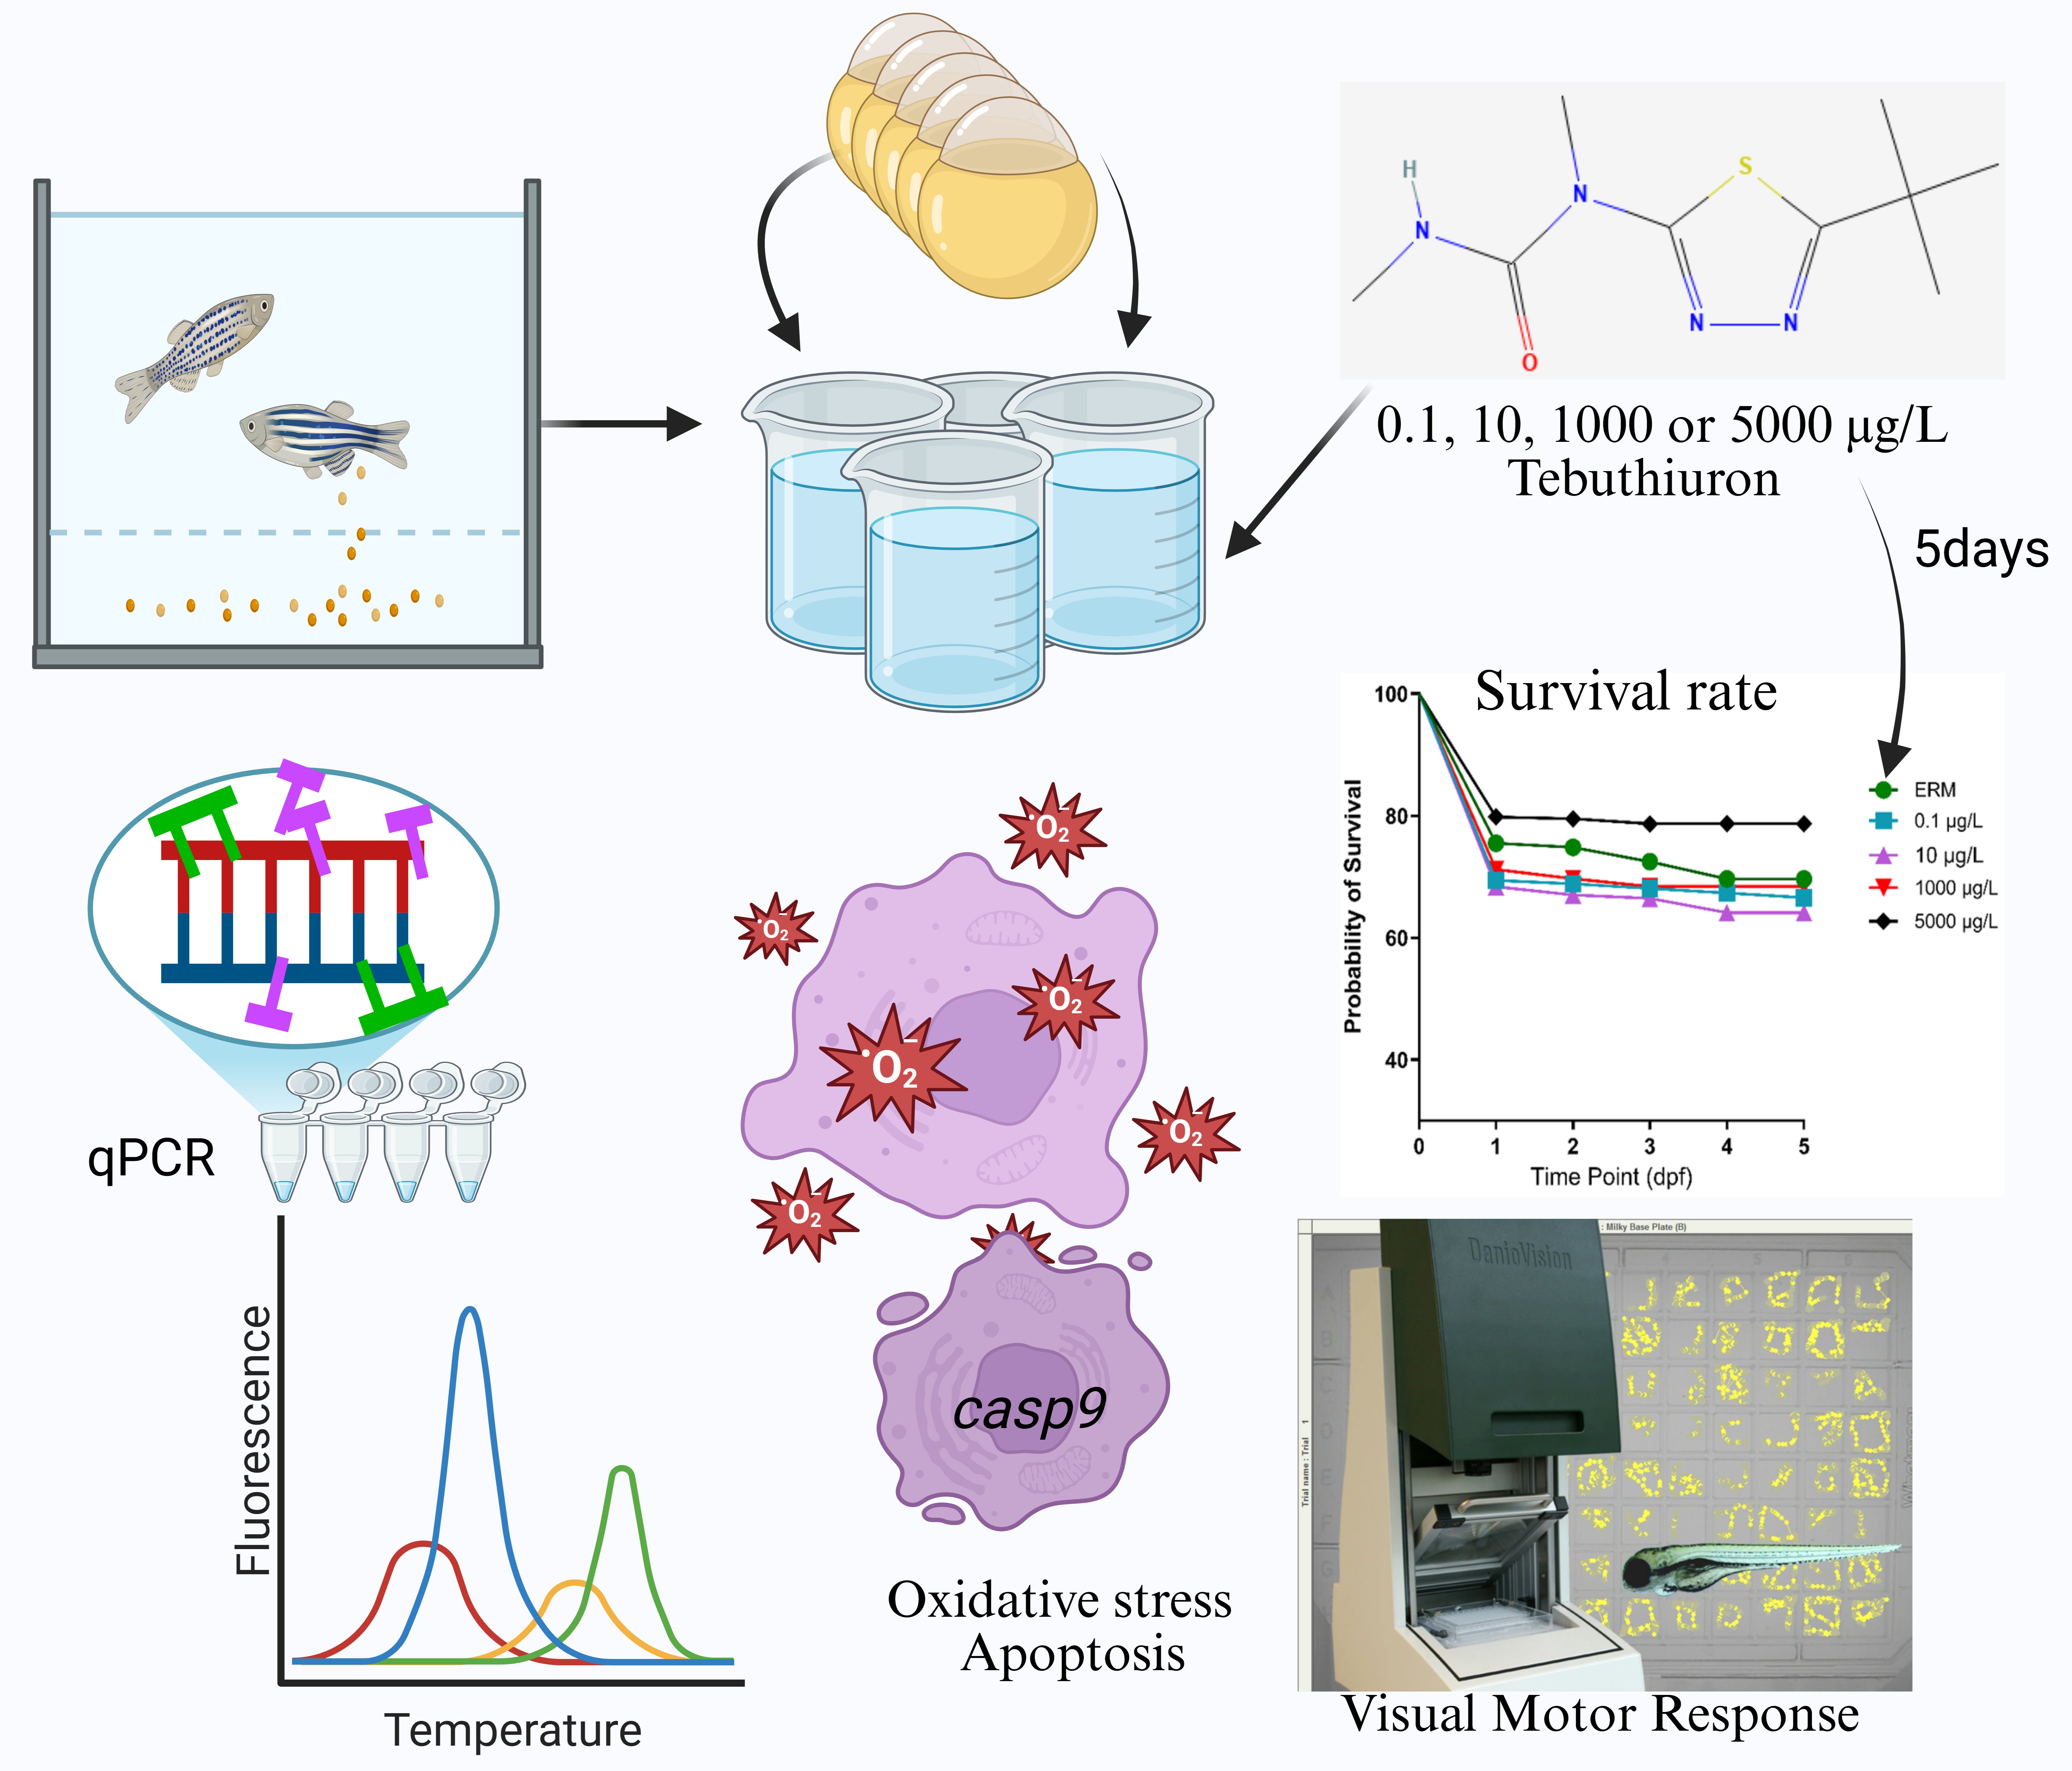
Pesticides represent a significant threat to aquatic ecosystems due to their persistence and widespread use in agricultural areas, altering environments and exerting adverse effects on non-target organisms. Tebuthiuron is a phenylurea herbicide extensively used as an agrochemical to control pests and weeds in various crops, which often lead to contamination of aquatic environments. Despite its high-water solubility with relatively long half-life in soil, studies on Tebuthiuron toxicity in fishes at environmental concentrations are limited. This study aimed to unravel the toxicity mechanisms of Tebuthiuron using the zebrafish model. Zebrafish embryos were exposed to Tebuthiuron (one concentration of either 0.1, 10, 1000 and 5000 µg/L) for 5 days and assessed for hatchability, heart rate, locomotor activity, oxygen reactive species, apoptosis and gene expression. There was no change in frequency of hatch, heart rate, nor apoptosis. However behavioral changes were noted with hyperactivity of zebrafish larvae during the first light (at 10 µg/L), second light (at 10 and 1000 µg/L) and third dark (10 µg/L) periods of the visual motor response assay. Biochemically, a significant depletion of basal ROS levels was observed specifically at 1000 µg/L. At the molecular level, downregulation of oxidative stress related genes (cat, sod1, and sod2) in larval fish were observed with exposure to 10 and 5000 µg/L Tebuthiuron, suggesting a depletion of antioxidant enzymes. In addition, some neurotoxicity-related genes were downregulated such as acetylcholinesterase (ache) while some genes were upregulated like microtubule-associated protein tau b (maptb) and synapsin 2 alpha (syn2a) with 5000 µg/L Tebuthiuron exposure. Thus, Tebuthiuron affected larval activity and transcripts related to oxidative stress and neurotoxicity. This study integrates molecular, biochemical, and behavioral data and contributes to the risk assessment of Tebuthiuron to aquatic species.
Keywords:
Zebrafish
; Tebuthiuron
; ecotoxicology
; oxidative stress
; neurotoxicity
; locomotor activity
1. Introduction
Since 2008, Brazil has been the leading consumer of pesticides globally, followed by the United States of America. Over the last decade, Brazil’s pesticide consumption increased by 190% compared to previous years, a growth rate more than double the global market’s 93% increase during the same period [1]. In the 2010/2011 season, Brazilian pesticide consumption reached 936,000 tons, resulting in $8.5 billion in financial transactions [2]. In 2014, the use of other pesticides accounted for the most proportion of total pesticides (53.84%), followed by herbicides (25.10%), fungicides & bactericides (12.06%), insecticides (7.50%), plant growth regulators (1.24%), and others [3] Determining how these chemicals enter aquatic systems and their associated risks to aquatic species is therefore paramount for their safe application and use. Tebuthiuron (TBH), chemically named N-[5-(1,1-dimethylethyl)-1,3,4- thiadiazol-2-y1]-N,N’-dimethylurea (C9H16N4OS), has a molecular weight of 228.314 g/mol and a log Kow of 1.79 [4,5]. TBH is an herbicide employed for brush control in pastures, rangelands, rights-of-way, and industrial sites. This phenylurea herbicide, commercially introduced in the mid-1970s [6], enters weeds via root and foliar absorption. It subsequently kills weeds by inhibiting electron transport, primarily at the reducing side of photosystem II during photosynthesis [7]. The carryover of biotoxins through residual TBH leaching can lead to contamination and biodiversity loss due to food chain bioaccumulation or environmental exposure [8].
TBH exhibits soil persistence ranging from 11 to 25 months, potentially extending up to 7.2 years, and has a DT50 (Degradation Half-Life) ranging from 16 to 20 days. With high water solubility (2,500 mg/L), TBH is considered relatively persistent and possesses a high leaching potential [9,10]. As such, it has been detected in freshwater environments at concentrations ranging from 10 to 291 ng/L [11]. For instance, TBH was detected in Pardo River water, São Paulo, Brazil reaching a maximum concentration of 1.02 μg/L [12]. It was also measured in the Mogi Guaçu River Basin in Brazil at an alarming maximum concentration of 6.4 μg/L, with a detection frequency of 100% [13].
While some studies, based on theoretical criteria and mathematical models, describe the susceptibility of groundwater to TBH contamination, research conducted in laboratory and field settings using soil columns and soil and water sample collections indicate lower leaching of this herbicide [14]. However, questions remain regarding its contamination potential and effects on aquatic organisms. In the USA, a maximum of 4.5% of the TBH applied to watersheds (2.24 kg a.i./ha) was determined to run off into adjacent water bodies. After watershed treatment, TBH concentration in receiving lotic waters exhibited a range from nondetectable to 83 μg/L [15]. TBH therefore is present in aquatic ecosystems, posing a risk for adverse exposures to aquatic species.
Within this context of environmental exposure, the zebrafish (Danio rerio) serves as a premier vertebrate model for studying sublethal developmental toxicity. Early life stages (e.g., up to 5 days post-fertilization) are particularly vulnerable to environmental toxicants, as interference with rapid morphological and neurological maturation during this window provides highly sensitive indicators of sublethal disruption [16].
While the acute toxicity and morphological impacts of various photosystem inhibitor herbicides are well-documented, the sublethal molecular mechanisms of TBH remain poorly understood. A broader look at phenylurea toxicity in aquatic vertebrates reveals that this class of herbicides profoundly disrupts endocrine systems—particularly the hypothalamus-pituitary-gonadal (HPG) and thyroid (HPT) axes—and alters extensive reproductive, oxidative, and metabolic networks [17]. In line with these sublethal perturbations, recent studies indicate that structurally related phenylurea herbicides, such as linuron, induce severe metabolic depression and neurotoxic hypoactivity in early staged zebrafish [18]. Moreover, initial behavioral screening of TBH have reported acetylcholinesterase (AChE) inhibition and late-stage larval hyperactivity [19]. This indicates that TBH may act through complex, non-linear neurodevelopmental and bioenergetic cascades that have yet to be fully elucidated.
Given Brazil’s leading and increasing pesticide consumption, combined with the persistence of TBH in international watersheds, it is reasoned that this chemical represents a significant environmental concern. To address ecotoxicological knowledge gaps, this study utilizes the zebrafish model to conduct an integrative assessment of TBH toxicity. Based on previous research, we hypothesized that zebrafish would show impaired behavioral responses and evidence of oxidative stress at high concentrations. By evaluating a suite of behavioral, biochemical, and transcriptome responses, this research aims to define the precise sublethal mechanisms and neurodevelopmental risks this herbicide poses to aquatic ecosystems.
2. Materials and Methods
2.1. Chemical Preparation
Tebuthiuron (TBH) stock solutions were prepared and added to embryo rearing media (ERM) containing the zebrafish embryos. Exposure solutions were prepared to yield environmentally relevant concentrations previously detected in the Pardo River and Mogi Guaçu River basins in Brazil (e.g., 1.02 μg/L and 6.40 μg/L). To ensure chemical stability and prevent the buildup of metabolic waste, fresh stocks were prepared daily to replace the corresponding volume during media renewal.
2.2. Husbandry and Egg Production of Zebrafish
Adult zebrafish (AB x Tübingen, Danio rerio) were maintained under standard environmental conditions. Details on breeding and water quality have been outlined previously [20,21]. Adult breeders are monitored for humane endpoints that include notable infections, impaired swimming behavior, or damaged tissues. Breeders are between 6 months and 1 year old. Staging of embryos and general husbandry protocols followed established guidelines. The Institutional Animal Care and Use Committee approved all experiments (IACUC202100000080, Approval date: April, 2021). Details on breeding and water quality).
2.3. TBH Exposure Design
Fertilized and normally developing embryos were selected at ~6 hours post-fertilization (hpf) and randomly assigned to experimental groups: an ERM negative control and a range of TBH concentrations. Experiments were conducted in 25 mL Pyrex glass beakers, each containing 15-20 embryos in 10 mL of the respective test solution (n = 4 to 6 beakers per treatment group). Beaker was the biological unit. Beakers were maintained in an incubator at 27 ± 1 °C. A 90% media renewal was performed daily for a continuous 5-day exposure period. Embryos and larvae were assessed daily using an EVOS™ FL Auto Imaging System to record mortality, calculate hatch rates, and document morphological deformities (spinal lordosis, caudal tail malformations, and yolk sac/pericardial edema).
Heart rate analysis was conducted at 5 days post-fertilization (dpf) using 10 randomly selected individuals per group. Heartbeats were counted under the EVOS™ FL Auto Imaging System for a period of 10 seconds per larva, and the resulting values were multiplied by six to determine the total beats per minute (bpm). Larvae were euthanized using buffered MS-222 (250 mg/L), pooled within a 1.7 ml tube, snapped frozen in liquid nitrogen, and placed at −80 freezer for further ROS or RNA extraction.
2.4. Visual Motor Response Test
Behavioral responses were assessed in 5 dpf larvae utilizing a DanioVision™ Observation Chamber (Noldus Information Technology, Leesburg, VA). Individual larvae were transferred into a 96-well plate containing 200 μL of ERM per well. Following a 2-hour acclimation period to minimize handling stress, a 50-minute visual motor response (VMR) protocol was initiated, consisting of alternating 10-minute dark and light phases. The assay began with a dark period to specifically evaluate photokinesis. Total distance moved (mm) was tracked continuously using EthoVision®XT software. Trajectories demonstrating poor tracking fidelity were systematically excluded. Three experiments were conducted and the data were combined into one graph that represents all three runs. Poorly tracked animals were removed from the analysis based on manual inspection of the tracking. Standard operating procedures have been published previously for our VMR assay [22].
2.5. Reactive Oxygen Species
At 5 dpf, surviving larvae from each treatment group were pooled (n= 3-5 biological replicates per group), transferred to microcentrifuge tubes, and homogenized in 200 μL of ice-cold phosphate-buffered saline (PBS). Homogenates were centrifuged at 12,000 x g for 20 minutes at 4 °C. For ROS quantification, 20 μL of the supernatant was incubated with 2′,7′-Dichlorofluorescin Diacetate (H2-DCFDA) in a black fluorescence microplate for 30 minutes at 37 ± 1 °C in the dark. Samples were added to the microplate in triplicates. Fluorescence intensity was measured (excitation 485 nm; emission 520 nm). Final ROS levels were normalized to total protein content (μg/mL) using a BCA assay.
2.6. Acridine Orange Staining
Apoptosis was evaluated using Acridine Orange (AO) staining. Surviving 5 dpf larvae (n= 17-22 larvae/ group) were incubated in 2 μg/ml of AO (CAS 65-61-2, Sigma-Aldrich) in ERM for 30 minutes in the dark at 28 °C. Larvae were subsequently rinsed three times and imaged using a fluorescence microscope (EVOS TM Fl Auto Imaging System (ThermoFisher, Scientific, USA) with GFP filter. The intensity and localization of the fluorescent signal were quantified using the histogram tool of the Image J software to determine tissue-specific apoptosis.
2.7. Real-Time PCR Analysis
Total RNA was extracted from pooled 5 dpf larval samples using 750 μL TRIzol® Reagent (Life Technologies, Carlsbad, CA, USA) as per the manufacturer’s protocol. Samples were assessed for RNA concentration using the Qubit®Fluorometer (#Q33216, Invitrogen). Complementary DNA (cDNA) synthesis was done using ~750 ng of RNA and ABScript Neo RT Master mix with gDNA remover (Abclonal Technology, CAT. No. RK20433) in a final sample volume of 20 μL. Samples were placed into a T100™ Thermal Cycler (BioRad, USA). The cDNA was generated using the following steps: 37 °C for 2 min, 55 °C for 15 min, 85 °C for 5 min, and 4 °C for 5 min. Prior to real-time PCR, cDNA stocks were diluted 1:25 in RNAse-DNase free water. Quantitative real-time PCR was conducted using a fluorescence-based master mix. Real-time PCR methods followed that in our previous studies [20,21]. The relative expression levels of target genes were normalized to the geometric mean of established housekeeping genes (Ribosomal subunit 18, rps18; Ribosomal subunit L13a, and beta-actin, bactin). Final relative mRNA abundance among the experimental groups was calculated applying the 2-ΔΔCt method. Primer sequences used in this study are provided in Supplemental Methods as Table S1 [23,24,25,26,27,28,29,30].
2.8. Statistical Analysis
Statistical analysis and graphing were conducted using GraphPad Prism V9.4 (La Jolla, CA, USA). A Log-rank (Mantel-Cox) test was employed to analyze survival and hatch curves. Groups being compared are those with different concentrations of TBH to ERM control (no chemical). ROS data were assessed for normality using a Shapiro-Wilk test; normally distributed data were analyzed via a One-Way ANOVA followed by Dunnett’s or Holm-Šídák’s multiple comparisons tests, whereas non-normally distributed data were log-transformed prior to analysis (log10). VMR data within discrete time bins were logarithmically transformed then analyzed utilizing a One-Way ANOVA test followed by post-hoc Dunnett’s multiple comparisons test. VMR data were normalized to the ERM group for each independent run. The ERM group was standardized to a value of 1 and each treatment was subsequently compared in a relative manner. Simple linear regression was conducted to evaluate gene expression variance across treatments. The significance of difference was determined at p < 0.05.
3. Results
3.1. Survival and Deformity
Some initial mortality was observed within the first 24 hours across all groups, including the ERM control. This is due to non-viable eggs initially, which stabilize after 24 hours. Exposure to TBH at concentrations up to 5000 μg/L did not induce significant decreases in survival compared to the control group (Log-rank test, p > 0.05). This suggests that TBH does not induce acute lethal toxicity in developing zebrafish at the tested environmentally relevant and sub-lethal concentrations.
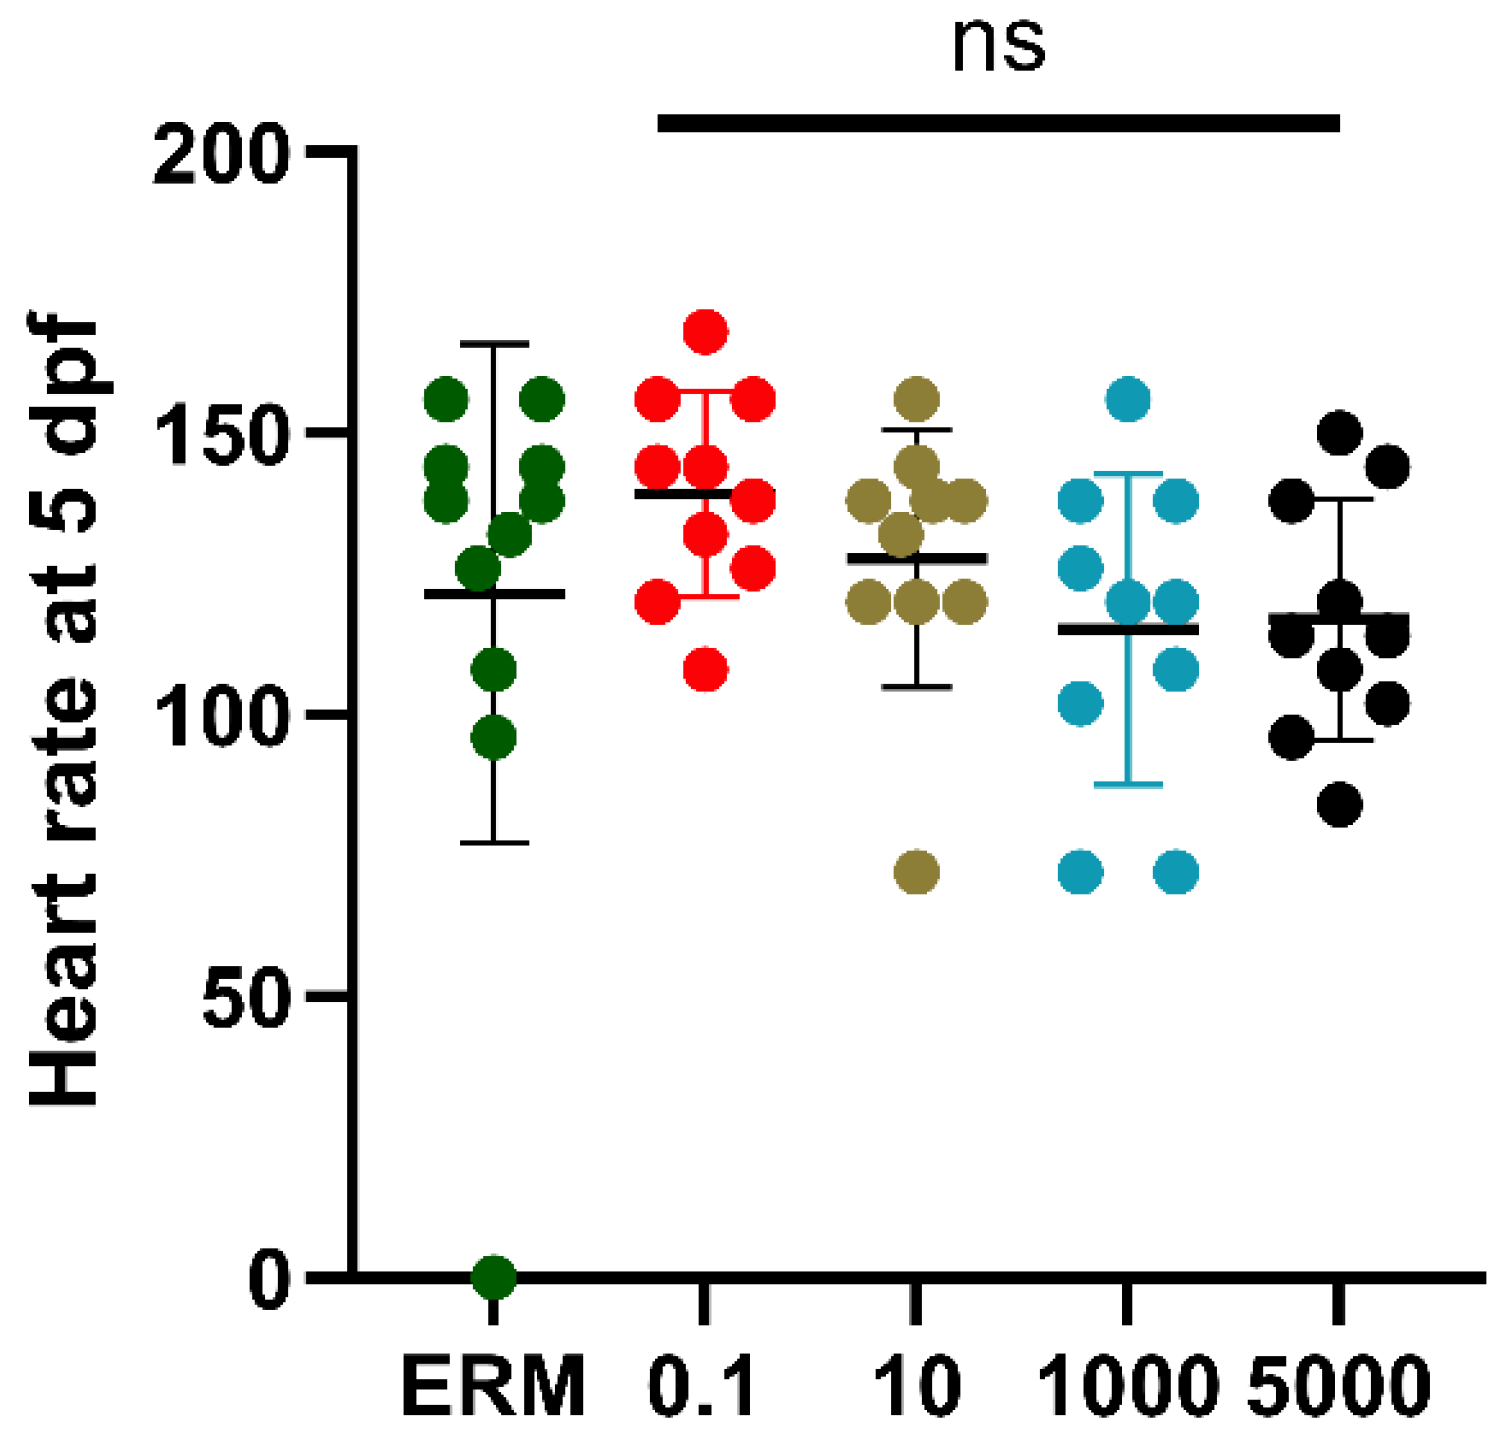
Sporadic malformations, including instances of severe spinal lordosis, pericardial edema and yolk sac edema were documented. However, these deformities were rare (less than 5%) across groups. TBH exposure did not induce significant alterations in hatching rates (F (4, 34) = 0.67, P= 0.62) (Figure 2) across the tested concentrations (p > 0.05). Heart rate was not affected by exposure to TBH up to 5000 µg/L (F (4, 46) = 1.14, P= 0.35) (Figure 3).
Figure 1.
Survival of zebrafish embryos and larvae (0–5 dpf) exposed to TBH. Four experiments were conducted, with approximately 1, 350 larval fish used. Mortality was monitored daily throughout the continuous 120-h exposure period. Data are presented as cumulative percent survival. No statistically significant differences were observed between the control (ERM) and treated groups (p > 0.05; Log-rank Mantel-Cox test).
Figure 1.
Survival of zebrafish embryos and larvae (0–5 dpf) exposed to TBH. Four experiments were conducted, with approximately 1, 350 larval fish used. Mortality was monitored daily throughout the continuous 120-h exposure period. Data are presented as cumulative percent survival. No statistically significant differences were observed between the control (ERM) and treated groups (p > 0.05; Log-rank Mantel-Cox test).
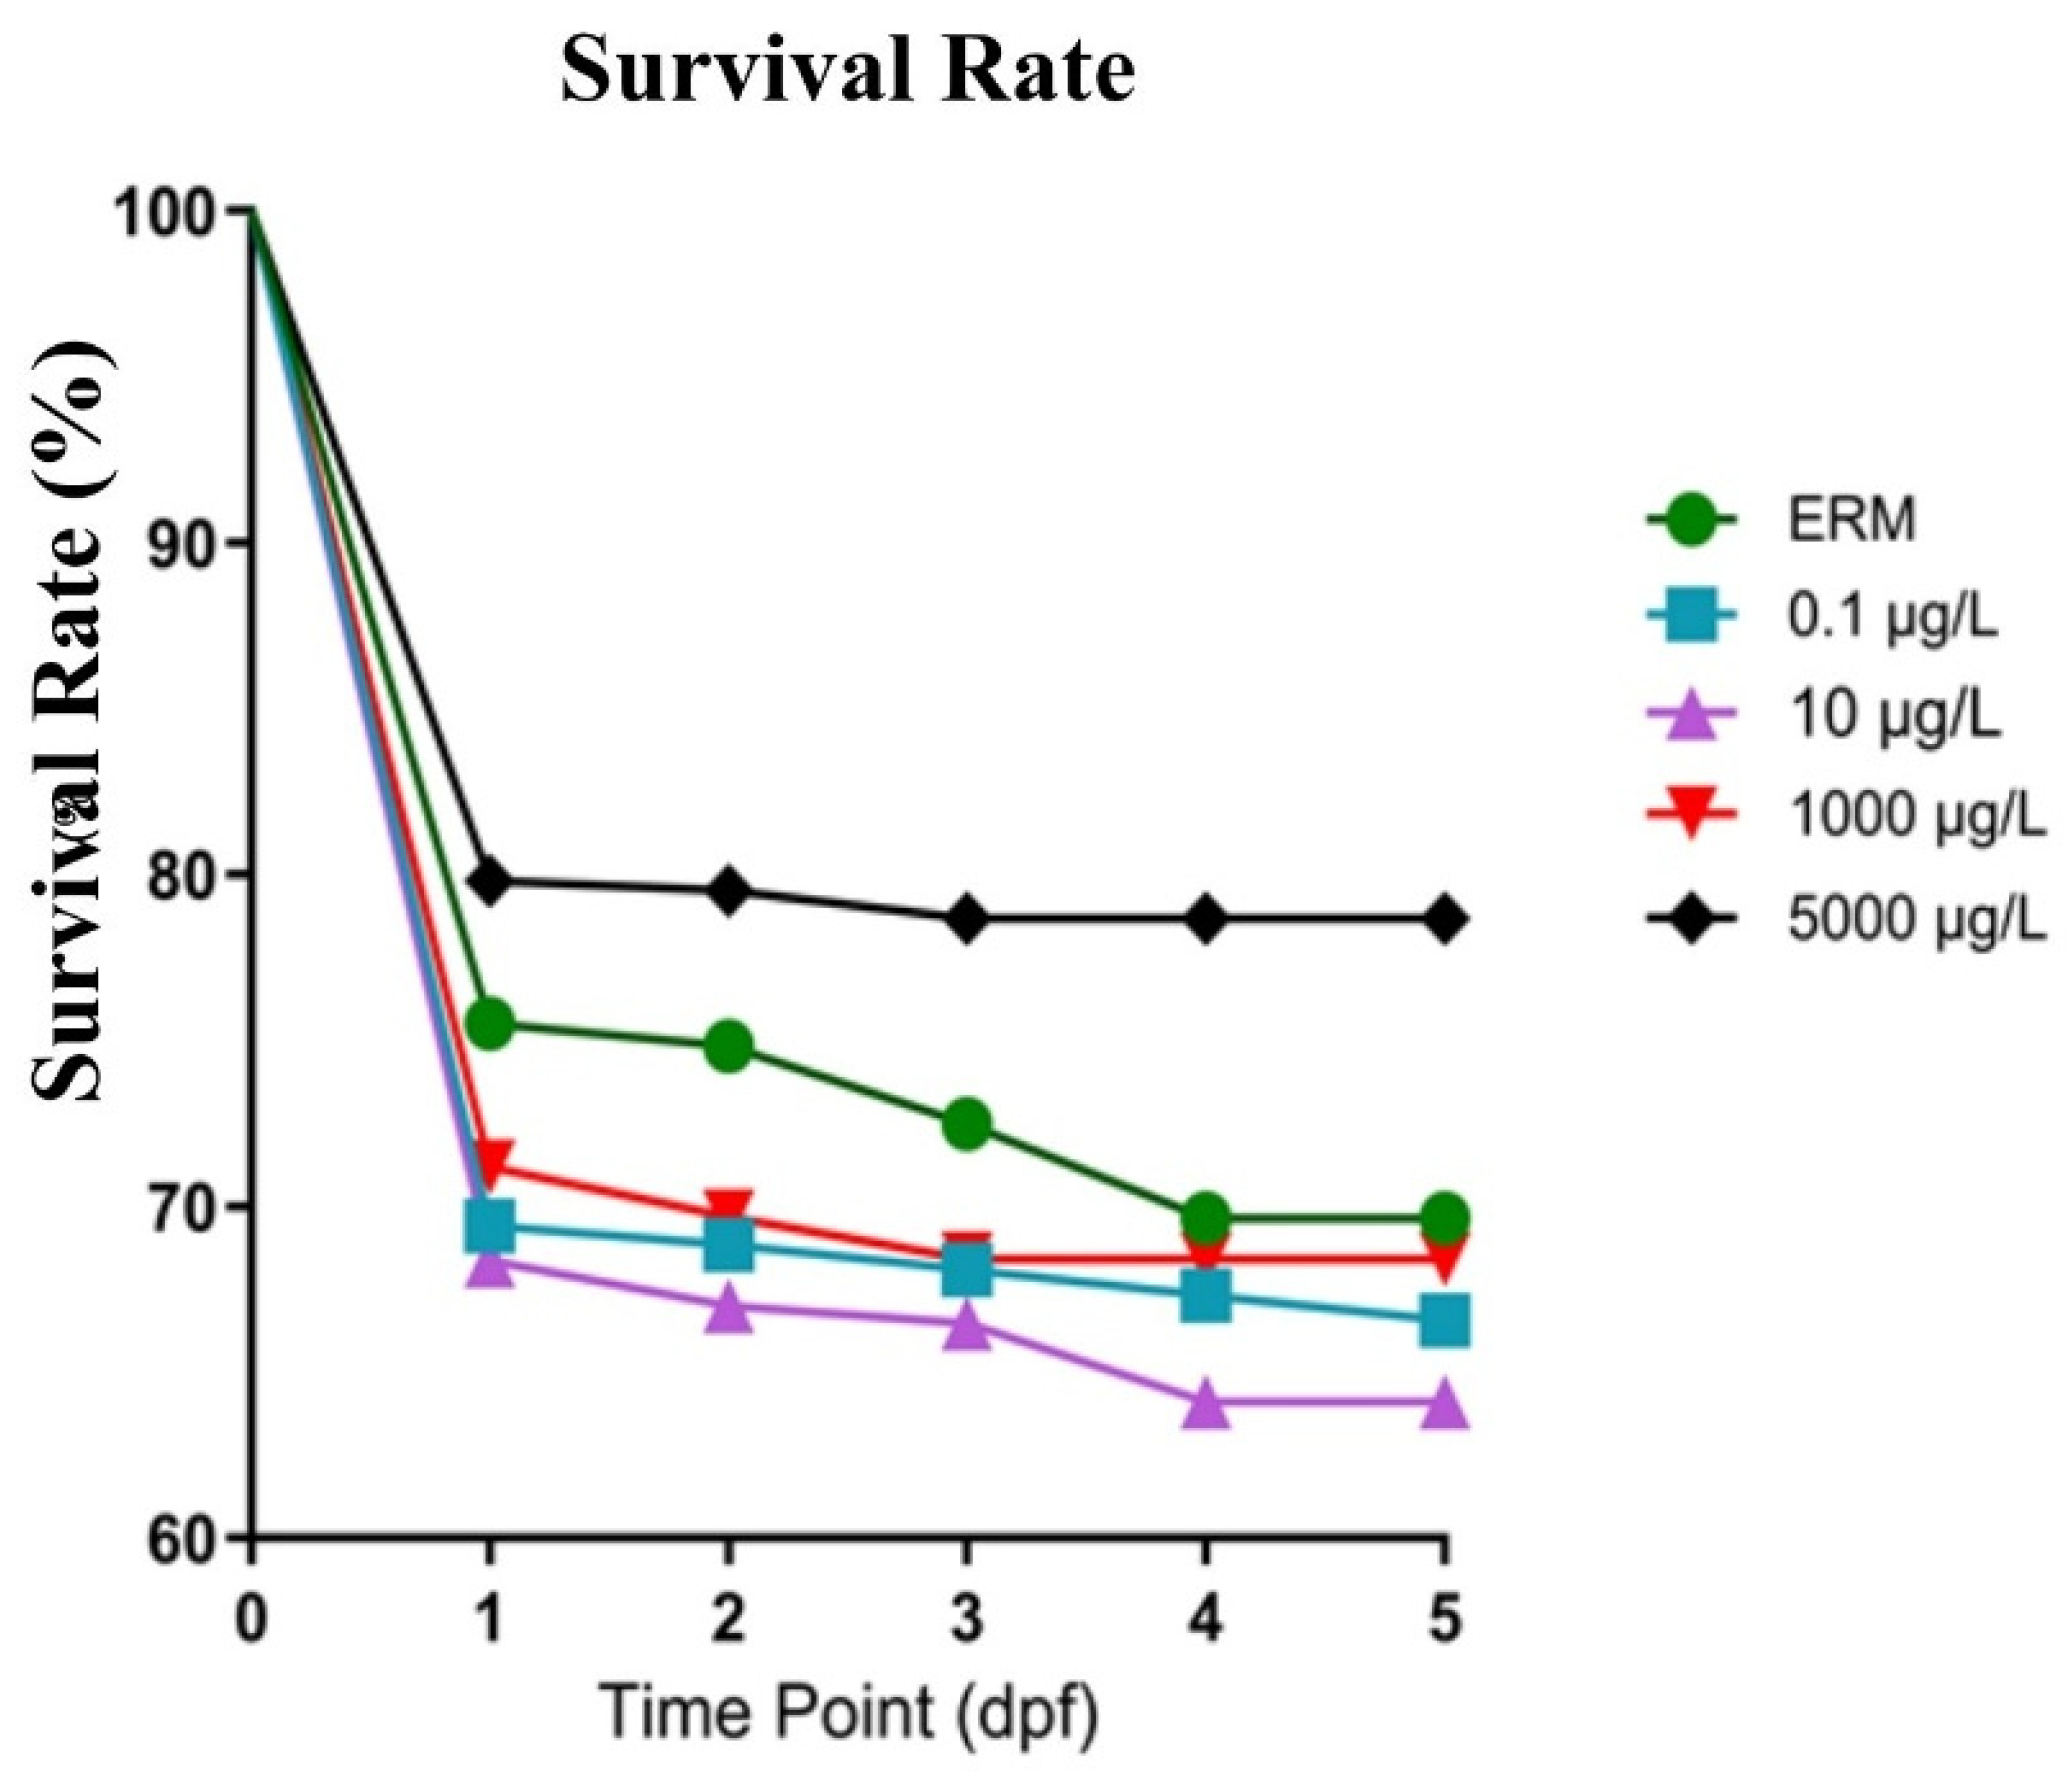
Figure 2.
Hatching success of zebrafish embryos exposed to TBH from 0 to 120 hpf. Data represents the cumulative percentage of successfully hatched embryos per treatment group. Statistical significance was evaluated using One Way ANOVA followed by a Dunnett’s test (p < 0.05). No significant delays in hatching were observed across the tested concentrations. ns= not significant.
Figure 2.
Hatching success of zebrafish embryos exposed to TBH from 0 to 120 hpf. Data represents the cumulative percentage of successfully hatched embryos per treatment group. Statistical significance was evaluated using One Way ANOVA followed by a Dunnett’s test (p < 0.05). No significant delays in hatching were observed across the tested concentrations. ns= not significant.
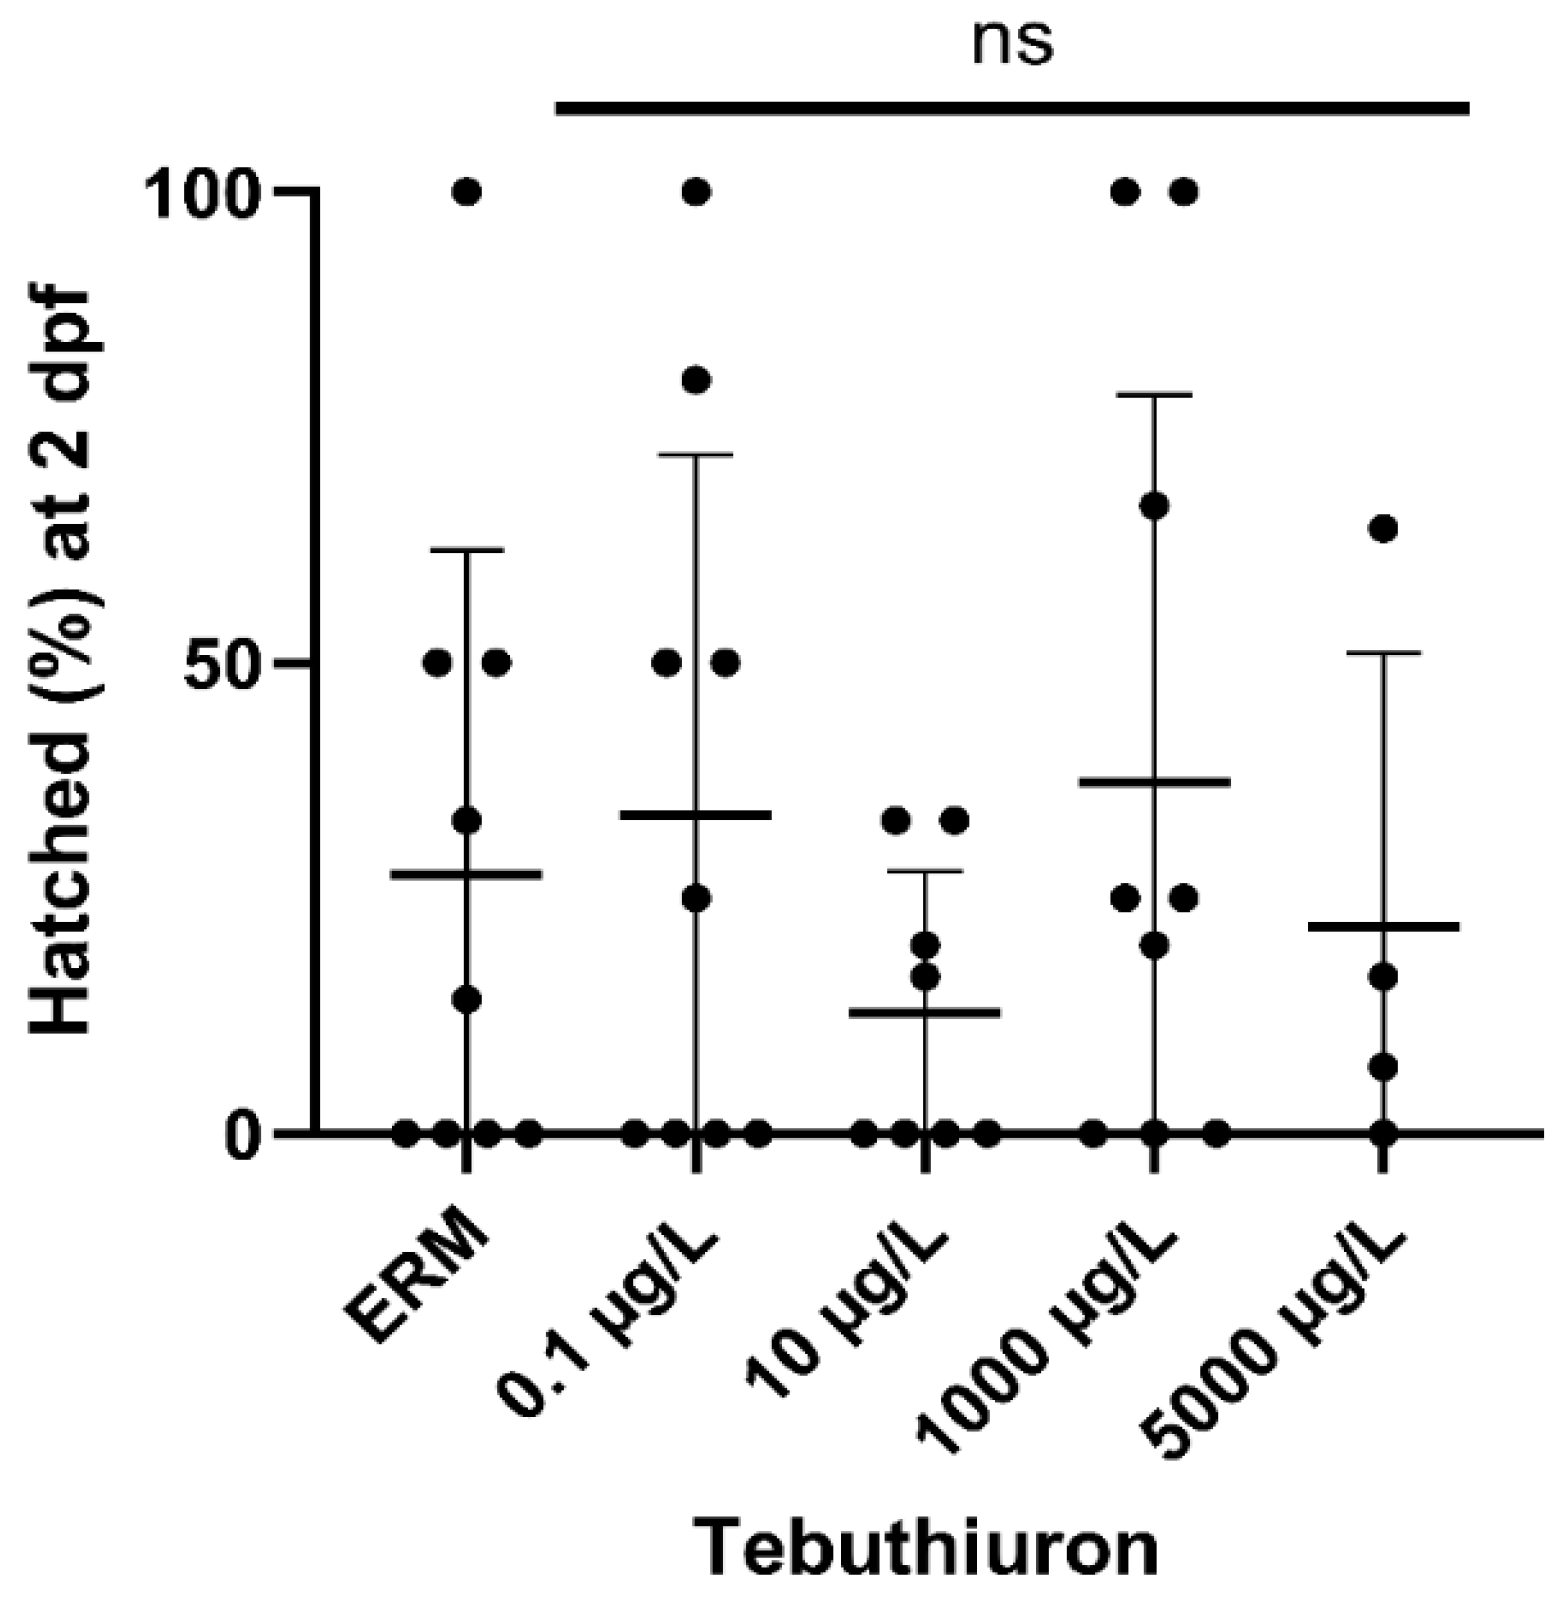
Figure 3.
Heart rate in zebrafish larvae (5 dpf) after exposure to TBH (µg/L). Heart rate is expressed as beats per minute (bpm). Data are presented as mean ± SD (vertical line and horizontal line respectively) (n = 10 fish per treatment). No significant differences were detected between the control and treated groups (p > 0.05; One-Way ANOVA). ns = not significant.
Figure 3.
Heart rate in zebrafish larvae (5 dpf) after exposure to TBH (µg/L). Heart rate is expressed as beats per minute (bpm). Data are presented as mean ± SD (vertical line and horizontal line respectively) (n = 10 fish per treatment). No significant differences were detected between the control and treated groups (p > 0.05; One-Way ANOVA). ns = not significant.
3.2. Visual Motor Response Test
Behavioral responses are presented in Figure 4a-e. During the initial sudden transition to light (Light 1) (F (4, 133) = 6.24, P<0.0001) which naturally induces a hypoactivity in healthy zebrafish, larvae exposed to 10 μg/L TBH exhibited hyperactivity (P= 0.03), in line with the Light 2 phase (F (4, 133) = 12.4, P<0.0001), which showed a high hyperactive response in zebrafish exposed to both 10 μg/L (p < 0.0001) and 1000 μg/L (p < 0.005). The total distance moved in these groups was significantly increased compared to the ERM control (F (4, 133) = 6.241; P = 0.0001). In addition, the concentration of 1000 μg/L induced hyperactivity (p < 0.01) during the third dark period (F (4, 135) = 3.5, P=0.01). Taken together, there is evidence that TBH induces hyperactivity in zebrafish larvae, suggesting neurotoxicity or impaired motor movements.
3.3. Reactive Oxygen Species
A statistically significant reduction in basal ROS levels was observed in larvae (F (4, 13) = 4.82, P= 0.013) exposed to 1000 μg/L TBH compared to the ERM control (Figure 5). The relative fluorescence units in the other exposure groups, including the highest concentration (5000 μg/L), were statistically indistinguishable from the control.
3.4. Acridine Orange Staining
Exposure to TBH did not induce significant alterations in whole-body apoptosis in 5 dpf zebrafish larvae. Quantification of acridine orange (AO) staining revealed no statistically significant differences in mean fluorescence intensity across any of the tested concentrations (0.1, 10, 1000, and 5000 μg/L),(F (4, 96) = 0.58, P=0.68) relative to the ERM negative control (Figure 6).
3.5. Real-Time PCR Analysis
Transcriptional analysis revealed alterations in the expression of genes associated with oxidative stress, apoptosis, and neurodevelopment. Rather than exhibiting a simple concentration-dependent linear response, the expression data demonstrated effects on transcripts at specific exposure thresholds.
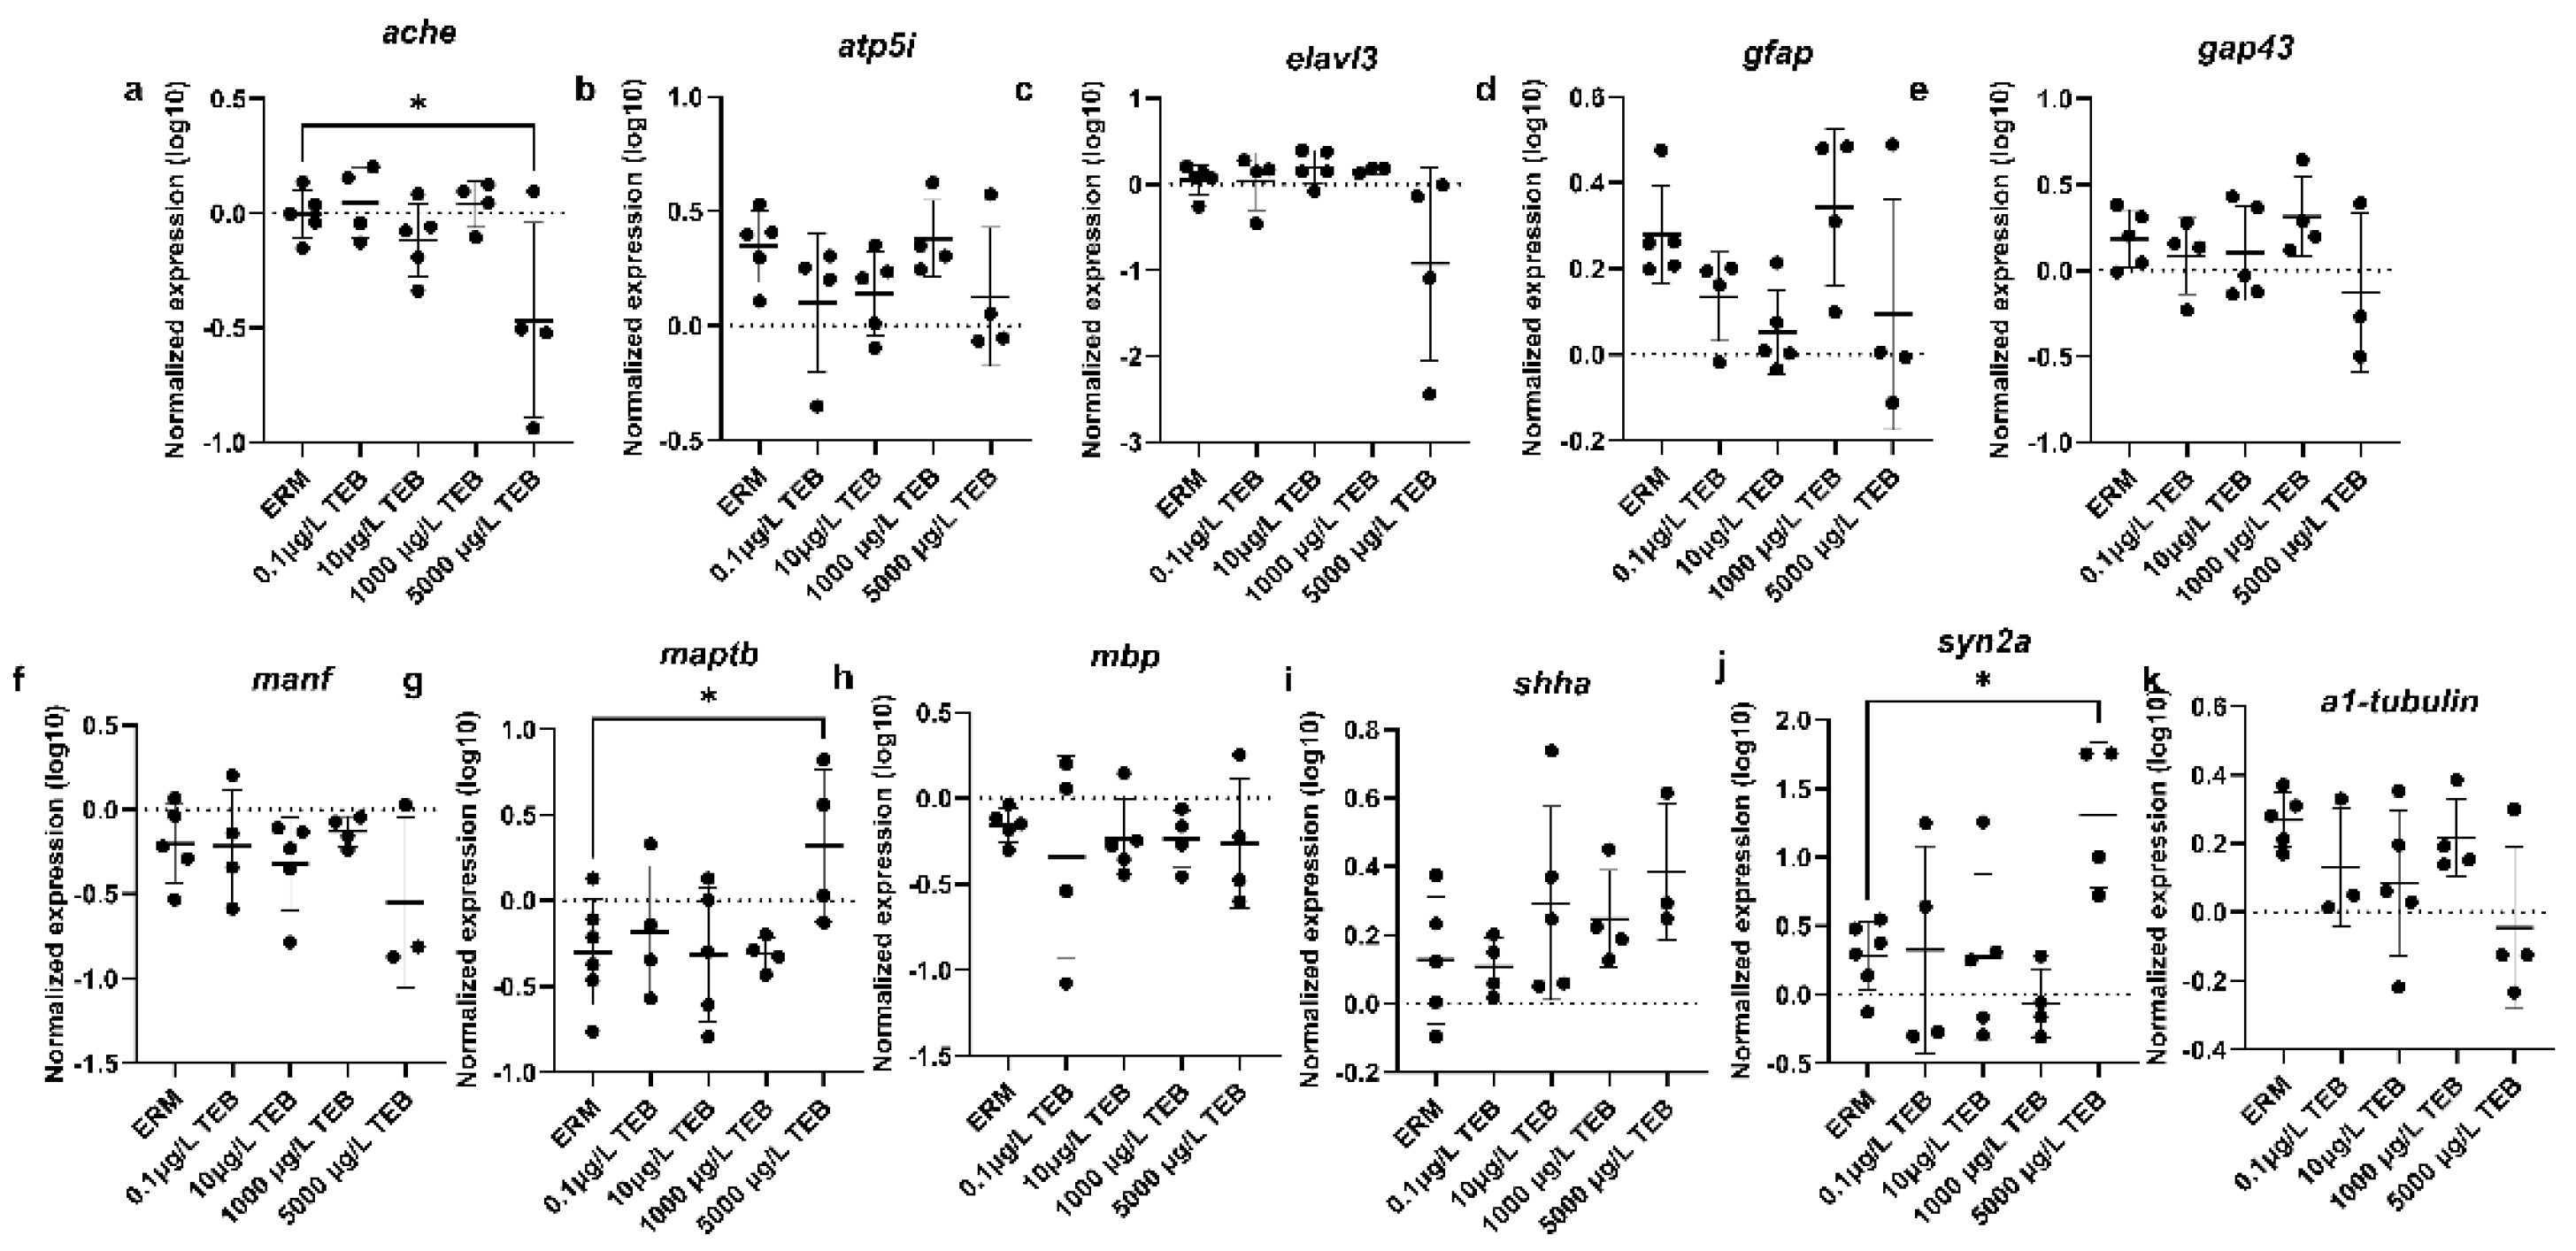
Regarding oxidative stress markers, cat expression was significantly down-regulated (F (4, 16) = 6.24; P= 0.003) at both 10 μg/L (p < 0.05) and 5000 μg/L (p < 0.001) (Figure7a). Similarly, sod1 exhibited significant downregulation (F (4, 17) = 4.492; P=0.012) at 10 μg/L (p<0.05) and 5000 μg/L (p<0.05) (Figure 7c), whereas sod2 showed a significant decrease (F (4, 16) = 5.64; P= 0.005)) only at 5000 μg/L (p=0.03) (Figure 7d). A corresponding spike was observed in the intrinsic apoptotic pathway, with casp9 demonstrating highly significant up-regulation (F (4, 18) = 8.569; P= 0.0005)), at 5000 μg/L (p < 0.001) ((Figure 8.c), and down-regulation (F (4,17) = 3, P=0.046) of nrf at 5000 μg/L (p=0.025) (Figure 8.f). Markers for neurodevelopment and synaptic function also displayed anomalous expression peaks; both maptb and syn2a were significantly up-regulated (F (4, 18) = 2.6; P= 0.07) (p < 0.05) (Figure 9.g) only at the highest concentration of 5000 μg/L, (F (4, 18) = 4.3; P= 0.013) (Figure 9.j). Conversely, cholinergic signaling was disrupted at a different threshold, with ache expression being significantly suppressed (F (4, 17) = 4.02; P= 0.018) at 5000 μg/L (P=0.02) (Figure 9a). Other evaluated transcripts: atp5i (F(4,17)= 1.5, P=0.25), bcl2 (F(4,16)= 2.2, P=0.12), cas3 (F(4,16)= 3, P=0.051), elav3 (F(4,16)= 3.2, P=0.04), gap43 (F(4,16)= 1.2, P=0.34), gfap (F(4,17)= 2.7, P=0.07), gpx (F(4,18)= 1.7, P=0.2), keap (F(4,16)= 1.3, P=0.3), manf (F(4,16)= 1.1, P=0.4), mbp (F(4,17)= 0.18, P=0.9), nqo1(F(4,17)= 1.9, P=0.15),), p53(F(4,17)= 0.98, P= 0.4), shha (F(4,16)= 1.3, P= 0.3), and tubb3 (F(4,16)= 1.6, P= 0.2) did not show significant differential expression across the evaluated concentrations.
4. Discussion
The toxicological profile established in this study indicates that the herbicide TBH acts primarily at physiological and biochemical levels, rather than as a structural teratogen. The lack of acute lethality, cardiotoxicity, and gross teratogenicity observed at concentrations up to 5000 μg/L strongly corroborates the baseline developmental observations previously reported for TBH in zebrafish embryos [19]. From a toxicological standpoint, these stable physiological milestones are highly informative; they suggest that subsequent behavioral and transcriptomic alterations are specific molecular responses to the herbicide, rather than secondary consequences of a systemic physiological collapse. Similar findings have been documented for another phenylurea herbicide, linuron, where early developmental stages and heart rates remained largely unaffected at concentrations up to 623 µg/L and 4982 µg/L respectively, reinforcing the premise that phenylurea-induced toxicity predominantly targets molecular pathways over structural integrity [18].
Despite the absence of morphological defects, TBH exposure elicited severe, non-linear behavioral alterations in 5 dpf larvae, characterized by a progressive dysregulation of the natural photomotor response. The Visual Motor Response (VMR) assay captures the integration of sensory processing and motor execution; because larval locomotion is highly dependent on oxidative respiration efficiency, xenobiotic-induced metabolic reductions often manifest as hypoactivity and a failure to habituate to photic transitions [21]. Emphasizing statistical anomalies over simple linear dose-responses, while the initial sudden transition to darkness (Dark 1) did not yield significant deviations from the control, a paradoxical and severe hyperactive response emerged during the subsequent photic phases. Sudden transitions to light naturally induce basal hypoactivity in healthy zebrafish; however, larvae exposed to 10 μg/L TBH exhibited pronounced hyperactivity during the Light 1 phase. This anomalous hyper-arousal persisted and expanded during the Light 2 phase, manifesting significantly in both the 10 and 1000 μg/L exposure groups. Furthermore, this systemic failure to habituate eventually cascaded into the dark phases, with the 1000 μg/L concentration inducing significant hyperactivity during the final Dark 3 period. While de Oliveira et al. [19] previously documented persistent hyperactivity specifically during dark periods in older (6 dpf) larvae exposed to TBH, the current assessment uncovers a developmentally earlier and distinct photomotor shift. defined by light-induced hyperactivity that eventually disrupts dark-phase rest. This trajectory suggests that TBH actively dysregulates the larvae’s ability to acclimate to dynamic lighting conditions. Notably, this hyperactive manifestation contrasts with the behavioral phenotype reported for the structurally related herbicide linuron, which induced profound hypoactivity under similar VMR paradigms [18]. This underscores that while phenylureas severely disrupt sensory-motor integration, their specific behavioral manifestations—hyper-arousal versus motor depression—can be highly distinct.
This hypothesis of early-stage metabolic exhaustion is biochemically supported by a critical anomaly observed in the reactive oxygen species (ROS) assay. Typically, xenobiotic exposure triggers a ROS generation burst that overwhelms endogenous antioxidant defenses [31]. However, TBH exposure did not induce an oxidative burst; instead, a significant depletion of basal ROS levels was observed specifically at 1000 μg/L. This non-monotonic depletion correlates with the pronounced hypoactivity observed in the exact same treatment group during the photic phase of the VMR assay. This phenomenon aligns with recent toxicological assessments of other phenylurea herbicides. For instance, both linuron and its primary metabolite (3,4-dichloroaniline) have been shown to induce profound mitochondrial dysfunction and redox modulation [32], while diuron disrupts mitochondrial energy metabolism and oxidative phosphorylation in early developmental stages [33,34]. Consequently, a suppression in mitochondrial bioenergetics would directly reduce the natural byproduct of basal ROS. While direct bioenergetic quantification is required to confirm this, such mitochondrial suppression would theoretically limit ATP availability, severely compromising the larvae’s capacity to maintain basal locomotion at 5 dpf. Interestingly, at the highest concentration (5000 μg/L), ROS levels were statistically indistinguishable from the control. This phenomenon suggests that at extreme toxicity thresholds, secondary stress pathways—such as endoplasmic reticulum (ER) stress or the onset of inflammatory responses—may generate compensatory ROS, hypothesized to mask the underlying mitochondrial depletion and further illustrating the non-monotonic nature of TBH toxicity.
The transcriptional profiling of 5 dpf zebrafish larvae exposed to TBH revealed highly specific, non-linear alterations, challenging the classical dose-dependent paradigm. Regarding oxidative stress, the significant downregulation of cat at 10 and 5000 μg/L, alongside the isolated suppression of sod1 (10 and 5000 μg/L) and sod2 (5000 μg/L), is indicative of a Non-Monotonic Dose-Response (NMDR). Rather than mounting a sustained, linear antioxidant defense, the suppression of these critical enzymes at specific thresholds suggests an early exhaustion or breakdown of the endogenous adaptive pathways. This hypothesis of systemic antioxidant collapse is strongly corroborated by the significant downregulation of nrf2a exclusively at the highest concentration (5000 μg/L). The nrf2a transcription factor serves as the master regulator of the cellular antioxidant response, responsible for driving the expression of downstream detoxifying enzymes like SOD and catalase [35]. Its suppression at peak exposure levels indicates that TBH directly impairs the upstream regulatory machinery necessary to combat oxidative damage. Similar non-monotonic transcriptional profiles and antioxidant fatigue have been extensively documented in zebrafish exposed to other widespread contaminants, such as the PSII inhibitor atrazine [36,37] and dimethyl phthalate [38]. This lack of a compensatory transcriptional response aligns with the profound basal metabolic depression observed in the ROS and VMR assays, suggesting that TBH dysregulates energy allocation, which likely precipitates the premature fatigue of the antioxidant defense system before a linear response can be fully mounted.
This state of physiological stress also triggered severe compensatory mechanisms within the developing nervous system. Consistent with de Oliveira et al. [19], who reported that TBH exposure did not significantly affect the mRNA levels of four key neurodevelopmental marker genes (elavl3, gfap, gap43, and shha), basal neurodevelopmental transcripts evaluated in the present study similarly remained unaltered. However, the significant upregulation of maptb and syn2a exclusively at the highest concentration (5000 μg/L) highlights an acute hypercompensatory response. The maptb gene encodes for tau proteins essential for axonal microtubule stabilization [39], while syn2a is crucial for anchoring presynaptic vesicles [40]. The sudden spike in the transcription of these specific structural markers suggests that the larval nervous system is actively attempting to preserve cellular connectivity and stabilize disrupted synaptic architectures in the face of impending xenobiotic neurotoxicity, a transcriptional defense mechanism similarly observed under developmental neurotoxicity induced by difenoconazole [41], trichlorfon [42], and flame retardants [43,44]. This molecular “state of alert” provides a fundamental basis for the chaotic hyperactive motor responses observed during the light phases of the behavioral assay. Furthermore, this neurological dysregulation is corroborated by the significant transcriptional suppression of ache at 5000 μg/L. The downregulation of this critical cholinergic transcript at 5 dpf provides compelling molecular support for the hypothesis that the late-stage AChE enzymatic inhibition observed by de Oliveira et al. [19] at concentrations above 100 μg/L may originate as a transcriptional failure during earlier developmental windows.
Perhaps the most counterintuitive finding of this assessment is the discrepancy between the intrinsic apoptotic pathway transcription and phenotypic cell death. Real-time PCR revealed a massive, highly significant upregulation of casp9 at 5000 μg/L however, in vivo whole-body apoptosis assays using acridine orange (AO) staining showed no significant phenotypic cell death. This transcriptional-phenotypic decoupling is mechanistically supported by the ontogeny of the zebrafish. First, sub-lethal and compartmentalized casp9 activity is a known physiological requirement for non-apoptotic neurodevelopmental processes, specifically axon pruning, synapse elimination, and glial differentiation [45,46]. Furthermore, the caspase family in zebrafish plays extensive roles beyond classical cell death during embryogenesis [47,48]. While maptb and syn2a are primarily neuro-specific markers, the use of whole-body homogenates in this study limits the ability to restrict these casp9 signals exclusively to the central nervous system. However, the concurrent upregulation of these synaptic and microtubule transcripts strongly implies a neuro-centric repair mechanism. Therefore, it is plausible that the larval brain is leveraging casp9 to cleanly amputate damaged axonal projections without inducing whole-cell death, which directly correlates with the simultaneous maptb and syn2a repair efforts. In addition, this discrepancy highlights a kinetic and analytical latency. The extreme sensitivity of qPCR captures early, transient shifts in mRNA before post-transcriptional checkpoints—such as Inhibitor of Apoptosis Proteins (IAPs)—can sequester the zymogens. Conversely, the AO vital dye exclusively intercalates into nucleic acids during the terminal stages of chromatin condensation [49]. Therefore, TBH effectively triggers the molecular precursors of the apoptotic cascade, but endogenous biological circuit breakers appear to prevent the widespread execution of cellular degradation by 5 dpf.
In summary, the integration of behavioral, biochemical, and molecular endpoints in this study provides a comprehensive look at TBH ecotoxicity that fundamentally challenges classical, linear dose-response paradigms. While traditional macro-structural assessments could erroneously classify this herbicide as low-risk due to the absence of gross teratogenicity, this multi-tiered approach uncovers a complex sequence of sublethal injuries. The data points toward an ontogenetic cascade starting with an early stage bioenergetic collapse that physically limits larval locomotion, transitioning into a state of severe neurodevelopmental stress and a fully activated, yet post-transcriptionally gated, apoptotic trigger at higher thresholds. These non-monotonic mechanisms highlight that evaluating pesticide safety based solely on lethality or visible malformations severely underestimates the silent, systemic physiological disruptions that phenylurea herbicides pose to non-target aquatic vertebrates.
Supplementary Materials
The following supporting information can be downloaded at the website of this paper posted on Preprints.org
Author Contributions
Conceptualization, C.J.M. and GF; methodology, G.F., A.S., F.C., J.G., E.C.L.G; formal analysis, A.S., G.F., C.J.M. and JG.; investigation, G.F., A.S., F.C., J.G., E.C.L.G; resources, C.J.M.; writing—original draft preparation, G.F, A.S., C.J.M.; writing—review and editing, G.F., A.S., F.C., J.G., E.C.L.G; visualization; A.S.; supervision, C.J.M; project administration, C.J.M; funding acquisition, G.F., C.J.M. All authors have read and agreed to the published version of the manuscript.
Funding
This research was funded by the São Paulo Research Foundation (FAPESP), grant number 2025/15628-2 to G.F. The research was also funded by grant number RESOL-2025-1316-APN-DIR#CONICET to E.C.L.G.
Institutional Review Board Statement
The study was conducted in accordance with the animal study protocol was approved by the Institutional Review Board (or Ethics Committee) of the University of Florida (protocol code IACUC202100000080, approved April 2021).
Informed Consent Statement
Not applicable.
Data Availability Statement
The original contributions presented in this study are included in the article/Supplementary material. Further inquiries can be directed to the corresponding author.
Acknowledgments
The graphical abstract was produced with Biorender.com.
Conflicts of Interest
The authors declare no conflicts of interest.
Abbreviations
The following abbreviations are used in this manuscript:
| ERM | Embryo Rearing Media |
| GFP | Green Fluorescent Protein |
| PBS | Phosphate-Buffered Saline |
| PCR | Polymerase Chain Reaction |
| TBH | Tebuthiuron |
| NMDR | Non-Monotonic Dose-Response |
| VMR | Visual Motor response |
References
- Franco-Bernardes, M.F.; et al. The herbicides trifluralin and tebuthiuron have no genotoxic or mutagenic potential as evidenced by genetic tests. Environ. Sci. Pollut. Res. 2017, 24(30), 24029–24037. [Google Scholar] [CrossRef]
- SANITÁRIA, I.E.V. ANVISA–AGÊNCIA NACIONAL DE VIGILÂNCIA SANITÁRIA. 2013, RDC.
- Zhang, W. Global pesticide use: Profile, trend, cost/benefit and more. Proc. Int. Acad. Ecol. Environ. Sci. 2018, 8(1), 1. [Google Scholar] [CrossRef]
- Moreira, B.R.d.A.; et al. Adsorption of tebuthiuron on hydrochar: structural, kinetic, isothermal, and mechanistic modeling, and ecotoxicological validation of remediative treatment of aqueous system. Biomass Convers. Biorefinery 2024, 14(18), 21741–21755. [Google Scholar] [CrossRef]
- de Almeida, M.D.; et al. Estrogenic and anti-androgenic effects of the herbicide tebuthiuron in male Nile tilapia (Oreochromis niloticus). Aquat. Toxicol. 2018, 194, 86–93. [Google Scholar] [CrossRef] [PubMed]
- Mostafa, F.I.; Helling, C.S. Isolation and 16S DNA characterization of soil microorganisms from tropical soils capable of utilizing the herbicides hexazinone and tebuthiuron. J. Environ. Sci. Health Part B 2003, 38(6), 783–797. [Google Scholar] [CrossRef]
- Qian, Y.; et al. Dissipation, occurrence and risk assessment of a phenylurea herbicide tebuthiuron in sugarcane and aquatic ecosystems in South China. Environ. Pollut. 2017, 227, 389–396. [Google Scholar] [CrossRef] [PubMed]
- de Lima, E.W.; et al. A synergistic bacterial pool decomposes tebuthiuron in soil. Sci. Rep. 2022, 12(1), 9225. [Google Scholar] [CrossRef] [PubMed]
- Mendes, K.F.; et al. Phytoremediation of quinclorac and tebuthiuron-polluted soil by green manure plants. Int. J. Phytoremediation 2021, 23(5), 474–481. [Google Scholar] [CrossRef] [PubMed]
- Pires, F.; et al. Seleção de plantas com potencial para fitorremediação de tebuthiuron. Planta Daninha 2003, 21(3), 451–458. [Google Scholar] [CrossRef]
- Grott, S.C.; et al. Influence of temperature on growth, development and thyroid metabolism of American bullfrog tadpoles (Lithobates catesbeianus) exposed to the herbicide tebuthiuron. Environ. Toxicol. Pharmacol. 2022, 94, 103910. [Google Scholar] [CrossRef] [PubMed]
- Machado, C.S.; et al. Chemical contamination of water and sediments in the Pardo River, São Paulo, Brazil. Procedia Eng. 2016, 162, 230–237. [Google Scholar] [CrossRef]
- Barizon, R.R.M.; et al. Surface water contamination from pesticide mixtures and risks to aquatic life in a high-input agricultural region of Brazil. Chemosphere 2022, 308, 136400. [Google Scholar] [CrossRef]
- Souza, E.; et al. Comportamento do tebuthiuron em solo de cultivo de cana-de-açúcar utilizando lisímetro de drenagem modificado. Planta Daninha 2008, 26(1), 157–163. [Google Scholar] [CrossRef]
- Temple, A.J. The effects of tebuthiuron on aquatic productivity; Texas Tech University, 1985. [Google Scholar]
- Elizalde-Velázquez, G.A.; Herrera-Vázquez, S.E. Zebrafish as model organism in aquatic ecotoxicology: current trends and future perspectives, in Zebrafish Research-An Ever-Expanding experimental model. 2023, IntechOpen.
- Marlatt, V.L.; Martyniuk, C.J. Biological responses to phenylurea herbicides in fish and amphibians: New directions for characterizing mechanisms of toxicity. Comp. Biochem. Physiol. Part C Toxicol. Pharmacol. 2017, 194, 9–21. [Google Scholar] [CrossRef]
- Maharaj, S.; et al. Sub-lethal toxicity assessment of the phenylurea herbicide linuron in developing zebrafish (Danio rerio) embryo/larvae. Neurotoxicology Teratol. 2020, 81, 106917. [Google Scholar] [CrossRef]
- de Oliveira, A.Á.S.; et al. Integrating morphological, biochemical, behavioural, and molecular approaches to investigate developmental toxicity triggered by tebuthiuron in zebrafish (Danio rerio). Chemosphere 2023, 340, 139894. [Google Scholar] [CrossRef] [PubMed]
- Huang, T.; et al. Behavioral and developmental toxicity assessment of the strobilurin fungicide fenamidone in zebrafish embryos/larvae (Danio rerio). Ecotoxicol. Environ. Saf. 2021, 228, 112966. [Google Scholar] [CrossRef] [PubMed]
- Perez-Rodriguez, V.; et al. Tebuconazole reduces basal oxidative respiration and promotes anxiolytic responses and hypoactivity in early-staged zebrafish (Danio rerio). Comp. Biochem. Physiol. Part C Toxicol. Pharmacol. 2019, 217, 87–97. [Google Scholar] [CrossRef]
- Ivantsova, E.; Konig, I.; Lopez-Scarim, V.; English, C.; Charnas, S.R.; Souders, C.L.; Martyniuk, C.J. Molecular and behavioral toxicity assessment of tiafenacil, a novel PPO-inhibiting herbicide, in zebrafish embryos/larvae. Environ. Toxicol. Pharmacol. 2023, 98, 104084. [Google Scholar] [CrossRef] [PubMed]
- An, G.; Hong, T.; Park, H.; Lim, W.; Song, G. Oxamyl exerts developmental toxic effects in zebrafish by disrupting the mitochondrial electron transport chain and modulating PI3K/Akt and p38 Mapk signaling. Sci. Total Environ. 2023, 859(Part 2), 160458. [Google Scholar] [CrossRef] [PubMed]
- Lu, X.; Liu, Y.; Zhang, D.; Liu, K.; Wang, Q.; Wang, H. Determination of the panel of reference genes for quantitative real-time PCR in fetal and adult rat intestines. Reprod. Toxicol. 2021, 104, 68–75. [Google Scholar] [CrossRef] [PubMed]
- Deng, J.; et al. Hexabromocyclododecane-induced developmental toxicity and apoptosis in zebrafish embryos. Aquat. Toxicol. 2009, 93(1), 29–36. [Google Scholar] [CrossRef] [PubMed]
- Sarkar, S.; et al. Low dose of arsenic trioxide triggers oxidative stress in zebrafish brain: expression of antioxidant genes. Ecotoxicol. Environ. Saf. 2014, 107, 1–8. [Google Scholar] [CrossRef] [PubMed]
- Luzio, A.; Monteiro, S.M.; Fontainhas-Fernandes, A.A.; Pinto-Carnide, O.; Matos, M.; Coimbra, A.M. Copper induced upregulation of apoptosis related genes in zebrafish (Danio rerio) gill. Aquat. Toxicol. 2013, 128–129, 183–189. [Google Scholar] [CrossRef] [PubMed]
- Dong, M.; et al. 3-bromocarbazole-induced developmental neurotoxicity and effect mechanisms in zebrafish. ACS ES&T Water 2023, 3(8), 2471–2480. [Google Scholar] [CrossRef]
- Zhao, X.; et al. Quercetin mitigates ethanol-induced hepatic steatosis in zebrafish via P2X7R-mediated PI3K/Keap1/Nrf2 signaling pathway. J. Ethnopharmacol. 2021, 268, 113569. [Google Scholar] [CrossRef] [PubMed]
- Wu, Q.; et al. Microcystin-LR exposure induces developmental neurotoxicity in zebrafish embryo. Environ. Pollut. 2016, 213, 793–800. [Google Scholar] [CrossRef] [PubMed]
- Lushchak, V.I. Contaminant-induced oxidative stress in fish: a mechanistic approach. Fish. Physiol. Biochem. 2016, 42(2), 711–747. [Google Scholar] [PubMed]
- Jakaria, M.; Cannon, J.R. Insights into cytotoxicity and redox modulation by the herbicide linuron and its metabolite, 3, 4-dichloroaniline. Neurotoxicology 2025, 103324. [Google Scholar] [CrossRef] [PubMed]
- Lima, T.R.R.; et al. Diuron and its metabolites induce mitochondrial dysfunction-mediated cytotoxicity in urothelial cells. Toxicol. Mech. Methods 2024, 34(1), 32–45. [Google Scholar] [PubMed]
- Shi, J.; et al. A metabolomics study unravels the hepatotoxic mechanism of diuron in zebrafish: Disruption of glutathione synthesis and mitochondrial energy metabolism. Aquat. Toxicol. 2026, 107702. [Google Scholar] [CrossRef] [PubMed]
- Li, H.; et al. Role of Nrf2 in the antioxidation and oxidative stress induced developmental toxicity of honokiol in zebrafish. Toxicol. Appl. Pharmacol. 2019, 373, 48–61. [Google Scholar] [CrossRef] [PubMed]
- Khoshnood, Z. A review on toxic effects of pesticides in zebrafish, Danio rerio and common carp, Cyprinus carpio, emphasising atrazine herbicide. Toxicol. Rep. 2024, 13, 101694. [Google Scholar] [CrossRef] [PubMed]
- Jin, Y.; et al. Oxidative stress response and gene expression with atrazine exposure in adult female zebrafish (Danio rerio). Chemosphere 2010, 78(7), 846–852. [Google Scholar] [CrossRef] [PubMed]
- Cong, B.; et al. The impact on antioxidant enzyme activity and related gene expression following adult zebrafish (Danio rerio) exposure to dimethyl phthalate. Animals 2020, 10(4), 717. [Google Scholar] [CrossRef] [PubMed]
- Moussavi Nik, S.H.; et al. Hypoxia alters expression of Zebrafish Microtubule-associated protein Tau (mapta, maptb) gene transcripts. BMC Res. Notes 2014, 7(1), 767. [Google Scholar] [CrossRef] [PubMed]
- Pullaguri, N.; et al. Triclosan affects motor function in zebrafish larva by inhibiting ache and syn2a genes. Chemosphere 2021, 266, 128930. [Google Scholar] [CrossRef] [PubMed]
- Yang, Q.; et al. Developmental neurotoxicity of difenoconazole in zebrafish embryos. Toxics 2023, 11(4), 353. [Google Scholar] [CrossRef] [PubMed]
- Shi, Q.; et al. Developmental neurotoxicity of trichlorfon in zebrafish larvae. Int. J. Mol. Sci. 2023, 24(13), 11099. [Google Scholar] [CrossRef] [PubMed]
- Sun, Y.; et al. Evaluation and mechanistic study of transgenerational neurotoxicity in zebrafish upon life cycle exposure to decabromodiphenyl ethane (DBDPE). Environ. Sci. Technol. 2023, 57(44), 16811–16822. [Google Scholar] [CrossRef] [PubMed]
- Zhang, X.; et al. Neurotoxicity and Mechanism in Zebrafish Embryo Induced by Tetrabromobisphenol A bis (2-Hydroxyethyl) Ether (TBBPA-DHEE) Exposure. Toxics 2025, 13(2), 76. [Google Scholar] [CrossRef] [PubMed]
- Mukherjee, A.; Williams, D.W. More alive than dead: non-apoptotic roles for caspases in neuronal development, plasticity and disease. Cell Death Differ. 2017, 24(8), 1411–1421. [Google Scholar] [CrossRef] [PubMed]
- Hollville, E.; Deshmukh, M. Deshmukh. Physiological functions of non-apoptotic caspase activity in the nervous system. in Seminars in cell & developmental biology. 2018. 28: p. 127-136 Academic Press. Elsevier.
- Miura, M. Apoptotic and Non-apoptotic Caspase Functions in Neural Development. Neurochem. Res. 2011, 36(7), 1253–1260. [Google Scholar] [PubMed]
- Spead, O.; Verreet, T.; Donelson, C. J.; Poulain, F. E. Characterization of the caspase family in zebrafish. PLoS ONE 2018, 13((5)), e0197966. [Google Scholar] [CrossRef] [PubMed]
- Plemel, J.R.; et al. Unique spectral signatures of the nucleic acid dye acridine orange can distinguish cell death by apoptosis and necroptosis. J. Cell Biol. 2017, 216(4), 1163–1181. [Google Scholar] [CrossRef] [PubMed]
Figure 4.
Effects of TBH on zebrafish larval (5 dpf) locomotor activity during the Visual Motor Response (VMR) assay. Total distance moved (mm) was recorded during alternating 10-min dark and light phases following a 2-h acclimation period. Data are presented as mean ±SD (n = 133-135 larvae per treatment). Three independent experiments were conducted, and data normalized to a value = 1 for the ERM group. All other treatments are presented as relative movement to ERM control. Asterisks indicate significant differences between the control and treated groups (*p < 0.05; **p < 0.01; ****p < 0.0001), as determined by a One-way ANOVA test followed by Dunnett’s post-hoc test for discrete time bins.
Figure 4.
Effects of TBH on zebrafish larval (5 dpf) locomotor activity during the Visual Motor Response (VMR) assay. Total distance moved (mm) was recorded during alternating 10-min dark and light phases following a 2-h acclimation period. Data are presented as mean ±SD (n = 133-135 larvae per treatment). Three independent experiments were conducted, and data normalized to a value = 1 for the ERM group. All other treatments are presented as relative movement to ERM control. Asterisks indicate significant differences between the control and treated groups (*p < 0.05; **p < 0.01; ****p < 0.0001), as determined by a One-way ANOVA test followed by Dunnett’s post-hoc test for discrete time bins.
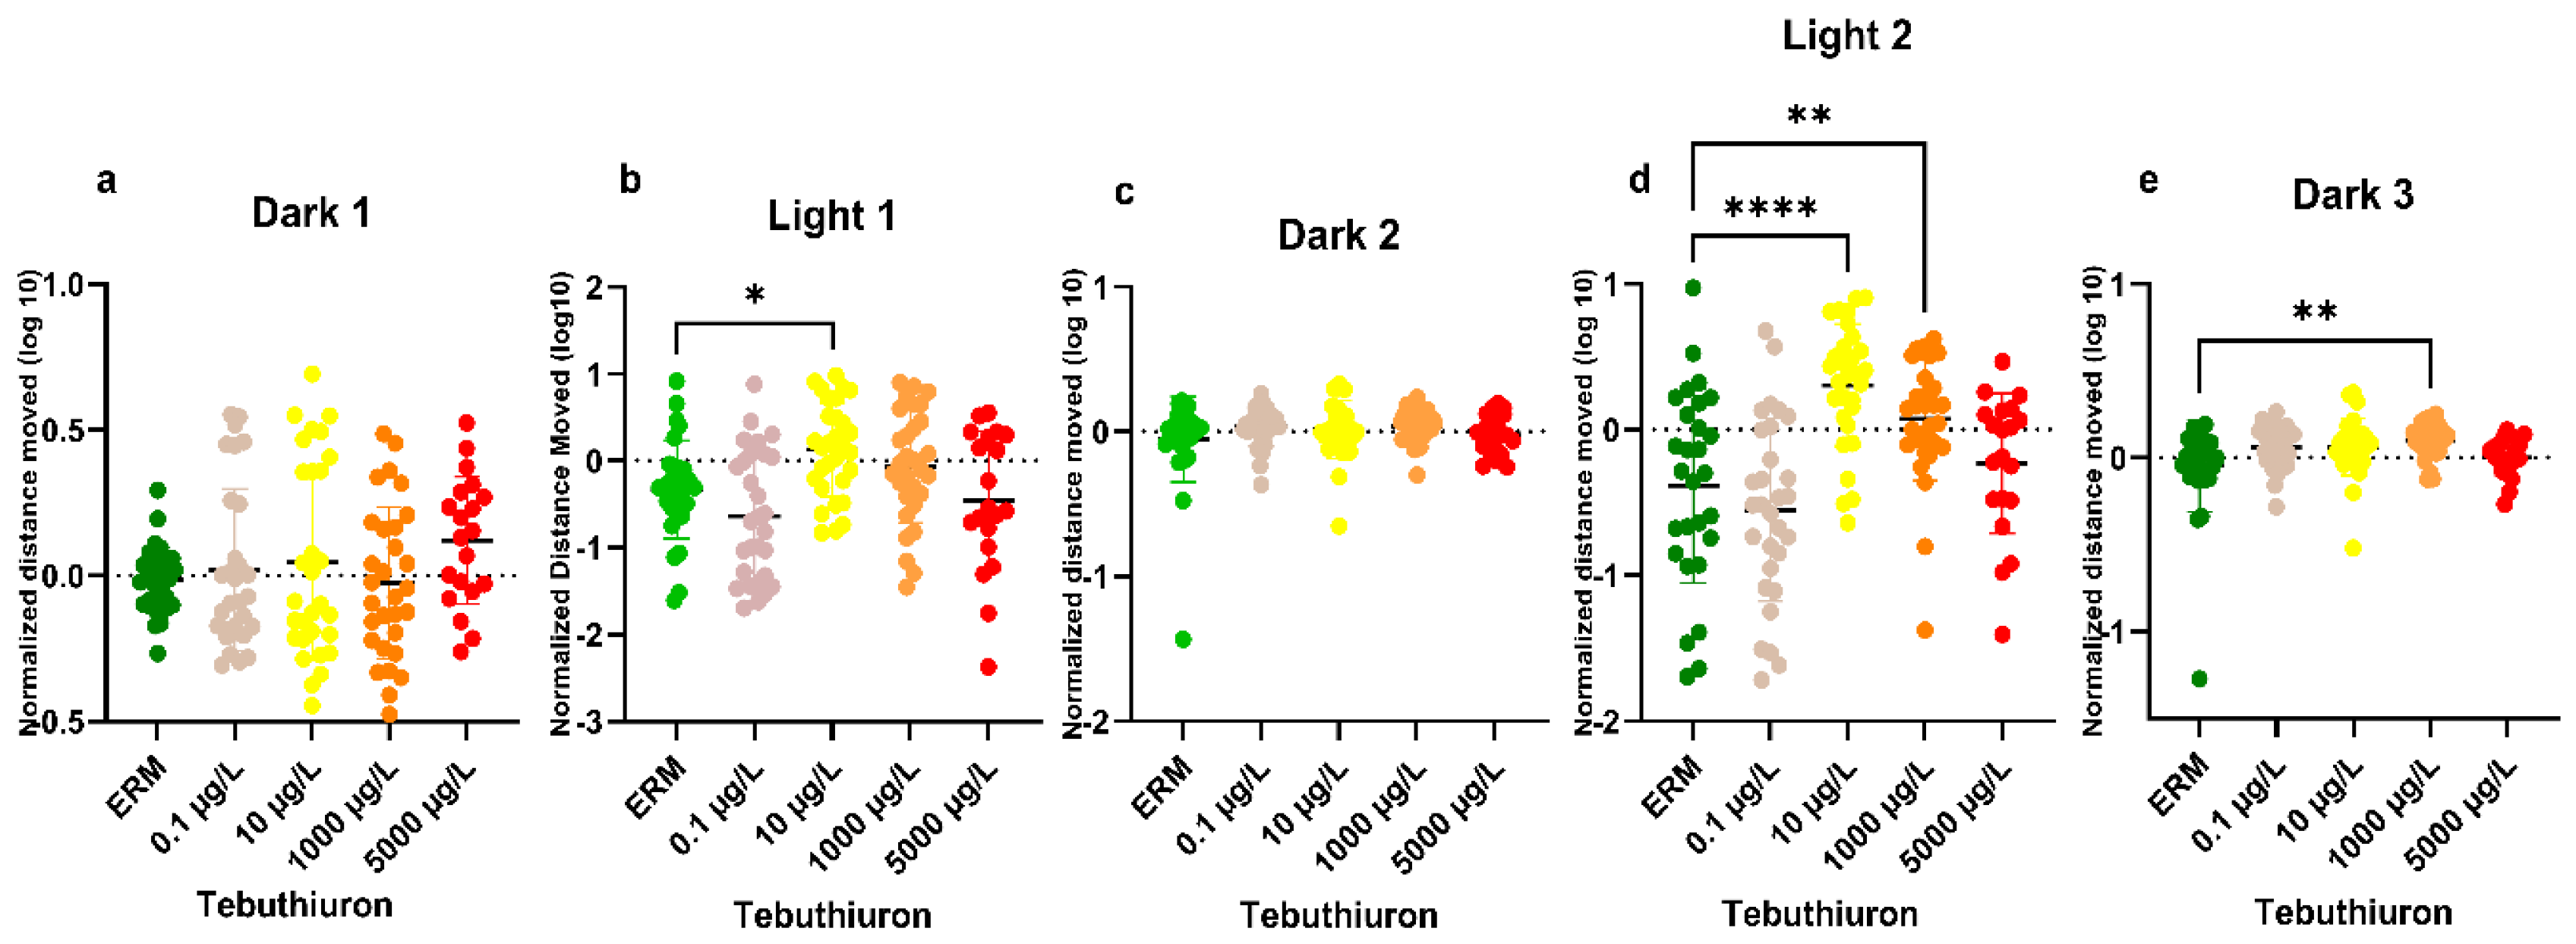
Figure 5.
Whole-body reactive oxygen species (ROS) production in zebrafish larvae (5 dpf) following exposure to TBH. ROS levels are expressed as relative fluorescence units normalized to total protein content (µg protein/ml media). Data are presented as mean ±SD (n = 3-5 biological replicates of 10-15 larvae per treatment). Asterisks indicate a significant difference compared to the control group (p < 0.05), as determined by a One-Way ANOVA followed by Dunnett’s multiple comparisons test.
Figure 5.
Whole-body reactive oxygen species (ROS) production in zebrafish larvae (5 dpf) following exposure to TBH. ROS levels are expressed as relative fluorescence units normalized to total protein content (µg protein/ml media). Data are presented as mean ±SD (n = 3-5 biological replicates of 10-15 larvae per treatment). Asterisks indicate a significant difference compared to the control group (p < 0.05), as determined by a One-Way ANOVA followed by Dunnett’s multiple comparisons test.
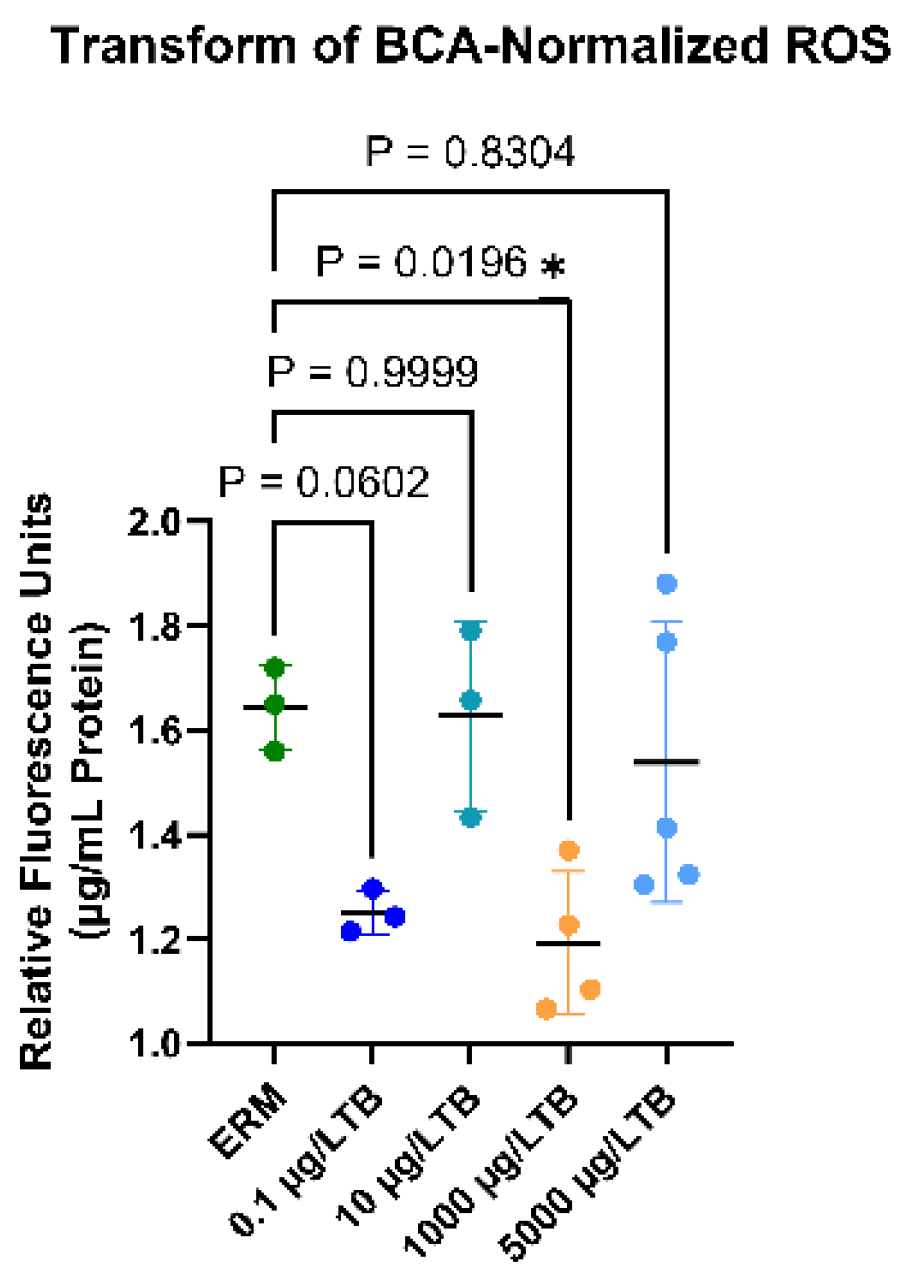
Figure 6.
Effect of TBH on whole-body apoptosis in zebrafish larvae. Mean fluorescence intensity of Acridine Orange (AO) stain in 5 dpf larvae exposed to Embryo Rearing Media (ERM control) or varying concentrations of TBH (0.1 up to 5000 μg/L), (n=17-22 per treatment). Data are presented as mean ± SD. “ns” indicates no statistical significance among treatment groups compared to the control (One-Way ANOVA followed by Dunnett’s multiple test relative to ERM).
Figure 6.
Effect of TBH on whole-body apoptosis in zebrafish larvae. Mean fluorescence intensity of Acridine Orange (AO) stain in 5 dpf larvae exposed to Embryo Rearing Media (ERM control) or varying concentrations of TBH (0.1 up to 5000 μg/L), (n=17-22 per treatment). Data are presented as mean ± SD. “ns” indicates no statistical significance among treatment groups compared to the control (One-Way ANOVA followed by Dunnett’s multiple test relative to ERM).
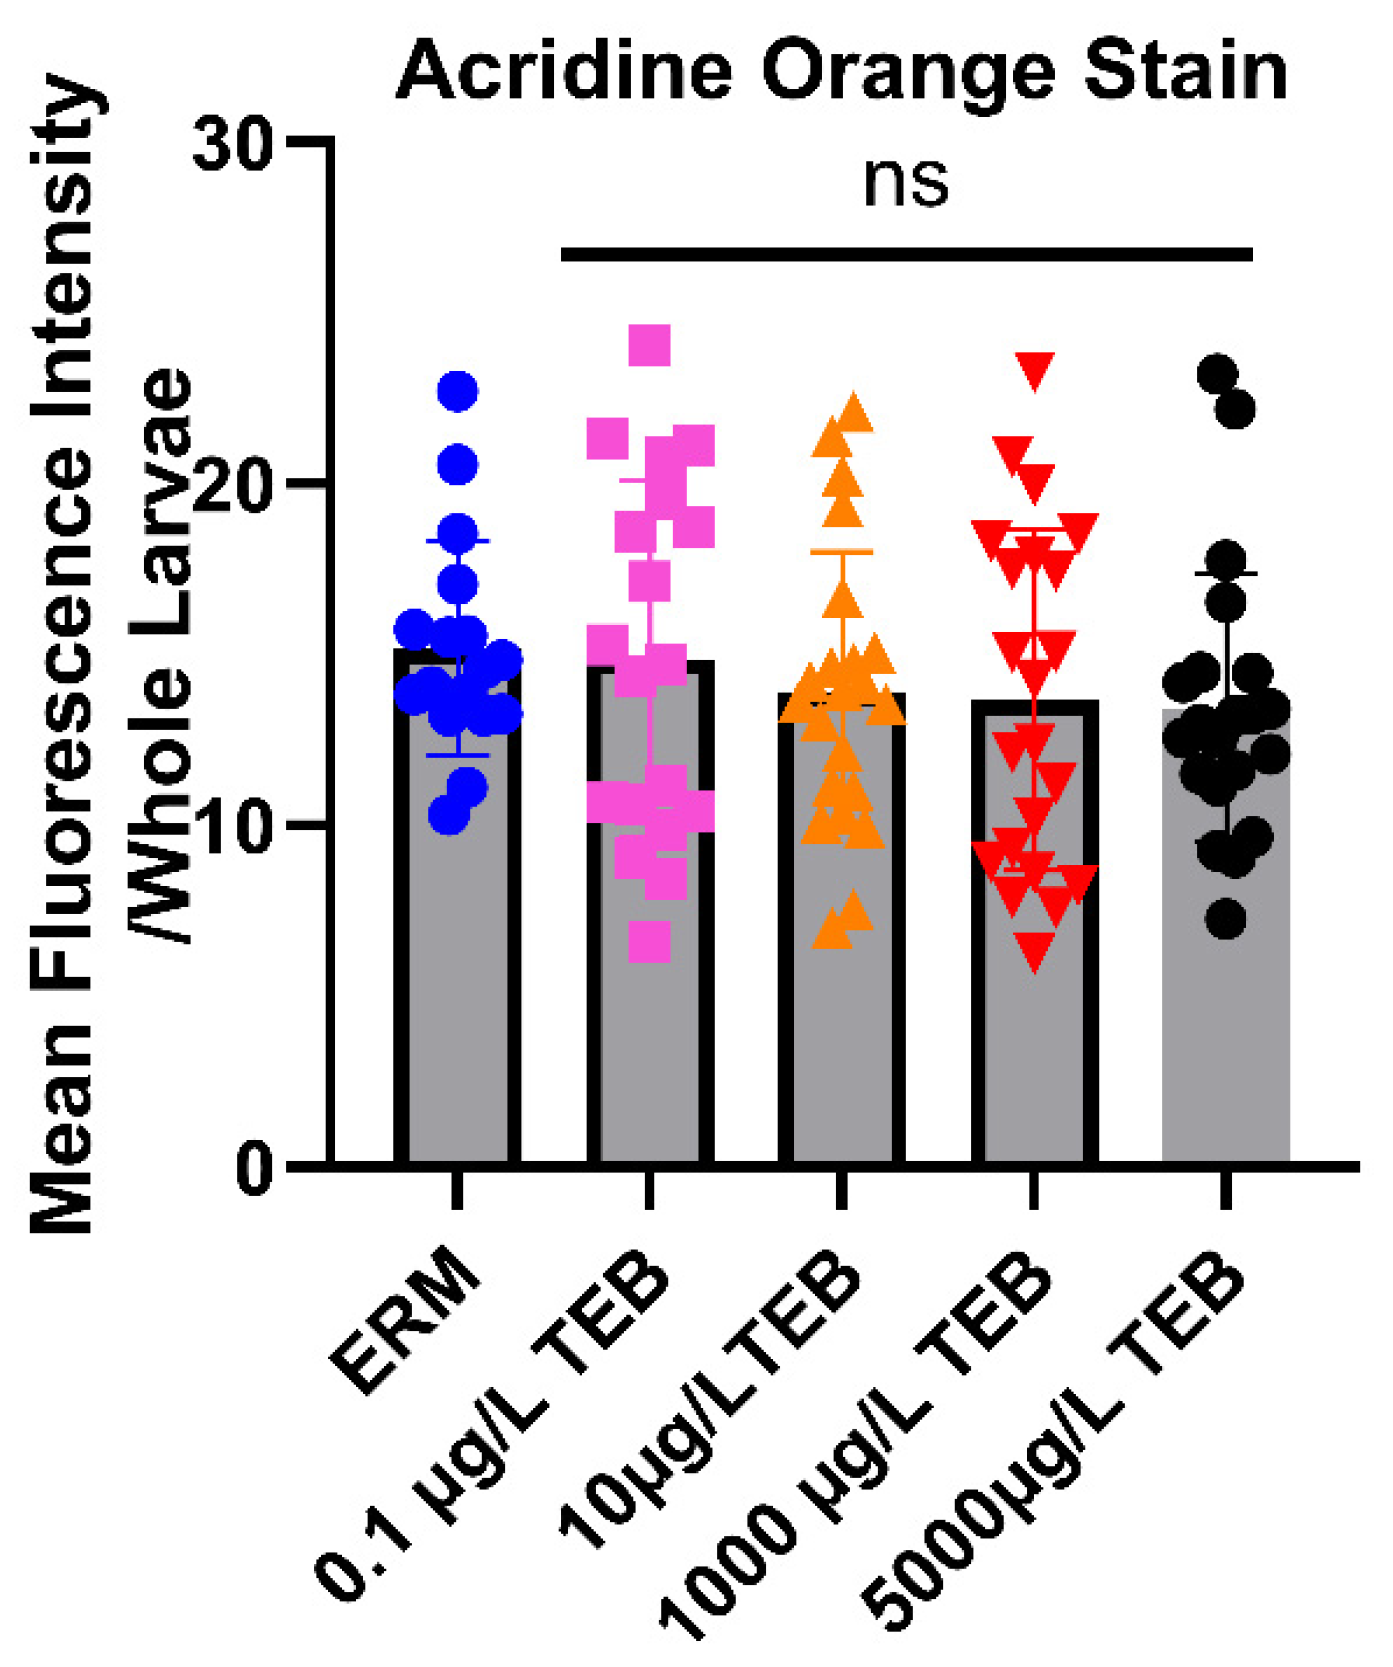
Figure 7.
Transcriptional responses in 5 dpf zebrafish larvae following continuous TEB exposure. Normalized relative expression (log10) of targeted genes related to oxidative stress a. cat, b. gpx, c. sod1, and d. sod2. The expression profiles highlight distinct statistical anomalies and non-linear concentration-response patterns. Data are expressed as mean ± SD. Each dot is a biological replicate. Asterisks denote statistical significance compared to the ERM control group (* p < 0.05, *** p < 0.001; One-Way ANOVA followed by Dunnett’s multiple comparisons test), n= (3-6).
Figure 7.
Transcriptional responses in 5 dpf zebrafish larvae following continuous TEB exposure. Normalized relative expression (log10) of targeted genes related to oxidative stress a. cat, b. gpx, c. sod1, and d. sod2. The expression profiles highlight distinct statistical anomalies and non-linear concentration-response patterns. Data are expressed as mean ± SD. Each dot is a biological replicate. Asterisks denote statistical significance compared to the ERM control group (* p < 0.05, *** p < 0.001; One-Way ANOVA followed by Dunnett’s multiple comparisons test), n= (3-6).
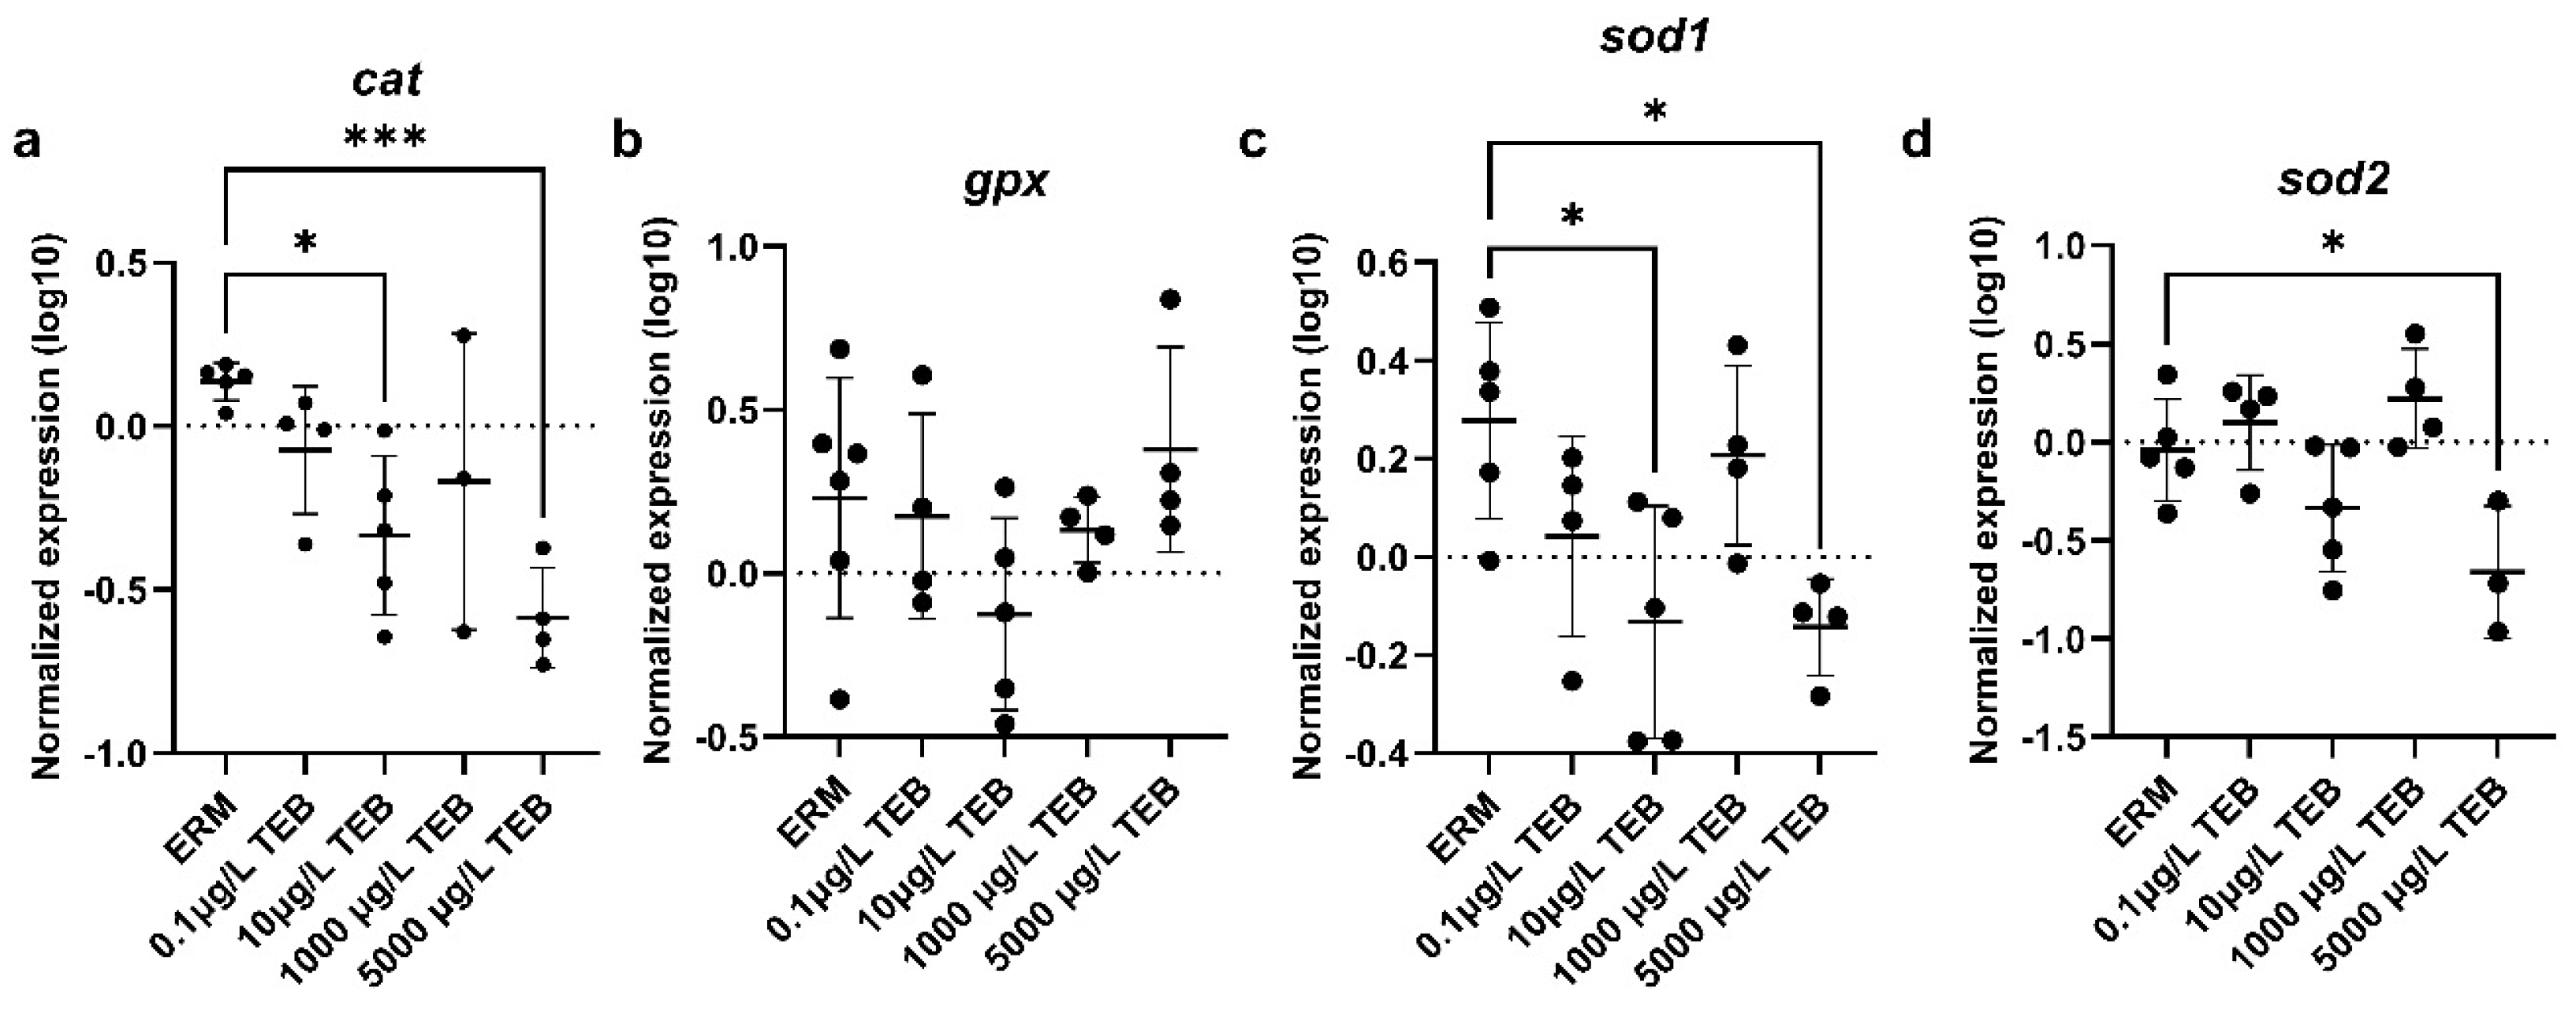
Figure 8.
Transcriptional responses in 5 dpf zebrafish larvae following continuous TEB exposure. Normalized relative expression (log10) of targeted genes related to apoptosis a. bcl2, b. casp3, c. casp9, d. keap, e. nqo1, f. nrf2, g. p53. The expression profiles highlight distinct statistical anomalies and non-linear concentration-response patterns. Data are expressed as mean ± SD. Asterisks denote statistical significance compared to the ERM control group (* p < 0.05, *** p < 0.001; One-Way ANOVA followed by Dunnett’s multiple comparisons test), n= (3-6).
Figure 8.
Transcriptional responses in 5 dpf zebrafish larvae following continuous TEB exposure. Normalized relative expression (log10) of targeted genes related to apoptosis a. bcl2, b. casp3, c. casp9, d. keap, e. nqo1, f. nrf2, g. p53. The expression profiles highlight distinct statistical anomalies and non-linear concentration-response patterns. Data are expressed as mean ± SD. Asterisks denote statistical significance compared to the ERM control group (* p < 0.05, *** p < 0.001; One-Way ANOVA followed by Dunnett’s multiple comparisons test), n= (3-6).
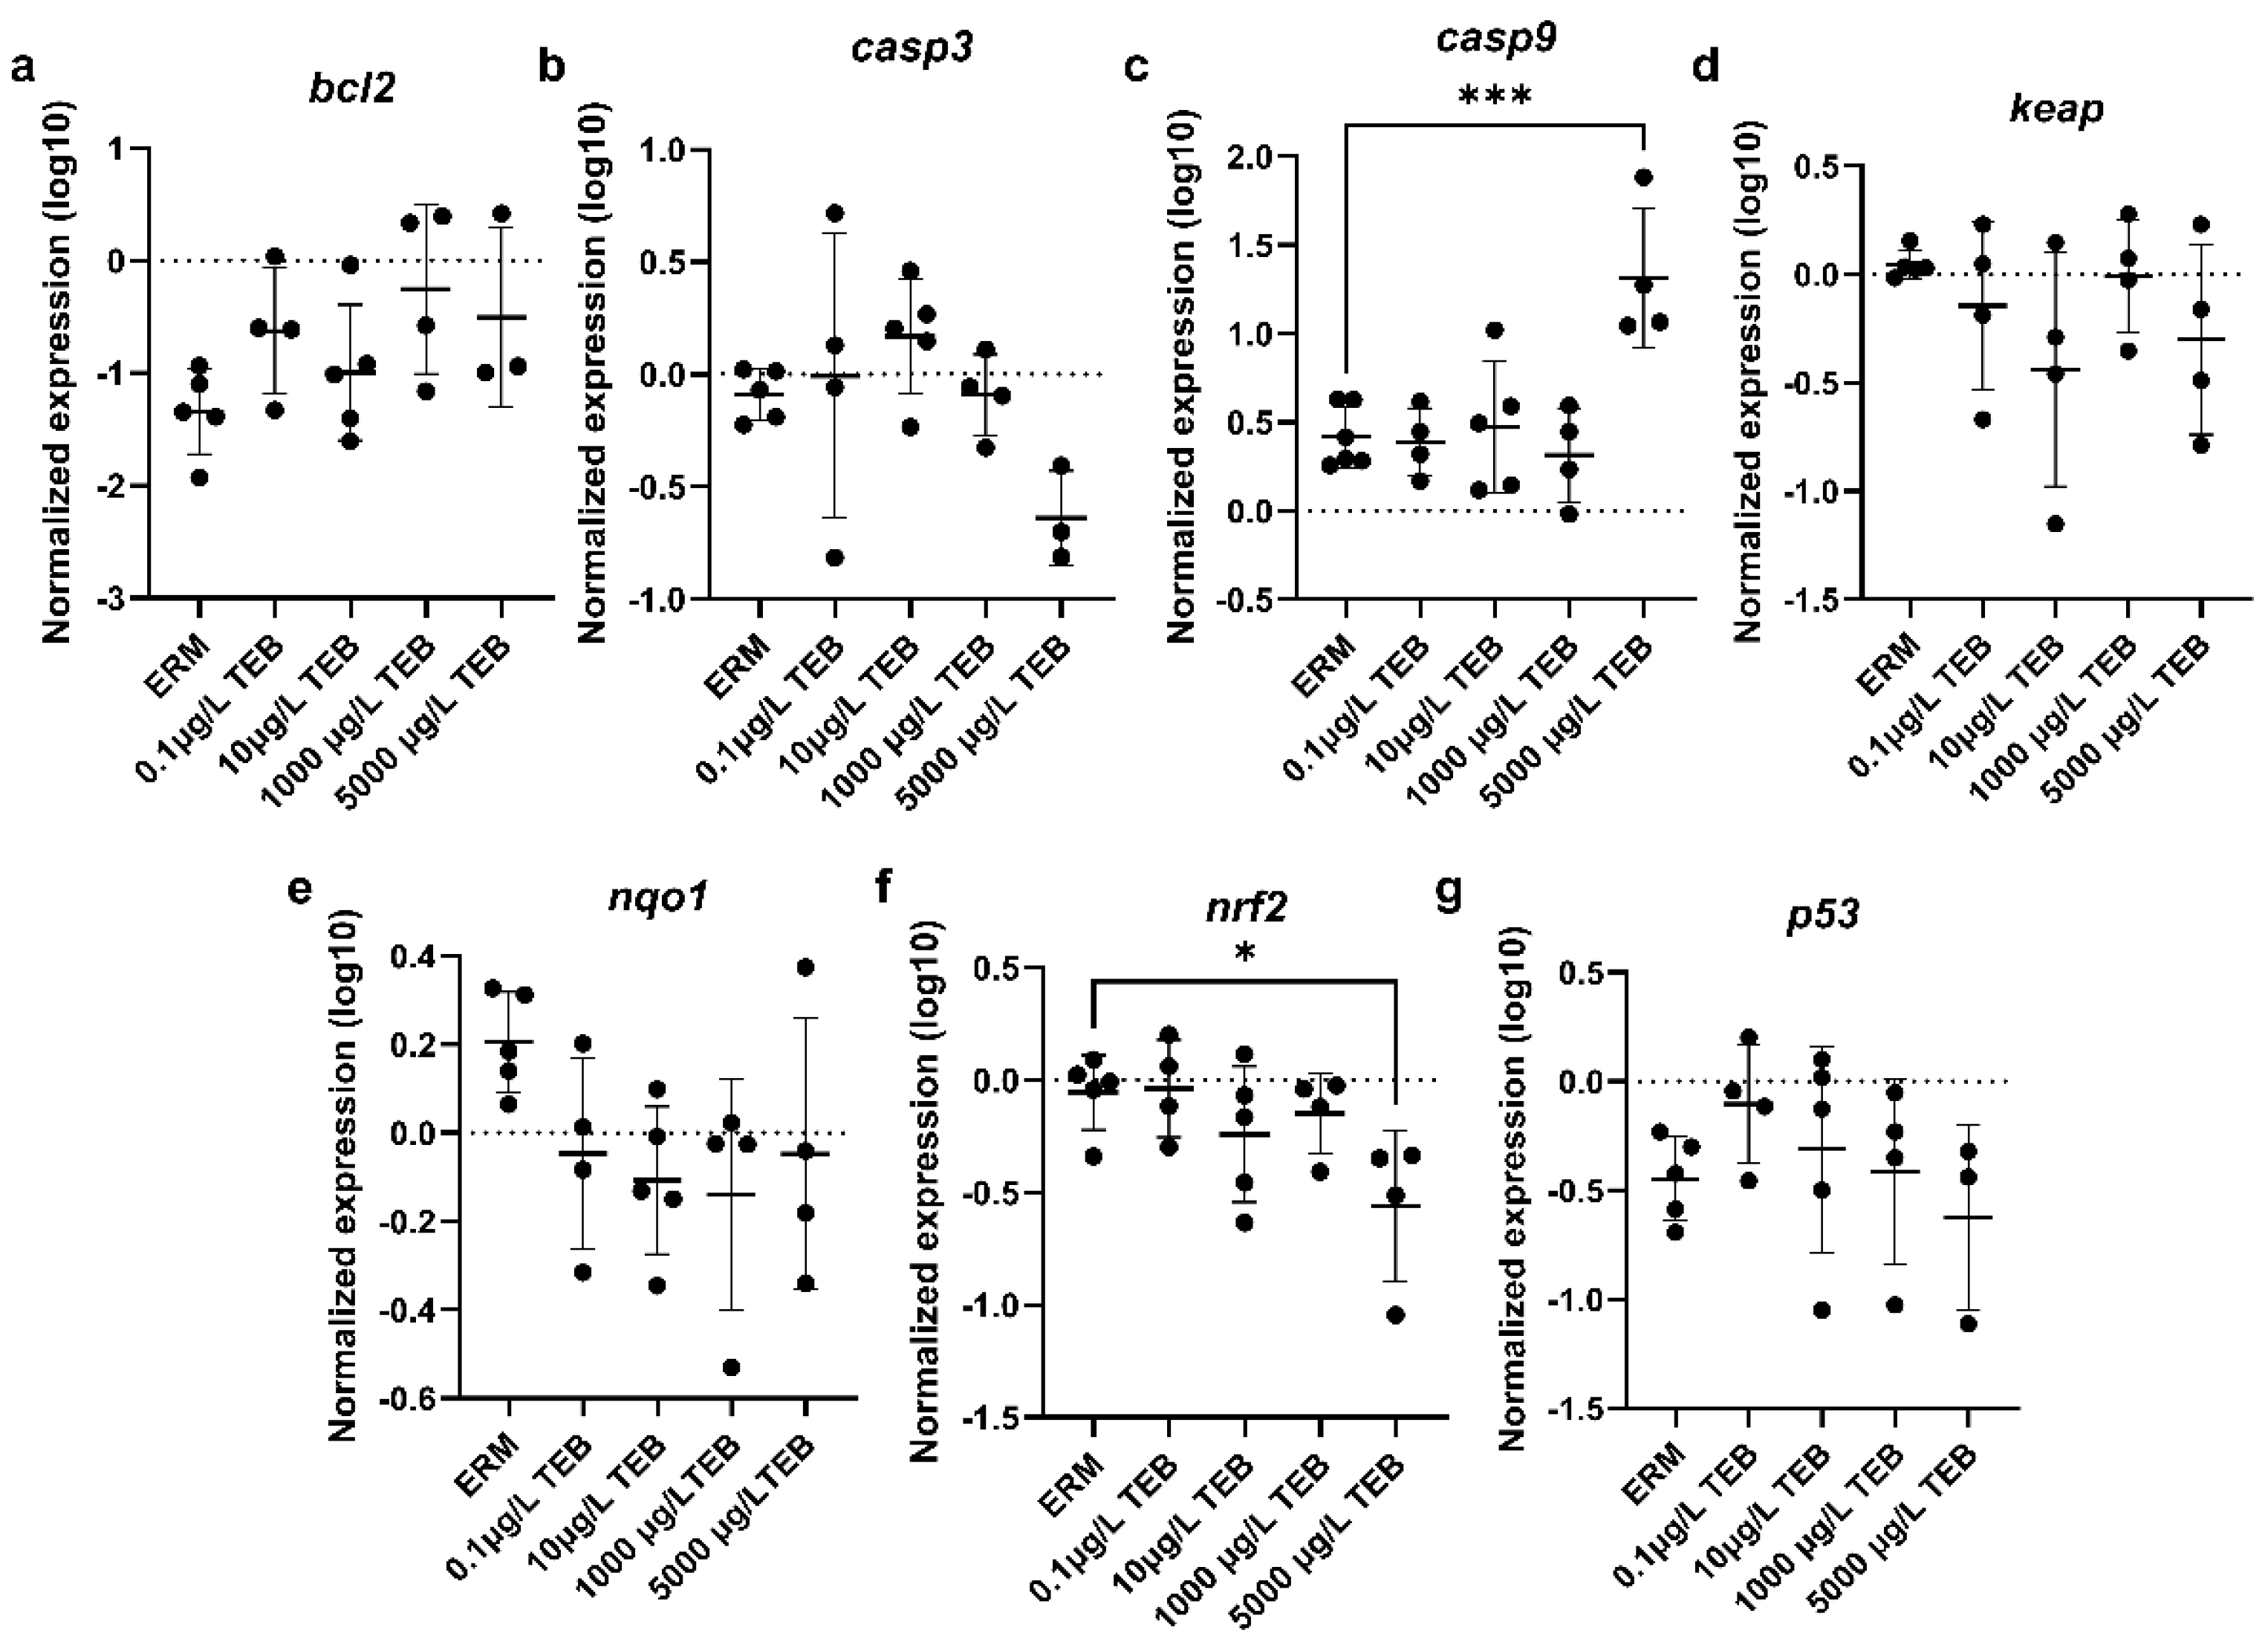
Figure 9.
Transcriptional responses in 5 dpf zebrafish larvae following continuous TEB exposure. Normalized relative expression (log10) of targeted genes related to neurotoxicity a. ache, b. atp5i, c. elavl3, d. gfap, e. gap43, f. manf, g. maptb, h. mbp, i. shha, j. syn2a, and k. alpha 1 tubulin. The expression profiles highlight distinct statistical anomalies and non-linear concentration-response patterns. Data are expressed as mean ± SD. Asterisks denote statistical significance compared to the ERM control group (*p < 0.05, *** p < 0.001; One-Way ANOVA followed by Dunnett’s multiple comparisons test), n= (3-6).
Figure 9.
Transcriptional responses in 5 dpf zebrafish larvae following continuous TEB exposure. Normalized relative expression (log10) of targeted genes related to neurotoxicity a. ache, b. atp5i, c. elavl3, d. gfap, e. gap43, f. manf, g. maptb, h. mbp, i. shha, j. syn2a, and k. alpha 1 tubulin. The expression profiles highlight distinct statistical anomalies and non-linear concentration-response patterns. Data are expressed as mean ± SD. Asterisks denote statistical significance compared to the ERM control group (*p < 0.05, *** p < 0.001; One-Way ANOVA followed by Dunnett’s multiple comparisons test), n= (3-6).
Disclaimer/Publisher’s Note: The statements, opinions and data contained in all publications are solely those of the individual author(s) and contributor(s) and not of MDPI and/or the editor(s). MDPI and/or the editor(s) disclaim responsibility for any injury to people or property resulting from any ideas, methods, instructions or products referred to in the content. |
© 2026 by the authors. Licensee MDPI, Basel, Switzerland. This article is an open access article distributed under the terms and conditions of the Creative Commons Attribution (CC BY) license (http://creativecommons.org/licenses/by/4.0/).
Copyright: This open access article is published under a Creative Commons CC BY 4.0 license, which permit the free download, distribution, and reuse, provided that the author and preprint are cited in any reuse.


