

Submitted:
13 July 2026
Posted:
14 July 2026
You are already at the latest version
Abstract
This article presents a design-led environmental media prototype for translating saproxylic beetle evidence into a web-based narrative about slow forest degradation in Crete. The prototype uses five interface scenes to convert ecological constructs, including deadwood continuity, decay-stage diversity, microclimate refuge, drought-stress coupling, pathogen/vector risk, and fragmentation, into comparison, gradient, threshold, and reachability tasks. The contribution is methodological rather than ecological: it proposes an evidence-to-interface translation matrix and an anti-cutesification/anti-spectacle grammar for making proxy variables, uncertainty cues, and versioned sources inspectable in public-facing environmental media. A small mixed-background reader-response session (N = 18) is used as a boundary test of readability. The session suggests that many readers could retell the deadwood-removal inference and distinguish structural loss from simple character appeal, while also revealing recurring misreadings around proxy status, scenario precision, and particle-haze risk cues. The article therefore positions the prototype as a proof-of-concept for auditable environmental-media translation, with broader claims about public use, institutional uptake, and long-term durability reserved for future comparative and longitudinal testing.
Keywords:
environmental media
; web narrative
; forest degradation
; biodiversity communication
; narrative visualization
; interface studies
; climate communication
; slow media
1. Introduction
The ecological purpose of being precise about deadwood is not to supply an auxiliary to quick visual truth, whether narrowly descriptive or broadly public-facing. If deadwood is anything here, it is a layered habitat resource; but that position is easily caricatured, for public communication happens in the world, and it is in the world that standing snags, coarse woody debris, bark pockets, hollow sections, rot gradients, and damp or shaded micro-sites are too readily flattened into one image. The claim I am making for saproxylic beetles—their usefulness in registering how such structures persist or disappear—does not rule out attention to their effect or function, once it is granted that they do not simplify the forest but make continuity and microhabitat quality legible. I have more than once described deadwood as a form of structural habitat. To become precise about why these beetles matter entails, to be sure, detaching oneself from the lazy picture of the dead tree as residue. But deadwood itself is also a living, layered, and exemplary ecological resource that returns us to the forest in a way at once more open and more exact, since fungi, insects, and many dependent organisms use it to shape nutrient cycles, microhabitats, and biodiversity through time (Grove, 2002; Stokland et al., 2012). Of course, once a new mode of environmental didacticism takes hold in public communication, the individuality of these structures is easily effaced by the dogma that evidence must be made instantly visible. But this is not what we see when we approach deadwood from an ecological rather than a merely presentational point of view. So far as many saproxylic beetles remain closely tied to deadwood amount, decay stage, and microclimatic conditions, we are dealing with indicators of habitat quality and conservation value in European forest monitoring (Müller and Bütler, 2010; Ranius and Jansson, 2000).
The point becomes sharper on Mediterranean islands. If these indicators are seen from the outside, as public communication so often encourages them to be seen, they turn into instances of a general problem and in the process lose the particularity of their ecological life. As Mediterranean monitoring makes plain, if these beetles are “about” anything, they are about endemic and range-restricted species living under intensifying drought and fragmentation, not about some abstract forest condition in general (Nieto and Alexander, 2010; Bolanakis et al., 2024). Species lists, trap records, decay classes, and habitat correlations are all ways of recording and showing this evidence, but for non- specialist audiences they rarely make that singular situation usable. So far as it remains true that public explanation depends on generalizing, it is also true that deadwood retention resists slogan, because its ecological force varies with decay stage, wood type, species assemblage, and environmental conditions (Lassauce et al., 2011; Sandström et al., 2019). Is this not exactly what we recognize when drought, thermal stress, pathogens, and disturbance refuse to arrive one by one? That they work instead as coupled risks, often invisible until thresholds are crossed, and that beetles belong to those coupled dynamics rather than serving as easy emblems of forest decline (Soulioti et al., 2015; Jactel et al., 2012)? And that this matters is all to the good. There is even a gain for climate communication in it, because public explanation, unlike information by itself, is justified by whether it makes slow ecological change more legible and discussable (Moser, 2010; Dahlstrom, 2014). But perception, comparison, and memory are broader and more varied than simple display. They need nourishment from explanatory structures that connect abstract dynamics to consequences people can actually read and judge in context. What this paper asks, then, is not merely how ecological evidence can be put on a screen, but how environmental media can make slow change perceptible without exaggerating degradation or flattening uncertainty. And the most useful way to understand that problem is through interface structure, because narrative visualization is not just a way of laying out information but a way of organizing movement between authored sequence and exploratory reading, thereby shaping how readers compare states and retain causal claims (Segel and Heer, 2010; Kosara and Mackinlay, 2013). (see Supplementary Figure S1)
This double methodological status of the project is clearest when it is described as design-led environmental media research and, at the same time, as a proof-of-concept workflow; insofar as it remains a workflow rather than a validated public-communication intervention, it keeps itself at a deliberate distance from stronger public claims. This distance is, by definition, partial and operational to a certain degree; for the prototype to function as legible environmental media, dispersed ecological signals such as deadwood continuity, microclimate refuge, coupled risk, and connectivity have to be reorganized through conventions of comparison and inference. In the final analysis, what the five scenes provide is a translation of scientific concepts into comparison structures. And degradation appears there as structural change rather than as moral drama. But this positioning can easily be misread, since it may seem to imply that the prototype has already demonstrated public understanding or communication effectiveness. The reader- response session reported in Appendix B helps correct that misreading by offering only preliminary evidence of readability and common misreadings among a small mixed- background group; a session of this sort is first of all a boundary test,. But the notion of durability is misleading unless one adds that the movement here is not only toward present readability but also toward future re-entry. Because a slow web narrative about gradual degradation depends on stable access to sources and versions, the article treats archivable, versioned publishing as a design requirement; yet its durability over time remains a research agenda that would still have to be tested through delayed recall, revisits, and cross-version use.
It would seem that discussions ofthis article are still not wholly free of the spell of a single, undifferentiated standard of evidence. For, in order to ask for stronger proof of public effect, readers often feel compelled to overlook the separation of claim levels that runs throughout the paper. But a methodological prototype paper does not become contribution-less when it is seen, in the last analysis, not to be a full effectiveness trial. For all the force of this clarification, the specter of validated effectiveness still lingers at the edges ofthe argument, giving the conceptual and prototype contributions a thinner look than they deserve. The account will never be complete until these claim levels can be thought without that specter, without any sense of loss. A neat inversion, by which prototype evidence is treated as if it ought already to function like population evidence, scarcely solves the problem. It is hard to think oneself out of a distinction so habitual and apparently self-evident. One can do so only by adopting a more differentiated methodological vantage point, namely the one used throughout this article. What is wanted of that vantage point is that it do justice to the three levels of contribution in the paper: first, the conceptual contribution, the evidence-to-interface translation grammar through which ecological constructs are converted into proxy variables, interaction tasks, and uncertainty cues; second, the prototype contribution, the five-scene web narrative that shows how this grammar can be implemented for Crete; third, the human evidence, limited to a small reader-response boundary test that can indicate whether selected readers could follow the intended inference and where they misread the interface, but cannot by itself prove population-level public legibility, governance adoption, or long- term durability.
2. Interactive Grammar and Design Logic
2.1. Scope of Evidence and “Convertible Units”
Indeed, the entire method proposed here could be rewritten as a history of different attitudes toward evidence translation. Grove, Speight, and Stokland et al. offer important points of departure on this theme (Grove, 2002; Speight, 1989; Stokland et al., 2012). A valuable methodological move is to treat saproxylic beetles as evidence interfaces whose life histories are tied to deadwood decomposition, cavity formation, decay-stage continuity, and microclimatic conditions. These relations, once named as such, can be made to yield visible absence/presence, thinning, threshold, and connectivity cues. Thus it should be clear that the account of web-based translation being outlined here, in which saproxylic beetles are treated as public-facing evidence interfaces, not only does not preclude but positively requires that the translation path be made explicit enough for later comparison, revision, and evaluation. For this reason, the method first breaks evidence into convertible units: (1) ecological construct; (2) minimal proxy; (3) interface variable; (4) permitted reader inference; and (5) uncertainty or overclaiming guardrail. But it must also be said that the very possibility of making such cues visible for public use depends on these prior methodological decisions about what is being translated and how far the translation may go. The translation grammar is the principle of decision in the prototype. And as ecological relations can be rendered in more than one way, there are correspondingly many possible interface grammars. Seen from the outside, historically or comparatively, those decisions can be related to broader developments in environmental communication and interface design. Seen from the inside, when one examines this particular prototype and tries to account for its value and effect, each translation decision contains a degree of arbitrariness, however justified it may appear. If the prototype is the method’s practical game with evidence, then its grammar consists of the rules by which that game is played. And those rules are always, in the end, artificial limits: limits on inference, on proxy use, on what readers may be invited to conclude. The point is to make those limits and that translation path explicit.
2.2. Evidence-to-Interface Translation Matrix
Ever since environmental-media prototypes began borrowing from narrative design, they have been tempted to stress what is visually necessary. When the translation matrix is said to do no more than keep the design orderly, that is fair so far as order is one ofits functions. But the claim becomes misleading if it suggests that order is all the matrix provides. It also forces the prototype to specify what kind of public inference each scene is allowed to ask for. A scene that claims refuge loss, for example, has to say whether deadwood volume, microclimate band narrowing, or route breakage is the proxy carrying that claim. And anyone who has worked on coupled-risk scenes, remembering how easily atmosphere outruns evidence, knows that visual tension by itself is not enough, knows that the variables being coupled have to be named. The practical force of anti- cutesification and anti-spectacle lie in the discipline of the whole workflow. In other words, what becomes necessary in the prototype is the constraint itself. To the extent that a scene feels justified, specific, and not overstated, what we are responding to is the way constraint has been written into the translation process before any atmospheric scene- making begins. (see Supplementary Table S1)
To avoid the common disadvantages ofthis article - the description part of the work is as fluent as prose, but the method part is blank - the author regards every design choice in the online narrative as a traceable “translation behavior” and regulates it with a translation matrix. Each scene must clearly correspond to an ecological structure, a minimum data proxy, a set of observable visual variables and a set of interactive syntax, so as to guide readers to compare or infer. This is a structural concept in the study of narrative visualization and interactive design. It emphasizes that the interface is not a display container, but a support for reasoning. Readers “create” conclusions by switching, sliding, hovering, connecting/disconnecting and other operations, instead of being forced to summarize (Segel and Heer, 2010; Kosara and Mackinlay, 2013). Proxy variables such as “number of dead wood”, “rotten stage”, “microclimate shelter” and “broken connectivity” transform the inherent structural judgments in ecology into visible differences that can be interacted with (Lassauce et al., 2011; Müller and Bütler, 2010). Still, the matrix can also be used to study the auditability achieved through design research. Examiners don’t have to like this visual style, but they can still check whether each map is consistent and whether it is logically reasonable at the level of evidence (ISO, 2019; Hullman, 2020). On ecology, the dependence of rotten wood and the continuity of dead wood are widely regarded as important clues for monitoring and evaluation. (see Figure 1)
The most useful translation matrices are those which give the anti-cutesification and anti-spectacle grammar the look of having no alternatives, so wholly centered is it in constraint. Compare a scene in which risk is pushed through moral roles or emotional manipulation with one in which it is carried by structural variables. The first kind of scene I have mentioned is vivid enough indeed. But the stronger prototype makes weakening seem registered, not staged: hence the missing musical instruments, the empty stage, and the reduced texture density. For a scene of drought pressure to have this quality of authority, assurance, continuity, and inevitability does not, of course, require disaster montage; slider-controlled changes in crown thinning, the rising share of bare ground, and the shortening of the window period can do this as well. The difference that I have drawn between anti-spectacle grammar and spectacle itself might be analogous to the difference between drift and accident. Degradation, from a technical point of view, is nothing other than baseline change rendered through structural cues (O’Neill and Nicholson-Cole, 2009; Allen et al., 2010).
Similarly, it is for this reason that the problems raised by pathogens and vectors overlap with those raised by uncertainty communication, and their handling has much in common. For instance, one function of the translation matrix, which is the core methodological object of the article, is identical with, because it is simply a more explicit specification of, that important function of the anti-cutesification and anti-spectacle grammar already at issue: to keep a fear narrative from displacing understanding. This need is easily demonstrated in studies of tree disease in the Mediterranean and eastern Mediterranean, where the relation among vector insects, host stress, and fungi/pathogens usually appears as an increase in risk under coupled conditions (Jactel et al., 2012; Soulioti et al., 2015). Proxy variables, allowed visual encodings, intended inferences, and misreading controls are the means the matrix provides for holding those coupled relations in view before comparative claims are attempted; hence any comparison with species cards, mascot formats, posters, or disaster imagery would first require these elements to remain stable. (see Table 1)
2.3. Interactive Grammar and “Anti-Cutesification” Operation Rules
To make this reasoning really happen, this article compresses the interactive operation into several smallest grammatical units: comparative reasoning emphasizes the differences under different management logics (different “references”) of the same place. For example, “wild vs clean” is not a value judgment, but highlights the ecology caused by “clean” at the structural level. Function decline; gradient reasoning presents drought pressure, heat wave window or seasonal advancement as an intensity axis that can be adjusted through continuous sliders, making readers realize that degradation is usually a process of baseline drift and approaching the threshold, not a one-time event; fragmentation and connectivity are transformed into constrained reasoning of “passable”, that is, the road Path restrictions make migration and survival no longer stay at the level of moral desire, but become a reality constrained by spatial structure (Fahrig, 2003; Haddad et al., 2015). (see Supplementary Table S2) (see Figure 2)
This repeated causal function is what makes the interaction system work: each switch, slide, hover, or bridge connection can be read in terms of patterned comparison . It also clarifies why slow ecological translation is difficult in public media. If a reader cannot detect how these actions repeat and vary a causal relation, the ecological variable is almost not perceivable, and therefore not really understandable, as an executable comparison process (Segel and Heer, 2010; Kosara and Mackinlay, 2013). What makes the interface legible, then, the recurring comparison the reader is asked to perform. Until that balance between variation and repetition is grasped, interaction is liable to look like an extra layer added merely to make the work more interesting.
But interaction here has another role as well. Each rule carries an epistemic decision, a choice about how the reader is permitted to perceive the evidence. In this study, that is easiest to see in the insistence on comparison rather than introduction. The point is a valid, if narrow, one: the ecological significance of saproxylic beetles is bound up with sensitive patterns of presence and absence, because their occurrence responds closely to micro-environmental structure and can therefore serve as a readable trace of deadwood continuity and microclimate conditions (Ranius, 2002; Müller and Bütler, 2010). Every interaction rule, in that sense, is a way of insisting on comparison.
In each scenario, the visual aspect must give priority to the use of structural variables to express degradation, such as missing, sparse, reduced texture information, limited movement and reduced frequency of occurrence, instead of using monsterization, moralization or emotional symbols; at the information level, uncertainty must be allowed, especially in the relationship between the medium and pathogens, it is necessary to use threshold bands, conditional sentences and prompt texts to enable readers to understand that “risks come from coupling conditions”, rather than simplifying the complex dynamics ofthe disease into linear storylines (Jactel et al., 2012; Hullman, 2020).
It will be seen that anti-cutesification and anti-spectacle, by forcing each scene to carry a structural variable, are also a narrowing of the prototype’s attention, a refusal to let it fall back on emotional shortcuts. But whatever interest this grammar rests on the precision and authority of the attention it permits, however narrow the focus may be. In the strictest sense, ecological degradation is never fully exhaustible by any single visible cue. Every environmental-media prototype, therefore, has to be understood not only as something rendered, but also as a particular handling of what cannot yet be shown directly or with full certainty. In the more careful scenes, one is aware of what cannot be said too quickly, of the tension between expression and the still-unresolved remainder of uncertainty. These constraints are also techniques of avoidance. The strongest parts of the prototype are often the things it refuses to do.
What I have said about anti-cutesification and anti-spectacle is meant mainly to clear up certain misconceptions about the prototype and how to compare it. But it still has to be added that these are design constraints. And just as many other formats, mascot pages, species cards, posters, or disaster imagery, may still possess some communicative force of their own, so this version of the matrix should be read as an internal consistency and auditability device. A direct comparison would still be needed before any stronger claim could be made (Dahlstrom, 2014; O’Neill and Nicholson-Cole, 2009). (see Table 1)
2.5. Data, Versioning, and a Slow-Web Ethic
Here, the richest meaning of the “slow website” is the publication logic of a versioned environmental record. The prototype is designed around stable baselines, changelogs, and preserved proxy definitions, so that a reader confined to the current short session cannot generalize about long-term public recall from this version alone. From these design decisions alone, however, it appears that its main virtues are stability, revisability, and control. The logic is layered, archival, procedural. One notices the emphasis on later audit, though the subject-matter is gradual degradation. This is because the real subject is the traceability of the environmental narrative across versions, sources, and returns. The typical effort of the workflow is preservation; the typical problem is that of broken continuity. The design is about a relatively stable inference layer, an evidence- entry layer revisable through source notes and changelogs, and a proxy-data layer that may be updated while preserving previous baselines as snapshots, and about the refusal to let revision erase prior states. A certain vulnerability to link decay, script failure, platform migration, and media compression is presupposed. The instability of external datasets and literature is indeed familiar. But unlike a site built for one-time display, this workflow keeps its three layers apart and treats version control and archiving as infrastructure for later audit. This separation, and the desire to return to earlier states, does not, however, mean that delayed recall, repeated use, or cross-version comparison have already been tested in the current short session. Its sense of version and of evidence is not what one expects of a website. Future versions should therefore report delayed recall, return visits, and the way readers use archived versions when evidence changes. (see Supplementary Table S3) (see Figure 3)
But then the “slow website” is a publication logic; slowness here is an archival infrastructure lacking the instantaneity and ephemerality that usually attract people to web media. One finds no proof of long-term recall, no demonstrated durability, no already secured public memory in such a package. The requirement is there as future auditability. This sense of the relation between evidence and archive, the way a narrative is held in place by WARC snapshots, static PDF exports, dataset tables, changelog files, and version stamps, will be familiar to anyone who has worked on web preservation and versioned publication (ISO, 2009; Klein et al., 2014). But the virtues of such a package are not popular virtues, any more than are the virtues of archival infrastructure generally. Those who do not take to this logic may call it overly procedural or too documentary. Like a careful archival system, this package is versioned, quiet, anti-dramatic, and self- contained. But it does deserve more attention in environmental-media practice than it usually gets. Why keep such a publication record? Because it proves that the prototype has already remained durable over time? Often it does not.
3. Scene-Based Interface Design
3.1. Scene 1: Beetle Band / Deadwood Stage
The following five scenes should not be interpreted as the sequential presentation of the five ecological phenomena. The value of each scene lies in the types of judgment it guides readers to make: comparison, gradient, measurement, threshold recognition and limited accessibility reasoning.
Scene 1
More likely, the shift from “wild” to “clean” matters because “clean,” even when it arrives as a harmless maintenance term, can be made to mean a reduction of ecological roles and functions. Here the reader encounters “clean” comparatively, as tidiness carrying loss inside it. No amount of visual familiarity with beetles can do this by itself, even when a scene is inviting on the surface. Most public stories about forest cleaning, including well-meaning ones, are told in the language of removal. Yet taking away rubbish is not identical with taking away deadwood, any more than a tidier forest is identical with a more continuous one. That, by itself, is not enough. What this opening scene asks for instead is a structural inference that can be completed in about thirty seconds. The scene becomes a small workshop of ecological reasoning. Why dwell on beetles here at all? Not out of simple fondness for beetles. Rather because public environmental didacticism remains so attached to what can be instantly liked and instantly seen that the dead tree is easily reduced to residue, when in fact it carries ecological function and continuity information. In this setting, rotten wood is the medium through which beetle colonization and decay proceed. And among the variables that matter most, the number of dead trees and the diversity of decay stages are the ones to which we turn for the clearest account of available microhabitats. They matter because they can be used to assess habitat quality and forest continuity, not merely to decorate an explanation (Ranius and Jansson, 2000; Grove, 2002). Its evidential force does not depend on emotional prompting; as a structural indicator, deadwood volume and decay- stage abundance are converted into a simple “orchestral fullness index” that makes visible density and missingness legible. This is how the method finds a public use for minimal data. Existing reviews and empirical work support the move, linking dead-tree quantity and diversity to saproxylic biodiversity, especially specialist groups, and showing that interventions, including excessive cleaning, alter these structural conditions and thereby alter what life histories can occur (Gossner et al., 2016; Sandström et al., 2019). (see Table 2)
The unity of these interface decisions is to be found in one problem: how to make concepts that the public cannot directly grasp available for comparison. The “band” is one use. The shift from the “wild” state to the “empty” state is another, both as a technique for prompting inference and as a value in itself. And the conversion of “tree decline” into a reduction of functional areas is the third use of the metaphor, as a way of acting on structural loss. Thus we get the following sequence in Scene 1. The interface says, in effect: you do not need to create an enemy, and you do not need to stage catastrophe; you only need to make instruments disappear, widen the stage, and thin the texture until function-loss becomes visible. But this operation has to be imposed by the scene itself. To choose such restraint is Scene 1’s defense against decorative environmental storytelling. This is how the scene acquires its persuasiveness: distilling the protection-and-management issue of deadwood into an actionable comparative argument. When readers press the switch, what they see is not merely that “cleaned woodland is bad,” but that ecological function has been subtracted from the system. (see Supplementary Table S4) (see Figure 4)
3.2. Scene 2: Crete Atlas / Mountain Refugia
Scene 2 asks readers to make a scalar-spatial inference, and the materials assembled here - a map of Crete’s mountain refugia paired with a climate-scenario slider - show warming as a measurable contraction of refuge space, with habitable bands compressed and pushed upslope. From this paired comparison alone, however, parcel-scale prediction emerges only in the weakest sense. What the scene wants, more plainly, is a legible demonstration that climate pressure reorganizes space through narrowing ranges and shrinking options.
3.3. Scene 3: Winter Refuge / Microclimate
Scene 3 is not designed to create a romantic winter-refuge mood. It treats refuge as a measurable buffering relation, using hover and comparison to show how cavities, bark, and deadwood retain different temperature and humidity conditions from the surrounding forest. The scene turns shelter into a conditional microclimate claim rather than an atmospheric metaphor.
In the third act, the narrative is no longer driven by the characters, but is realized through the reader’s “measured reasoning”. Based on the ambient temperature of the winter night, the interface presents the temperature difference (ΔT)and relative humidity difference (ΔRH)inside the tree hole and dead wood in the form of visual variables. Readers can slide the time or season and hover the mouse over different micro-habitats to compare, so as to interpret the “shelter” as a numerical difference, not an emotional atmosphere. (see Supplementary Figure S2)
“A justification for constraint.” This scene’s treatment of risk shows a curious consistency if we examine some of its principal devices: interval-based temperature differences, upper and lower bounds, and the requirement that every security or risk claim be backed by explainable alternative variables. The uninhibited display of alarm is converted into a deliberate cancellation of spectacle. Scene 3 has none of the usual confidence in fear narrative, none ofthe wish to intensify danger through exaggeration. Nor does it rely on catastrophe montage. The interface, which could have dramatized risk so easily, usually speaks instead in intervals and bounded ranges. It does not terrify the reader; it addresses the variables. It becomes the corrective, self-restraining spectator of its own claims. The consequence of such a bracketed treatment of risk is, almost inevitably, anti-cutesification and anti-spectacle. The scene is, in effect, a sequence of constrained comparisons and self-checks.
It records no villain, no disaster climax, no theatrical security warning; nor is there any effort to make the forest look more frightening when the reader switches to the “cleanup” state. All that remains of more conventional risk communication are the structural traces that can actually be defended: narrowed temperature-difference ranges, weakened humidity maintenance, and the repeatable sentence linking dead-tree removal to reduced microclimate buffering (Hullman, 2020). Scene 3 is very much at home in forest microclimate buffer research, which has shown that canopy and internal forest structure significantly shape local exposure to temperature extremes, and that this buffering matters under climate change (De Frenne et al., 2019). Dead wood here is not simply habitat but climate infrastructure. Much of the force of the act is taken up by this infrastructure logic: when dead trees and tree holes are removed, many invisible residents lose the physical conditions that made survival possible. (see Table 3)
3.4. Scene 4: Valley Under Fever
Scene 4 is built around threshold-based inference. Risk is presented as a conditional relation between drought stress, host vulnerability, and vector or pathogen windows, not as a dramatic event already in progress. By switching between baseline and stressed states, readers see how coupled pressures move a system closer to ecological thresholds. (see Figure 5)
There are two key comparisons in Scene 4, sensitive and exact, carried by buttons and sliders and ranging from baseline-to-drought gradients to wild-to-clean contrasts.It should, however, be noted that when the interface renders risk, it does so as a bounded display of particle fog, interval-based temperature difference, and threshold markers. There is no use of disaster montage, or plans for turning management into a story of good and evil. The only thing shown is a mechanism already defined. Another notable omission is any exaggerated surrogate of danger; every description of safety and risk has to be supported by explainable alternative variables. It might be said that there are two comparative logics in the scene. One is the gradient reasoning between baseline and drought; the other is the wild-to-clean comparison that writes management logic directly into the risk condition. Or: one comparison tracks the widening of pressure and window, and the other tracks the greater likelihood of threshold crossing under sparse structure, so that readers can retell the sentence that when pressure and window expand, the system is more likely to cross the threshold, and that this crossing is more likely when structure is sparse (Jactel et al., 2012; Allen et al., 2010). There is the explicit coding of the scene’s variables; the focus falls on standardized drought anomalies, host stress index, and vector activity window as the ingredients of a coupled risk score built specifically for this interface. Then there is the qualifying statement in the table: the score is only a driver of visual density and threshold indication, and is not equivalent to an actual disease prediction model. Insofar as methodological anti-cutesification enters the scene at all, it enters mainly as an effort to write the mechanism into an auditable proxy-variable combination. Apart from mere visibility, there is one further aim to which the scene continually returns: that risk can be made clearly perceptible without being exaggerated (Hullman, 2020). (see Figure 6)
3.5. Scene 5: Connectivity Constraints
The unity of Scene 5 is to be found in its translation of fragmentation into constrained reachability. Broken corridors are one form. Detours and failed crossings are another, both as visible interruptions of movement and as reductions in future options. And connectivity is the third, decisive term in the scene - conceived as an infrastructure of survival that readers grasp by interacting with patches and bridges. (see Supplementary Table S5)
Scene 5
One is the prospect of laying “cleanup/harvesting” logic over an already more fragmented structure. The other is the prospect of seeing the available path further reduced under the same mobility budget. The scene shows itself as preoccupied with a deep relation between structural simplification and spatial limitation. Notes on route loss are interspersed with cues of shrinking flexibility and triggerable failure. The interface records these consequences at the moment when the reader attempts the overlay, or after the crossing has already become harder. The channels themselves are never dramatized; the event is not even staged as disaster. The two themes are intimately connected, as the scene makes plain. At its sharpest point, the scene in effect says that channel and structure together determine whether the system can maintain adaptive flexibility under pressure (Haddad et al., 2015; Cash et al., 2003). This is the recurring pattern. Or again, from the point of view of communication strategy, Scene 5 completes the final step of anti-cutesification and anti-spectacle by refusing to drive action through fear. What it has to say about recognizable loss is the familiar other side of environmental communication: ecological degradation often takes the form of fewer choices. What one might first take to be a dramatic event is unmasked as a reduction of available paths. It is easy to see how this view is peculiarly congruent with the article’s account of “recognizable loss,” since the loss is at once minor in appearance and uncompromising in effect (Dahlstrom, 2014; O’Neill and Nicholson-Cole, 2009).
3.6. Reader-Response Boundary Test
In the present methodological tradition, the human evaluation is asked to tell only a limited truth about the prototype. Therefore it was inevitable that the study take the form of a modest reader-response boundary test, deceptively easy to mistake for a broader test of public legibility if its scope were not stated plainly. Reader response, like prototype evaluation, becomes a medium of provisional evidence. But because establishing general public legibility is not as bounded an act as observing eighteen participants in a short session, with a mean duration of 22.4 minutes and a mean time-on-task of 12.1 minutes, any stronger inference would be doomed to failure. A prevailing problem of small design-led evaluations is precisely this failure of scope. When we encounter the opposite claim, that such a session can stand in for the general public, we are naturally inclined to treat it as wishful thinking, for the stronger conclusion fails because its premise is mistaken. However, the smaller test remains a necessary one so long as early proof-of- concept work begins with a mixed but non-representative sample, here Architecture/Urban = 6, Ecology/EnvSci = 5, Design/Art = 4, and General public = 3. A further consequence of this bounded design is that the measures concentrate on whether participants could identify structural degradation, retell the deadwood-removal inference, distinguish proxies from forecasts, and notice traceability cues. As these tasks are forms of recognition rather than adoption, the interest of the results lies in what readers can and cannot carry out of the session. The lure of the current evidence lies in the convergence between the structural-degradation framing selected by 15/18 participants, the 14/18 who recalled that deadwood removal reduces habitat roles and functions, and the Likert results suggesting moderate-to-high readability of structural loss and proxy/prediction understanding. Yet the same session also reveals the counter-pull of recurring misreadings: OFI taken as an official ecological index, scenario bands read as precise forecasts, and particle haze mistaken for a current outbreak. Many of these outcomes read like a case supporting the prototype as a preliminary proof-of-concept for evidence-to- interface translation, while also pointing to the need for comparative testing against species-card, poster, mascot, and disaster-style formats.
4. Discussion
The project also needs a methodological caution. Stage metaphors, haze layers, and broken paths are interpretive aids, not transparent ecological windows. They work only insofar as readers can move back from metaphor to structure. Some audiences may still remember the theatrical surface more strongly than the deadwood function or the threshold logic behind it. That does not nullify the design. It means the prototype should be judged by whether it makes mechanism easier to restate, not by whether every reader arrives at the same visual takeaway. (see Supplementary Table S6)
4.1. From Cute Stories to Auditable Public Inference
But the striking communicative entanglement of cuteness, risk, and degradation when saproxylic beetles are made the protagonist of a narrative suggests that the problem, in its present form, is more complex. The familiar critique may throw light on one side of the problem, the conversion of ecological deterioration into the adventure background of a cute character, with risk diluted until only emotional warmth remains, but not on the other side: the opposite move by which a complex mechanism is condensed into disaster spectacle, and understanding is replaced by fear. One might well say, in the language of environmental communication itself, that the story is made to choose between charm and shock. My own view is that neither choice is innocent; rather, it expresses a specifically contemporary difficulty in holding on to causal relation without surrendering either to emotional softening or to emotional coercion. To wish to cultivate attachment through beetles while still hoping to communicate degradation clearly reveals a tension that, elsewhere in public-facing media, becomes a repeated inability to keep readers from remembering the jolt and forgetting the mechanism (Dahlstrom, 2014; O’Neill and Nicholson-Cole, 2009).
The key contribution is to redefine the “beetle narrative” as an auditable reasoning chain, which ranges from the continuation of dead wood to microclimate buffering, from the range contraction on islands to the coupled stress–vector windows in the river valley, and finally to the connectivity constraints under fragmentation. Each link is associated with the minimum proxy variable and interactive grammar, requiring readers to “infer” through comparison, gradient and constraint, instead of passively accepting a series of conclusive sentences (Kosara and Mackinlay, 2013; Segel and Heer, 2010). (see Supplementary Figure S3)
If the governance relevance of this chain-writing method is to be defined at all, then for now it should be described as the stage at which a possible route from ecological proxy to public-facing reasoning becomes visible, while adoption remains unproven. Now the prototype points toward forest managers, educators, and local policy actors, but it is still confined to showing that route .Hence the claim must remain cautious; it stays preparatory and bounded. The recurring translations in Scenario 1, Scenario 3, and Scenario 5 are entirely of a piece with that limited claim: “role reduction” reframes cleaning or sanitation as a loss of functional places; “shelter pocket” frames dead trees and tree hollows as microclimate-supporting structures; “accessibility restrictions” frame corridors and connectivity as constraints on future options. (see Figure 7) Here is where the governance value of the prototype enters: it is the main way in which ecological proxy may be turned into a more evidence-oriented form of later discussion. Everyone knows that institutional uptake by management agencies, educators, or local decision participants is a different and much stronger matter, and that it still has to be tested directly.
4.2. Limitations and Boundary Conditions
Regarding communication and ethics, the second boundary condition of this project is that the “risk narrative misunderstanding type” has a predictable structure. Readers often mistake visual density for “severity”, particle fog for “actual disease”, and upward- sloping boundary for “precisely predicted distribution line”. These misunderstandings do not stem from the lack of intelligence of readers. The close connection between the narrative framework and meaning, which leads to the emergence of cognitive shortcuts. Thus, this article needs to incorporate “common misunderstandings” into design control and regard it as part of the method, rather than supplementing it after the fact (Hullman, 2020; Dahlstrom, 2014). Thus, this article configures the key variables of each scenario as “strong and weak double-layer statements”: the strong layer is used to trigger intuitive reasoning (such as missing characters, narrowing the scope, threshold band), and the weak layer is used to correct errors (such as tooltips or footnotes pointing to specific agents, data caliber and version number), and the misreading rate is regarded as the same as the availability. And other important reader response evaluation indicators. (see Supplementary Table S7) (see Figure 8)
But the reader-response boundary test is not, as stronger readings might claim, proof of effect. What matters from the outset is the narrower question of readability within a small and mixed session. The composition of the group itself makes that plain: the session included only three participants categorized as general public, while the others came from architecture/urban, ecology/environmental science, and design/art backgrounds. We do not find here the basis for a general claim about non-specialist publics, municipal actors, or forest-management stakeholders, because we do not find here the breadth of sample that such a claim would require. Readability, in this setting, is not the hallmark of universality; rather, it is measured by whether a mixed group with partly relevant training or interest could follow the prototype’s reasoning without losing the thread. In contrast, the limits of the current design are found precisely where the session becomes unstable and misdirected. For a test of this scale, recurring misreads should remain central to the limitations. Thus it is not readability that should be overvalued, but the diagnostic force of error, more precisely, the way error shows where the interface still overreaches or underexplains. The misreads that matter most are clear enough: OFI taken as an official index, scenario bands read as forecasts, and particle haze read as a current outbreak.
The same caution applies to archiving and auditability. The modern contribution of the versioned slow-web workflow has been to discover source preservation and proxy- baseline maintenance as two especially exacting sources of methodological discipline. It is this discipline that the paper asks us to look for in the workflow, and which the versioned design provides in modest but useful abundance. The three levels of evidence separated by the article, design mechanism, short-session readability, and future durability or institutional uptake; they bear witness to a paper that refuses to overstate what it has shown. Mostly it is a matter of tone: claims about durable public reasoning across months, return visits, or updated evidence versions cannot be made in the calm, undifferentiated voice ofproof when such evidence has not yet been gathered. There are moments in method where too much certainty would itself become evasive. Sanity, in such cases, would become overclaiming. Ours is a mode of prototype research that deliberately pursues stable sources, proxy definitions, and baselines, and yet must admit that durable reasoning over time is still unproven. The evidence that deserves respect here is the evidence that openly bears its own cost and limit: delayed recall, cross-version comparison, and observation of how readers cite or reuse exported material after the session have not yet been tested, and would be required for longitudinal proof (International Organization for Standardization, 2009; Klein et al., 2014). Each level of evidence must keep its own terms. What strengthens the paper is precisely this separation.
5. Conclusions
What makes saproxylic beetles suitable as indicator organisms here—their position between what is neglected and what is highly indicative, their dependence on deadwood continuity and microclimate environments, their response to the accessibility limits imposed by fragmentation, and the way they register shifts in risk when pressure and window conditions are coupled—is precisely what gives them their value. Here their appearance, or their failure to appear, carries the signal, where a more generic forest image would not. In the same way, saproxylic beetles have evidential authority in this article precisely because they naturally convey structural information about continuity, fragmentation, and coupled conditions (Speight, 1989; Nieto and Alexander, 2010). Their sensitivity is their strength, and is what carries conviction. (see Supplementary Figure S4 and Appendix Table A1)
The core claim of this paper is therefore methodological. Beetles do not make climate communication novel by themselves; rather, saproxylic beetle evidence provides a useful test case for translating slow forest degradation into an auditable web narrative. The prototype organizes deadwood continuity, microclimate buffering, coupled risk, and fragmentation into interaction sequences of comparison, threshold recognition, and constrained movement. This does not prove general public understanding, governance adoption, or long-term durability. It shows that a design-led evidence-to-interface workflow can make proxy variables, uncertainty, and misreading controls explicit enough to be discussed and further tested.
It is, roughly, what the reader-response session offers by way of preliminary support for readability: many participants could identify structural loss and retell the deadwood- removal inference. Such evidence, limited by a small sample and by participants drawn only in part from the general public—without comparison to conventional formats, without any test of delayed recall—was the evidence available here. I am thinking, therefore, more direct tests for the method: comparison with species-card, poster, mascot, and disaster-style formats, the inclusion of forest managers, educators, and local public participants, the addition of delayed recall and cross-version tasks. No one who sees it that way would take the beetle to be merely a likeable character, or merely an ecological indicator. Yet so far as we care about keeping environmental media interpretable, cautious, and auditable while it communicates losses that unfold slowly, the beetle becomes a controlled test object for exactly that question. (see Appendix Table A2 and Table A3)
Supplementary Materials
The following supporting information can be downloaded at website of this paper posted on Preprints.org.
Data Availability Statement
Aggregated reader-response results, figure files, and supporting tables are included with the submission package. No identifiable human- participant data are reported.
Conflicts of Interest
Appendix A. Taxon Pool

Table A1.
Saproxylic Indicator Taxa Pool and Selection Rationale.
| Indicator taxon (family / genus-level) | Primary saproxylic niche | Why this taxon is a useful indicator (selection rationale) |
Typical microhabitat signal (what it“reads”) |
IUCN /EU Red List status (species- level) | Regionalmeaning (Crete context) |
| Lucanidae (stag beetles, incl. Lucanus spp.) | Larvae in decaying wood, roots, stumps | Strong dependence on large deadwood; emblematic continuity signal | Veteran trees, large logs, long continuity | NT (guild- level); species- level varies | Flagship for veteran-tree retention; communicates ‘old wood’ value |
| Cetoniinae (hollow-tree saproxylic guild) | Tree hollows, wood mould | Sensitive to hollow-tree availability; links to veteran-tree management |
Hollow trees, wood mould depth |
NT; species- level varies | Signals scarcity of hollows in managed stands; ties to cultural trees |
| Cerambycidae (incl. Cerambyx spp.) |
Larvae in dead/dying trunks |
Tracks coarse woody debris and weakened trees; readable structural taxa | Large trunks, sun-exposed deadwood |
LC–NT; species- level varies |
Mediterranean heat exposure indicator; bridges forestry and risk framing |
| Cerambycidae (Rosalia-type longhorn guild) |
Old-growth associated deadwood |
Widely used as continuity/old- forest signal in Europe |
Old trees, stable microclimates | VU (guild- level); species- level varies | ‘Refugia’ storyline anchor for mountain relic habitats |
| Buprestidae (incl. Agrilus spp.) |
Under bark of stressed hosts |
Connects habitat structure with drought-stress dynamics (coupled risk) | Heat/drought- stressed wood, bark condition | LC–NT; species- level varies |
Reads drought stress windows; supports ‘baseline shift’ narrative |
| Buprestidae (Buprestis-type deadwood guild) | Dry deadwood, under bark | Responds to deadwood availability and exposure |
Dry logs, late- stage bark habitats | LC | Supports ‘drying and ’ exposure mechanism without spectacle |
| Elateridae (saproxylic click-beetle guild) |
Rot holes, decayed wood | Often tied to hollow trees and advanced decay; continuity signal | Rot holes, moist decay pockets | NT | Microclimate- buffer indicator; pairs well with cavity temperature delta |
| Cucujidae (incl. Cucujus spp.) |
Under bark of large deadwood | Requires large, well-structured deadwood; strong ‘big wood’ signal | Thick bark layers, large logs |
VU | Highlights loss of large logs under sanitation and fuel removal |
| Trogossitidae (bark-gnawing guild) |
Under bark; predator/scavenger |
Indicates structured bark habitats and multi-trophic deadwood web | Bark complexity, prey availability | LC | Signals trophic completeness; useful for ‘roles not waste’ framing |
| Cleridae (checkered- beetle guild) |
Predators in deadwood systems |
Reflects functioning deadwood food web (not just wood volume) | Presence of prey guilds under bark |
LC | Makes ‘food- web collapse’ legible through missing predators |
| Ciidae (minute tree-fungus beetles) | Fungus fruiting bodies on deadwood | Reads fungal succession and deadwood–fungus coupling | Polypores, bracket fungi | LC | Turns fungal presence into readable resource signal in late decay |
| Mycetophagidae (fungus beetles) |
Decay fungi and mould | Tracks fungal-rich decay stages; microhabitat diversity | Fungal abundance and variety |
LC | Supports ‘loss of variety’ message via reduced fungal-linked guilds |
| Erotylidae (pleasing fungus beetles, incl. Triplax spp.) | Bracket fungi | Signals fungal resources and advanced decay | Mature fungal bodies on logs |
NT | Good ‘late- stage’ marker; helps show decay-stage richness visually |
| Melandryidae (false darkling saproxylic guild) | Rotting wood, fungi | Often associated with long-decay continuity | Late-stage decay, fungal wood | NT | Slow-decay continuity cue; aligns with ‘slow collapse’ thesis |
| Zopheridae (deadwood- associated guild) |
Under bark, decayed wood | Indicates stable deadwood microhabitats; low mobility often | Bark microcavities, stable humidity | VU | Fragmentation- sensitive cue; pairs with dispersal constraints |
| Tenebrionidae (saproxylic darkling guild) | Dry deadwood, cavities | Reads aridity– deadwood interaction (Mediterranean relevance) | Dry cavities, exposed deadwood | LC–NT | Aridity narrative anchor; helps distinguish ‘dry’ vs ‘buffered’ pockets |
| Scolytinae (bark beetles, generic) | Under bark, stressed trees | Included as coupled-risk indicator rather than continuity; stress signal |
Host stress + disturbance window |
LC (guild- level); species- level varies | Connects drought stress to outbreak framing without moralization |
| Platypodinae /Platypus-type ambrosia guild |
Ambrosia fungi inwood | Explicit pathogen-coupling node; illustrates vector– fungus mechanism | Stressed hosts+ fungal galleries |
NT | Supports‘coupled risks’ scene: stress enables multi- agent outbreaks |
| Nitidulidae (sap beetles, sap runs/decay) | Sap flows, fermenting decay |
Reads wounding and sap run availability; interface to disturbance | Wounds, sap runs, fermenting pockets | LC | Disturbance trace; helps narrate ‘open wound’ microhabitats |
| Histeridae (saproxylic predator guild) | Predators in decaying substrates | Indicates functioning decomposer community (trophic completeness) | Decay pockets with diverse invertebrates | LC | Complements predator layer; makes ‘missing roles’ more robust |
Appendix B. Reader-Response
Table A2.
reader response summary N 18.
|
Outcome construct |
Operationalization (example item/task) |
Scale | result | Interpretation for the paper |
| Cute→Structural shift | After viewing, participant selects which statement best fits the project goal (A: cute insects; B: structural degradation through deadwood continuity). |
Choice (%) | B selected by 15/18 (83.3%) |
Most readers moved from ‘character’ framing to ‘structure’ framing. Use as evidence that anti-cutesification controls work. |
| Causal recall (Scene 1) | Free recall: “What changes when deadwood is removed?” coded for ‘roles/habitat functions reduce’. | Binary code | 14/18 (77.8%) | Supports that toggling produces an actionable inference, not just aesthetic appreciation (Ericsson & Simon, 1993). |
| Understanding of uncertainty | Likert item: “The boundary/values are scenarios or proxies, not precise forecasts. “ | 1–7 Likert | Mean 5.6 (SD 1.0) | Disclosure cues likely prevented overclaiming; aligns with uncertainty communication guidance (van der Bles et al., 2020). |
| Trust / auditability | Likert item: “I can tell what information the visuals are based “ on. |
1–7 Likert | Mean 5.2 (SD 1.2) | Indicates that proxy notes/appendix definitions made the interface feel traceable (Hullman, 2016). |
| Misread: ‘OFI is official’ | Think-aloud code: assumes OFI is a standard ecological index used by scientists. | Frequency (n) | 4/18 (22.2%) | A manageable misread; motivates keeping Table 6 Note + Appendix formula and adding a small ‘interface-only’ badge. |
| Overall comprehension |
Likert item: “I can explain the project to a friend in one sentence. “ | 1–7 Likert | Mean 5.8 (SD 0.9) | Suggests the evidence chain is memorable without relying on fear or spectacle (Moser & Dilling, 2007). |
Table A3.
Participant Profile N 18.
| Variable | Value |
| Age (years; mean ± SD; range) | 28.1 ± 4.8; 22–36 |
| Gender (counts) | F = 11; M = 5; NB = 2 |
| Background (counts) | Architecture/Urban = 6; Ecology/EnvSci = 5; Design/Art = 4; General public = 3 |
| Language for session (counts) | EN = 12; IT = 3; ZH = 3 |
| Prior familiarity with saproxylic beetles (1–7) | 2.1 ± 1.0 |
| Prior familiarity with Crete mountain ecology (1–7) | 2.8 ± 1.3 |
| Session mode (counts) | Remote screen-share = 10; On-site workstation = 8 |
| Device (counts) | Laptop/desktop = 16; Tablet = 2 |
| Average session duration (minutes; mean ± SD) | 22.4 ± 3.1 |
Table A4.
Reader Response Outcomes 17 Likert unless noted.
| Measure | Mean ± SD | What it tests |
| Pre knowledge: deadwood– beetle relation | 2.3 ± 1.1 | baseline invisibility |
| Post knowledge: deadwood– beetle relation | 5.0 ± 1.2 | translation effectiveness |
| Change (Post–Pre) | +2.7 ± 1.0 | shift magnitude |
| Legible-loss clarity (loss as structure) | 5.8 ± 0.9 | readability of structural loss |
| Proxy vs prediction understanding | 5.4 ± 1.0 | uncertainty literacy |
| One-sentence retell ability | 5.2 ± 1.1 | compressibility of core claim |
| Traceability (can point to proxies/sources) | 5.1 ± 1.2 | evidence trace-back |
| Too-cute guardrail (higher = more neutralizing) | 2.8 ± 1.2 | anti-cartoonization check |
| Fear-spectacle guardrail (higher = more dramatizing) | 2.3 ± 1.0 | anti-spectacle check |
| SUS usability score (0–100) | 76.5 ± 10.2 | general usability benchmark |
| Time-on-task (minutes) | 12.1 ± 2.9 | interaction pacing (context) |
Table A5.
Intended Inference Claims and Misread Types frequency summary.
| Scene / Construct | Target inference (binary-coded) | Observed occurrence (n / N) | Most common misread trigger (n) |
| Scene 1 (Deadwood continuity) | ‘Clean’ reduces functional roles & continuity | 15 / 18 | ‘OFI is an official ecological index’ (4) |
| Scene 2 (Mountain refugia) | Warming contracts upward (area thins) | 14 / 18 | ‘Boundary line = precise prediction’ (5) |
| Scene 3 (Microclimate refuge) | Tree hollows buffer ΔT/ΔRH | 11 / 18 | ‘Hover ΔT implies guaranteed survival’ (3) |
| Scene 4 (Coupled risks) | Risk emerges from coupled conditions & thresholds | 13 / 18 | ‘Particle fog = event happening now’ (3) |
| Scene 5 (Fragmentation / connectivity) | Connectivity constrains reachable futures | 12 / 18 | ‘Bridges = policy recommendation, not a model’ (4) |
References
- Allen, C. D., Macalady, A. K., Chenchouni, H., et al. (2010). A global overview of drought and heat-induced tree mortality reveals emerging climate change risks fo forests. Forest Ecology and Management, 259(4), 660–684.
- Anderegg, W. R. L., Kane, J. M., and Anderegg, L. D. L. (2013). Consequences of widespread tree mortality triggered by drought and temperature stress. Nature Climate Change, 3, 30–36.
- Bolanakis, G., Makris, C., and Trichas, A. (2024). New and noteworthy records of saproxylic beetles (Coleoptera) from Crete (Greece). Travaux du Muséum National d’Histoire Naturelle “Grigore Antipa”, 67(1), 71–93.
- Cash, D. W., Clark, W. C., Alcock, F., et al. (2003). Knowledge systems for sustainable development. Proceedings of the National Academy of Sciences, 100(14), 8086– 8091.
- Chen, I.-C., Hill, J. K., Ohlemüller, R., Roy, D. B., and Thomas, C. D. (2011). Rapid range shifts of species associated with high levels of climate warming. Science, 333(6045), 1024–1026.
- Dahlstrom, M. F. (2014). Using narratives and storytelling to communicate science with nonexpert audiences. Proceedings of the National Academy of Sciences, 111 (Suppl. 4), 13614–13620.
- De Frenne, P., Zellweger, F., Rodríguez-Sánchez, F., et al. (2019). Global buffering of temperatures under forest canopies. Nature Ecology & Evolution, 3(5), 744–749.
- Fahrig, L. (2003). Effects of habitat fragmentation on biodiversity. Annual Review of Ecology, Evolution, and Systematics, 34, 487–515.
- Gossner, M. M., Lachat, T., Brunet, J., et al. (2016). Deadwood enrichment in European forests: Which tree species should be used to promote saproxylic beetle diversity? Biological Conservation, 201, 92–102.
- Grove, S. J. (2002). Saproxylic insect ecology and the sustainable management of forests. Annual Review of Ecology and Systematics, 33, 1–23.
- Haddad, N. M., Brudvig, L. A., Clobert, J., et al. (2015). Habitat fragmentation and its lasting impact on Earth’s ecosystems. Science Advances, 1(2), e1500052.
- Hullman, J. (2020). Why authors don’t visualize uncertainty. IEEE Transactions on Visualization and Computer Graphics, 26(1), 130–139.
- Intergovernmental Panel on Climate Change. (2022). Climate Change 2022: Impacts, Adaptation and Vulnerability. Cambridge: Cambridge University Press.
- International Organization for Standardization. (2009). ISO 28500: 2009 Information and documentation—WARC file format. Geneva: ISO.
- International Organization for Standardization. (2019). ISO 9241-210: 2019 Ergonomics of human-system interaction—Part 210: Human-centred design for interactive systems. Geneva: ISO.
- Jactel, H., Petit, J., Desprez-Loustau, M.-L., et al. (2012). Drought effects on damage by forest insects and pathogens: A meta-analysis. Global Change Biology, 18(1), 267–276.
- Klein, M., Van de Sompel, H., Sanderson, R., et al. (2014). Scholarly context not found: One in five articles suffers from reference rot. PLOS ONE, 9(12), e115253.
- Kosara, R., and Mackinlay, J. (2013). Storytelling: The next step for visualization. Computer, 46(5), 44–50.
- Lassauce, A., Paillet, Y., Jactel, H., and Bouget, C. (2011). Deadwood as a surrogate for forest biodiversity: Meta-analysis of correlations between deadwood volume and species richness of saproxylic organisms. Ecological Indicators, 11(5), 1027–1039.
- Lindenmayer, D. B., and Laurance, W. F. (2017). The ecology, distribution, conservation and management of large old trees. Biological Reviews, 92(3), 1434–1458.
- Moser, S. C. (2010). Communicating climate change: History, challenges, process and future directions. WIREs Climate Change, 1(1), 31–53.
- Müller, J., and Bütler, R. (2010). A review of habitat thresholds for dead wood: A baseline for management recommendations in European forests. European Journal of Forest Research, 129(6), 981–992.
- Nieto, A., and Alexander, K. N. A. (2010). European Red List of Saproxylic Beetles. Luxembourg: Publications Office of the European Union.
- Norström, A. V., Cvitanovic, C., Löf, M. F., et al. (2020). Principles for knowledge co- production in sustainability research. Nature Sustainability, 3, 182–190.
- O’Neill, S., and Nicholson-Cole, S. (2009). “Fear won’t do it”: Promoting positive engagement with climate change. Science Communication, 30(3), 355–379.
- Parmesan, C. (2006). Ecological and evolutionary responses to recent climate change. Annual Review of Ecology, Evolution, and Systematics, 37, 637–669.
- Ranius, T. (2002). Influence of stand size and quality of tree hollows on saproxylic beetles in Sweden. Biological Conservation, 103(1), 85–91.
- Ranius, T., and Jansson, N. (2000). The influence of forest regrowth, canopy cover and tree size on saproxylic beetles associated with old oaks. Biological Conservation, 95(1), 85–94.
- Sandström, J., Bernes, C., Junninen, K., et al. (2019). Impacts of dead wood manipulation on the biodiversity of temperate and boreal forests: A systematic review. Journal of Applied Ecology, 56(7), 1770–1781.
- Segel, E., and Heer, J. (2010). Narrative visualization: Telling stories with data. IEEE Transactions on Visualization and Computer Graphics, 16(6), 1139–1148.
- Soulioti, N., Tsopelas, P., and Woodward, S. (2015). Platypus cylindrus, a vector of Ceratocystis platani in Platanus orientalis stands in Greece. Forest Pathology, 45(5), 367–372.
- Speight, M. C. D. (1989). Saproxylic Invertebrates and Their Conservation. Nature and Environment Series No. 42. Strasbourg: Council of Europe.
- Stokland, J. N., Siitonen, J., and Jonsson, B. G. (2012). Biodiversity in Dead Wood. Cambridge: Cambridge University Press.
- van der Bles, A. M., van der Linden, S., Freeman, A. L. J., and Spiegelhalter, D. J. (2020) The effects of communicating uncertainty on public trust in facts and numbers. Proceedings of the National Academy of Sciences, 117(14), 7672–7683.
Figure 1.
Evidence-to-Interface Pipeline.
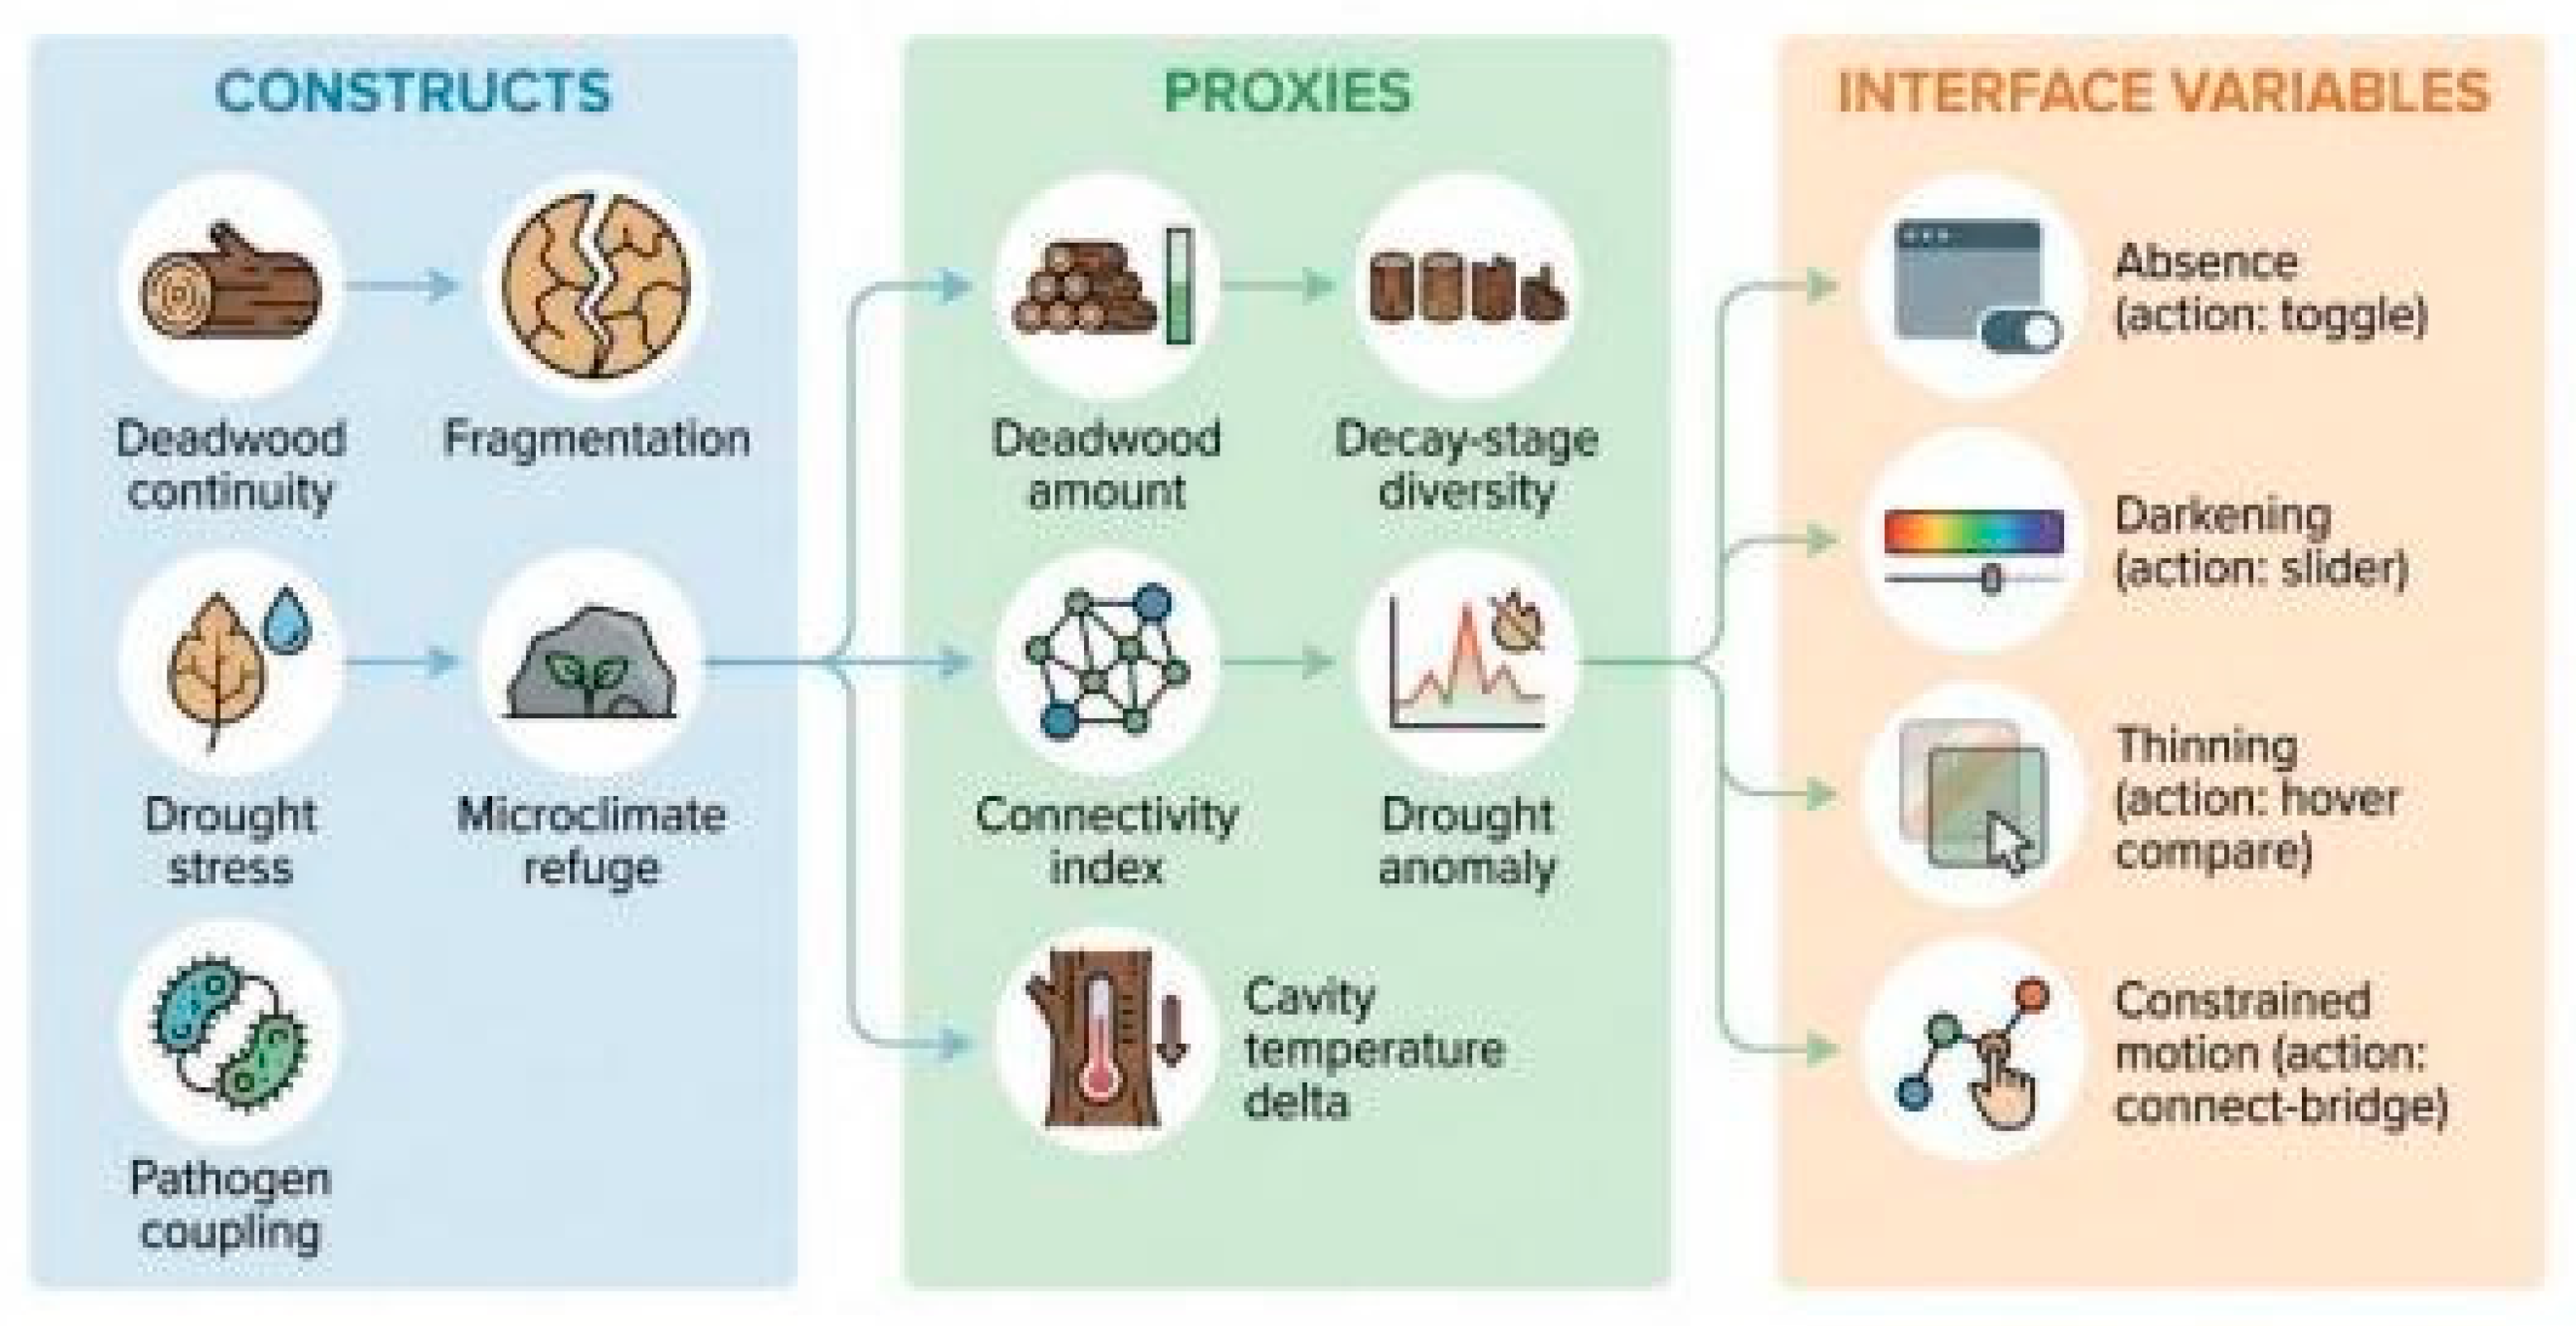
Figure 2.
Interaction Grammar as Inference and the Three Anti-cutesification Rules.
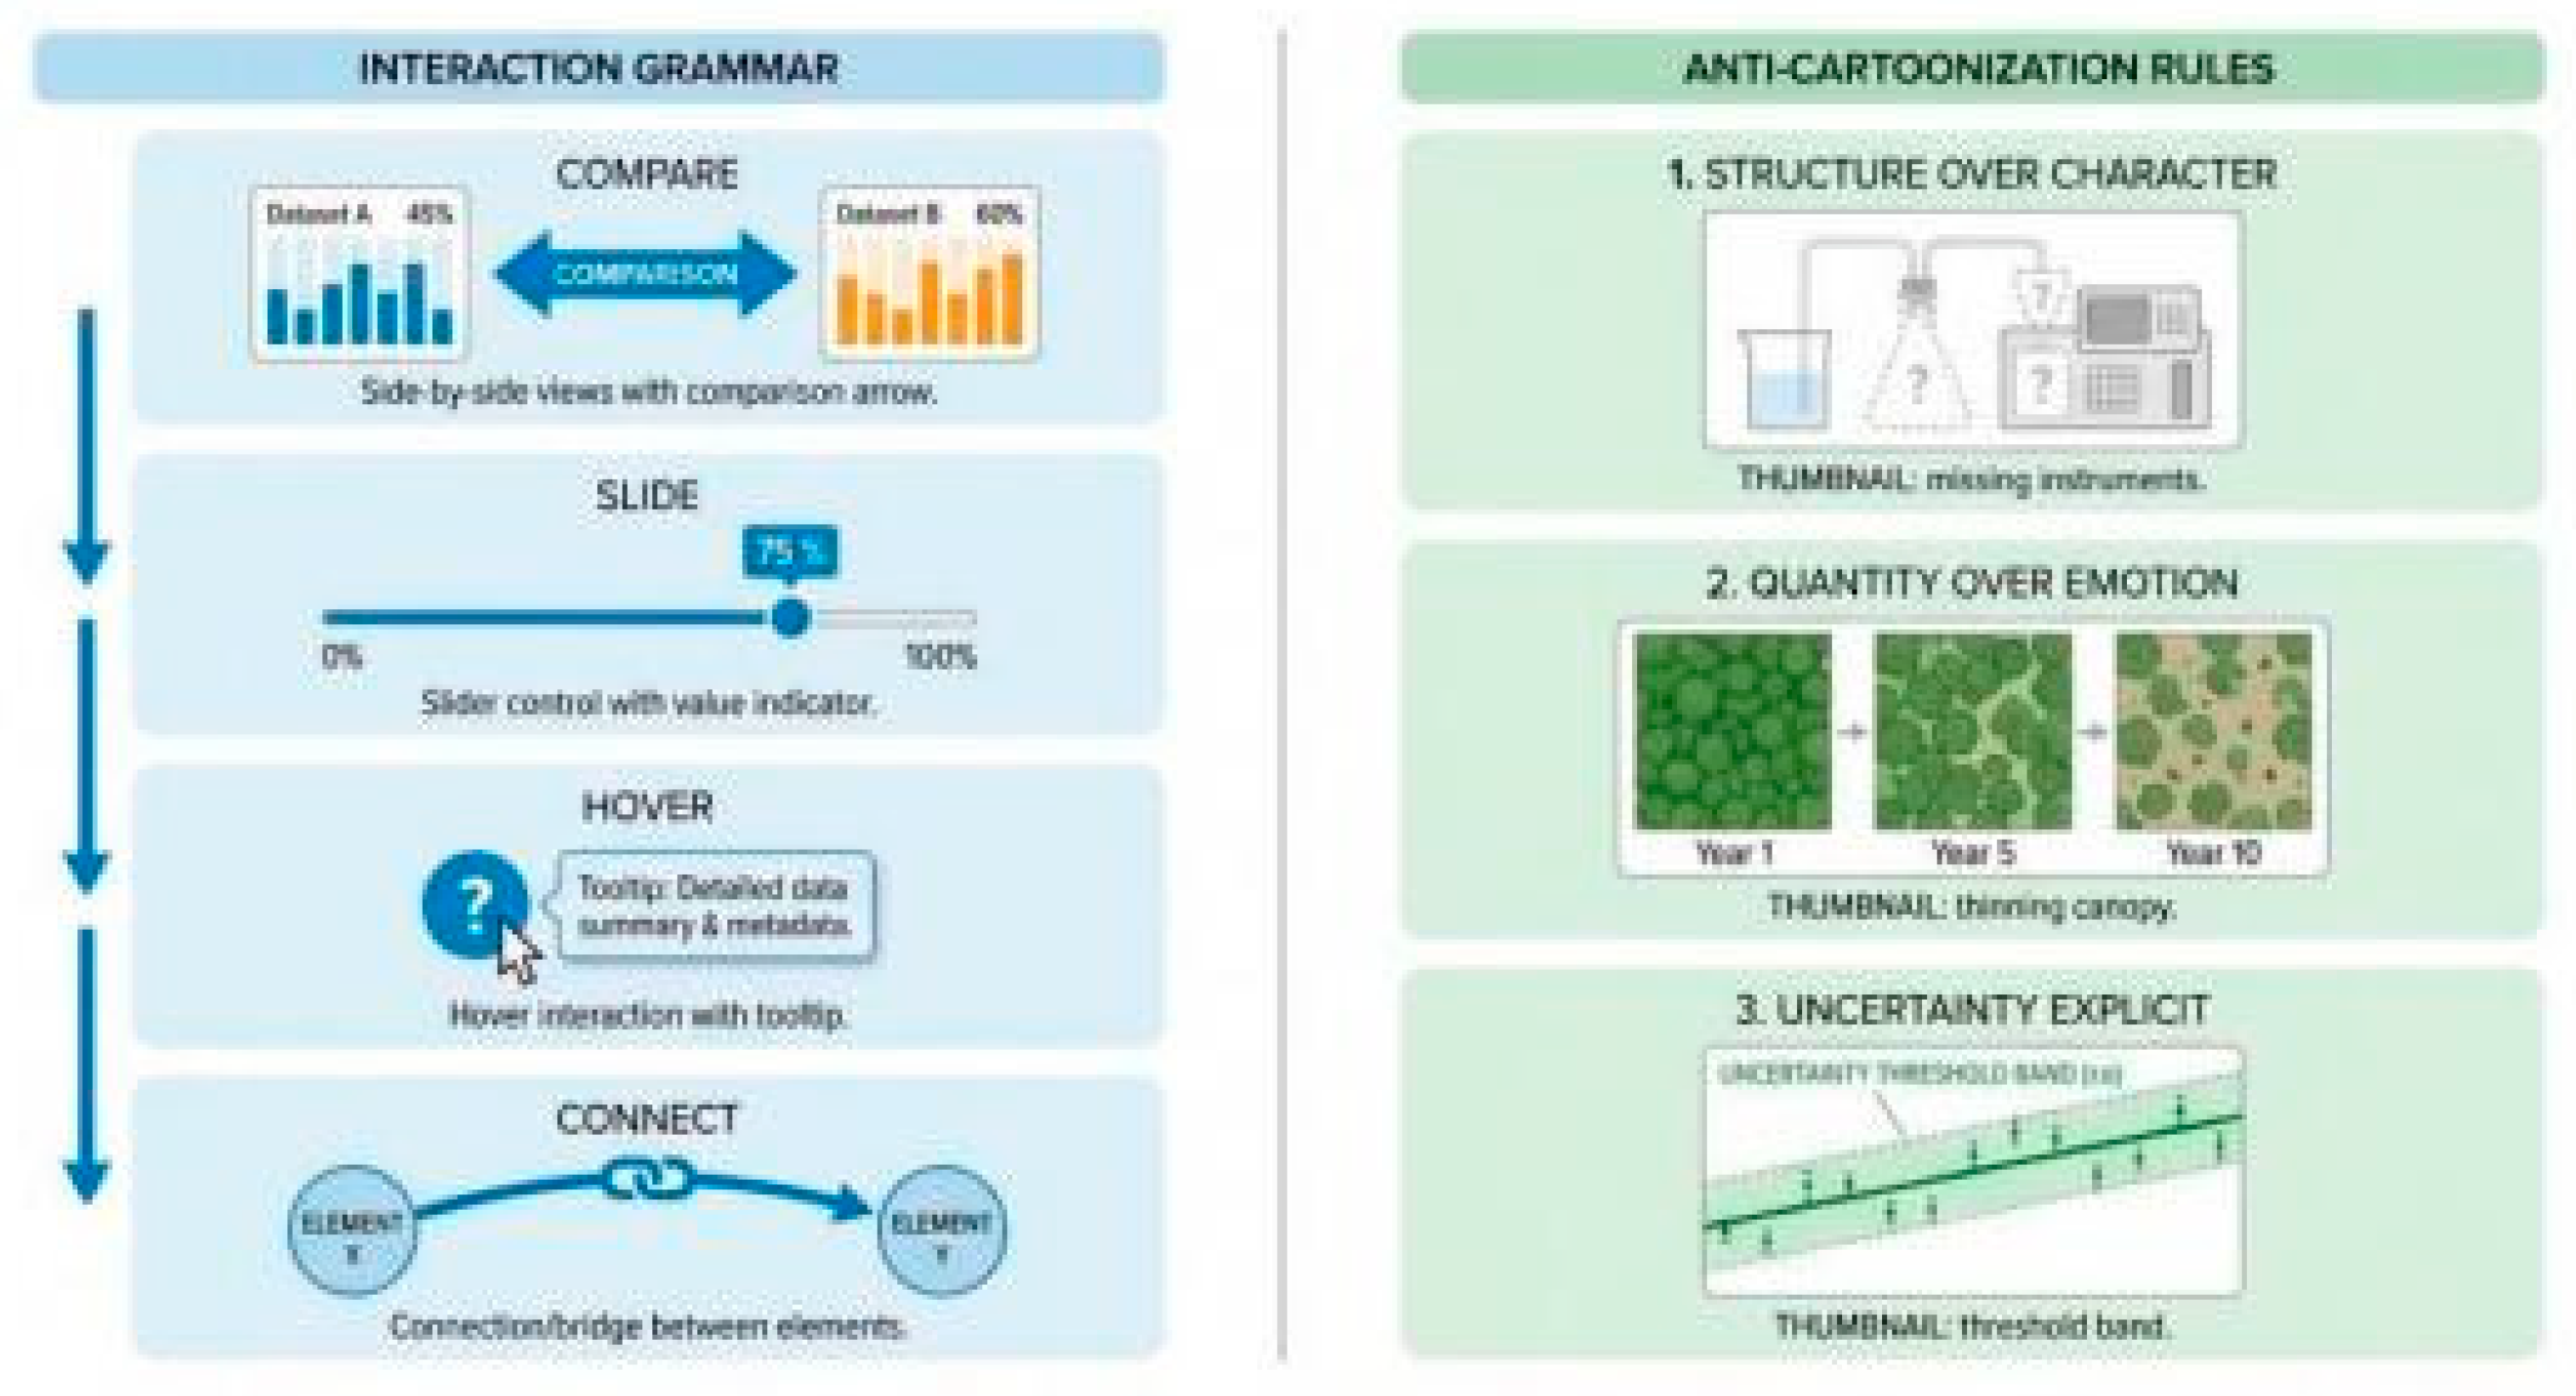
Figure 3.
Versioned Publishing Workflow for a Slow Website.
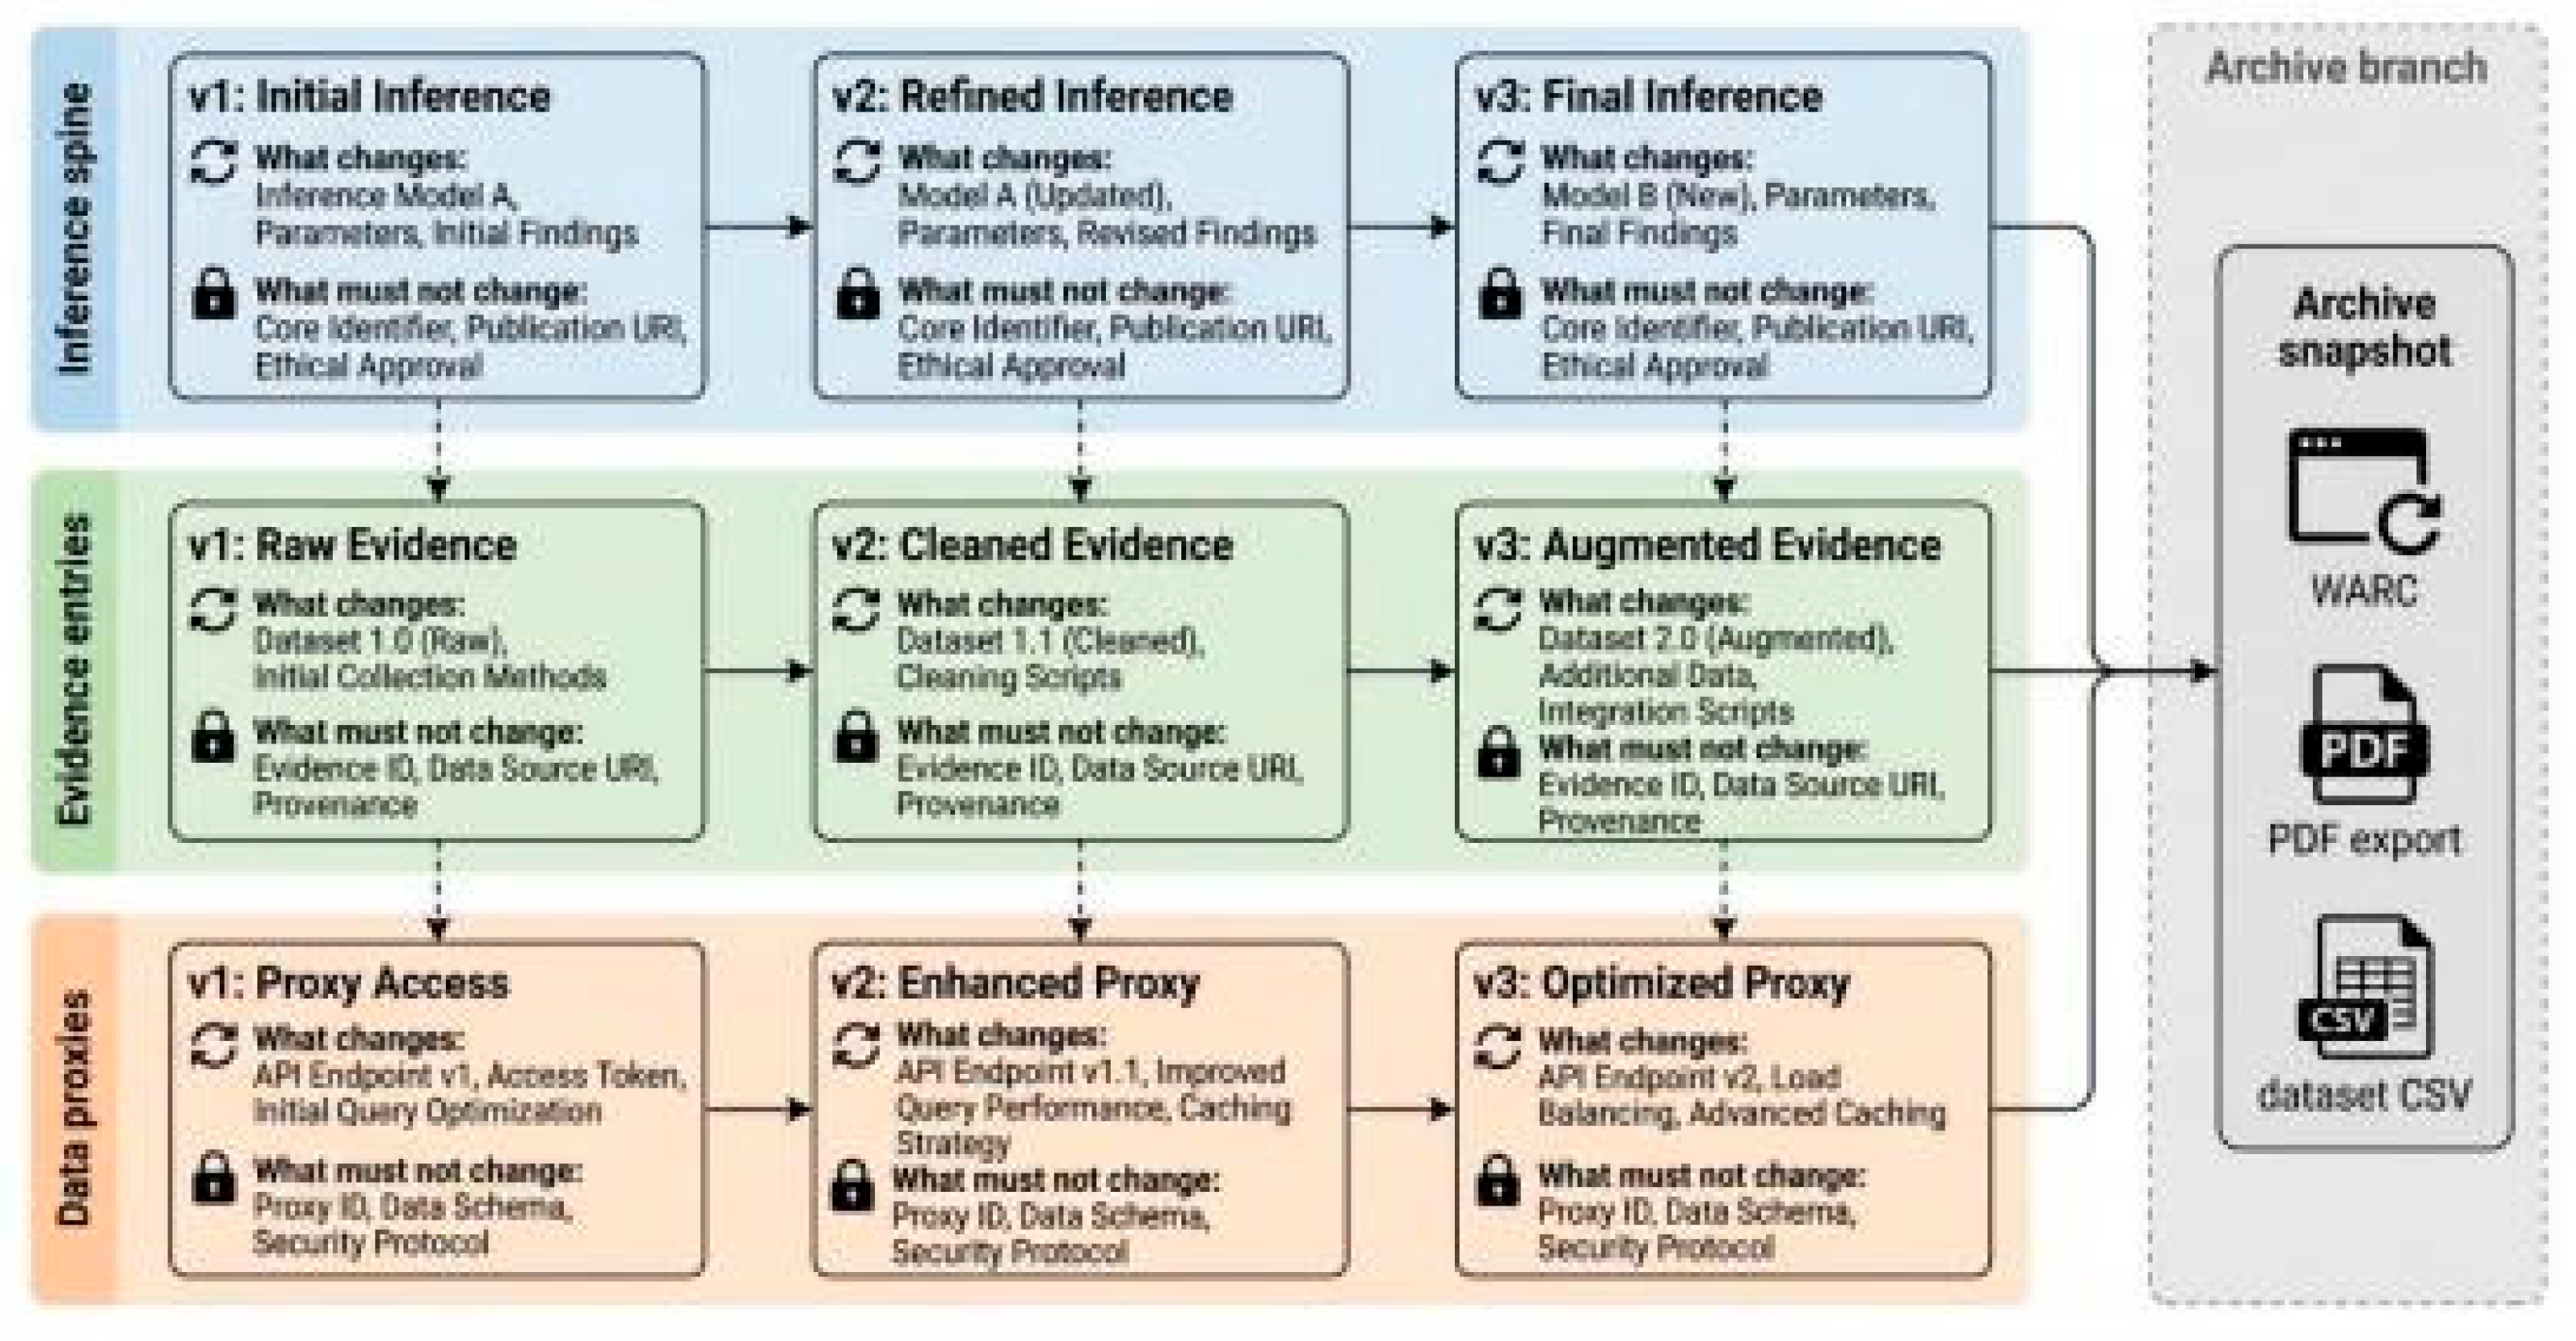
Figure 4.
Scene 1: Beetle Band / Deadwood Stage (Wild vs Clean).
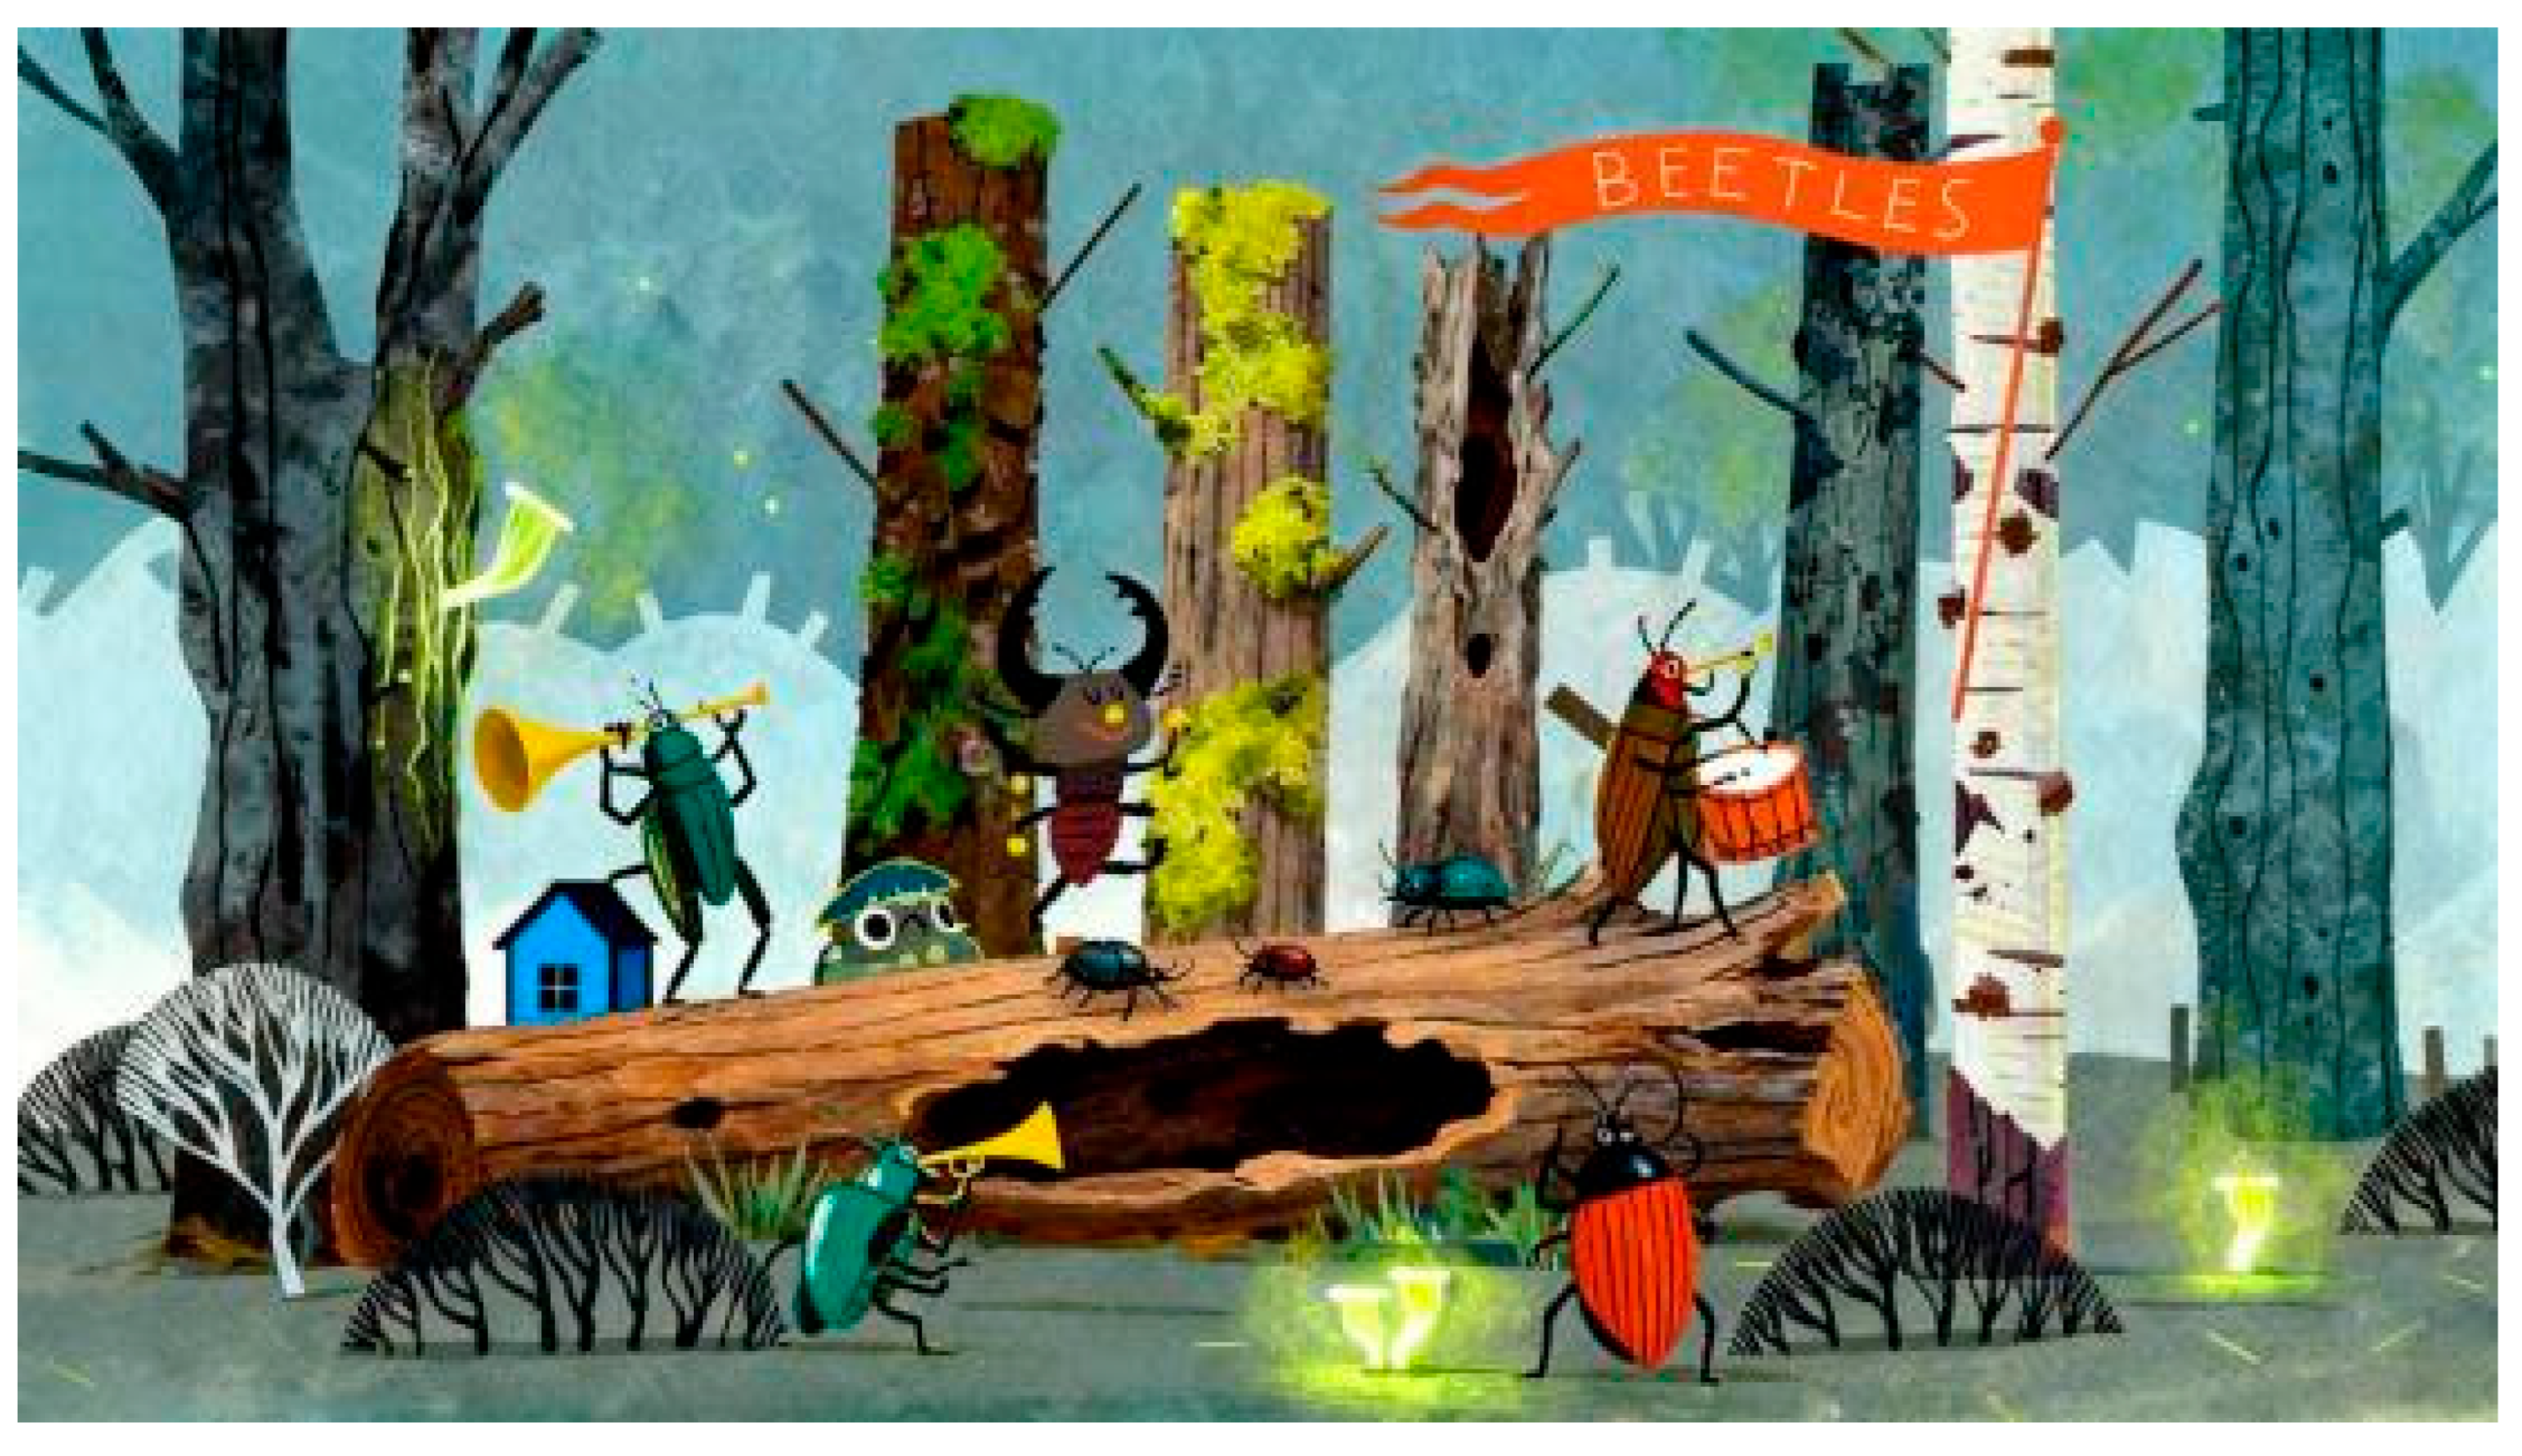
Figure 5.
Scene 3: Winter Refuge showing microhabitat buffering as measurable deltas (ΔT, ΔRH).
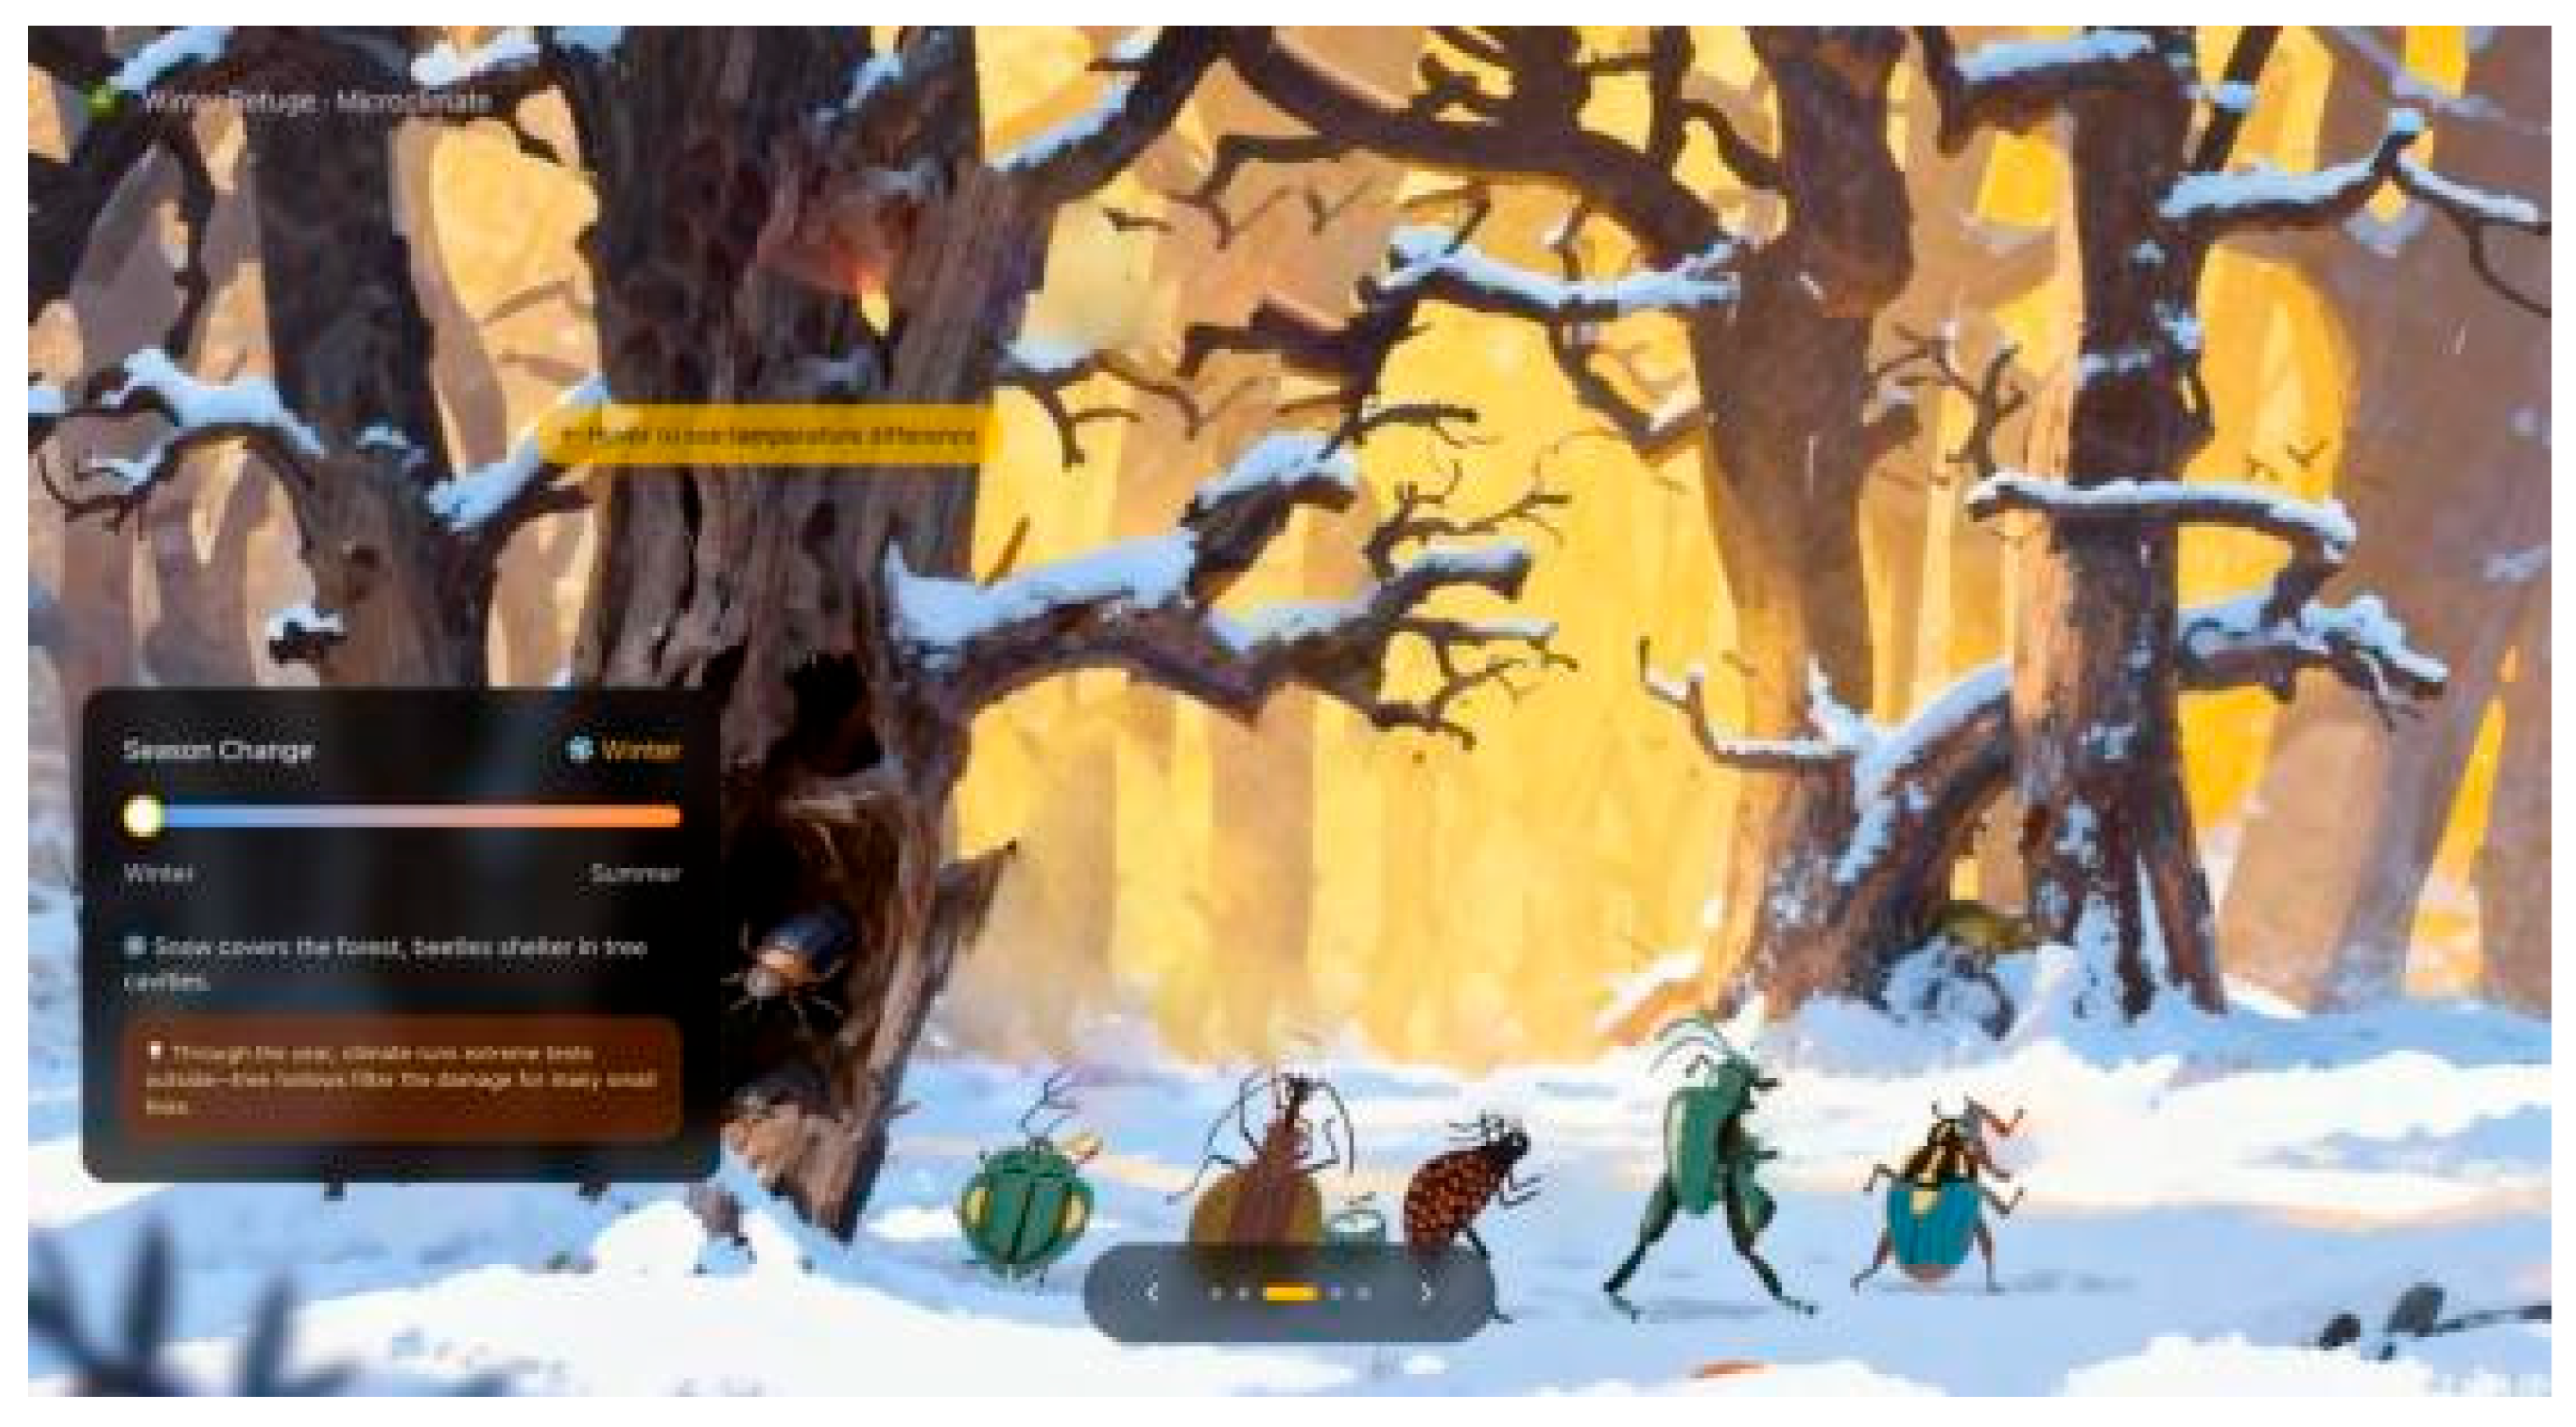
Figure 6.
Scene 4: Valley fever and threshold belt.
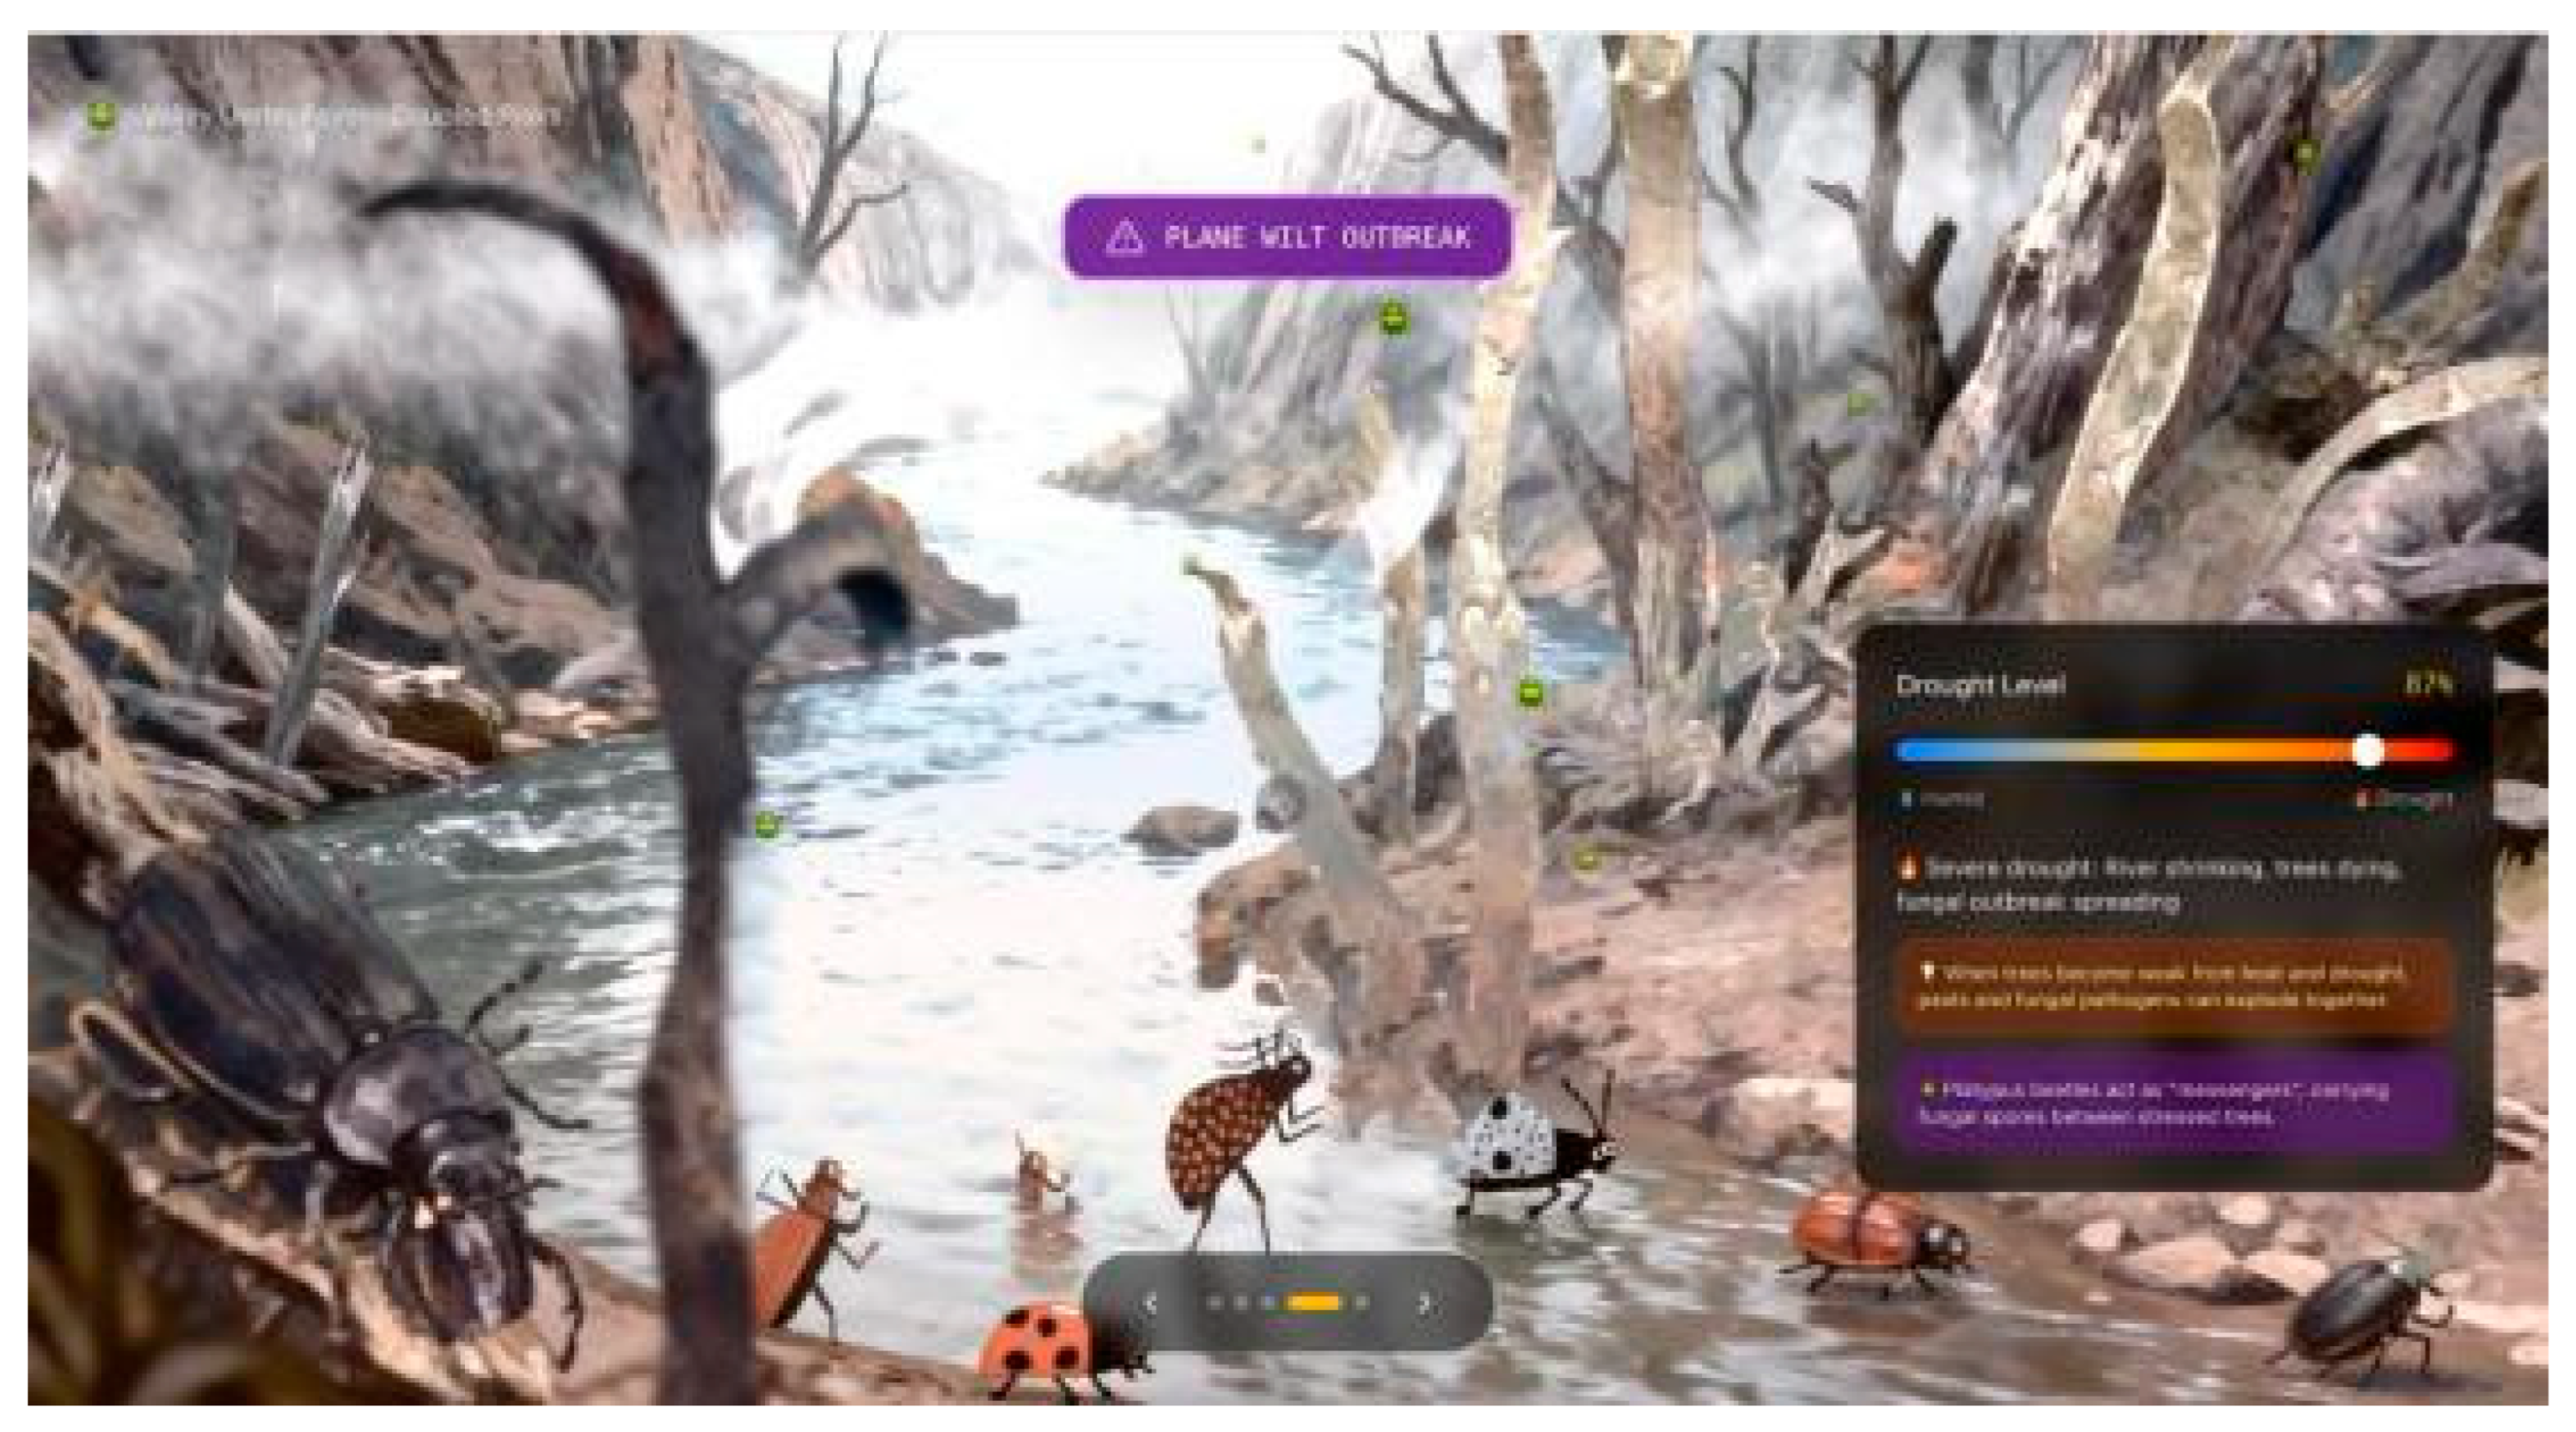
Figure 7.
Five scenes as an evidence chain.
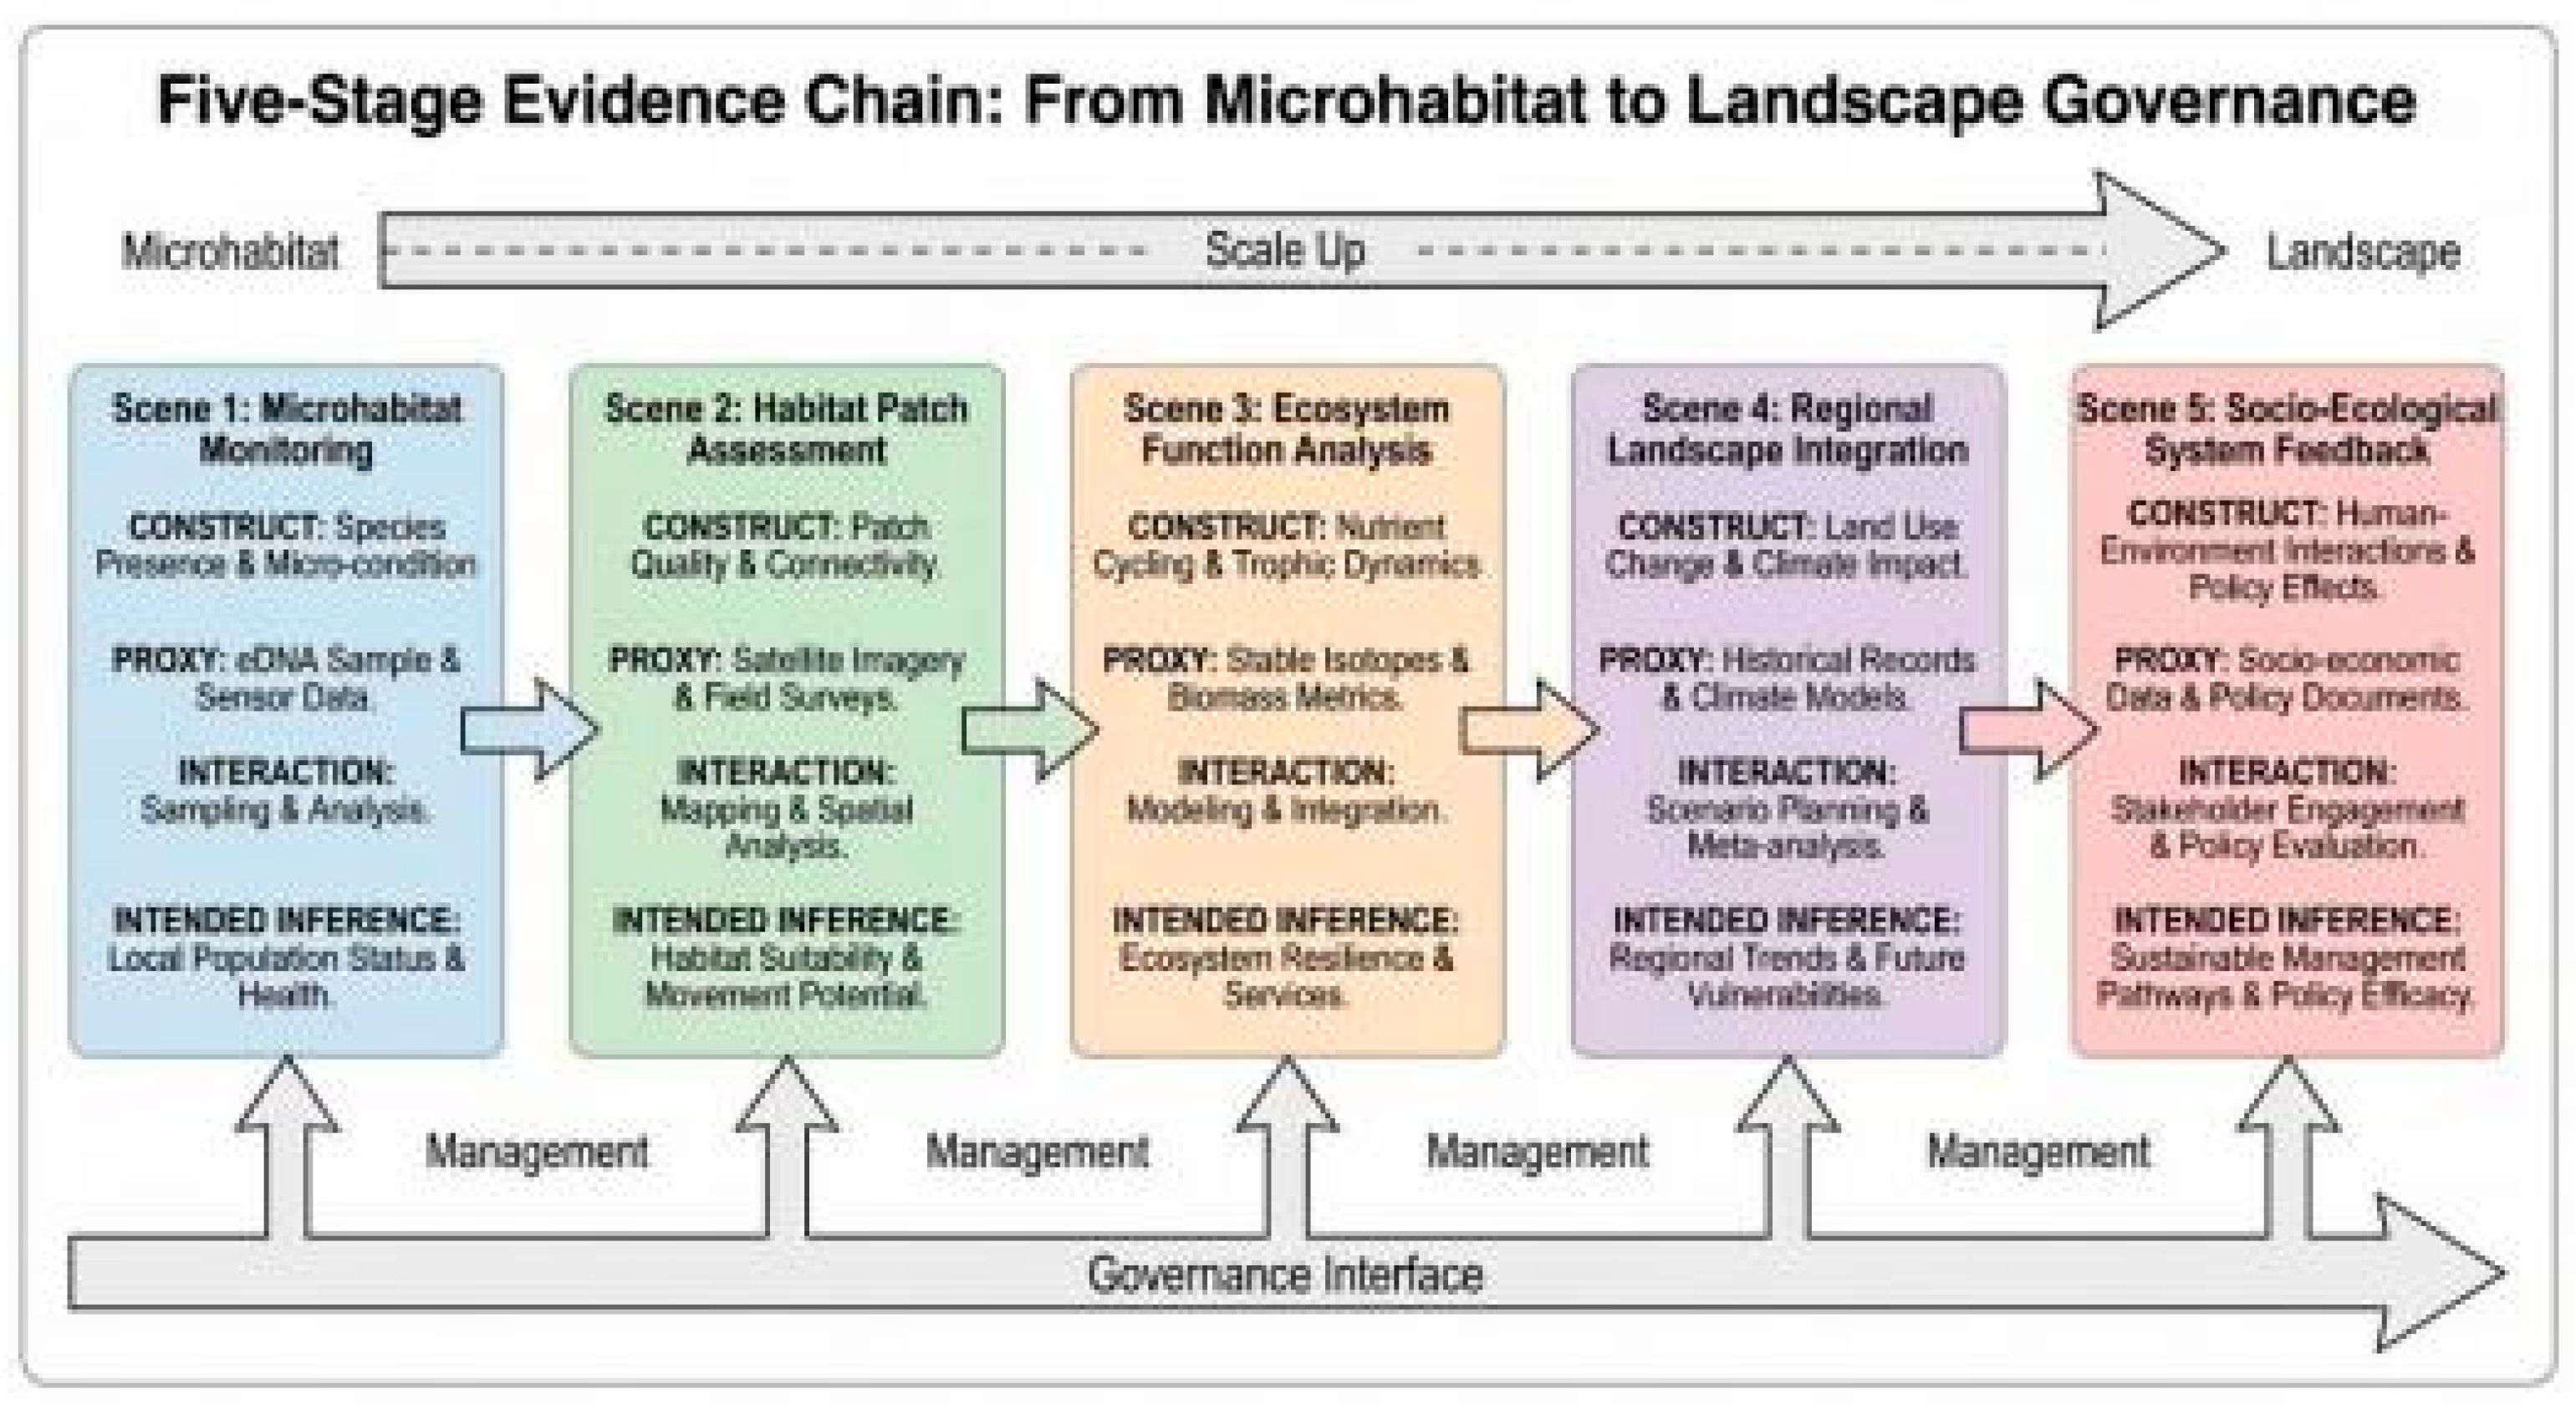
Figure 8.
Uncertainty disclosure ladder for the five scenes.
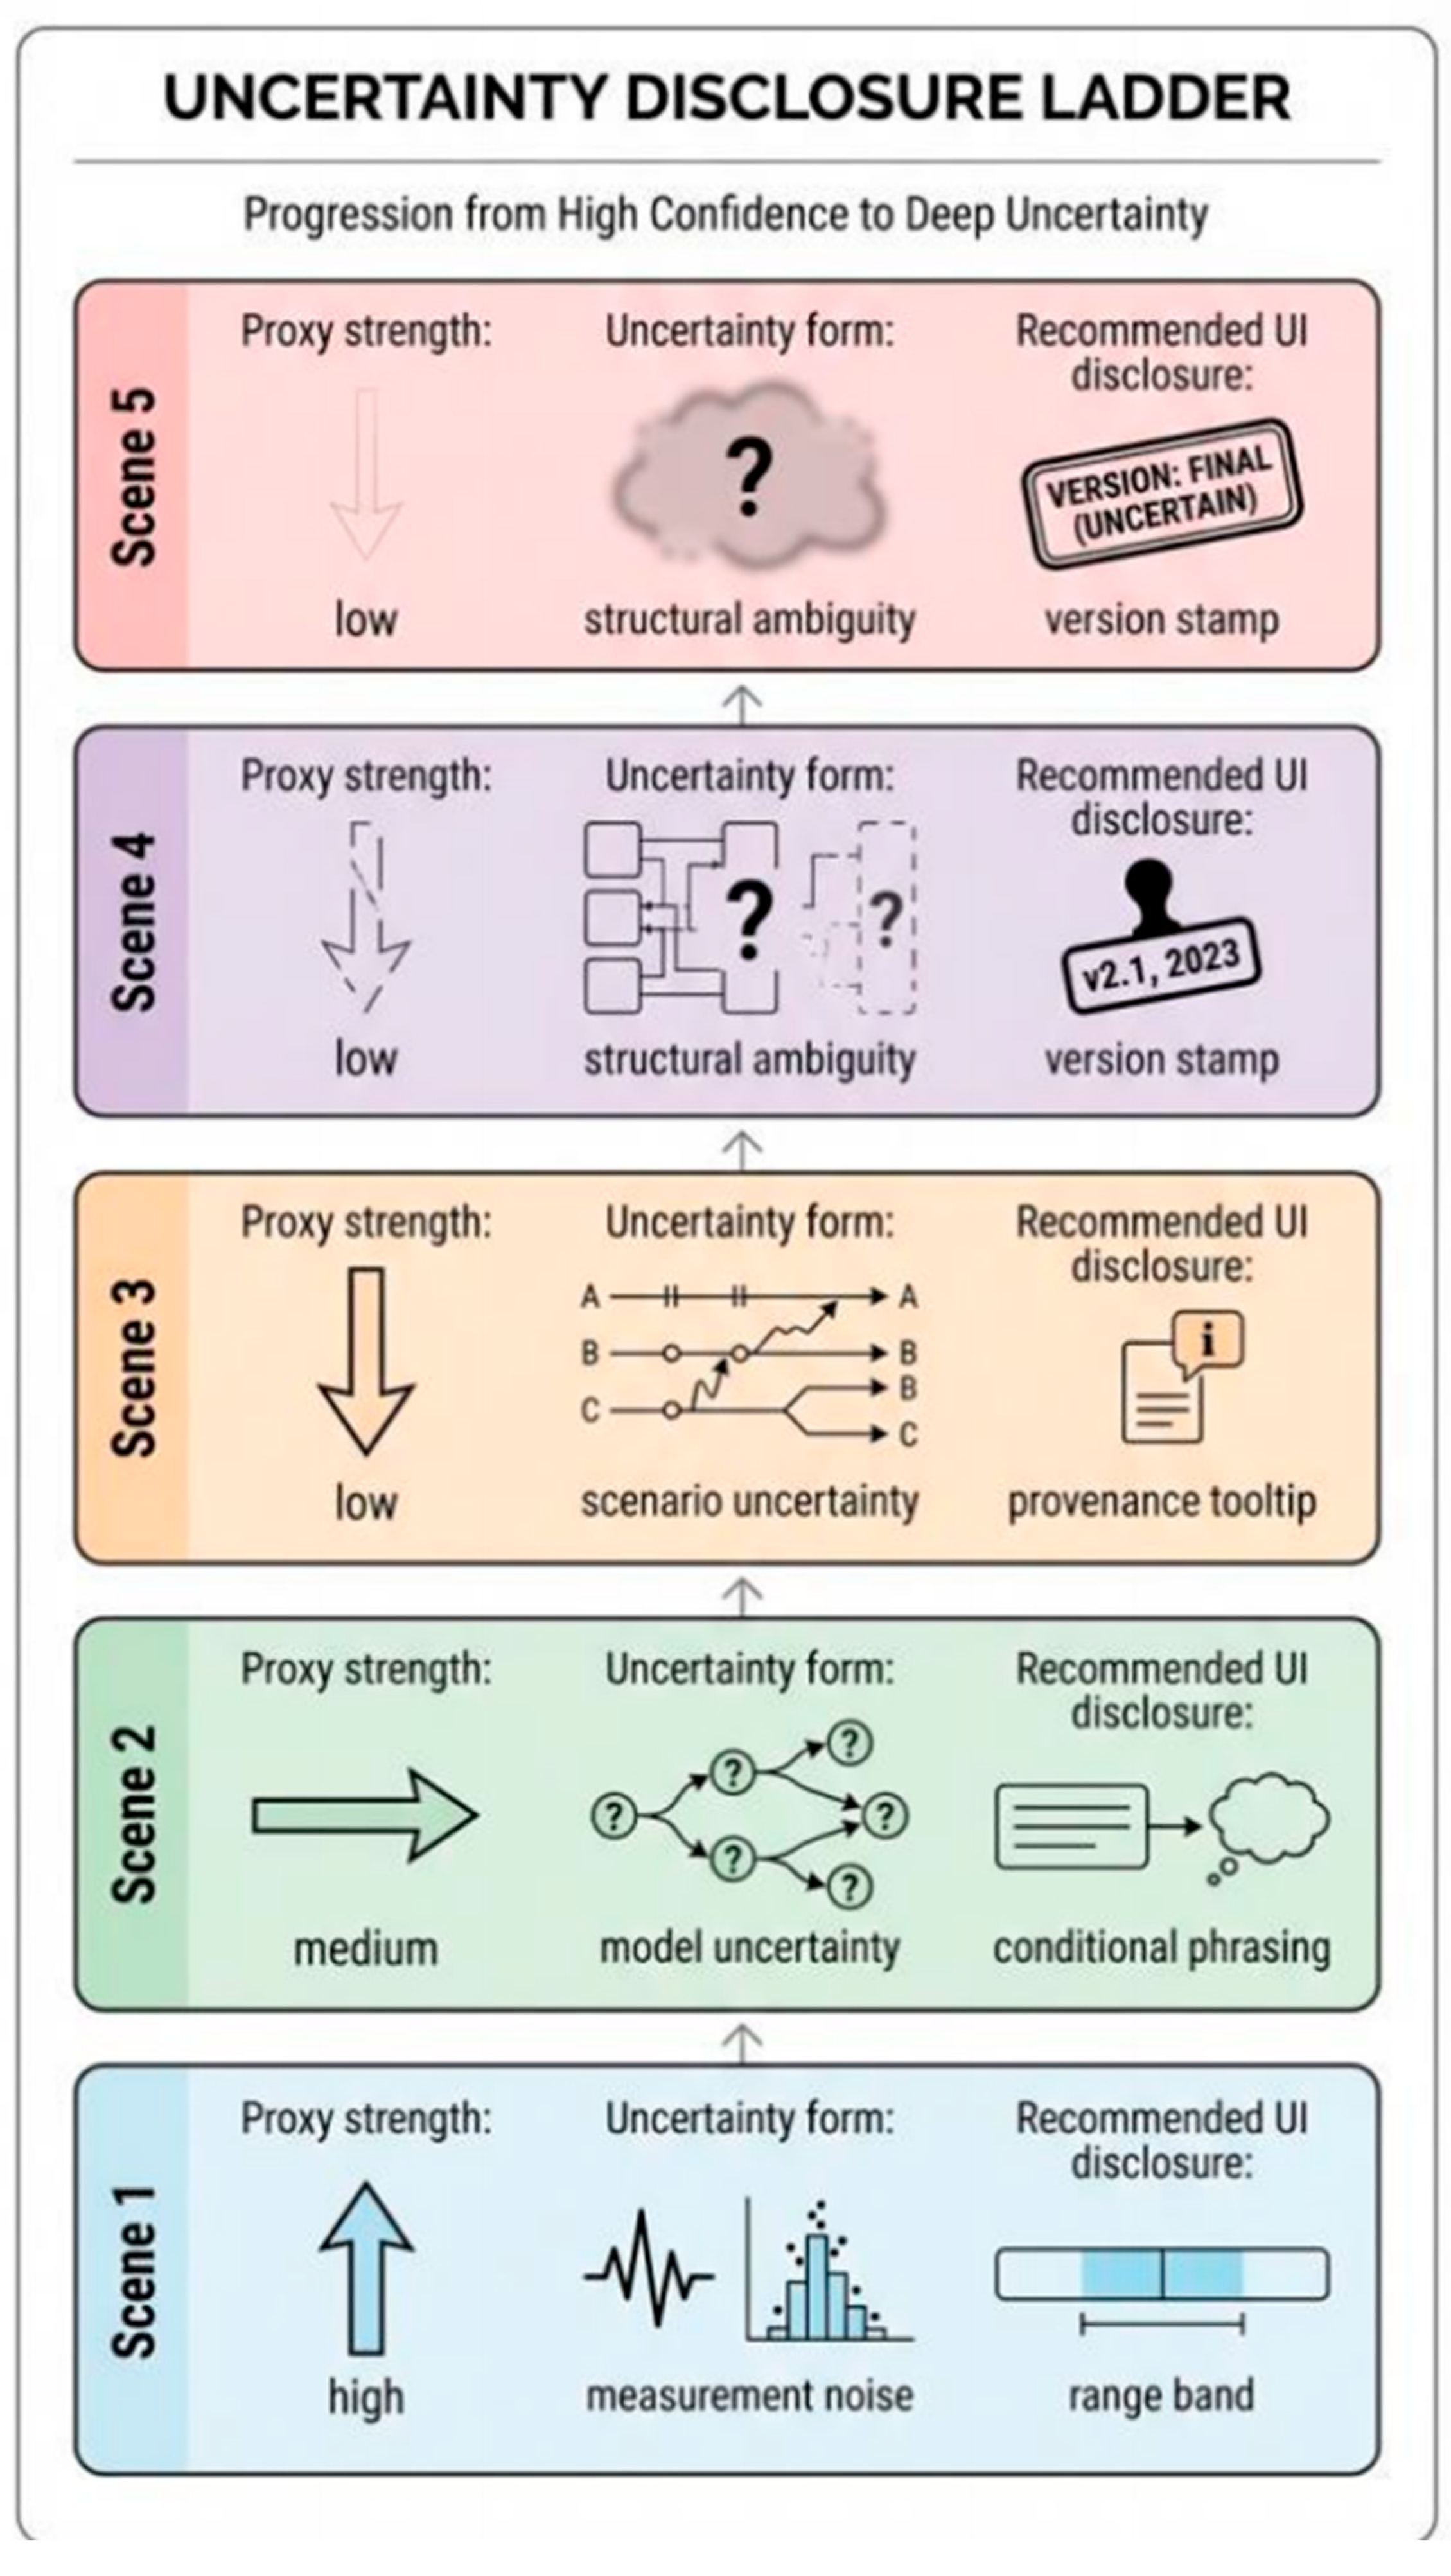
Table 1.
Evidence-to-Interface Translation Matrix.
|
Evidence construct |
Minimal proxy (data- ready) | Visual variables | Interaction grammar |
Intended inference |
Notes (anti- cutesification control) | |
| Deadwood continuity |
Deadwood amount; presence of veteran trees | Orchestra density; missing instruments ; empty stage | Toggle: “Wild” vs “Clean” |
Cleaning subtracts ecological roles, not “waste” |
No villains; subtraction shown as loss of functions | |
| Decay-stage diversity | Decay classes (early–late); microhabitat types |
Texture gradient; dulling; microhabita t icons thinning | Hover compare decay stages |
Loss is reduced functional variety, not only quantity |
No “sad faces” ; information loss = detail loss | |
| Microclimate refuge | Cavity vs ambient temperature delta | Stable pocket vs exposed drift; contrast pocket |
Seasonal slider + hover delta | Refugia buffer extremes conditionall y | No storms; show measurable deltas + uncertainty band | |
| Drought stress | Drought anomaly; dry-days window |
Canopy thinning; bare ground ratio |
Drought level slider | Drying shifts baseline over time |
Avoid disaster montage; continuous gradient only | |
| Coupled pathogen risk | Host stress × vector presence × susceptibility |
Particle haze + threshold band | Toggle stressed host; tooltip “what this means” |
Risk emerges from coupling, not a single cause | Must show uncertainty/threshol d, not horror aesthetics | |
| Fragmentatio n & dispersal |
Patch size; connectivity score |
Floating patches; broken bridges; constrained paths |
Connect/Brea k corridors | Survival depends on connectivity constraints |
Avoid “winning” ; framed as “maintaining options” | |
Table 2.
Scene 1 Specification (Construct-to-Proxy-to-Visual-to-Inference).
| Construct | Minimal proxy | Visual variables | Interaction |
Intended inference |
Output text (micro- claim) |
| Deadwood continuity |
Deadwood volume (m3/ha) | Orchestra density; missing instruments; empty stage |
Toggle: Wild vs Clean |
“Cleaning” removes habitat functions | “Subtraction of deadwood is subtraction of roles.” |
| Decay-stage diversity | Decay-stage richness (0– 4) |
Texture thinning; reduced microhabitat detail | Hover: show decay stages |
Loss is structural variety loss |
“Not less wood only, less variety.” |
| Indicator presence |
Saproxylic indicator richness (count) |
Beetle appearances drop; shorter presence window |
Tap: reveal “who disappears” | Indicators encode continuity | “Absence is evidence.” |
Table 3.
microclimate buffering proxies used in Scene 3 (Winter Refuge) under two management states.
Table 3.
microclimate buffering proxies used in Scene 3 (Winter Refuge) under two management states.
| Microhabitat | ΔT (Winter night) Wild (°C) | ΔT (Winter night) Clean (°C) | ΔRH (Winter night) Wild (%) | ΔRH (Winter night) Clean (%) |
| Tree cavity (wood mould pocket) |
+2.1 | +0.6 | + 18 | +5 |
| Under-bark pocket (thick bark) |
+ 1.6 | +0.4 | + 14 | +4 |
| Log interior (late decay) |
+ 1.0 | +0.2 | + 10 | +3 |
| Exposed surface (no shelter) | +0.0 | +0.0 | +0 | +0 |
Disclaimer/Publisher’s Note: The statements, opinions and data contained in all publications are solely those of the individual author(s) and contributor(s) and not of MDPI and/or the editor(s). MDPI and/or the editor(s) disclaim responsibility for any injury to people or property resulting from any ideas, methods, instructions or products referred to in the content. |
© 2026 by the authors. Licensee MDPI, Basel, Switzerland. This article is an open access article distributed under the terms and conditions of the Creative Commons Attribution (CC BY) license (http://creativecommons.org/licenses/by/4.0/).
Copyright: This open access article is published under a Creative Commons CC BY 4.0 license, which permit the free download, distribution, and reuse, provided that the author and preprint are cited in any reuse.