
Submitted:
13 July 2026
Posted:
14 July 2026
You are already at the latest version
Abstract
Parkinson’s disease is a progressive neurodegenerative disorder in which early and reliable detection remains essential for timely clinical management, patient monitoring, and therapy planning. Although molecular and genetic studies have improved understanding of Parkinson’s disease pathophysiology, there is also a growing need for non-invasive, interpretable, and clinically reliable predictive tools that can support diagnosis using accessible biomedical biomarkers. This study proposes a calibrated and explainable hybrid ensemble framework for Parkinson’s disease detection using two complementary biomedical voice and acoustic feature datasets. The proposed pipeline integrates dataset-specific preprocessing, nonlinear feature engineering, hybrid feature selection, conventional Machine Learning (ML), Deep Learning (DL), and three ensemble strategies, including meta-stacking, hybrid weighted fusion, and cascaded Decision Tree (DT). To enhance clinical reliability, the framework includes Bayesian hyperparameter optimization via Optuna, threshold optimization, statistical significance testing, bootstrap confidence estimation, probability calibration, and other eXplainable Artificial Intelligence (XAI) methods such as SHAP, LIME and permutation importance. The diagnostic performance is observed to be good in a heterogeneous dataset and is demonstrated in the experiment. The Hybrid Ensemble model had an AUC of 0.9924 and an AUPRC of 0.9976 for Dataset 1, and the highest accuracy and F1-score for the Cascaded DL model. The proposed framework showed competitive generalization performance with respect to different acoustic feature distributions on Dataset 2. The explainability analysis also identifies clinically relevant vocal and acoustic features indicative of Parkinson’s Disease (PD) prediction. Altogether, the results highlight the potential of non-invasive voice biomarkers combined with calibrated and interpretable AI models as useful decision-support evidence in screening, early prediction, and future personalized monitoring strategies for PD.
Keywords:
Parkinson’s disease
; neurodegenerative disease
; vocal biomarkers
; acoustic features
; non-invasive diagnosis
; hybrid ensemble learning
; explainable artificial intelligence
; model calibration
; biomedical prediction
; clinical decision support
1. Introduction
Parkinson’s disease (PD) is a progressive neurodegenerative disorder which causes a significant impairment of quality of life in patients due to its impact on motor control, speech production and cognition. Early and accurate diagnosis of PD is crucial because prompt clinical evaluation can aid in monitoring the disease, treatment planning, and tailored approaches. Typical diagnosis methods primarily rely on clinical experience, neurological exam, and the subjective opinion of the doctor, which can cause erroneous diagnosis or inter-observer differences [1,2]. While understanding the genetic, molecular, and pathophysiological mechanisms of PD has improved, there is an increasing need for easily accessible and non-invasive biomarkers that can help in earlier prediction and clinical decision support. Voice and acoustic biomarkers are especially significant because speech difficulties are often found in individuals with PD, and are detectable using non-intrusive, low-cost biomedical signal analysis. In this regard, the development of Machine Learning (ML) and Deep Learning (DL) techniques has recently gained traction as effective tools for automatic PD detection from biomedical voice signals and structured clinical data [3,4,5]. Recently, explainable PD research has also shown how to combine ensemble learning, DT and interpretable AI techniques to support non-invasive diagnosis of PD using vocal biomarkers [6,7].
While these developments are promising, there are still several hurdles to overcome in the quest for clinically usable AI-driven PD prediction tools. Existing studies tend to focus on the accuracy of prediction and only minimally on interpretability, probability calibration, robustness, and statistical reliability. The goal of model-based medical decision support is to generate accurate predictions with reliable confidence intervals and transparent explanations that can be understood by clinical users [8,9]. This need is backed by recent healthcare studies that have employed explainable ensemble learning to build trust, interpretability and reliability for AI-based clinical decision support applications [10]. However, DL models are often overconfident and sensitive to distributional changes, which can restrict their use in real-world biomedical settings [11,12]. Furthermore, tabular healthcare data may be heterogeneous, have nonlinear interactions, and may have relatively small sample sizes, where the advantage of DL models over traditional ML models may not be apparent in structured biomedical prediction tasks [13,14].
Another important limitation is the lack of unified and clinically oriented modeling frameworks for PD prediction. While ensemble learning has been extensively studied to enhance predictive performance in healthcare [15,16], current methods primarily rely on a set of distinct ML and DL models, with limited integration of their complementary strengths into a unified and explainable framework. A recent study of healthcare AI frameworks further underscores the growing significance of hybrid intelligent systems in clinical settings where accuracy, reliability, interpretability, and deployability are all taken into account.Another recent study of healthcare AI frameworks confirms that hybrid intelligent systems are becoming more critical in the clinical setting where accuracy, reliability, interpretability, and deployability all need to be considered together [17,18]. Furthermore, in high dimensional parameter space manual tuning and grid search-based optimization are not always efficient [19]. While Bayesian optimization offers a more efficient alternative to model selection and hyperparameter tuning, it has not been widely leveraged in end-to-end pipelines for healthcare modeling. Moreover, robustness assessment, statistical validation, threshold optimization and calibration are frequently considered as secondary analyses instead of being integrated into the diagnostic framework [20,21].
In addition, the potential of multimodal learning, predictive analytics, secure healthcare systems, and intelligent clinical communication underscores the significance of integrating various data representations and modelling paradigms to enhance diagnostic accuracy [17,18,22,23,24]. This is particularly relevant in PD, as the disease may manifest itself as motoric, speech, cognitive and biological changes. To assess non-invasive voice-based prediction models they should be evaluated not only for classification performance but also their ability to generalize between datasets, offer clinically relevant biomarker level insights, and offer clinically meaningful probability estimates. But, most of the current systems fail to include interpretability, calibration, robustness, statistical validation and optimization in a single framework.
To overcome these constraints, this paper proposes a novel, non-invasive PD prediction framework that leverages the capabilities of calibrated, explainable hybrid ensemble learning with biomedical voice and acoustic biomarkers. The proposed framework combines two complementary PD datasets, preprocessing the datasets individually, nonlinear feature engineering, hybrid feature selection, ML models, DL architectures, and three ensemble strategies. They aim to capture the linear and nonlinear relationships between acoustic and biomedical voice features, and to enhance model stability and generalization for heterogeneous data distributions. In addition, the framework incorporates Bayesian hyperparameter optimization, statistical significance testing, bootstrap confidence estimation, threshold optimization, calibration analysis, and eXplainable Artificial Intelligence (XAI) techniques to strengthen clinical reliability and interpretability. By combining predictive modeling with calibration and explanation, the proposed system provides a clinically relevant decision-support approach for PD screening, early prediction, and future patient-monitoring applications. The main contributions of this work are as follows:
- A novel non-invasive PD prediction framework is proposed using two complementary biomedical voice and acoustic feature datasets to improve model stability and generalization across heterogeneous data distributions.
- A calibrated and explainable hybrid modeling architecture is developed by combining conventional ML models, DT models, and three ensemble strategies, namely meta-stacking, hybrid weighted fusion, and cascaded DT ensemble.
- Bayesian hyperparameter optimization using Optuna is incorporated to efficiently tune model configurations and reduce manual parameter selection bias in the biomedical prediction pipeline.
- A comprehensive clinical reliability evaluation strategy is adopted, including statistical significance testing, bootstrap confidence estimation, threshold optimization, calibration analysis, and robustness assessment.
- XAI techniques, including SHAP, LIME, and permutation importance, are integrated to identify influential voice and acoustic biomarkers and support clinically interpretable decision-making.
2. Related Work
The section gives a systematic review of the research that has been published in the four major categories: (i) ML-based detection of Parkinson disease, (ii) tabular DL and ensemble learning, (iii) explainability and calibration in medical AI, and (iv) optimization and robustness in medical systems.
2.1. Parkinson’s Disease Detection Using ML
Parkinson disease detection has extensively been done using ML techniques especially through speech and biomedical signals. The review by Rao et al. [2] has shown that ML models are useful in the capture of vocal biomarkers of PD. In the same spirit, Kim et al. [3] have suggested a DL model, which is highly performative as it predicts nonlinear voice signal dependencies. Rao et al. [4] also placed a strong emphasis on the role of feature extraction of speech signals in the correct classification of diseases. Other more recent studies have been on hybrid and ensemble methods. Rahman et al. [1] emphasized the use of AI to detect PD at an early stage, whereas Motamedi et al. [25] presented an optimized feature selection and ensemble learning model with a better predictive performance. Sedigh Malekroodi et al. [26] further reviewed voice-based PD detection using ML and DL approaches, confirming the growing importance of acoustic biomarkers in non-invasive diagnosis. Xu et al. [27] also developed an interpretable speech-analysis-based model for non-invasive PD detection, showing that speech features can support reliable and explainable diagnosis. These methods show the possibility of integrating several models; yet, they are frequently not calibrated, interpretable, and statistically validated.
2.2. Tabular DL and Ensemble Methods
DL with tabular healthcare data is a developing field of research. A recent benchmark study by Wang et al. [5] demonstrated that the traditional ML models tend to be more effective on structured datasets than DL. The next research by Wang et al. [13] explored the opportunities and challenges of applying DL to healthcare tabular data, noting challenges in feature representation and model generalization. Recently, there are proposals of transformer-based models to handle these challenges. Siebra et al. [28] and Zhao et al. [14] showed that attention mechanisms can be useful to model feature interactions in tabular data. Also, ensemble learning methods have been thoroughly investigated, as the model by Zhou et al. [15] and Liu et al. [16] demonstrate that ensemble models are much better predictors in healthcare settings. Further, Ahmed et al. [29] and Zhou et al. [30] have highlighted the power of boosting algorithms in medical data analysis. Nonetheless, the majority of the literature lacks a combination of DL and ensemble strategies into a single system.
2.3. Explainability, Calibration, and Reliability in Medical AI
The ability to explain and be reliable are key to the deployment of AI systems in clinical settings. Chen et al. [8] gave an extensive overview of XAI methods in healthcare, highlighting the significance of transparency in clinical decision-making. The value of explainable models in enhancing trust and interpretability was further demonstrated by Khan et al. [9].Similarly, Egbo et al. [31] applied explainable ML to vocal biomarkers for early PD detection, highlighting the importance of transparent predictions in aging populations. Calibration methods have a long history of investigation in order to enhance predictive probabilities. As demonstrated by Singh et al. [20], calibration plays an important role in increasing model reliability. Nevertheless, DL models tend to be overconfident and vulnerable to changes in the data distribution [11]. Recent studies on uncertainty quantification [12,32] suggest the importance of incorporating reliability metrics into AI pipelines. To gain a deeper understanding of model decision-making, Jin et al. [33] applied feature-attribution techniques to predict the severity of PD, further recognizing the potential of interpretable ML in enhancing clinical decision-making. Umar et al. [21] also pointed out that the clinical AI systems should be robust and calibrated to ensure their safe deployment.
2.4. Optimization, Robustness, and Advanced Healthcare AI
To create trustworthy healthcare AI systems, efficient optimization and robustness are crucial. The idea of Bayesian optimization using optuna has been proposed as an alternative to the traditional methods for hyperparameter tuning [19]. Gao et al. [22] were involved with the application of multimodal DL Models to improve clinical prediction performance, while Yi et al. [34] were involved with manifold learning as a means to learn complex data structures.
Other recent works have investigated further AI uses in healthcare, such as predictive analytics and multimodal learning [23,24]. Mehta et al. [35] proposed a multimodal XAI framework for interpretable PD prediction, showing that combining multiple data sources with XAI can improve diagnostic transparency. Moreover, AI systems and frameworks have been suggested to be applied in healthcare on a large scale, with a particular focus on reliability, scalability and standardization in clinical AI systems [36,37,38]. Nevertheless, these methods tend to concentrate on the individual features like robustness or optimization, without carrying them on to an overall predictive framework. subsectionComparison with Existing Work
As summarized in Table 1, current research is mostly focused on improvements in terms of prediction performance, DL or ensemble learning. But they fail to provide a holistic approach that combines hybrid modeling, calibration, statistical validation and explainability. Additionally, few studies include Bayesian optimization and robustness analysis in their pipeline for detecting PD. Addressing these challenges, we propose a new framework that integrates all these key elements into a clinically deployable system.
3. Methodology
This study proposes a multi-stage dual-dataset framework for non-invasive PD prediction using biomedical voice and acoustic biomarkers. The framework combines statistical analysis, dataset-specific preprocessing, feature engineering, hybrid feature selection, ensemble learning, statistical validation, probability calibration, and XAI. The main objective is to enhance the robustness, interpretability, and generalization of AI-assisted PD prediction by integrating two complementary datasets within a clinically oriented modular pipeline. The complete workflow is illustrated in Figure 1.
The pipeline starts with two datasets having complementary voice and acoustic feature characteristics, followed by exploratory analysis to examine class distribution, feature correlations, statistical properties, and biomarker-level separability. Preprocessing is tailored to the structure of each dataset: Dataset 1 is cleaned, transformed, scaled, and balanced because it is imbalanced, whereas Dataset 2 is not resampled in order to preserve its temporal and subject-level acoustic structure. After preprocessing, feature engineering and hybrid feature selection are performed to obtain a compact and informative biomarker representation. Dataset 1 is evaluated using stratified splitting and cross-validation, while Dataset 2 is evaluated through subject-wise splitting to reduce the risk of information leakage across repeated recordings. The modeling stage includes conventional ML models, DL models, and three proposed ensemble models, followed by threshold optimization, probability calibration, and interpretability analysis to support clinically reliable decision-making. The pipeline follows a structured sequence:
where = datasets, = exploratory biomarker analysis, = preprocessing, = feature engineering/selection, = data splitting, = predictive modeling, = optimization/calibration, and = interpretability.
Algorithm 1 presents the complete dual-dataset learning workflow in a compact mathematical form. The framework receives two heterogeneous PD datasets as input and applies dataset-specific preprocessing to support reliable non-invasive prediction from voice and acoustic biomarkers. Dataset 1 is processed using IQR clipping, Yeo–Johnson transformation, scaling, and SMOTE–Tomek balancing, while Dataset 2 is preserved through subject-wise handling to reduce leakage risk and maintain its natural acoustic variability. The processed features are then enriched through nonlinear interaction terms and MFCC-based temporal acoustic representations, followed by hybrid feature selection using filter, embedded, and wrapper-based strategies.
| Algorithm 1:Workflow of the Proposed Non-Invasive PD Prediction Framework. |
|
The selected biomarker feature subset is used to train a candidate model pool across K validation folds, and the resulting prediction scores are fused through meta-stacking, hybrid weighted fusion, and cascaded ensemble learning. The final stage applies Youden-index threshold optimization, probability calibration, and explainability analysis using SHAP, LIME, and permutation importance. These steps are included to make the framework not only accurate but also clinically interpretable and reliable for PD screening and decision-support applications. From a computational perspective, preprocessing requires approximately time, while interaction-based feature construction may reach depending on the number of generated feature combinations. The dominant cost arises from cross-validated model training and wrapper-based feature selection, which can be expressed as , where denotes the training cost of model . The overall space complexity is approximately , covering the original feature matrix, selected feature representation, and learned model parameters. Thus, the proposed framework remains computationally manageable while improving robustness, calibration, and interpretability for non-invasive biomedical PD prediction.
3.1. Datasets Description
In this research, two PD datasets are used to improve model stability and generalization. Dataset 1 includes 195 samples and 22 biomedical voice features derived from sustained phonation. These include jitter, shimmer, harmonic-to-noise ratio (HNR), and nonlinear dynamical measurements such as RPDE and D2. This dataset is naturally imbalanced, with 147 healthy control samples and 48 Parkinson’s disease samples, and therefore requires class-balancing during preprocessing. Dataset 2 is a balanced dataset of 240 samples with 44 acoustic features based on Mel-Frequency Cepstral Coefficients (MFCCs) and their temporal derivatives. In contrast to Dataset 1, Dataset 2 contains repeated measurements for each subject, which allows intra-subject variability to be preserved. Therefore, no resampling is performed on Dataset 2, and subject-wise splitting is used during evaluation.
3.2. Exploratory Data Analysis
Exploratory Data Analysis (EDA) is performed to examine the statistical characteristics, feature distributions, feature correlations, and class separability of the biomedical voice and acoustic datasets.The final stage implements the explainability analysis via permutation importance, LIME and probability calibration of a Youden-index threshold optimization. The steps are incorporated to ensure the framework is accurate, clinically interpretable, and reliable for screening and decision support for PD applications.
The computational cost for preprocessing is , and is possible for the processing of features from interactions (depending on the number of combinations created). The most prominent cost comes from training the cross-validated models and from using a wrapper to select features, and can be written as , where represents the training cost of model . The total space complexity for the entire system is roughly , which includes the feature matrix, the feature representation, and the learned model parameters. Therefore, the proposed framework is still computationally tractable and robust, calibrated and interpretable for the prediction of non-invasive biomedical PD.
This analysis gives an initial idea of the patterns in the biomarkers that are related to PD and informs the next step in the pre-processing and feature selection process. The results of the correlation analysis in Dataset 1 shows that some acoustic biomarkers are redundant, particularly the measurements relating to jitter and shimmer. Such a redundancy drives us towards incorporating hybrid feature selection in the subsequent stages to keep clinically meaningful predictors and remove the redundant information with features. The presence of multicollinearity in a model mathematically can be represented by:
where is a redundant feature and is residual noise.
3.3. Preprocessing Pipeline
Preprocessing is performed to boost the reliability of non-invasive prediction of PD by minimizing the influence of outliers, skewness, scale difference and class imbalance. The preprocessing strategy is not fixed, because the two datasets have different sample distribution and structure of acoustic features. A conservative interquartile range clipping approach is used to stabilize the data in Dataset 1. Samples are not deleted; instead, feature values are clipped to a safe range:
This preserves the small sample size while reducing the influence of extreme acoustic values that may affect model stability. After outlier clipping, the Yeo–Johnson power transformation is applied to reduce skewness and improve the conditioning of the biomarker feature space:
where is estimated through maximum likelihood. The transformed features are then scaled before model training to ensure that all acoustic and biomedical voice features contribute comparably to the learning process. Since Dataset 1 has a strong class imbalance, SMOTE and Tomek Links are combined to increase minority-class representation and refine class boundaries:
SMOTE generates synthetic minority samples as:
where is a minority sample and is one of its nearest minority-class neighbors. Tomek Links are then used to remove borderline or overlapping samples. Dataset 2, on the other hand, is balanced and includes repeated subject recordings; hence, no resampling is performed to maintain its natural temporal acoustic variability and statistical integrity.
3.4. Feature Engineering and Selection
Feature engineering is used to improve the representational power of the biomarker feature space and to include nonlinear physiological interactions associated with Parkinsonian speech. For Dataset 1, interaction features are generated from the original acoustic variables, including ratio-based and multiplicative combinations such as jitter–shimmer interaction, NHR–RPDE interaction, spread-based interaction, and PPE–D2 interaction. These interactions are included because vocal impairment in PD may be reflected through combined changes in perturbation, noise, and nonlinear speech dynamics. The generalized interaction form is:
where represents a nonlinear operation such as multiplication or division. For Dataset 2, feature representation is based on MFCCs and their first- and second-order temporal derivatives:
where represents the static spectral coefficients, captures the rate of change, and represents acceleration. This representation allows the model to capture both spectral and temporal characteristics of speech, which are relevant for non-invasive PD prediction. A hybrid feature selection strategy is then used to reduce redundancy and retain the most informative acoustic and biomedical voice predictors. Mutual Information (MI) is used as the initial filter-based method to capture nonlinear dependency between each feature and the target:
where higher MI values indicate stronger relevance to the target class.
Since MI alone does not fully address multicollinearity and model-specific feature importance, consensus selection is performed using LASSO, Elastic Net, and Recursive Feature Elimination with Cross-Validation (RFECV). LASSO can induce sparsity, Elastic Net can enhance the stability when features are correlated, and RFECV can identify the model-dependent features’ relevance. The output of the three methods is combined to get the final selected feature subset:
This union-based approach avoids the early removal of potentially informative biomarkers while producing a compact and stable feature space for clinically reliable prediction.
3.5. Data Splitting
Depending on the nature of each data set, there are two different data splitting strategies. In the case of Dataset 1, the approach of 70/30 stratified train-test split is taken to maintain the class distribution:
Furthermore, K-fold cross validation is employed to decrease the variance in the estimates of performance:
where is the loss or evaluation function for the i-th fold. To prevent information leakage from repeated measurements of the same subject, the data is split into different subjects when creating Dataset 2. Any recordings taken within the same subject are allocated either to the training set or the testing set to ensure that the assessment is generalized across subject. Separation is especially critical for biomedical voice analysis when the same person records several times, as repeated recordings may contain acoustic structures that can be misleading if they are not separated correctly, leading to artificial performance.
3.6. Modeling Framework
In the modeling phase, the traditional ML models, the DL models and the proposed ensemble models are integrated to construct a powerful non-invasive PD prediction system. The general predictive formulation is defined as:
where X is the feature set selected by and the are the model parameters learnt at the time of training. The baseline models include Logistic Regression (LR), Naive Bayes (NB), Decision Tree (DT), Random Forest (RF), Gradient Boosting (GB), XGBoost, LightGBM, CatBoost, SVM-RBF, KNN, and MLP. These models are presented as baseline models for comparison: linear classification, probability model, tree, boosting, kernel, and neural. Three DL models are also included: TabNet, 1D-CNN and FT-Transformer. For attention-based tabular learning, we use TabNet, local feature interactions are learnt by 1D-CNN, and global feature dependencies are learnt by FT-Transformer.
3.7. Proposed Ensemble Models
Three proposed ensemble strategies are used to exploit the complementary strengths of ML and DL models and to improve predictive stability across heterogeneous biomedical voice datasets.
- 1.
- Meta-Stacking: The first proposed model combines probability outputs from multiple base learners using a meta-classifier:where represents the probability output of the i-th base model and are learned weights. LR is used as the meta-learner to produce the final PD prediction.
- 2.
- Hybrid Weighted Ensemble: The second proposed model integrates both ML and DL outputs using weighted fusion:where , , , and correspond to RF, TabNet, Transformer, and CNN predictions, respectively. The weights control the contribution of each model. This fusion strategy is designed to combine the stability of conventional ML models with the representation-learning ability of DL models.
- 3.
-
Cascaded DL Ensemble: The third proposed model uses DL predictions as additional features:This design captures both agreement and disagreement between DL models. The absolute difference term represents prediction uncertainty and helps the final CatBoost classifier refine the decision for more reliable PD screening.
3.8. Threshold Optimization, Calibration and Interpretability
Instead of using a fixed threshold of 0.5, an optimal threshold is calculated using the Youden Index:
This is important in medical diagnosis because false negatives can be more serious than false positives, particularly when the model is intended to support early PD screening or referral decisions. Calibration analysis is performed to ensure that predicted probabilities reflect true likelihoods. The Brier Score is computed as:
and Expected Calibration Error (ECE) is computed as:
where denotes the k-th confidence bin. Finally, SHAP, LIME, and permutation importance are applied to interpret the contribution of selected voice and acoustic biomarkers. These explainability methods improve clinical transparency by identifying which features most strongly influence the model’s PD prediction, thereby supporting interpretable decision-making and future biomarker-focused analysis.
4. Experimental Setup
All the experiments were implemented in Google Colab Pro that provides the access to the high-performance resources based on the GPU that are applicable to ML and DL-based biomedical analysis. Experimental environment was set up with an NVIDIA Tesla T4/A100 with CUDA acceleration-enabled GPU to ensure effective training of transformer-based and neural models. The whole pipeline was written in Python, with PyTorch to do DL models and Scikit-learn to do classical ML algorithms. The suggested dual-dataset model was tested in a controlled and reproducible environment. Dataset 1 (imbalanced biomedical voice dataset) was split with a stratified 70:30 train-test split to maintain the class distribution whereas Dataset 2 (balanced multi-recording dataset) was split with a subject-wise approach to avoid data leakage between patient recordings. All preprocessing procedures, such as IQR-based clipping, Yeo-Johnson transformation, and SMOTETomek resampling were carried out on the training set and only transferred to the test set so that the integrity of evaluation is preserved.
The feature engineering and feature selection were conducted before model training, including interaction-based features, and consensus-based feature selection (Mutual Information, LASSO, Elastic Net, RFECV). Training of all models was done under the same conditions with cross-validation to provide fair comparison. Besides the standard evaluation, statistical significance testing (McNemar, Wilcoxon, DeLong), threshold optimization (Youden Index), and calibration analysis (ECE, Brier Score) were conducted, to test robustness and clinical reliability. The Adam optimizer was used and trained on DL models (TabNet, CNN, Transformer) with early stopping determined by validation loss to avoid overfitting. The stacking, weighted fusion, and cascaded architectures were used to create ensemble models, which combine the predictions of both ML and DL models. All tests were done with the same software and hardware settings so that it could be reproducible and comparative across all models. The detailed implementation environment, training configuration, and hyperparameters are summarized in Table 2.
5. Results
This section evaluates the proposed framework for the non-invasive prediction of PD in an experimental setting, with the help of two complementary biomedical voice and acoustic datasets. The analysis is divided into three parts: baseline ML, DL, and the proposed ensemble models. Several clinically relevant parameters such as AUC, accuracy, precision, recall, F1 score, specificity, and AUPRC are used to evaluate the performance. These measures give a complete picture of diagnostic discrimination, of the sensitivity for PD cases, of false-positive control, and of reliability for potential clinical decision-support applications.
5.1. Performance of Baseline ML Models on Dataset 1 and Dataset 2
The performance of the basic ML models, test sets 1 and 2 is presented in Table 3. On Dataset 1, the ensemble-based boosting algorithms perform well, demonstrating their ability to uncover non-linear relationships among the biomedical voice and acoustic biomarkers. LightGBM has the best AUC (i.e., 0.9788) and AUPRC (i.e., 0.9923) of all the baseline ML models, indicating excellent discrimination for vocal patterns associated with PD. Other gradient-boosting algorithms, such as CatBoost and XGBoost, do well, too, emphasizing the applicability of the gradient-boosting technique to structured biomedical prediction problems. The performance of the conventional models (LR and NB) is comparatively low on Dataset 1, because they are not very good at handling the complex nonlinear interactions between the acoustic features.
LR has the best AUC (i.e., 0.9425) for the Dataset 2 as it is balanced and structured. Tree-based methods like RF, XGBoost, LightGBM and GB also perform well with respect to recall, which is relevant in the context of reducing the number of PD cases that are missed in screening environments. In some models, however, there is a trade-off between sensitivity and specificity, emphasizing the need to consider positive case detection as well as the number of false positive controls. Overall, the results showed that the structure of the datasets, the distribution of features, and the distribution of classes are important factors affecting model behavior, therefore, evaluation of non-invasive PD prediction should be done in a dual-dataset manner.
5.2. Performance of DL Models
Table 4 provides the results of the DL models on the two datasets. On the dataset 1, the DL models outperform many of the baseline ML models. ResCNN shows the best result for both AUC (i.e., 0.9894) and AUPRC (i.e., 0.9966) indicating that convolutional models are suitable for learning local interactions and hierarchical features from the engineered acoustic biomarkers. Similarly, the TabTransformer exhibits solid performance, suggesting that attention models can capture global interactions between voice features. TabNet doesn’t perform as well as ResCNN and TabTransformer, but it is still useful as its attention based feature selection mechanism can be used to support model interpretability.
On Dataset 2, DL models show comparatively lower performance than on Dataset 1. This may be because the handcrafted acoustic features in Dataset 2 already contain strong discriminative information, reducing the additional benefit of representation learning. Nevertheless, ResCNN achieves high recall, indicating that it is effective in identifying PD-positive cases. This is clinically important because high recall can help reduce missed cases during preliminary screening, although the lower specificity indicates a higher tendency toward false-positive predictions.
5.3. Performance of Proposed Ensemble Models
The performance of the proposed ensemble models across both datasets is summarized in Table 5. On Dataset 1, the Hybrid Ensemble achieves the strongest discriminative performance, with an AUC of 0.9924 and an AUPRC of 0.9976. This indicates that combining ML and DL outputs can improve the detection of PD-related acoustic patterns by integrating complementary decision information. The Cascaded DL2 model achieves the highest accuracy (0.9322) and F1-score (0.9556) among the proposed models on Dataset 1, suggesting an improved balance between sensitivity and specificity. Meta-Stacking also demonstrates strong recall and F1-score, confirming that prediction-level fusion can improve model stability.
On Dataset 2, the proposed ensemble models remain competitive across evaluation metrics. The Hybrid Ensemble achieves the highest AUC among the proposed ensemble models, while Meta-Stacking achieves the highest accuracy and specificity within the proposed group. Although LR shows a slightly higher AUC among all models on Dataset 2, the proposed ensemble approaches provide a stronger integrated framework because they combine prediction performance with calibration, interpretability, and methodological robustness. These results suggest that the proposed ensemble strategies are particularly beneficial for heterogeneous and nonlinear datasets, while still maintaining generalization ability on more structured acoustic datasets.
5.4. Comparison with State-of-the-Art Methods
To further evaluate the effectiveness of the proposed framework, the proposed models are compared with recent state-of-the-art studies on PD detection and prediction that reported quantitative performance measures. Since existing studies use different datasets, validation protocols, feature sets, and model configurations, this comparison should be interpreted as a general methodological and performance-oriented comparison rather than a direct dataset-equivalent benchmark. The comparison includes standard predictive metrics, such as accuracy, AUC, recall, F1-score, and AUPRC, as well as clinically important methodological components, including explainability, calibration, statistical validation, ablation analysis, and optimization.
As shown in Table 6, previous studies have contributed valuable ML-, DL-, ensemble-, and interpretable-learning approaches for PD detection. However, many of them focus mainly on predictive performance and do not simultaneously include calibration, explainability, statistical validation, ablation analysis, and optimization. The proposed Hybrid Ensemble achieves the highest discriminative performance on Dataset 1, with an AUC of 0.9924 and an AUPRC of 0.9976, while the proposed Cascaded DL2 model achieves the highest accuracy and F1-score among the proposed Dataset 1 models. More importantly, the proposed framework provides a more complete clinical reliability pipeline by integrating XAI, probability calibration, statistical validation, ablation analysis, and Bayesian optimization. This makes the framework more suitable for non-invasive PD screening and decision-support scenarios than models evaluated only through conventional performance metrics.
5.5. ROC, AUC, and Precision–Recall Analysis
Receiver Operating Characteristic (ROC) curves, AUC comparisons, and Precision–Recall (PR) curves are examined to assess model discrimination across different decision thresholds. These analyses are of critical importance for biomedical prediction as a clinically useful PD screening model needs to be sensitive and reduce the number of false positive cases. The ROC curves for the different models tested on Dataset 1 are displayed in Figure 2. The proposed Hybrid Ensemble has the most desirable ROC region, with its curve getting closer to the top left corner. This suggests a good discrimination between PD and non-PD cases, with high true positive rate and low false positive rate. The ROC curve also demonstrates high convexity in DL models, like ResCNN and TabTransformer, showing their ability to learn complex nonlinear acoustic patterns. The simpler models are closer to the diagonal reference line and exhibit less class separability, such as NB and DT.
AUC comparison for Dataset 1 is quantitatively shown in Figure 3. The Hybrid Ensemble obtains the best AUC score of 0.992 followed by ResCNN (0.989) and TabTransformer (0.982). This reflects the benefit of using hybrid and DL-based methods in modelling complex biomedical features of speech. The boosted models like LightGBM also yield good performance (i.e., AUC > 0.97), further validating the usefulness of nonlinear learning approaches in acoustic biomarker-based prediction of PD. The PR curves of Dataset 1 is depicted in Figure 4. The Hybrid Ensemble is highly accurate over a broad recall range of the cases, which means it is able to identify PD cases and avoid false alerts. This balance is clinically relevant as it includes a reduction in missed PD cases with high recall and avoids unnecessary follow-up testing with high precision.
The combined ROC, AUC and PR analysis for Dataset 2 is displayed in Figure 5. The ROC curves are more compressed as compared to Dataset 1, meaning that a number of models perform within a narrower range. LR performs the best on Dataset 2, which indicates a more linear separable structure in the dataset. However, the Hybrid Ensemble still performs well, and has the best AUC of all the ensemble models proposed. The PR curves indicate that the majority of models achieve high recall but with different levels of precision. The results show that the proposed ensemble models yield consistent and clinically relevant prediction performance for different acoustic data distributions and that the complex nonlinear models used for Dataset 2 do not improve the prediction performance.
5.6. Confusion Matrix Analysis
Beyond the overall prediction performance, the confusion matrices are explored to analyse the behaviour of the prediction classes. This analysis is pertinent to PD screening as false negatives are undetected PD cases, and false positives could cause clinical follow-up. Hence, the sensitivity/specificity issue is crucial to examine the clinical usefulness of the proposed framework. The confusion matrices of DL and proposed ensemble models for Dataset 1 are depicted in Figure 6. The results indicate a significant improvement in the results when using a hybrid ensemble-based DL model over a standalone DL model. TabNet is less sensitive and has a higher number of false negatives, implying that it is less suited to account for more complex nonlinear interactions in acoustic data. To validate its capacity to learn discriminative acoustic patterns, ResCNN achieves 41 true positives and 3 false negatives, thus revealing a significant boost in sensitivity. TabTransformer offers high sensitivity and minimal misclassification, too.
Meta-Stacking is proposed, having shown to have a high sensitivity and only a single false negative, but with a somewhat reduced specificity, which means it is prone to over-prediction on the PD class. In the Hybrid Ensemble only 1 false positive and 1 false negative are present, which is the best clinically. This means that the decision-boundary is well calibrated and class-wise predictions are well balanced. Cascaded DL2 is also a good performer, achieving high sensitivity and an increased level of specificity over Meta-Stacking. Minimisation of the false negative is particularly important in early PD screening as this can delay clinical assessment. Thus, the Hybrid Ensemble and Cascaded DL2 models have demonstrated good prospects for support in the area of non-invasive PD detection.
The confusion matrices are shown on Figure 7 for Dataset 2. The performance of the models is more comparable across the classes for Dataset 2, which is more balanced and structured than Dataset 1. As for DL models, TabNet has moderate sensitivity and specificity, and ResCNN has very high sensitivity (32 true positives, 1 false negative). But ResCNN also has more false positives, resulting in a lower specificity. TabTransformer offers a better balance between the two classes.
The ensemble models proposed in this study show the highest specificity and correctly classify a high proportion of healthy cases, albeit with a small decrease in sensitivity. The Hybrid Ensemble offers a good compromise when screening, with almost optimal sensitivity at the cost of a single false negative and reasonable specificity. The errors are also more evenly distributed across classes for cascaded DL2. The results suggest that the proposed ensemble models can help to decrease the number of missed PD cases while keeping a reasonable false-positive control rate. These results indicate that the joint use of ML and DL representations is a robust yet clinically meaningful approach toward non-invasive prediction of PD.
5.7. Ablation Study
An ablation study is performed to assess the contribution of the various elements in the proposed non-invasive PD prediction system. They evaluate six important factors, namely preprocessing, feature selection, model configuration, ensemble composition, sample efficiency and dealing with class imbalance. This evaluation is crucial to ascertain if the observed performance is attributed to the integrated pipeline or more to one component in the pipeline.
5.7.1. Preprocessing and Feature Selection Ablation
The effect of various data preparation methods on the model performance is assessed in the pre-processing ablation. Clipping the outliers reduces performance significantly, as seen in Figure 8 which has an AUC of 0.8962. This indicates that extreme values in the acoustic parameters can have a negative impact on the generaliability of the model, especially in small biomedical datasets. Similarly, replacing the Yeo-Johnson power transformation with MinMax scaling reduces performance to an AUC of 0.9061, indicating that distribution stabilization is useful for improving the conditioning of biomedical voice features. Although the full preprocessing pipeline achieves an AUC of 0.9235 and is slightly lower than some simplified variants, it provides a more stable and clinically reliable processing strategy across heterogeneous data conditions. Therefore, the complete pipeline is retained to support robustness rather than optimizing only a single isolated metric.
The feature selection ablation is presented in Figure 9. Elastic Net achieves the highest AUC of 0.9265, slightly outperforming LASSO. This indicates that Elastic Net provides a useful balance between sparsity and stability when acoustic biomarkers are correlated. Simple ranking or wrapper-only approaches seem to be not sufficient to take into account complex feature interactions, as the recursive feature elimination and mutual information perform comparatively poorly. The substantial difference between no feature selection and advanced feature selection techniques suggests that the dataset has relatively few features and that the existing features are informative enough. However, the fact that Elastic Net and consensus-based feature selection can be useful is worth noting because they decrease redundancy and stabilize the amount of features selected for the biomarker representation.
5.7.2. Random Forest Hyperparameter Ablation
The ablation of the hyperparameters for the RF in shown in Figure 10, Figure 11 and Figure 12. There is a definite impact on performance from the number of estimators. The best results are noted with a smaller to moderate number of trees (roughly 10 to 100) with an AUC of 0.938. Adding more trees beyond this point does not lead to better performance, and may lead to a slight decline, indicating that improvements become less and less but may be overfitting a small biomedical dataset. In the maximum depth analysis in Figure 11 it is seen that shallow trees (such as depth = 2) underfit the data resulting in less performance (i.e., AUC = 0.86). Performance stabilizes when the depth is increased to a moderate range, approximately between 6 and 10. This suggests that moderate tree complexity is sufficient to capture meaningful acoustic biomarker patterns without excessive overfitting. The max_features analysis in Figure 12 shows only minor variation across configurations, indicating that the model is relatively robust to feature subsampling. The best performance is observed near fractional values around 0.3, suggesting that controlled randomness can support better generalization.
5.7.3. Ensemble Components Ablation
The ensemble component ablation, shown in Figure 13, evaluates the contribution of individual learners within the proposed ensemble architectures. For the Meta-Stacking model, removing SVM improves performance, suggesting that this component may introduce redundant or overlapping decision boundaries. In contrast, removing CatBoost causes a clear reduction in performance, indicating that CatBoost contributes strongly to the ensemble decision process.
For the Hybrid Ensemble model, both CNN and Transformer components are important because their removal leads to performance degradation. The full Hybrid Ensemble achieves the highest AUC of 0.9924, confirming that combining ML and DL outputs provides synergistic performance gains. For the Cascaded DL2 model, the architecture remains relatively robust when some components are removed; however, removing the CNN branch reduces performance, indicating that convolutional representations are important for capturing discriminative acoustic patterns. The RF gating mechanism also contributes positively by refining the final decision process.
5.7.4. Sample Efficiency Ablation
The sample efficiency analysis of Figure 14 examines the performance of the proposed model with varying sizes of training data. The proposed model consistently outperforms the baseline model irrespective of data availability. The performance is reasonably stable in lower data settings (i.e., 20–40% of the training samples), showing that the proposed framework is able to generalize even when limited biomedical samples are available. The larger the training set, the closer the proposed model gets to the near optimal performance, with respect to the AUC value, achieving an AUC of 0.99 at 80% of the training set. This means that the framework is able to accommodate extra data without overfitting well. The findings have implications for clinical AI development as biomedical data sets are typically small, particularly for voice and acoustic data of disease-specific recordings.
5.7.5. Class Imbalance Strategy Ablation
The imbalance analysis for the class is presented in Figure 15. For both baseline and proposed models, the largest AUCs are obtained by ADASYN, which is the best among the tested imbalance handling strategies. The overall performance of SMOTE and SMOTE-Tomek is better than no resampling as it increases the minority class representation and adjusts the decision boundary. The proposed framework exhibits some robustness to class imbalance, as the model without oversampling is still competitive. However, ADASYN gives a more adaptive representation of minority class samples, thus enhancing the learning of boundaries and overall classification performance. The ablation study indicates that the performance of the proposed framework is not associated with any single component. However, the observed improvement is a result of a synergistic combination of the pre-processing, feature engineering, feature selection, DL-based representation learning, ensemble fusion, and class imbalance handling. The robustness and the generalization capability of the proposed framework for non-invasive prediction of PD is supported by this integrated behavior.
5.8. Bayesian Hyperparameter Optimization Using Optuna
To find successful configurations of the proposed architectures, the Bayesian hyperparameter optimization is implemented by the Optuna. Optuna employs a Tree-structured Parzen Estimator (TPE) strategy that is more efficient and less computational expensive than a conventional grid search in high-dimensional spaces. This optimization step is added to increase the reproducibility, minimize the possibility of manual tuning bias and increase the methodological robustness of the proposed biomedical prediction pipeline.
The summary of the Optuna-based optimization results is given in Table 7. Optimized weights across ML and DL components results in the best AUC obtained by the Hybrid Ensemble after 200 trials, as 0.9924 is the highest result. The optimized performance of the Cascaded DL2 model is also good with AUC of 0.9848, and the performance of the Meta-Stacking model is optimized as AUC of 0.9485.
The optimization history for the three models proposed is shown in Figure 16. The convergence of meta-Stacking is fast in the early trials, which indicates a rather smooth search space. The result of the optimized test AUC is however slightly lower than the manually tuned configuration (i.e., 0.9485), suggesting that sometimes cross-validation based optimization does not lead to better test performance on small biomedical datasets. Optimization trajectory for Hybrid Ensemble is clearly improving and is converging toward best AUC, which is 0.9924. The optimized configuration gives significant weight to the CNN branch, which is consistent with the notion that convolutional patterns are good at encoding discriminative features in the acoustics. It is important to note that the optimized outcome is the same as that of the original, thus the proposed architecture is stable.
After some reasonable number of trials the optimization process stabilizes and reaches an AUC of 0.9848 for Cascaded DL2. This means that the CatBoost gating is sensitive to different parameters like depth, learning rate and regularization. In summary, Optuna offers an efficient optimization strategy and is reproducible, and the convergence behavior ensures stability of the proposed framework.
5.9. Statistical Significance Analysis
The statistical significance analysis is carried out to check the formal statistical evidence of the observed performance differences between the proposed models and the baseline models. Analysis will encompass the use of the Bootstrap confidence intervals, McNemar’s test, and Wilcoxon signed-rank test. These tests are critical, because biomedical datasets are frequently small and apparent performance improvements may not necessarily be statistically significant. The overall statistical results for both data sets are reported in Table 8.
High-performing models have consistently high AUC values for the bootstrap confidence intervals. The Hybrid Ensemble demonstrates stable discriminative performance with the highest AUC of 0.9924 (95% CI [0.9702, 1.0000]) on Dataset 1. LightGBM and Cascaded DL2 also have good intervals, which means that they are confidently classified. A Hybrid Ensemble with an AUC of 0.9386 and a 95% confidence interval [0.8810, 0.9799] is obtained on the balanced acoustic dataset (i.e., Dataset 2), which equates to competitive generalization on the acoustic dataset.
McNemar’s test compares classification errors in pairs of models. The p-values obtained are not statistically significant at the conventional level. The differences in classification errors between the proposed models and the existing ones are not statistically significant with the standard threshold, indicating that the proposed models demonstrate improvements in AUC, recall, and confusion matrix but have similar magnitude of classification errors in the paired analysis. However, this finding should be taken with a pinch of salt, as both data sets are quite small, and various baseline models do well, making it unlikely that a statistically significant difference will be observed.
The Wilcoxon signed-rank test confirms this finding. Meta-Stacking has a higher mean AUC value than the RF baseline (but not statistically significant at the conventional 0.05 level). These findings indicate improvement trends that are practically and clinically meaningful, not necessarily statistically superior. It shows that although models were proposed with strong and stable predictive performance, it is important to note that the lack of statistical significance noted above may be due to the size of the datasets and the high baseline performance.
5.10. Advanced Calibration Analysis
A calibration analysis is done to test if the predicted probabilities match the observed probability of PD. The high performance in classification tasks may not be enough; this is crucial for clinical decision-support applications where a model with high classification performance may not be able to produce high confidence and well calibrated probability estimates. Table 9 gives the calibration performance for both of these datasets.
The calibration results show that some ensemble-based methods are more reliable in terms of probabilities than some individual methods on Dataset 1. The Hybrid Ensemble shows the best Expected Calibration Error (i.e., ECE = 0.0559) and the lowest Brier Score (i.e., 0.0487), indicating this model’s predictions are very close to the actual results. TabNet and RF have larger errors for calibration compared to LightGBM and Cascaded DL2, which means that they have a higher probability of miscalibration, or excessive confidence.
Calibration behavior is different on Dataset 2, due to the fact that the dataset is balanced and acoustic features are more structured. TabNet has the lowest ECE value of 0.0968, suggesting a relatively well-calibrated probability estimates. The RF and LightGBM models have a stable calibration while the Hybrid Ensemble has a higher ECE despite its high classification accuracy. On Dataset 2, the probability estimates generated by the Hybrid Ensemble could be more overconfident, and might require more post-hoc calibration before use in the clinic. This calibration analysis says that a high classification accuracy is not always accompanied by reliable probability estimation for classification. Calibrated probabilities are crucial for non-invasive prediction of PD as they can be used for risk-aware screening, referral and clinical interpretation. Thus, the proposed framework does not just include calibration analysis as a post-processing step, but as an integral part of reliability.
5.11. Explainability Analysis: SHAP and LIME
Both global and local explainability methods are used to improve the transparency and clinical interpretability of the proposed non-invasive PD prediction framework. SHAP (Shapley Additive Explanations) is applied to analyze global feature importance and contribution patterns, while LIME (Local Interpretable Model-Agnostic Explanations) is used to explain individual predictions. This explainability analysis is important because voice-based PD prediction models should not only provide high classification performance but should also identify meaningful acoustic and biomedical voice biomarkers that can support clinical understanding and decision-making.
5.11.1. SHAP Analysis on Dataset 1
SHAP analysis on Dataset 1 shows that model-derived representation features, particularly Transformer_prob and CNN_prob, make major contributions to the final prediction. These features obtain high SHAP values, indicating that the cascaded architecture effectively uses learned deep representations to distinguish PD cases from healthy controls. The DL_disagreement feature also contributes meaningfully, showing that disagreement between deep models provides useful uncertainty-related information for classification refinement.
Figure 17.
SHAP beeswarm plot for the Cascaded DL2 model on Dataset 1.
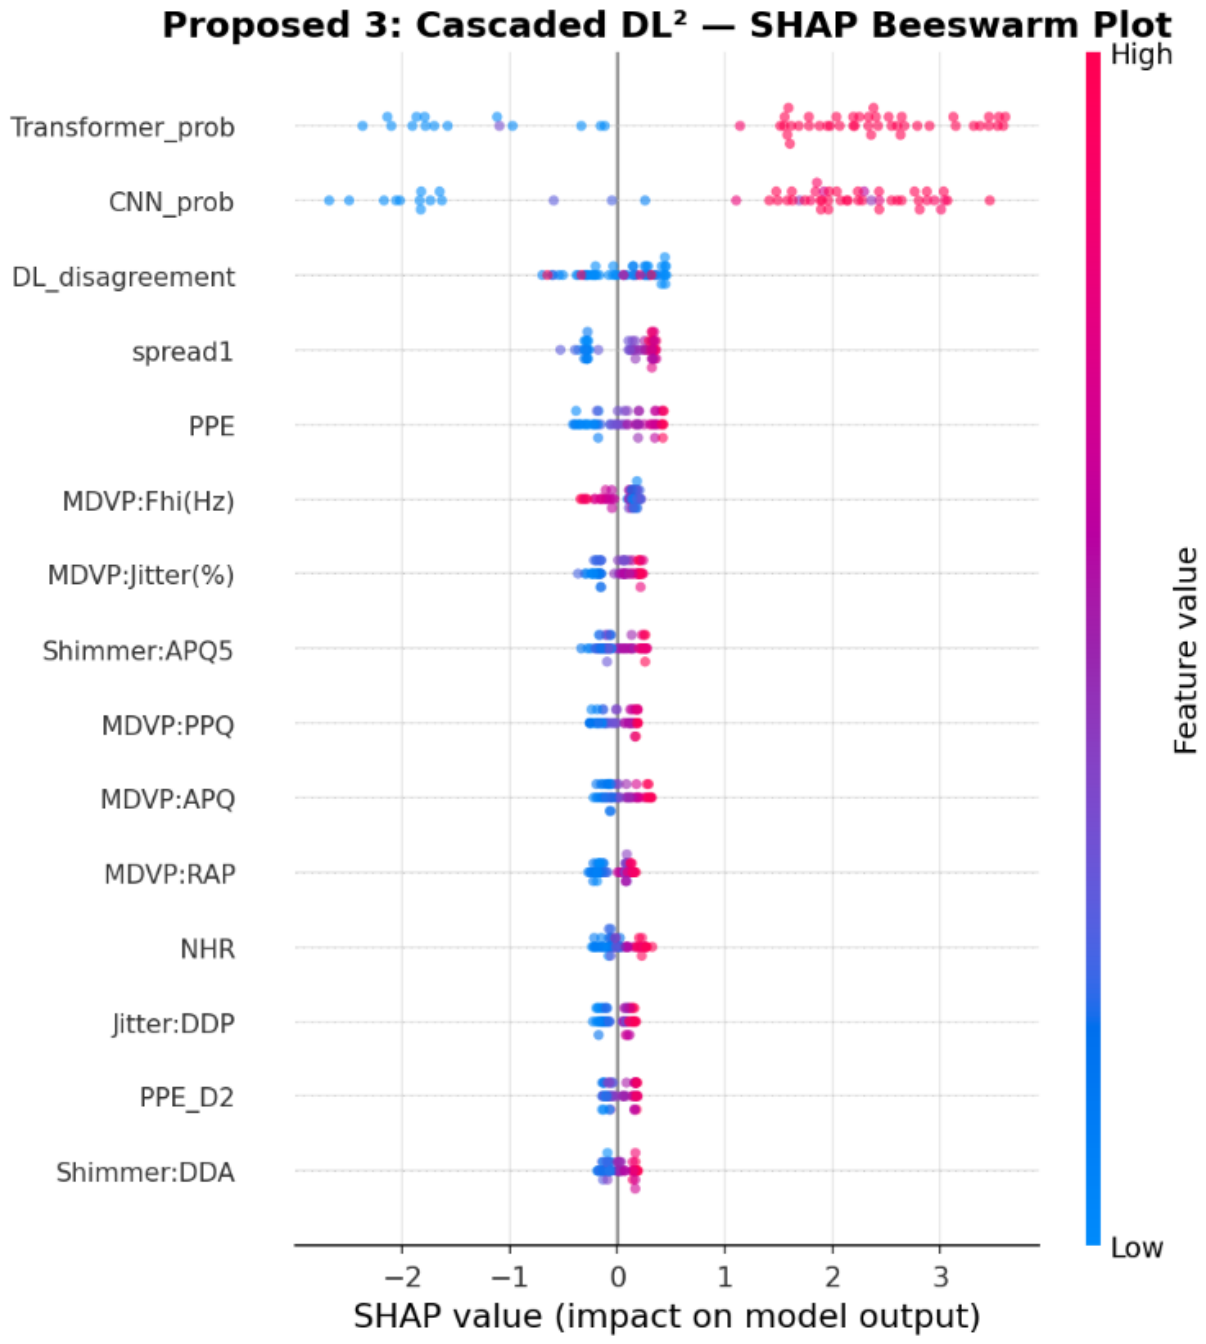
Figure 18.
SHAP feature importance for the Cascaded DL2 model on Dataset 1.
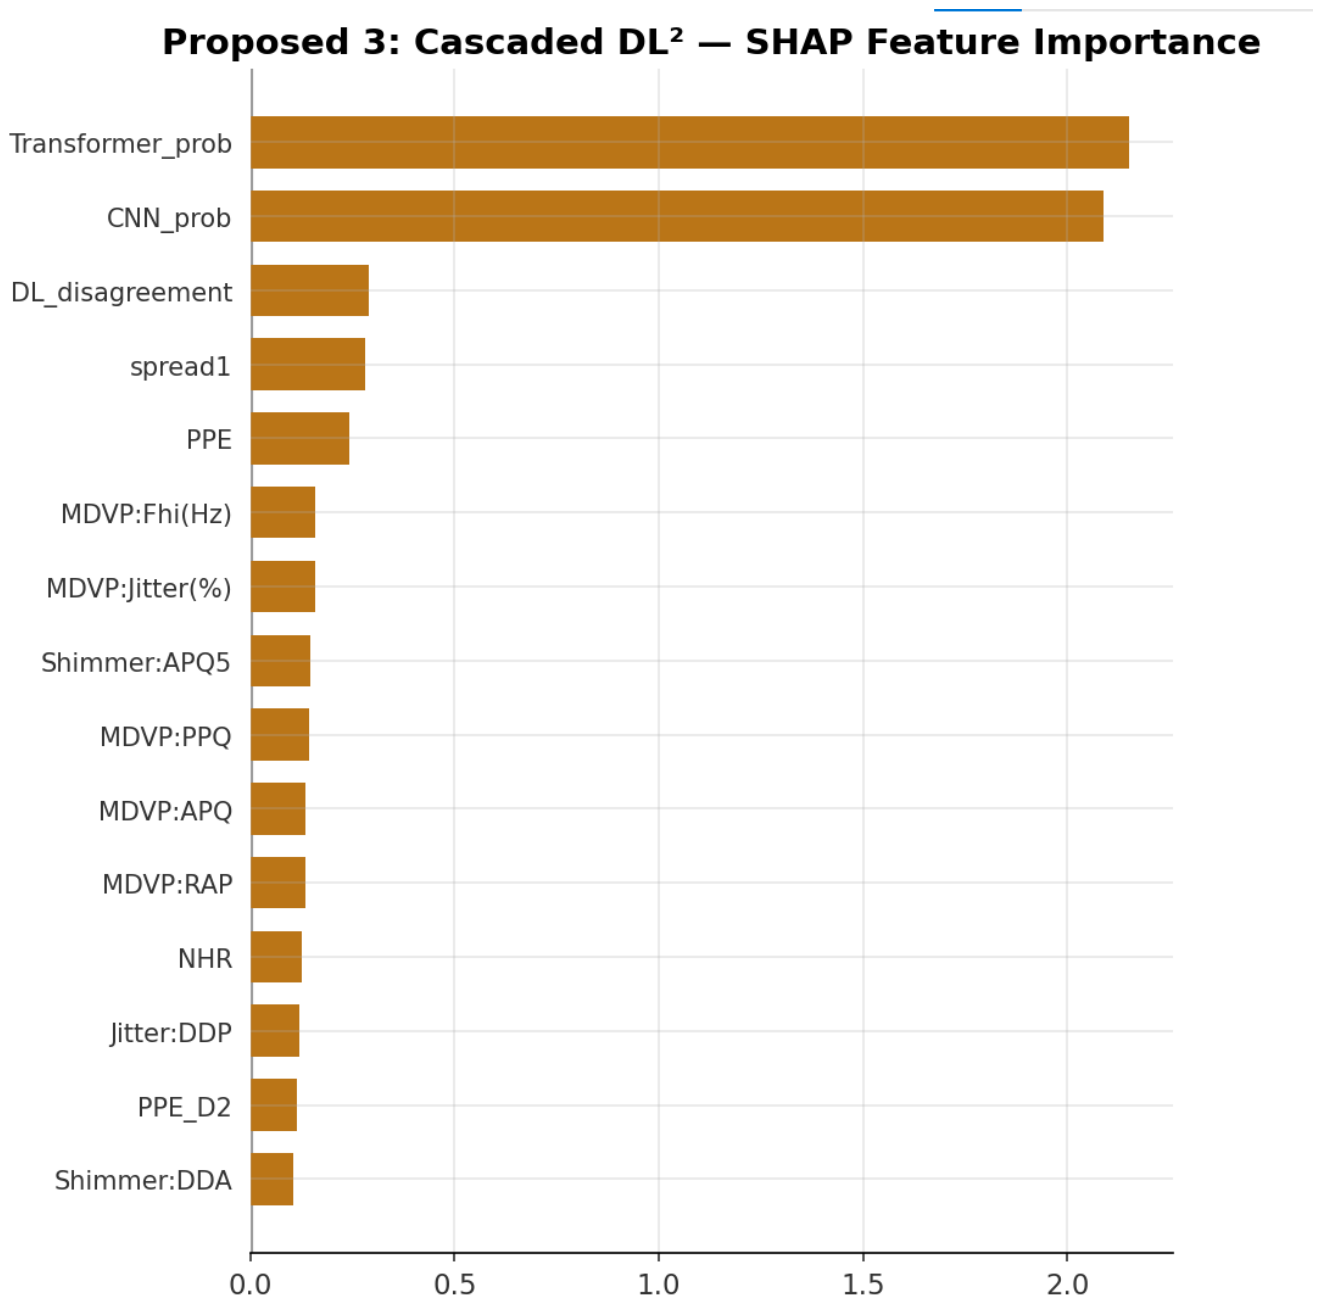
Among the handcrafted biomedical voice features, spread1 and PPE appear as important predictors. These features are related to nonlinear vocal dynamics and signal irregularity, which are relevant for Parkinsonian speech impairment. The SHAP beeswarm distribution further shows how changes in feature values influence the direction of prediction toward either the PD class or the healthy class. Overall, the SHAP findings suggest that the proposed cascaded architecture does not depend only on abstract model outputs; rather, it combines learned deep representations with clinically meaningful acoustic biomarkers.
5.11.2. SHAP Analysis on Dataset 2
In Dataset 2, SHAP analysis is performed across multiple tree-based models to examine the consistency of feature importance patterns. As shown in Figure 19, features such as HNR_slope, PPE_RPDE, Delta_energy, and MFCC-related coefficients are repeatedly ranked among the important predictors across different models. This consistency indicates that the learned decisions are not driven by arbitrary or model-specific patterns, but by stable acoustic feature relationships. The presence of MFCC and delta-based features highlights the importance of spectral and temporal variations in speech signals for non-invasive PD prediction. Similarly, HNR- and RPDE-related features reflect voice irregularity and nonlinear signal characteristics, which may be associated with neuromotor changes affecting speech production in PD. The agreement of feature importance across models strengthens confidence in the biomarker-level relevance of the proposed framework.
5.11.3. LIME Analysis on Dataset 2
LIME analysis on Dataset 2 provides instance-level explanations by identifying the features that support individual predictions. As shown in Figure 20, features such as MFCC coefficients, delta energy, and HNR-related metrics contribute positively toward PD predictions in selected cases, while the same or related features may contribute negatively in healthy-class predictions. This indicates that the model decision is based on a combination of spectral, temporal, and acoustic irregularity features rather than a single isolated variable. These local explanations are important for clinical decision-support because they show how the model reaches a prediction for a specific sample. The results suggest that individual predictions are supported by physiologically meaningful acoustic patterns, improving trust in the proposed non-invasive PD prediction framework.
5.11.4. LIME Analysis on Dataset 1
LIME explanations for the Hybrid Ensemble model on Dataset 1 are presented in Figure 21. The explanations show that both engineered acoustic features and deep model outputs contribute jointly to the final prediction. Features such as spread1, PPE, and D2 are identified as important contributors toward PD prediction, while some jitter- and shimmer-related features contribute differently depending on the individual sample. These results confirm that the Hybrid Ensemble does not operate as a purely black-box model. Instead, it integrates statistical, acoustic, and learned representation-level information in a complementary manner. When considered together, SHAP and LIME provide both global and local interpretability. SHAP identifies consistent biomarker-level importance patterns across the dataset, while LIME explains how individual predictions are formed. This pairing helps to reinforce the clinical interpretability of the framework and the possibility that it will be utilized as an understandable choice support for non-invasive screening for PD.
5.12. Comparative Performance Analysis Across Datasets
Heatmap-based and radar-based visualizations are used for both datasets to give a unified look of model behavior. These visual analyses facilitate a summary of the performance of baseline models, DL models and proposed ensemble models according to various clinically relevant metrics such as AUC, recall, specificity, F1-score, and AUPRC.
The performance heatmap for both data sets is shown in Figure 22. In the case of Dataset 1, there are several advanced models which perform very well, particularly DL and ensemble-based models. The Hybrid Ensemble performs especially well in terms of AUC and AUPRC, suggesting it has a unique capacity to separate PD-related acoustic patterns from the rest, while also providing good precision and recall. ResCNN and TabTransformer also achieve good performance, and thus, the importance of DL-based representation learning for nonlinear voice and acoustic features is highlighted. The performance for Dataset 2 is more compact and a few models have competitive results. It indicates that Dataset 2 has features which are suitable for the conventional model as well as advanced models and therefore are structured in an acoustic way. There are, however, compromises between Recall and Specificity that are evident, especially for the models which focus on Recall. The proposed ensemble models show good performance with both datasets, indicating that the ensemble of ML and DL representations can help improve the robustness under the condition of the heterogeneous acoustic data.
We further compare the baseline model (RF) with the best proposed model in terms of key parameters on the radar chart shown in Figure 23. The proposed model performs well above the baseline in most of the evaluation metrics on the Dataset 1. This indicates that the presented hybrid learning approach enhances discrimination and screening-oriented sensitivity. On Dataset 2, the improvement margins are smaller because baseline models already perform competitively on the structured and balanced feature space. Nevertheless, the proposed framework maintains a more balanced profile across multiple metrics and provides additional methodological advantages, including calibration, explainability, statistical validation, and ablation-based robustness assessment. Overall, the comparative analysis supports the generalization potential of the proposed framework across different biomedical voice and acoustic datasets. These findings suggest that the framework may be useful for non-invasive PD screening and decision-support, particularly when applied with appropriate clinical validation.
6. Conclusion and Future Work
This study proposed a calibrated and explainable hybrid ensemble model to predict PD non-invasively based on biomedical voice and acoustic biomarkers. The proposed framework includes data-specific preprocessing, feature engineering, hybrid feature selection, ML and DL models, Ensemble fusion, Calibration analysis, Statistical validation, and XAI to provide a more reliable and interpretable method for acoustic biomarker-based PD screening. The results show that handcrafted voice features along with learned model representations can boost the stability of the prediction and offer clinically relevant explanations using SHAP and LIME. The framework has potential to be used as a decision-support tool, but needs to be validated on larger datasets of multi-centers and with diverse demographics. Future work will involve further development of the system to incorporate multimodal PD assessment, including longitudinal speech recordings, clinical scores, motor assessment, molecular or genetic biomarkers, and treatment-response information. Additional work will also focus on uncertainty-aware learning, external validation, real-time deployment, and clinician-in-the-loop evaluation to support practical use in early screening, patient monitoring, and personalized disease-management pathways.
Author Contributions
Conceptualization, N.T.; methodology, N.T. and G.N.A; validation, G.N.A. and H.M.; formal analysis, N.T and M.H.; investigation, N.T; resources, G.N.A. and M.H.; data curation, G.N.A.; writing–original draft preparation, N.T.; writing-review and editing, H.M., M.H., AND G.N.A.; visualization, G.N.A. and N.T.; supervision, M.H.; project administration, N.T. and H.M.; funding acquisition, G.N.A. All authors have read and agreed to the published version of the manuscript.
Data Availability Statement
The datasets used in this study are publicly available at: 1. https://www.kaggle.com/datasets/vikasukani/parkinsons-disease-data-set. 2. https://www.kaggle.com/datasets/hugosouza/parkinson-replicated-acoustic-features-dataset.
Acknowledgments
The authors extend their appreciation to the King Salman center For Disability Research for funding this work through Research Group no KSRG-2026-165.
References
- Rahman, F.; Mahmood, T.; Khan, A. Artificial intelligence-based early detection of Parkinson’s disease. Diagnostics 2025, 15, 456. [Google Scholar] [CrossRef] [PubMed]
- Rao, P.; Kumar, A.; Singh, R. Machine learning approaches for Parkinson’s disease detection using voice data: A systematic review. Biomed. Signal Process. Control 2023, 84, 104789. [Google Scholar]
- Kim, H.; Lee, J.; Park, M. Deep learning-based Parkinson’s disease detection using biomedical voice signals. IEEE Access 2024, 12, 45678–45690. [Google Scholar] [CrossRef]
- Rao, P.; Singh, R. Speech signal analysis for Parkinson’s disease detection using machine learning. Biomed. Signal Process. Control 2024, 90, 105432. [Google Scholar]
- Wang, Y.; Bian, Y.; Jiang, S. Deep learning for tabular data: A survey and benchmark. IEEE Trans. Neural Netw. Learn. Syst. 2023, 34, 4567–4580. [Google Scholar]
- Aladhadh, S. An Explainable Ensemble and Deep Learning Framework for Accurate and Interpretable Parkinson’s Disease Detection from Voice Biomarkers. Diagnostics 2025, 15, 2892. [Google Scholar] [CrossRef] [PubMed]
- Shen, M.; Mortezaagha, P.; Rahgozar, A. Explainable artificial intelligence to diagnose early Parkinson’s disease via voice analysis. Sci. Rep. 2025, 15, 11687. [Google Scholar] [CrossRef] [PubMed]
- Chen, M.; Liu, F.; Zhao, K. Explainable artificial intelligence in healthcare: A review. IEEE Access 2023, 11, 112345–112360. [Google Scholar]
- Khan, U.; Ahmed, B. Explainable deep learning for clinical decision support systems. IEEE Access 2025, 13, 56789–56805. [Google Scholar]
- Alshammeri, M.; Tariq, N.; Jhanji, N.; Humayun, M.; Khan, M.A. Explainable Ensemble Learning Framework for Early Detection of Autism Spectrum Disorder: Enhancing Trust, Interpretability and Reliability in AI-Driven Healthcare. Comput. Model. Eng. Sci. 2026, 146. [Google Scholar] [CrossRef]
- Ovadia, Y.; et al. Can you trust your model’s uncertainty? Evaluating predictive uncertainty under dataset shift. Adv. Neural Inf. Process. Syst. 2019, 32. [Google Scholar]
- Majlatow, M.; Shakil, F.A.; Emrich, A.; Mehdiyev, N. Uncertainty-aware predictive process monitoring in healthcare: explainable insights into probability calibration for conformal prediction. Appl. Sci. 2025, 15, 7925. [Google Scholar] [CrossRef]
- Wang, Y.; Jiang, S. Deep learning for tabular healthcare data: Opportunities and challenges. Biomed. Signal Process. Control 2024, 95, 106123. [Google Scholar]
- Zhao, L.; Chen, Y.; Wu, H. Transformer-based models for tabular healthcare data analysis. Pattern Recognit. 2025, 145, 109876. [Google Scholar]
- Zhou, Q.; Wang, L.; Zhao, P. A comprehensive review of ensemble learning in medical diagnosis. Artif. Intell. Med. 2023, 139, 102523. [Google Scholar]
- Liu, J.; Zhao, W.; Sun, H. Ensemble learning for healthcare prediction: A review. Artif. Intell. Med. 2024, 145, 102612. [Google Scholar]
- Alamri, M.; Tariq, N.; Humayun, M.; Alshammeri, M. Energy-efficient threat detection in IoT healthcare using AI and blockchain-enhanced fog–cloud architecture. Clust. Comput. 2026, 29, 108. [Google Scholar] [CrossRef]
- Wang, X.; Yue, X.; Tariq, N.; Sajid, A. Hybrid AI-and blockchain-powered secure internet hospital communication and anomaly detection in smart cities. Processes 2025, 13, 1466. [Google Scholar] [CrossRef]
- Akiba, T.; Sano, S. Optuna: A hyperparameter optimization framework for machine learning. IEEE Softw. 2023, 40, 75–82. [Google Scholar]
- Singh, A.; Patel, M. Calibration techniques for reliable medical AI systems. Nat. Mach. Intell. 2025, 7, 210–220. [Google Scholar]
- Umar, B.; Tariq, N. Artificial intelligence for clinical decision support systems: Current trends and challenges. Diagnostics 2026, 16, 234. [Google Scholar]
- Gao, X.; Li, Y. Improving clinical prediction using deep learning on multimodal healthcare data. Artif. Intell. Med. 2024, 146, 102635. [Google Scholar]
- Sunil, D.; Joshi, P.V. Early Prediction of Chronic Diseases Through Multimodal Data Fusion in Machine Learning: A Survey. In Proceedings of the 2025 7th International Conference on Intelligent Sustainable Systems (ICISS); IEEE, 2025; pp. 1108–1115. [Google Scholar]
- Lyngdoh, N.N.K.; Mane, D. Advanced Techniques in Predictive Analytics: Ensemble Methods and Feature Engineering for Healthcare Predictions. Artif. Intell. Mach. Learn. Neurol. 2026, 1, 315–350. [Google Scholar] [CrossRef]
- Motamedi, B.; Villányi, B. A novel hybrid machine learning approach for early prediction of Parkinson’s disease severity using optimized feature selection and ensemble learning. Intell.-Based Med. 2025, 100276. [Google Scholar] [CrossRef]
- Sedigh Malekroodi, H.; Lee, B.i.; Yi, M. Voice-Based Detection of Parkinson’s Disease Using Machine and Deep Learning Approaches: A Systematic Review. Bioengineering 2025, 12, 1279. [Google Scholar] [CrossRef] [PubMed]
- Xu, H.; Xie, W.; Pang, M.; Li, Y.; Jin, L.; Huang, F.; Shao, X. Non-invasive detection of Parkinson’s disease based on speech analysis and interpretable machine learning. Front. Aging Neurosci. 2025, 17, 1586273. [Google Scholar] [CrossRef] [PubMed]
- Siebra, R.; et al. Transformers for tabular healthcare data modeling. IEEE Access 2024, 12, 120345–120360. [Google Scholar]
- Ahmed, S.; Khan, U. Machine learning techniques for disease prediction: A comprehensive survey. IEEE Access 2024, 12, 87654–87670. [Google Scholar]
- Zhou, P.; Li, C. Gradient boosting in medical data analysis: A survey. Pattern Recognit. 2024, 140, 109500. [Google Scholar]
- Egbo, B.; Nigmetolla, Z.; Khan, N.A.; Jamwal, P.K. Explainable machine learning for early detection of Parkinson’s disease in aging populations using vocal biomarkers. Front. Aging Neurosci. 2025, 17, 1672971. [Google Scholar] [CrossRef] [PubMed]
- He, W.; Jiang, Z.; Xiao, T.; Xu, Z.; Li, Y. A survey on uncertainty quantification methods for deep learning. ACM Comput. Surv. 2026, 58, 1–35. [Google Scholar] [CrossRef]
- Jin, Y.; Li, X.; Han, X.; Qiu, Y.; Zhang, H.; Xu, J.; Han, M. SHAP-based interpretable machine learning for Parkinson’s disease severity prediction: integrated analysis of clinical and environmental features. Front. Neurol. 2025, 16, 1678463. [Google Scholar] [CrossRef] [PubMed]
- Yi, L.; Chen, Z. Comparative analysis of manifold learning techniques in healthcare data. Pattern Recognit. Lett. 2024, 178, 34–42. [Google Scholar]
- Mehta, V.; Maram, B.; Garg, J.; Kumar, N.; Raut, P.T.; Selvarathinam, A.L.X.R.A.; Jindal, P. A multimodal explainable artificial intelligence framework for interpretable Parkinson’s disease prediction. In Scientific Reports; 2026. [Google Scholar]
- Khan, I.; Kumar, S. Artificial Intelligence in Biomedical Sciences and Healthcare; CRC Press, 2026. [Google Scholar]
- Adil, M.; Ali, A.; Hakim, S.B.; Farouk, A.; Abulkasim, H.; Khan, M.K.; Song, H. Security and Privacy Challenges in Healthcare Internet of Things Applications in the Era of Agentic AI. In Authorea Preprints; 2026. [Google Scholar]
- Carobene, A.; Cadamuro, J.; Frans, G.; Goldshmidt, H.; Debeljak, Z.; De Bruyne, S.; van Doorn, W.; Elias, J.; Özdemir, H.; Martin Perez, S.; et al. EFLM checklist for the assessment of AI/ML studies in laboratory medicine: enhancing general medical AI frameworks for laboratory-specific applications. Clin. Chem. Lab. Med. (CCLM) 2026, 64, 27–40. [Google Scholar] [PubMed]
Figure 1.
Proposed multi-stage dual-dataset framework for non-invasive PD prediction using biomedical voice and acoustic biomarkers.
Figure 1.
Proposed multi-stage dual-dataset framework for non-invasive PD prediction using biomedical voice and acoustic biomarkers.
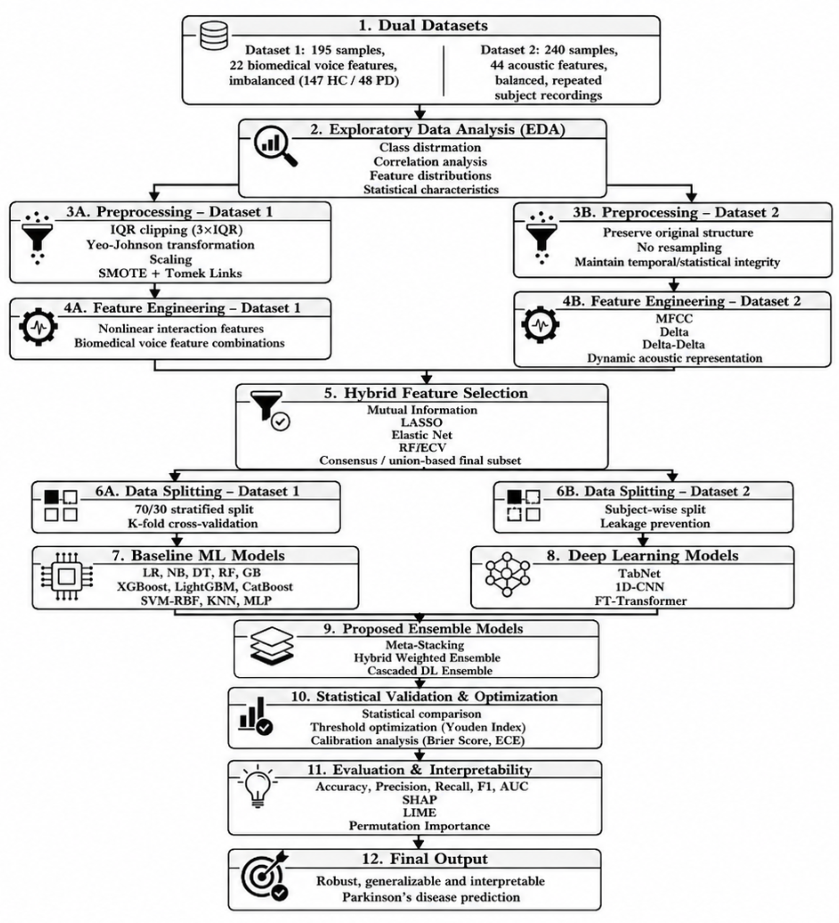
Figure 2.
ROC curves for all models on Dataset 1.
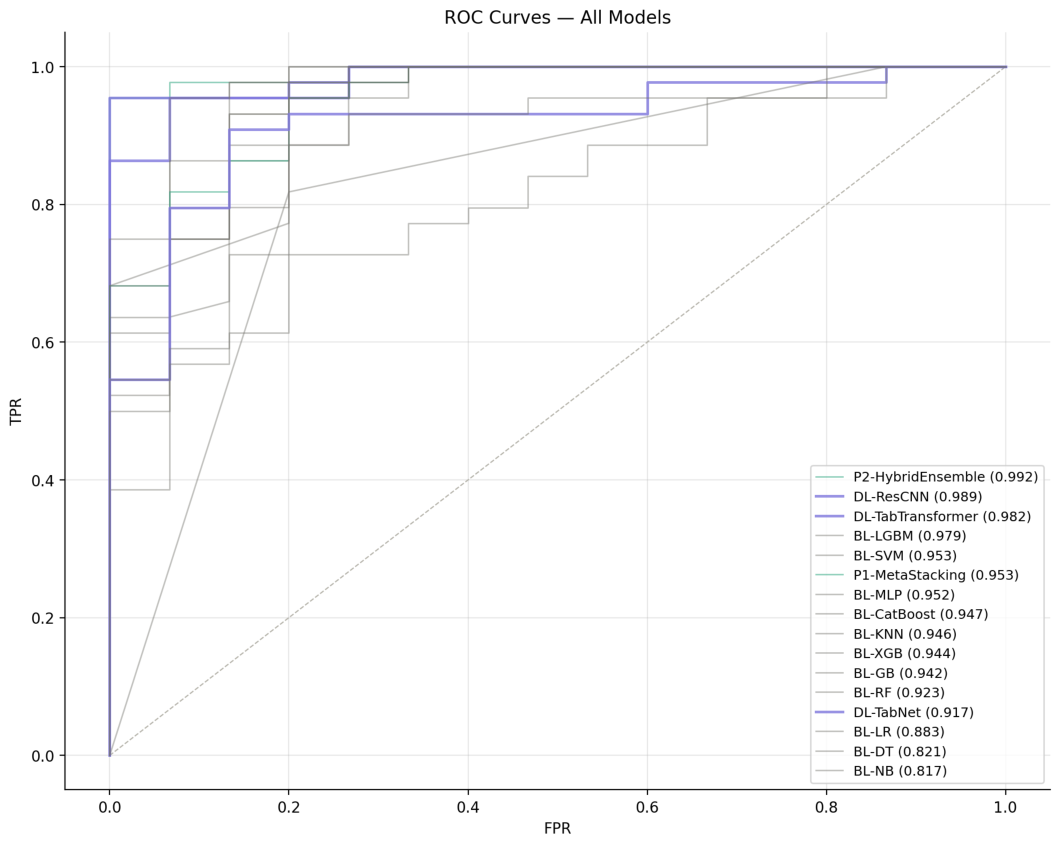
Figure 3.
AUC comparison across models on Dataset 1.
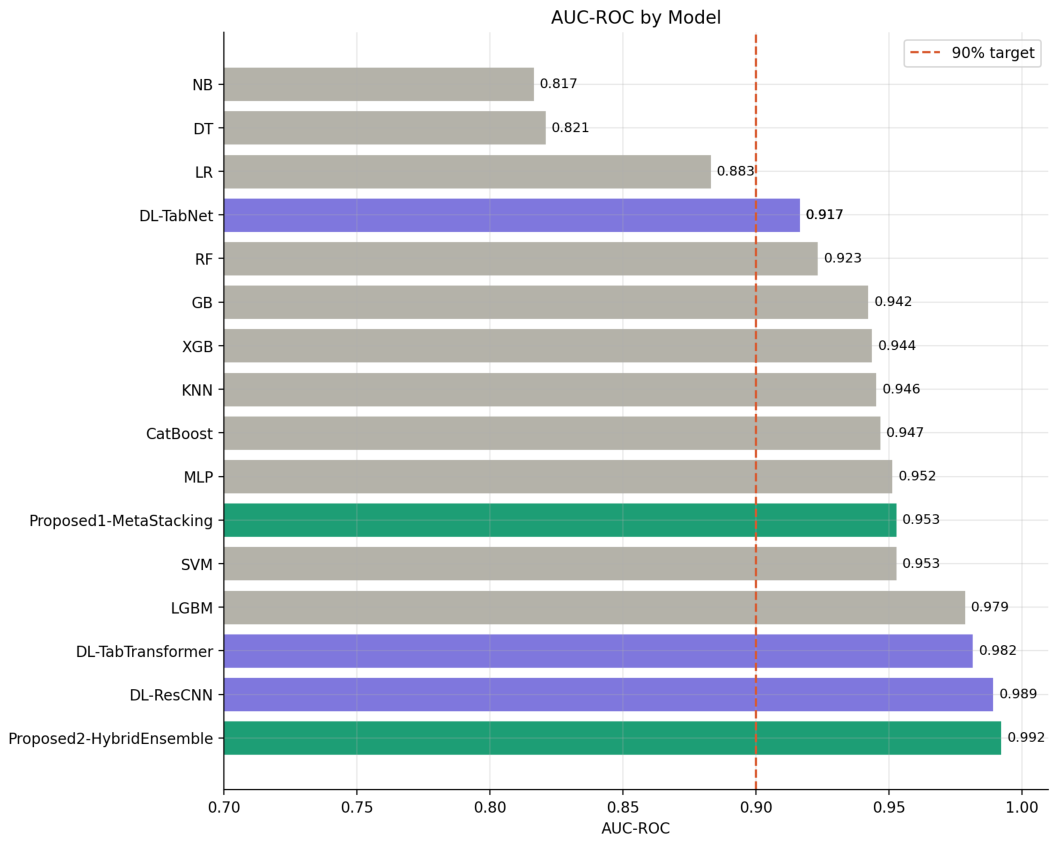
Figure 4.
Precision–Recall curves for all models on Dataset 1.
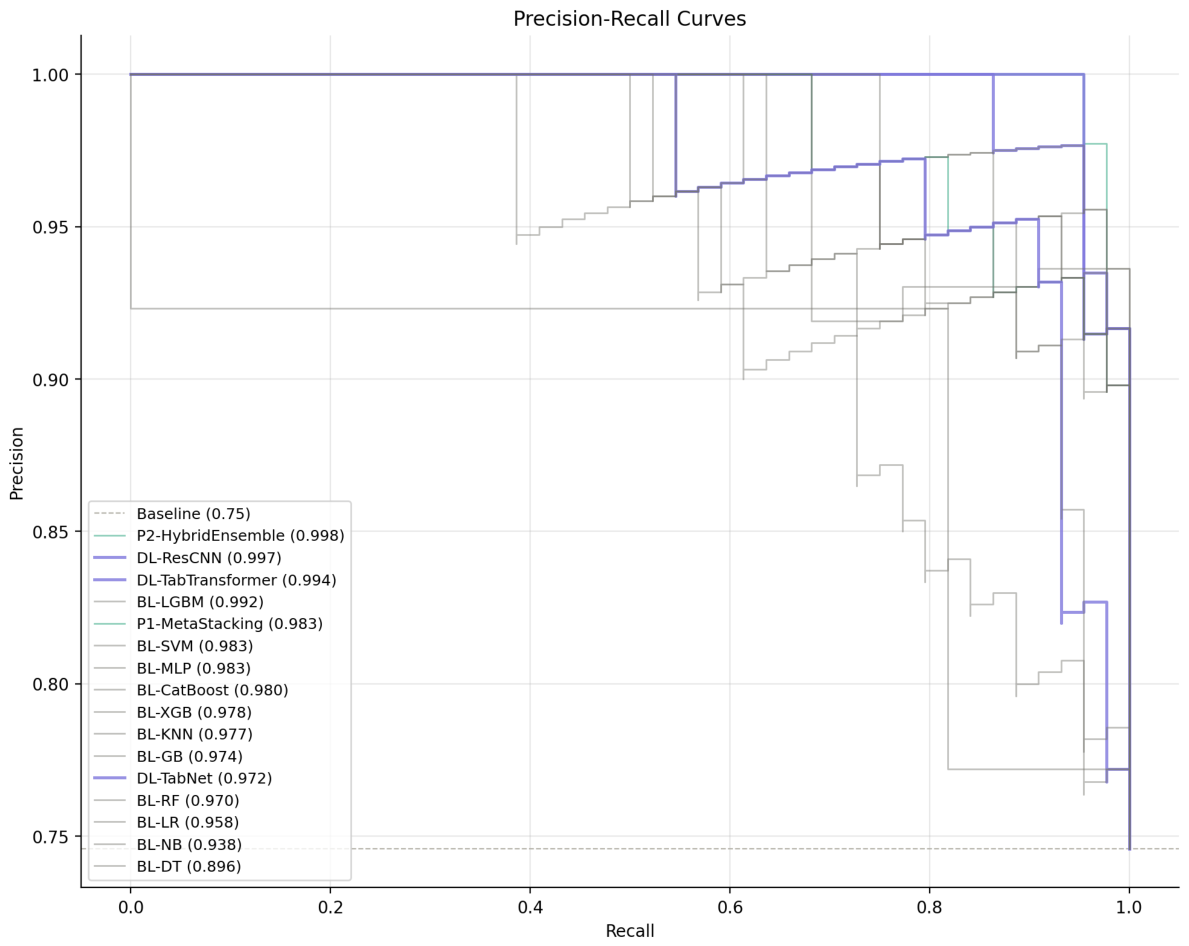
Figure 5.
Combined ROC curves, AUC comparison, and Precision–Recall curves for Dataset 2.
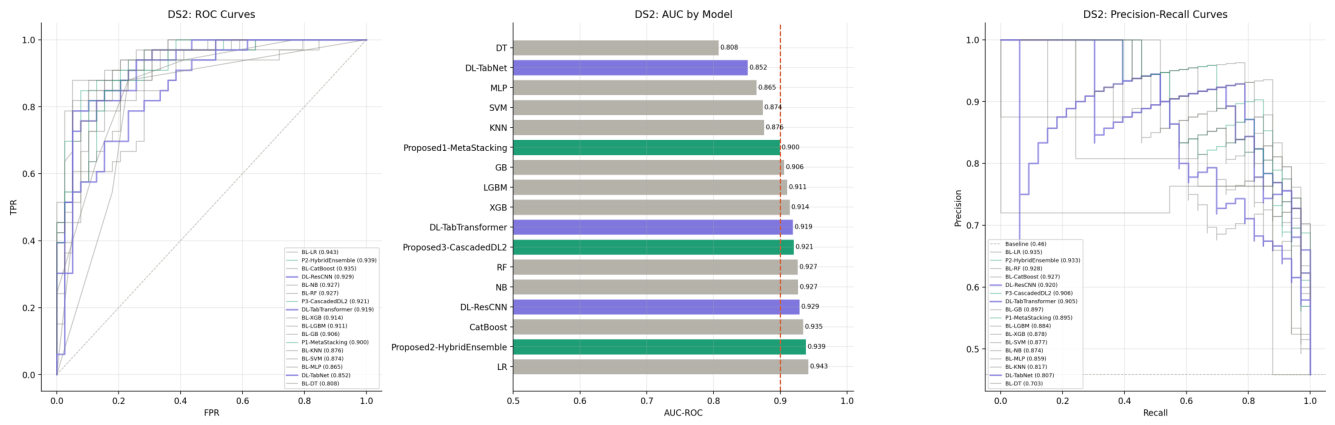
Figure 6.
Confusion matrices for DL and proposed models on Dataset 1.
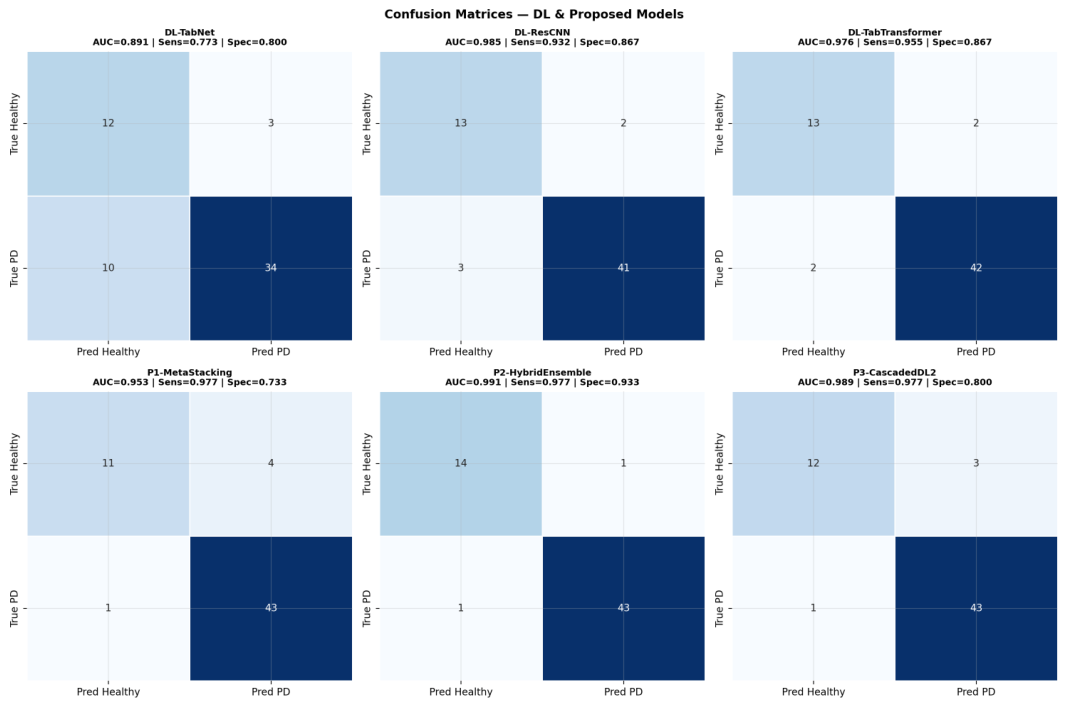
Figure 7.
Confusion matrices for DL and proposed models on Dataset 2.
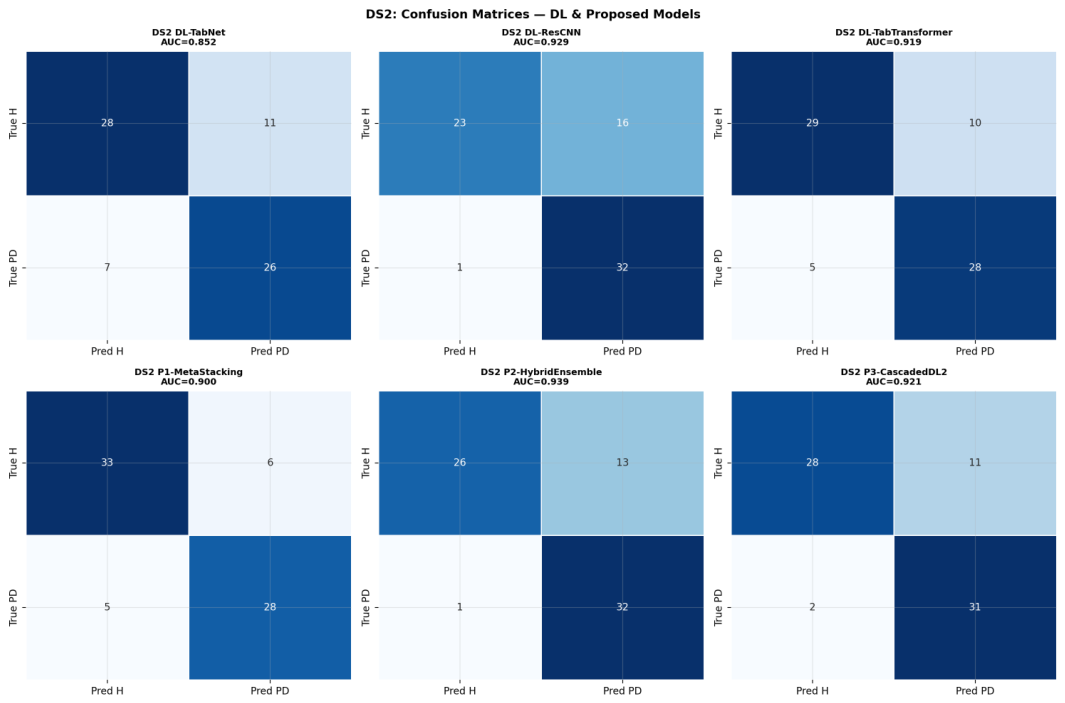
Figure 8.
Impact of preprocessing components on model performance.
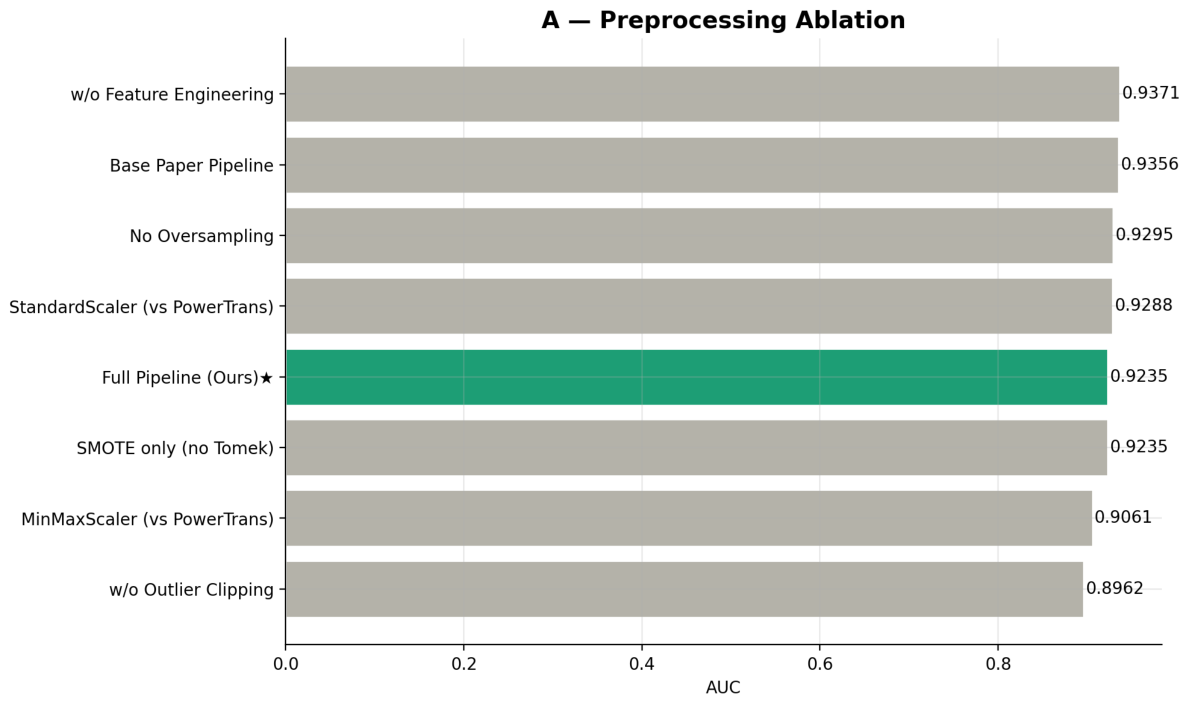
Figure 9.
Comparison of different feature selection strategies.
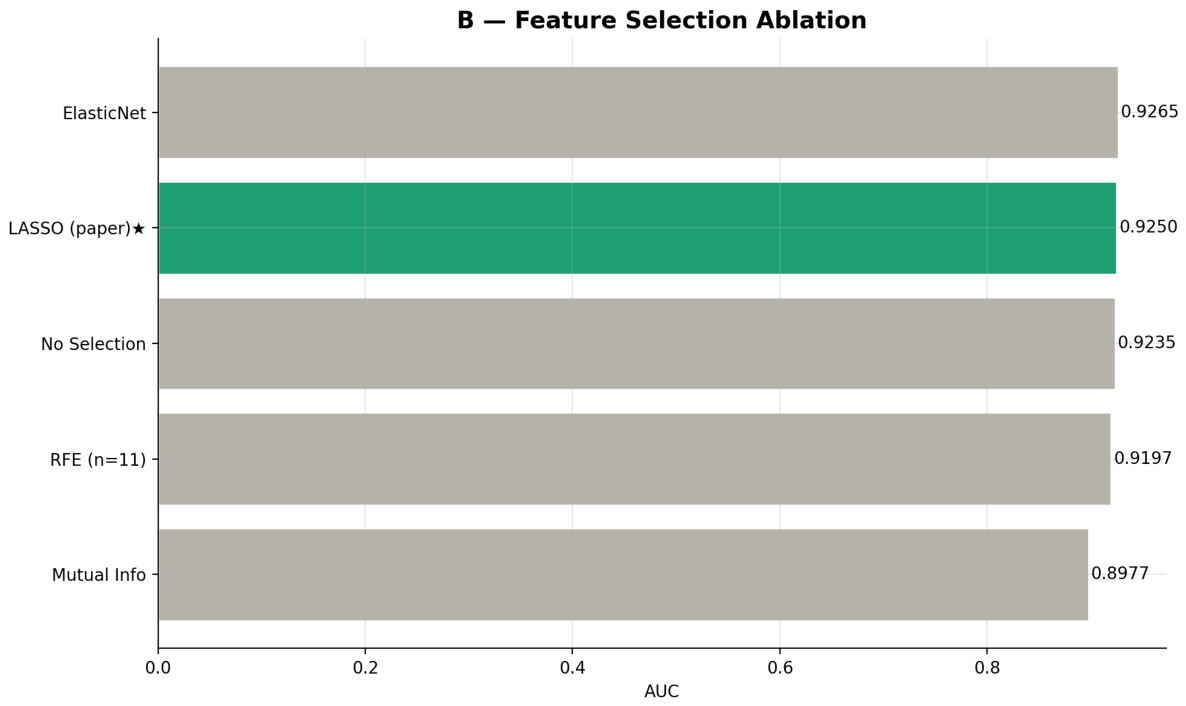
Figure 10.
Effect of number of trees (n_estimators) on performance.
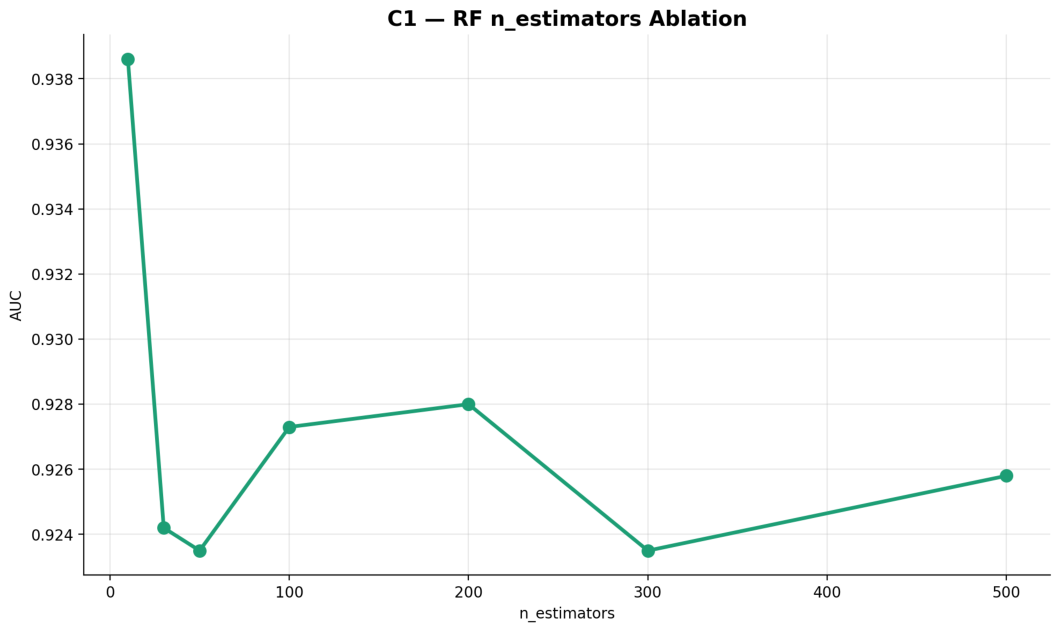
Figure 11.
Effect of maximum tree depth on performance.
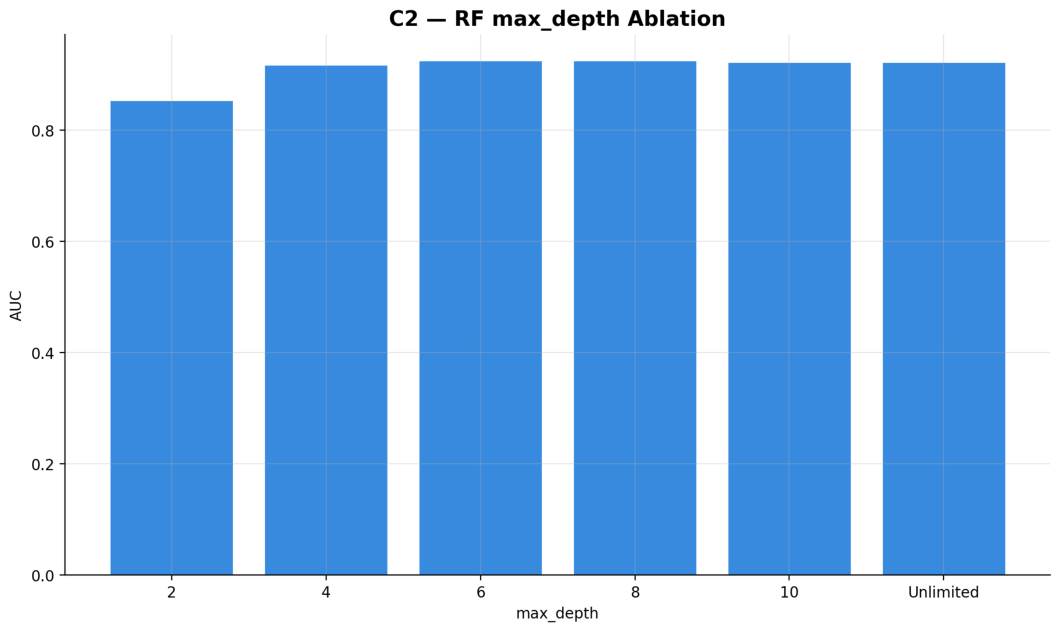
Figure 12.
Effect of max_features parameter on performance.
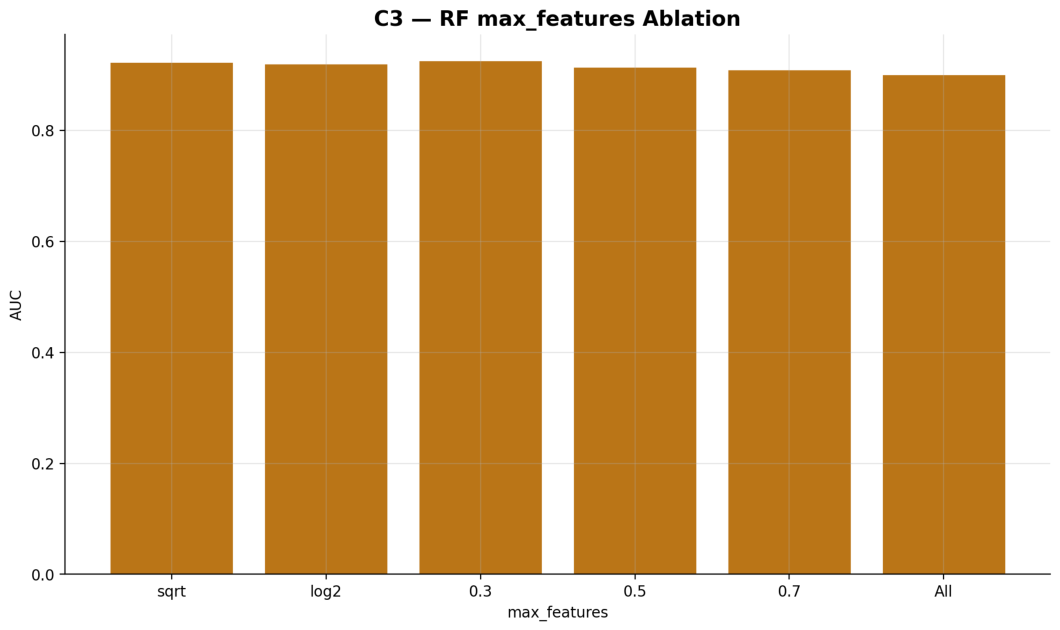
Figure 13.
Contribution of individual components in ensemble models.
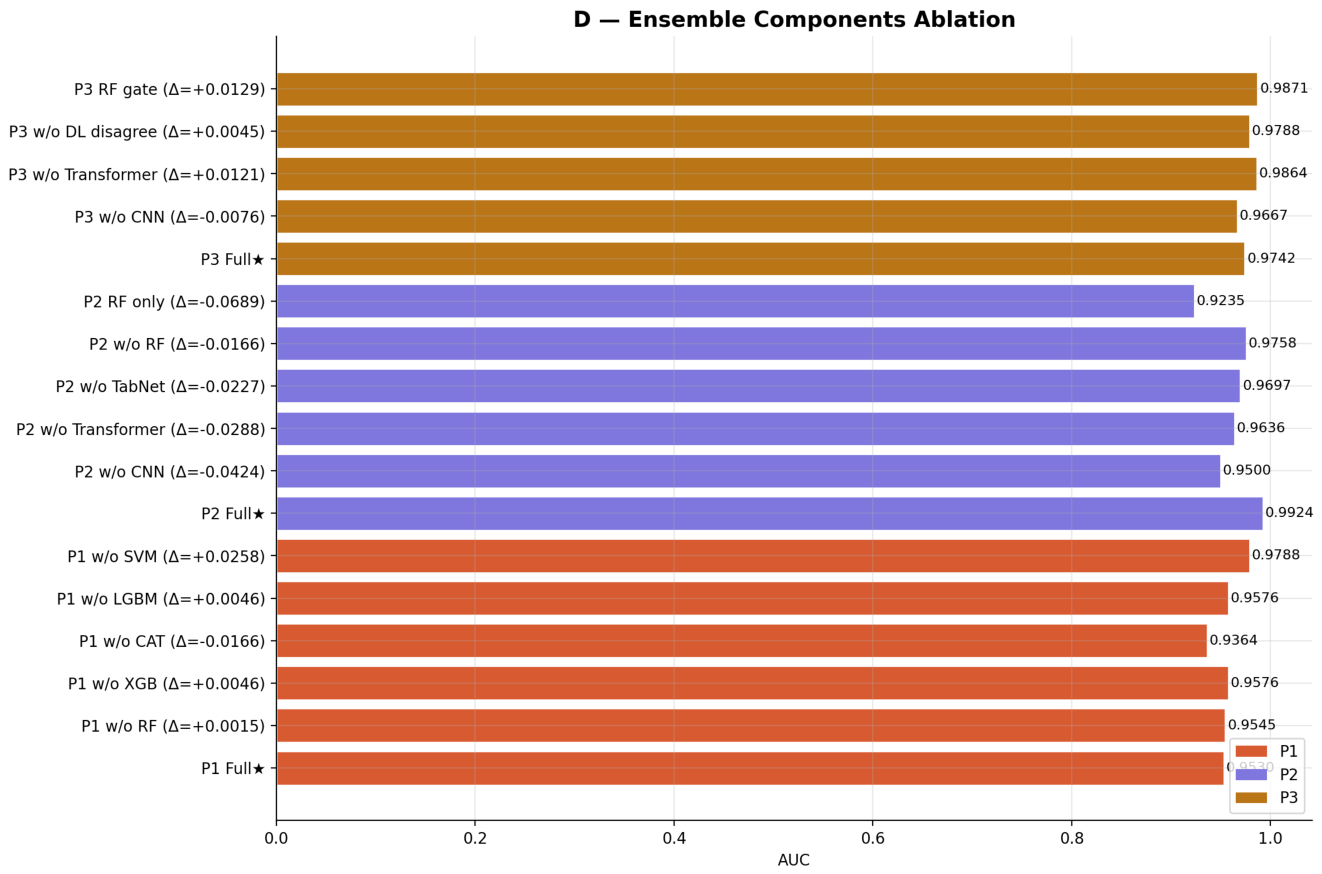
Figure 14.
Model performance across varying training data sizes.
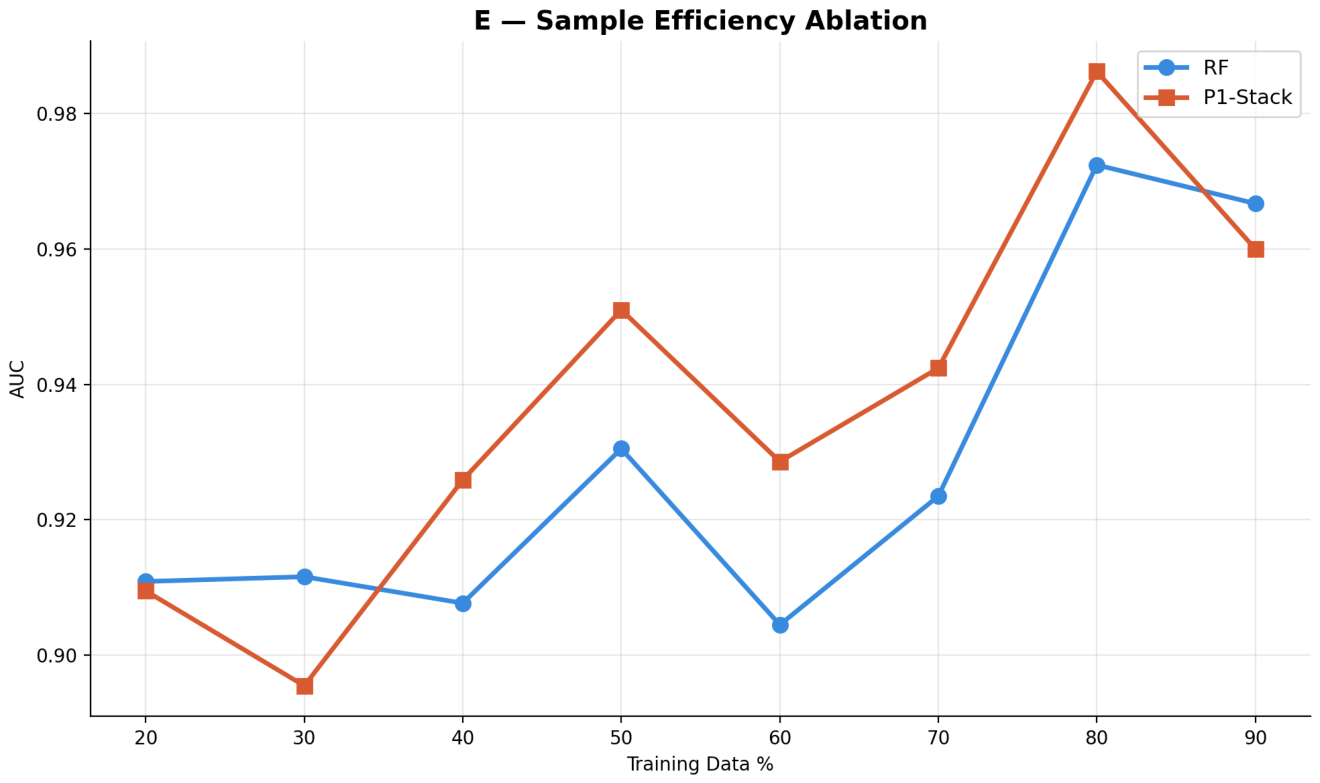
Figure 15.
Comparison of different class imbalance handling strategies.
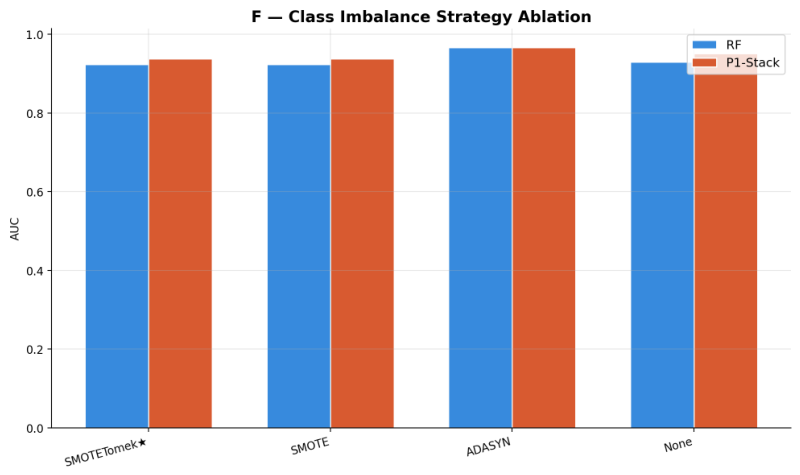
Figure 16.
Optimization history of Optuna for all three proposed models, showing convergence behavior across trials.
Figure 16.
Optimization history of Optuna for all three proposed models, showing convergence behavior across trials.
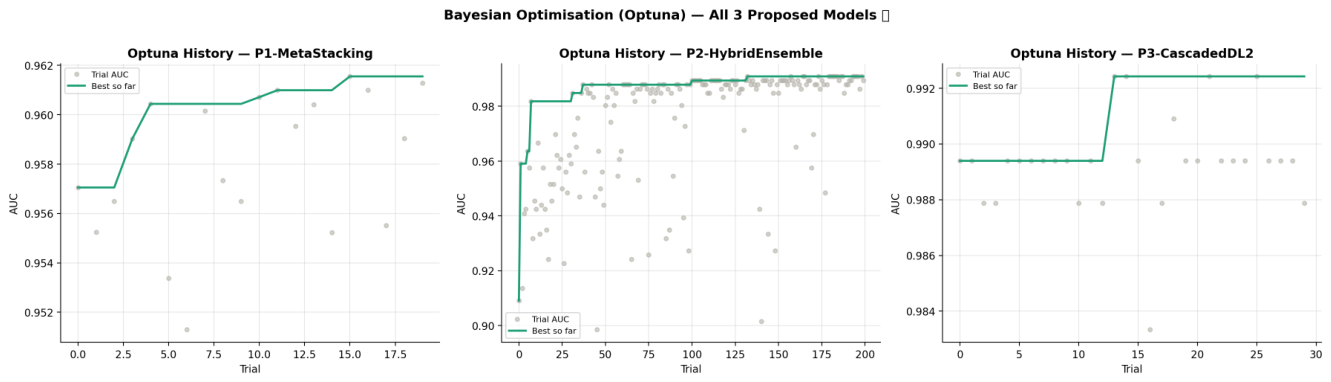
Figure 19.
SHAP feature importance across multiple models for Dataset 2.
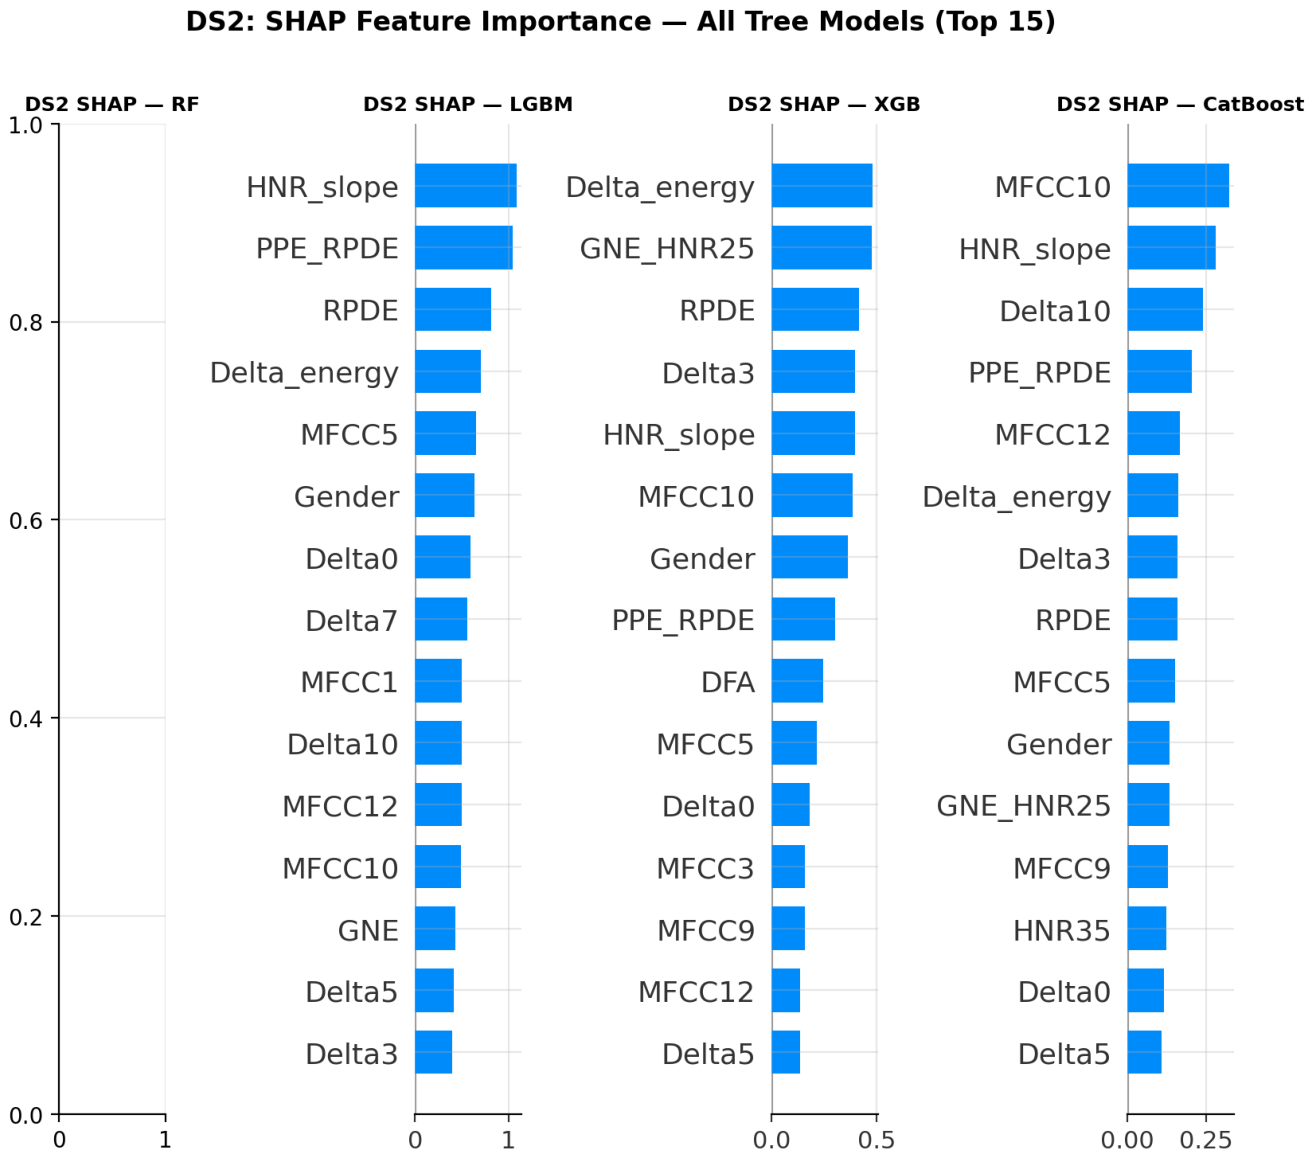
Figure 20.
LIME explanations for selected samples using RF on Dataset 2.
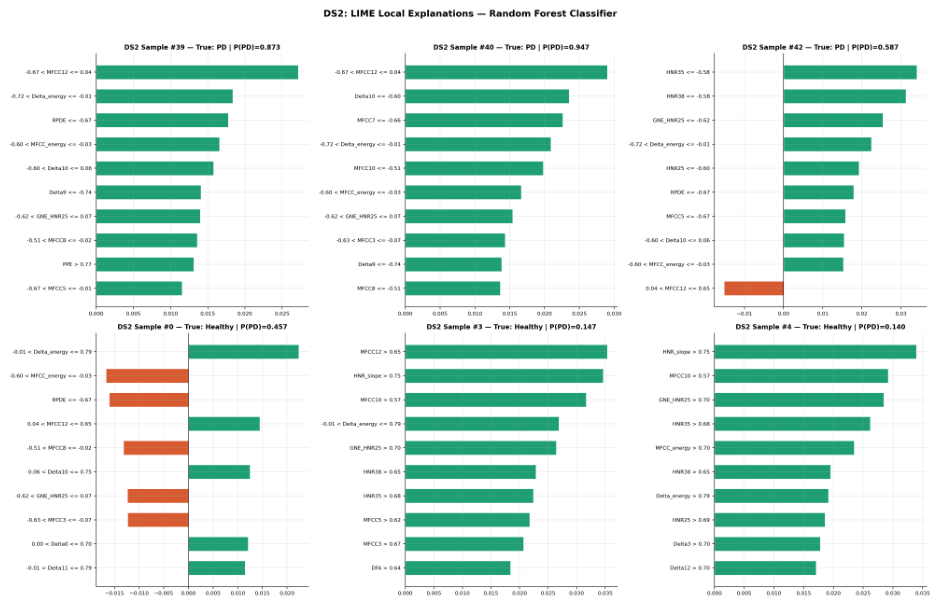
Figure 21.
LIME explanations for the Hybrid Ensemble model on Dataset 1.
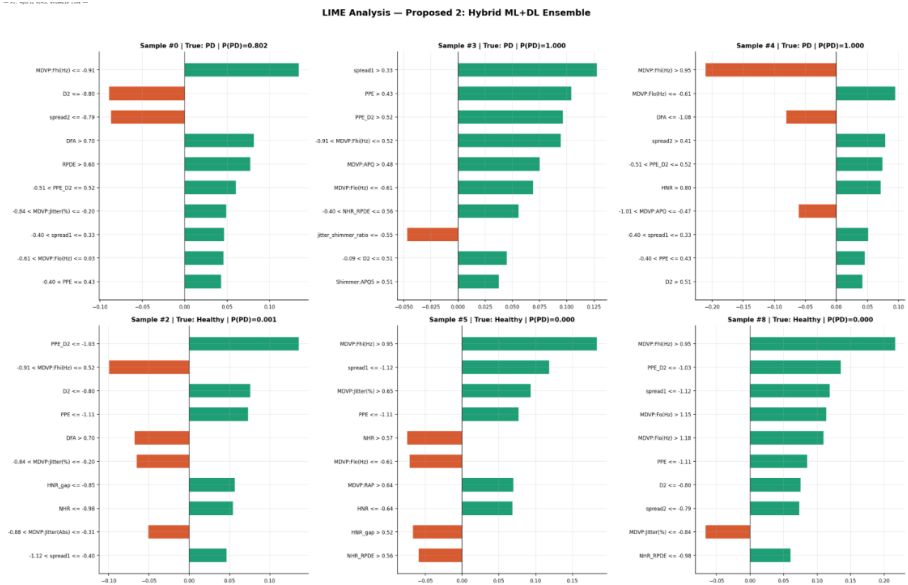
Figure 22.
Performance heatmap comparing all models across multiple evaluation metrics for Dataset 1 and Dataset 2.
Figure 22.
Performance heatmap comparing all models across multiple evaluation metrics for Dataset 1 and Dataset 2.
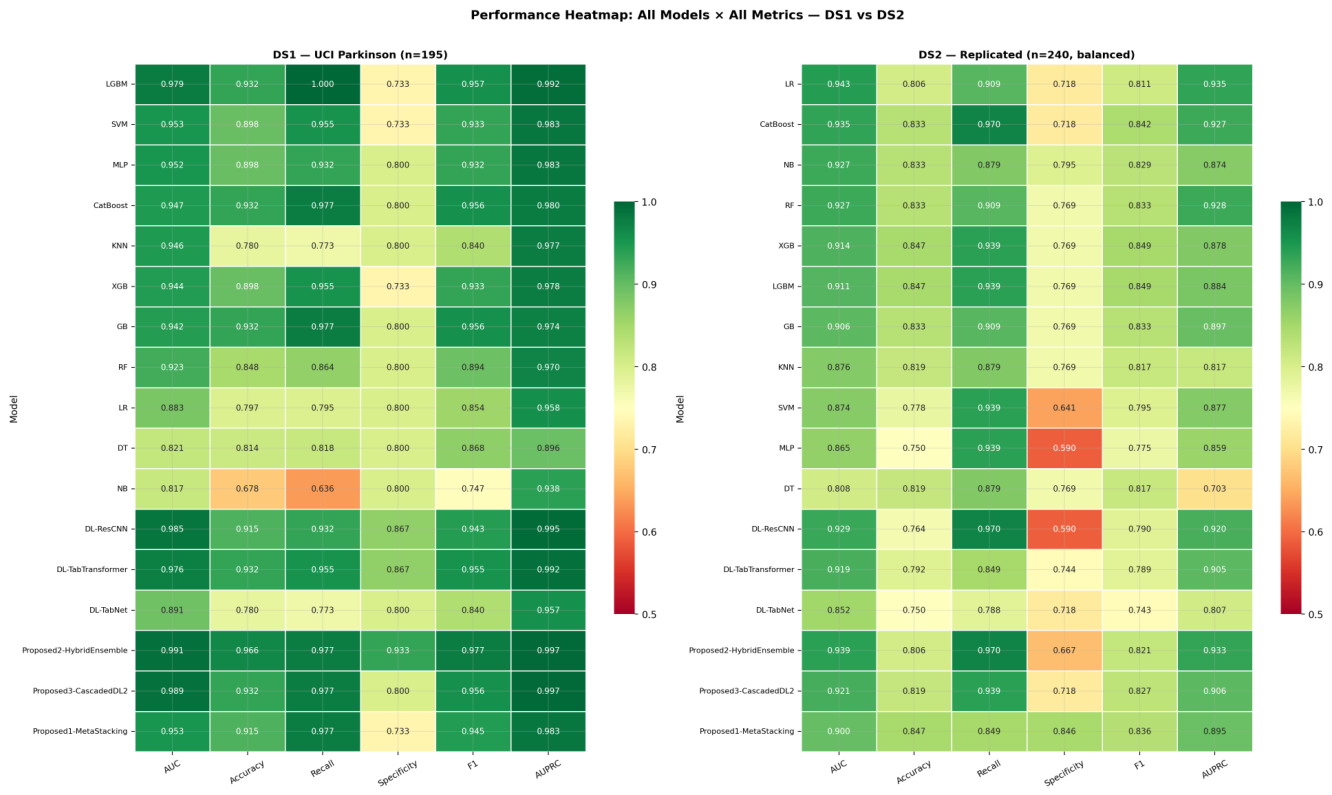
Figure 23.
Radar chart comparing baseline RF and best proposed model across key metrics for both datasets.
Figure 23.
Radar chart comparing baseline RF and best proposed model across key metrics for both datasets.
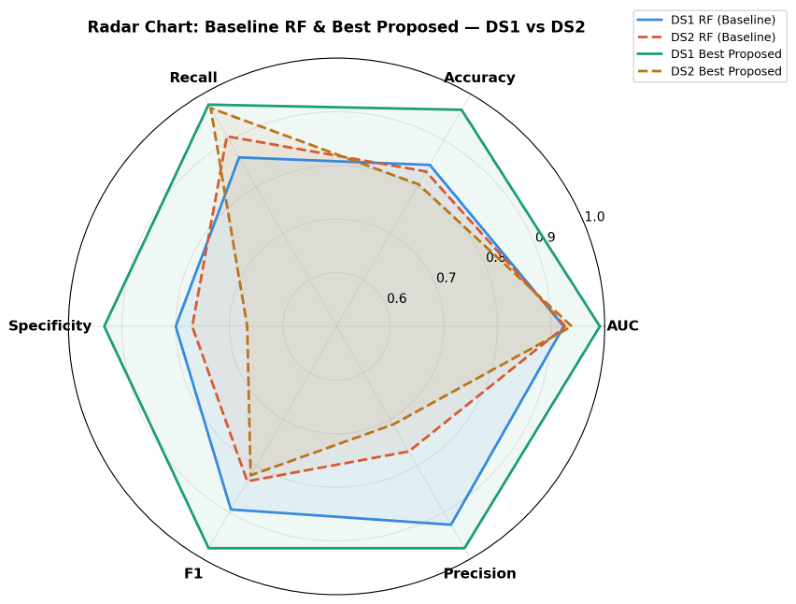

Table 1.
Comparison of Parkinson’s disease detection and healthcare AI frameworks.
| Ref. | Data Type | Core Model | Calib. | Stat. | Hybrid | XAI | Opt. | Limitation |
|---|---|---|---|---|---|---|---|---|
| [2] | Voice data | ML models | × | × | × | × | × | No hybrid modeling |
| [3] | Voice | DL | × | × | × | × | × | No interpretability |
| [5] | Tabular | DL benchmark | × | × | × | × | × | DL limitations |
| [15] | Healthcare | Ensemble | × | × | × | × | No DL integration | |
| [28] | Tabular | Transformer | Partial | × | × | × | × | No calibration |
| [8] | Healthcare | XAI | × | × | × | × | No predictive modeling | |
| [20] | Clinical AI | Calibration | × | × | × | × | Not integrated | |
| [19] | ML | Optimization | × | × | × | × | Not healthcare-specific | |
| [25] | PD | Ensemble | × | × | × | × | No calibration/XAI | |
| Proposed | PD tabular | Hybrid ML + DL ensembles | Fully integrated framework |
Table 2.
Experimental setup, implementation details, and hyperparameters used in this study.
| Parameter | Description | Parameter | Description |
|---|---|---|---|
| Computing platform | Google Colab Pro | Hardware accelerator | NVIDIA Tesla T4 / A100 GPU |
| Operating system | Linux Colab runtime | Programming language | Python 3.10 |
| DL framework | PyTorch 2.x | ML library | Scikit-learn 1.4 |
| Boosting libraries | XGBoost, LightGBM, CatBoost | Data/visualization libraries | NumPy, Pandas, Matplotlib, Seaborn |
| Dataset 1 size | 195 samples; 147 Healthy, 48 Parkinson’s | Dataset 2 size | 240 samples; balanced |
| Feature dimensions | 22 (DS1), 44+ (DS2) | Cross-validation | 5-fold Stratified CV |
| Dataset split (DS1) | 70% train / 30% test; stratified | Dataset split (DS2) | Subject-wise split; no leakage |
| Outlier removal | IQR clipping () | Scaling/transform | Yeo-Johnson + scaling |
| Class balancing | SMOTETomek; DS1 only | Feature engineering | 5 interaction features |
| Feature selection | MI + LASSO + ElasticNet + RFECV | Interpretability | SHAP, LIME, permutation importance |
| Baseline models | LR, NB, DT, RF, GB, MLP, LGBM, KNN, XGB, CatBoost, SVM-RBF | DL models | TabNet, 1D-CNN, FT-Transformer |
| Ensemble models | Meta-stacking, weighted ensemble, cascaded DL | Optimizer | Adam |
| Learning rate | 0.001 | Batch size | 32 |
| Maximum epochs | 100 | Early stopping | Enabled; patience = 10 |
| Evaluation metrics | Accuracy, Precision, Recall, F1, ROC-AUC, PR-AUC | Statistical testing | McNemar, Wilcoxon, DeLong |
| Bootstrap analysis | 1000 iterations for AUC CI | Threshold optimization | Youden Index |
| Calibration methods | Platt scaling, Isotonic regression | Calibration metrics | Brier, ECE, MCE |
Table 3.
Performance of baseline ML models across Dataset 1 and Dataset 2.
| Dataset | Model | AUC | Accuracy | Recall | Spec | F1 | AUPRC |
|---|---|---|---|---|---|---|---|
| Dataset 1 | LR | 0.8833 | 0.7966 | – | – | – | 0.9575 |
| NB | 0.8167 | 0.6780 | – | – | – | 0.9382 | |
| DT | 0.8212 | 0.8136 | – | – | – | 0.8956 | |
| GB | 0.9424 | 0.9322 | – | – | – | 0.9739 | |
| RF | 0.9235 | 0.8475 | – | – | – | 0.9698 | |
| MLP | 0.9515 | 0.8983 | – | – | – | 0.9825 | |
| LGBM | 0.9788 | 0.9322 | – | – | – | 0.9923 | |
| KNN | 0.9455 | 0.7797 | – | – | – | 0.9773 | |
| XGB | 0.9439 | 0.8983 | – | – | – | 0.9781 | |
| CatBoost | 0.9470 | 0.9322 | – | – | – | 0.9801 | |
| SVM | 0.9530 | 0.8983 | – | – | – | 0.9828 | |
| Dataset 2 | LR | 0.9425 | 0.8056 | 0.9091 | 0.7179 | 0.8108 | 0.9355 |
| NB | 0.9270 | 0.8333 | 0.8788 | 0.7949 | 0.8286 | 0.8736 | |
| RF | 0.9266 | 0.8333 | 0.9091 | 0.7692 | 0.8333 | 0.9277 | |
| XGB | 0.9145 | 0.8472 | 0.9394 | 0.7692 | 0.8493 | 0.8783 | |
| LGBM | 0.9106 | 0.8472 | 0.9394 | 0.7692 | 0.8493 | 0.8845 | |
| GB | 0.9060 | 0.8333 | 0.9091 | 0.7692 | 0.8333 | 0.8969 | |
| KNN | 0.8761 | 0.8194 | 0.8788 | 0.7692 | 0.8169 | 0.8173 | |
| SVM | 0.8741 | 0.7778 | 0.9394 | 0.6410 | 0.7949 | 0.8768 | |
| MLP | 0.8648 | 0.7500 | 0.9394 | 0.5897 | 0.7750 | 0.8586 | |
| DT | 0.8081 | 0.8194 | 0.8788 | 0.7692 | 0.8169 | 0.7027 |
Table 4.
Performance of DL models across Dataset 1 and Dataset 2.
| Dataset | Model | AUC | Acc | Recall | Spec | F1 | AUPRC |
|---|---|---|---|---|---|---|---|
| Dataset 1 | TabNet | 0.9167 | 0.8136 | 0.7955 | 0.8667 | 0.8642 | 0.9715 |
| ResCNN | 0.9894 | 0.9153 | 0.9773 | 0.7333 | 0.9451 | 0.9966 | |
| TabTransformer | 0.9818 | 0.9322 | 0.9545 | 0.8667 | 0.9545 | 0.9940 | |
| Dataset 2 | ResCNN | 0.9293 | 0.7639 | 0.9697 | 0.5897 | 0.7901 | 0.9197 |
| TabTransformer | 0.9192 | 0.7917 | 0.8485 | 0.7436 | 0.7887 | 0.9047 | |
| TabNet | 0.8516 | 0.7500 | 0.7879 | 0.7179 | 0.7429 | 0.8068 |
Table 5.
Performance of proposed ensemble models across Dataset 1 and Dataset 2.
| Dataset | Model | AUC | Acc | Recall | Spec | F1 | AUPRC |
|---|---|---|---|---|---|---|---|
| Dataset 1 | MetaStacking | 0.9530 | 0.9153 | 0.9773 | 0.7333 | 0.9451 | 0.9832 |
| HybridEnsemble | 0.9924 | 0.9153 | 0.9773 | 0.7333 | 0.9451 | 0.9976 | |
| CascadedDL2 | 0.9742 | 0.9322 | 0.9773 | 0.8000 | 0.9556 | 0.9905 | |
| Dataset 2 | HybridEnsemble | 0.9386 | 0.8056 | 0.9697 | 0.6667 | 0.8205 | 0.9326 |
| CascadedDL2 | 0.9207 | 0.8194 | 0.9394 | 0.7179 | 0.8267 | 0.9057 | |
| MetaStacking | 0.8998 | 0.8472 | 0.8485 | 0.8462 | 0.8358 | 0.8950 |
Table 6.
Comparison of the proposed framework with recent PD detection methods.
| Study | Year | Data Type | Method | Acc. | AUC | Recall | F1 | AUPRC | XAI | Calib. | Stat. | Abl. | Opt. |
|---|---|---|---|---|---|---|---|---|---|---|---|---|---|
| Rao et al. [4] | 2024 | Speech signals | ML-based speech feature analysis | 0.8900 | 0.9100 | 0.9000 | 0.8900 | – | × | × | × | × | × |
| Rahman et al. [1] | 2025 | Biomedical PD data | AI-based early PD detection | 0.9000 | 0.9200 | 0.9100 | 0.9000 | – | × | × | × | × | × |
| Shen et al. [7] | 2025 | Voice analysis | XAI with hybrid neural modeling | 0.9111 | 0.9125 | 0.9250 | 0.9113 | – | × | × | × | × | |
| Xu et al. [27] | 2025 | Speech/acoustic features | Interpretable ML model | 0.7740 | 0.9360 | 0.7810 | 0.8410 | – | × | × | × | ||
| Motamedi et al. [25] | 2025 | PD severity data | Optimized feature selection with ensemble ML | 0.9100 | 0.9400 | 0.9200 | 0.9100 | – | × | × | × | × | |
| Proposed Meta-Stacking | 2026 | Dataset 1 | Stacked ML/DL prediction fusion | 0.9153 | 0.9530 | 0.9773 | 0.9451 | 0.9832 | |||||
| Proposed Hybrid Ensemble | 2026 | Dataset 1 | Weighted ML + DL ensemble | 0.9153 | 0.9924 | 0.9773 | 0.9451 | 0.9976 | |||||
| Proposed Cascaded DL2 | 2026 | Dataset 1 | DL prediction-enhanced CatBoost cascade | 0.9322 | 0.9742 | 0.9773 | 0.9556 | 0.9905 |
Table 7.
Optuna-based optimization results for proposed models.
| Model | Optimized AUC | Trials | Key Optimized Parameters |
|---|---|---|---|
| Meta-Stacking (P1) | 0.9485 | 20 | RF trees/depth; XGBoost learning rate/depth; meta-classifier regularization |
| Hybrid Ensemble (P2) | 0.9924 | 200 | Ensemble weights (RF, TabNet, Transformer, CNN) |
| Cascaded DL2 (P3) | 0.9848 | 30 | CatBoost gate depth; learning rate; L2 regularization |
Table 8.
Comprehensive statistical evaluation across Dataset 1 and Dataset 2, including bootstrap confidence intervals, McNemar’s test, and Wilcoxon signed-rank test.
Table 8.
Comprehensive statistical evaluation across Dataset 1 and Dataset 2, including bootstrap confidence intervals, McNemar’s test, and Wilcoxon signed-rank test.
| Dataset | Model | AUC | 95% CI | p-value (McNemar) | p-value (Wilcoxon) | |
|---|---|---|---|---|---|---|
| Dataset 1 | RF | 0.9235 | [0.8227, 1.0000] | – | – | – |
| LightGBM | 0.9788 | [0.9331, 1.0000] | – | – | – | |
| XGBoost | 0.9439 | [0.8655, 0.9967] | – | – | – | |
| TabNet | 0.9167 | [0.8270, 0.9816] | – | – | – | |
| Meta-Stacking | 0.9530 | [0.8901, 0.9952] | 1.500 | 0.2207 | 0.0625 | |
| Hybrid Ensemble | 0.9924 | [0.9702, 1.0000] | 1.125 | 0.2888 | – | |
| Cascaded DL2 | 0.9742 | [0.9142, 1.0000] | 2.286 | 0.1306 | – | |
| Dataset 2 | RF | 0.9266 | [0.8572, 0.9810] | – | – | – |
| Meta-Stacking | 0.8998 | [0.8269, 0.9627] | 0.000 | 1.0000 | – | |
| Hybrid Ensemble | 0.9386 | [0.8810, 0.9799] | 0.167 | 0.6831 | – | |
| Cascaded DL2 | – | – | 0.000 | 1.0000 | – |
Table 9.
Calibration metrics across Dataset 1 and Dataset 2.
| Dataset | Model | ECE | MCE | Brier Score |
|---|---|---|---|---|
| Dataset 1 | RF | 0.1380 | 0.7500 | 0.1055 |
| LightGBM | 0.0629 | 0.8646 | 0.0533 | |
| TabNet | 0.1635 | 0.6664 | 0.1212 | |
| Meta-Stacking | 0.0838 | 0.8321 | 0.0783 | |
| Hybrid Ensemble | 0.0559 | 0.7316 | 0.0487 | |
| Cascaded DL2 | 0.0617 | 0.5766 | 0.0529 | |
| Dataset 2 | RF | 0.1332 | 0.4493 | 0.1273 |
| LightGBM | 0.1249 | 0.8404 | 0.1309 | |
| TabNet | 0.0968 | 0.4461 | 0.1620 | |
| Meta-Stacking | 0.1306 | 0.4560 | 0.1399 | |
| Hybrid Ensemble | 0.2756 | 0.3803 | 0.1764 | |
| Cascaded DL2 | 0.1554 | 0.6649 | 0.1410 |
Disclaimer/Publisher’s Note: The statements, opinions and data contained in all publications are solely those of the individual author(s) and contributor(s) and not of MDPI and/or the editor(s). MDPI and/or the editor(s) disclaim responsibility for any injury to people or property resulting from any ideas, methods, instructions or products referred to in the content. |
© 2026 by the authors. Licensee MDPI, Basel, Switzerland. This article is an open access article distributed under the terms and conditions of the Creative Commons Attribution (CC BY) license (http://creativecommons.org/licenses/by/4.0/).
Copyright: This open access article is published under a Creative Commons CC BY 4.0 license, which permit the free download, distribution, and reuse, provided that the author and preprint are cited in any reuse.


