

Submitted:
11 July 2026
Posted:
14 July 2026
You are already at the latest version
Abstract
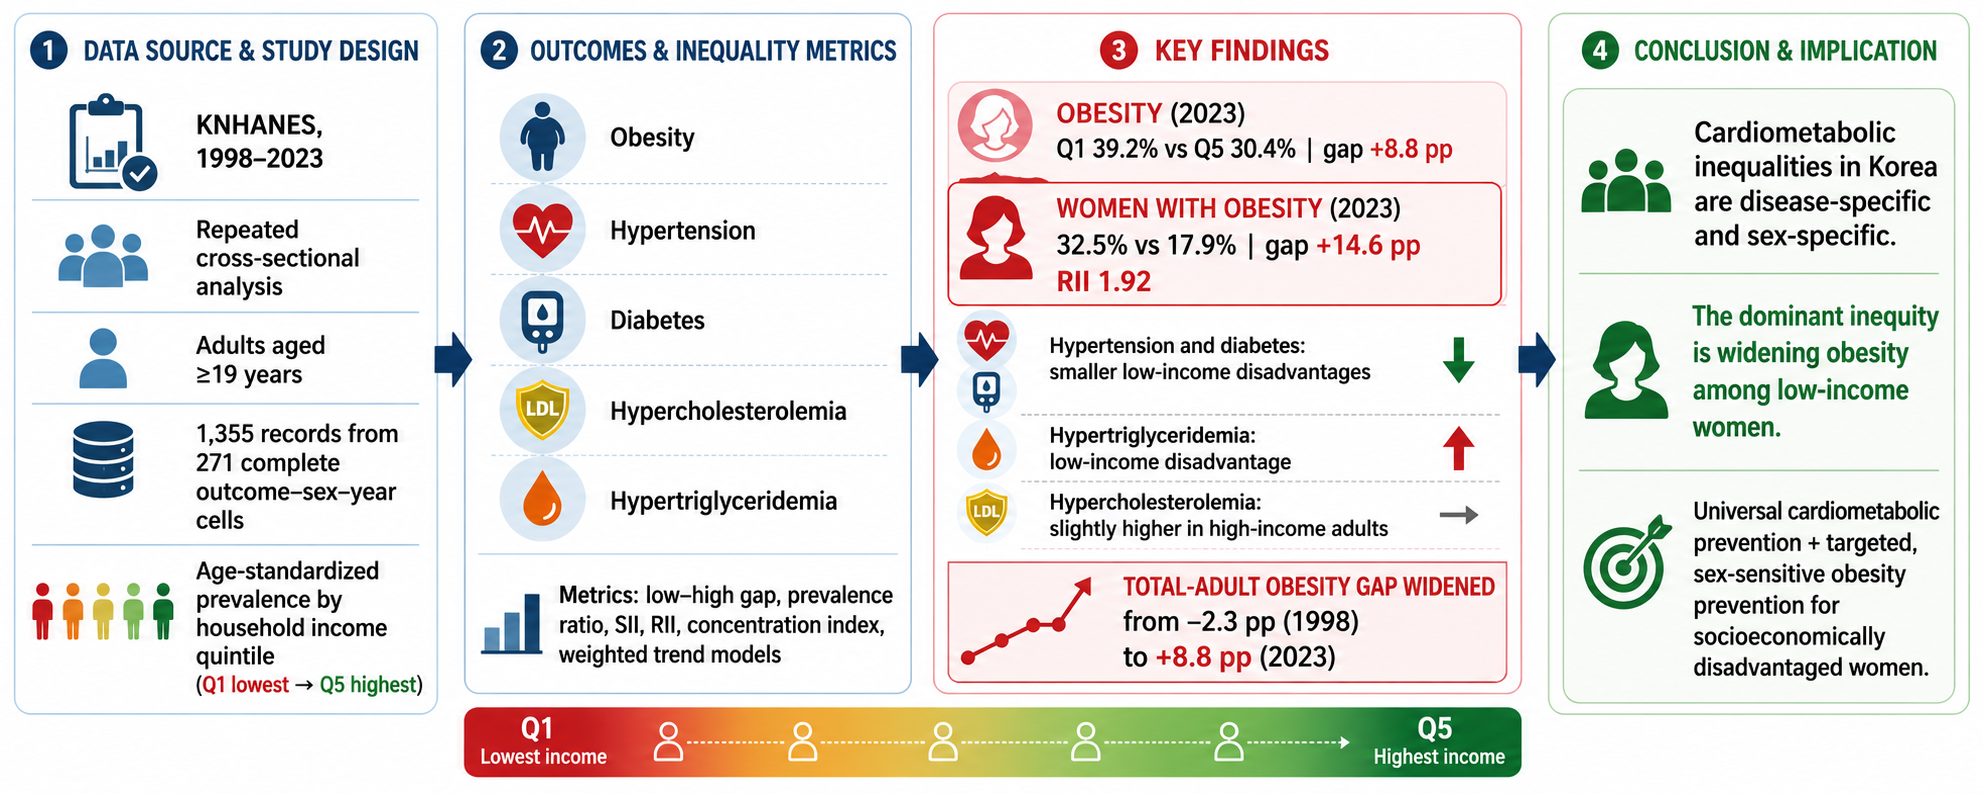
Purpose: To quantify income-related inequalities in the prevalence of major cardiometabolic diseases among Korean adults and to determine whether patterns differed by outcome and sex from 1998 to 2023.Methods: We conducted a repeated cross-sectional analysis of publicly available aggregate statistics from the Korea National Health and Nutrition Examination Survey. Age-standardized prevalence estimates by household income quintile, sex, outcome, and survey year were extracted for adults aged 19 years or older. Outcomes were obesity, hypertension, diabetes, hypercholesterolemia, and hypertriglyceridemia. We estimated low-minus-high income gaps, prevalence ratios, slope and relative indices of inequality, grouped concentration indices, and inverse-variance weighted trends with robust standard errors and false-discovery-rate adjustment.Results: The analysis included 1,355 records from 271 complete outcome-sex-year cells. In 2023, obesity showed the largest inequality: prevalence was 39.2% in the lowest-income quintile and 30.4% in the highest-income quintile, an 8.8-percentage-point gap. Among women, the obesity gap was 14.6 percentage points, and the relative index of inequality was 1.92. Hypertension, diabetes, and hypertriglyceridemia showed smaller low-income disadvantages, whereas hypercholesterolemia did not. The total adult obesity gap changed from -2.3 percentage points in 1998 to 8.8 percentage points in 2023.Conclusions: Korean cardiometabolic inequalities are disease-specific and sex-specific, dominated by widening obesity inequality among lower-income women.
Keywords:
cardiometabolic disease
; health inequality
; income
; obesity
; Korea National Health and Nutrition Examination Survey
; slope index of inequality
Introduction
Cardiometabolic conditions, including obesity, hypertension, diabetes, and dyslipidemia, are leading contributors to non-communicable disease burden. Their distribution is not random across society. International evidence links lower socioeconomic position to adverse cardiovascular and metabolic outcomes through material resources, education, occupation, neighborhood environments, food systems, psychosocial stress, health literacy, and access to prevention and care [37,38,39,40,41,42,43,44,45]. For epidemiologic prevention, therefore, national surveillance must move beyond average prevalence and quantify who carries the burden.
Korea is a valuable setting for such surveillance because the Korea National Health and Nutrition Examination Survey (KNHANES) provides a repeated, nationally representative health examination, interview, and nutrition data system [1,2]. Korean surveillance studies and disease fact sheets have documented substantial changes in obesity, hypertension, diabetes, dyslipidemia, dietary intake, and chronic-disease management over the past two decades [4,5,6,7,8,9,10,11,12]. However, national averages can obscure whether cardiometabolic conditions are becoming more concentrated among lower-income adults, higher-income adults, or neither.
The Korean literature suggests that socioeconomic patterning differs across cardiometabolic outcomes. Previous KNHANES-based studies have shown stronger socioeconomic gradients in obesity among women, income-related disparities in hypertension and diabetes, and less uniform patterns for dyslipidemia and metabolic syndrome [13,14,15,16,17,18,19,20,21,22,23,24,25]. These studies provide an essential foundation, but many used earlier survey periods, focused on one or two outcomes, or did not compare simple extreme-group contrasts with full-gradient inequality metrics. Methodological work recommends reporting both absolute and relative measures and using the slope index of inequality (SII), relative index of inequality (RII), and concentration index when social groups are ordered [26,27,28,29,30,31,32,33,34].
A focused literature analysis, therefore, suggests three unresolved questions: first, whether obesity remains the dominant socioeconomic inequality after the COVID-19 period, as reflected in the latest available official tables. Second, whether the female obesity gradient is still strong when full income gradients are considered rather than only binary income contrasts. Third, whether lipid outcomes should be interpreted as a single dyslipidemia construct or as separate components with different social patterning is important for epidemiologic prevention, as a single cardiometabolic summary could hide outcome-specific intervention priorities.
This study updated the Korean cardiometabolic equity profile through 2023 using official age-standardized KNHANES aggregate statistics. We compared five outcomes, three sex strata, low-high contrasts, SII, RII, grouped concentration indices, and weighted inequality trends. The purpose was epidemiologic surveillance rather than causal explanation: to identify which outcomes show the clearest low-income disadvantage, whether this pattern differs between men and women, and how inequalities have changed over time.
Methods
Study design and data source
We conducted a repeated cross-sectional analysis of publicly available aggregate statistics from the Korea National Health Statistics based on the KNHANES. KNHANES is a nationally representative survey of the noninstitutionalized Korean population using a complex sampling design and standardized health examination, interview, and nutrition protocols [1,2]. The analysis followed relevant STROBE reporting principles for observational research [36].
Because the analysis used secondary, publicly available aggregate data, the inferential aim was not to estimate individual-level causal effects. Instead, the study was designed to add epidemiologic value by reanalyzing official prevalence estimates with inequality metrics that are not routinely presented together across outcomes, sex strata, and time. This design is appropriate for surveillance, hypothesis generation, and identifying priorities for subsequent individual-level modeling.
We used chronic-disease Excel tables released with the 2023 Korea National Health Statistics workbooks. The analytic population was adults aged 19 years or older. The primary estimates were official adult age-standardized prevalence rows by household income quintile. Age standardization was used because the Korean adult population aged substantially during the study period and because cardiometabolic prevalence and socioeconomic patterning are age-dependent. Official KNHANES trend estimates are age-standardized to the 2005 Korean estimated population.
Socioeconomic position, sex strata, and outcomes
Socioeconomic position was the household income quintile. In the official tables, income is based on monthly equivalized household income, calculated as monthly household income divided by the square root of household size, and classified into quintiles by sex and 5-year age group. Quintiles were ordered from lowest income (Q1) to highest income (Q5) and treated as an ordered socioeconomic rank.
The official aggregate tables provided strata labeled total adults, men, and women. We use these labels as supplied by KNHANES; sex-specific biological and gendered social mechanisms could not be separated in aggregate data and are discussed as limitations. Five outcomes were analyzed: obesity (body mass index >= 25 kg/m2), hypertension (systolic blood pressure >= 140 mmHg, diastolic blood pressure >= 90 mmHg, or antihypertensive medication), diabetes (fasting glucose >= 126 mg/dL, physician diagnosis, glucose-lowering medication or insulin use, or HbA1c >= 6.5%), hypercholesterolemia (total cholesterol >= 240 mg/dL or cholesterol-lowering medication), and hypertriglyceridemia (triglycerides >= 200 mg/dL). These definitions followed the wording of the official table.
Data extraction and quality control
A reproducible Python script parsed the chronic-disease trend sheets for each outcome. The script identified year columns, sex blocks, age-standardized income-quintile rows, prevalence estimates, standard errors, and sample sizes. Extracted records were restricted to age-standardized income-quintile estimates for total adults, men, and women. Quality-control checks verified that all five income quintiles were available for each outcome-sex-year cell and compared extracted values against the original workbook layouts.
Inequality measures and trend analysis
The primary simple absolute measure was the low-minus-high income gap, calculated as prevalence in Q1 minus prevalence in Q5. A positive value indicates higher prevalence in the lowest-income quintile. The corresponding relative measure was the Q1/Q5 prevalence ratio. Approximate standard errors for gaps were calculated from published standard errors for Q1 and Q5, assuming independence; log-ratio confidence intervals were used by the delta method.
To use information from all five quintiles, each income quintile was assigned an equal-population RIT score, coded from 0.1 for the highest quintile to 0.9 for the lowest. The SII was estimated by weighted linear regression of prevalence on the disadvantage-coded RIT score. The RII was estimated by weighted log-linear regression. A grouped concentration index was calculated as a supporting measure of whether prevalence was concentrated among lower- or higher-income adults [26,27,28,29,30,31,32,33,34].
For each outcome and sex, we summarized the first available years, 2019 and 2023. Availability differed by outcome: obesity, hypertension, and hypertriglyceridemia were available from 1998; hypercholesterolemia from 2005; and diabetes from 2011. Trends in low-minus-high gaps and SII values were modeled using inverse-variance weighted least squares with heteroskedasticity-robust standard errors. p values were adjusted across trend tests using the Benjamini-Hochberg false discovery rate method [35]. Analyses were descriptive and intended for surveillance interpretation.
Ethics
This study used publicly available, anonymized aggregate statistics and did not involve recruitment of human participants, intervention, access to identifiable personal data, or use of individual-level microdata. Institutional ethics approval and additional informed consent were therefore not required for this secondary aggregate-data analysis.
Results
The extracted file contained 1357 age-standardized prevalence records across five outcomes, three sex strata, five income quintiles, and repeated survey years. Two records were excluded from inequality modeling because complete quintile information was unavailable, leaving 1355 records across 271 complete outcome-sex-year cells. Outcome availability is summarized in Table 1.
In 2023, obesity showed the largest income-related inequality (Table 2 and Figure 1). Among total adults, obesity prevalence was 39.2% in Q1 and 30.4% in Q5, corresponding to an 8.8 percentage-point gap (95% CI, 3.9 to 13.7), a prevalence ratio of 1.29 (95% CI, 1.12 to 1.49), an SII of 10.3 percentage points, and an RII of 1.34. This pattern indicates a lower-income concentration across the income hierarchy rather than an isolated difference between the two extreme quintiles.
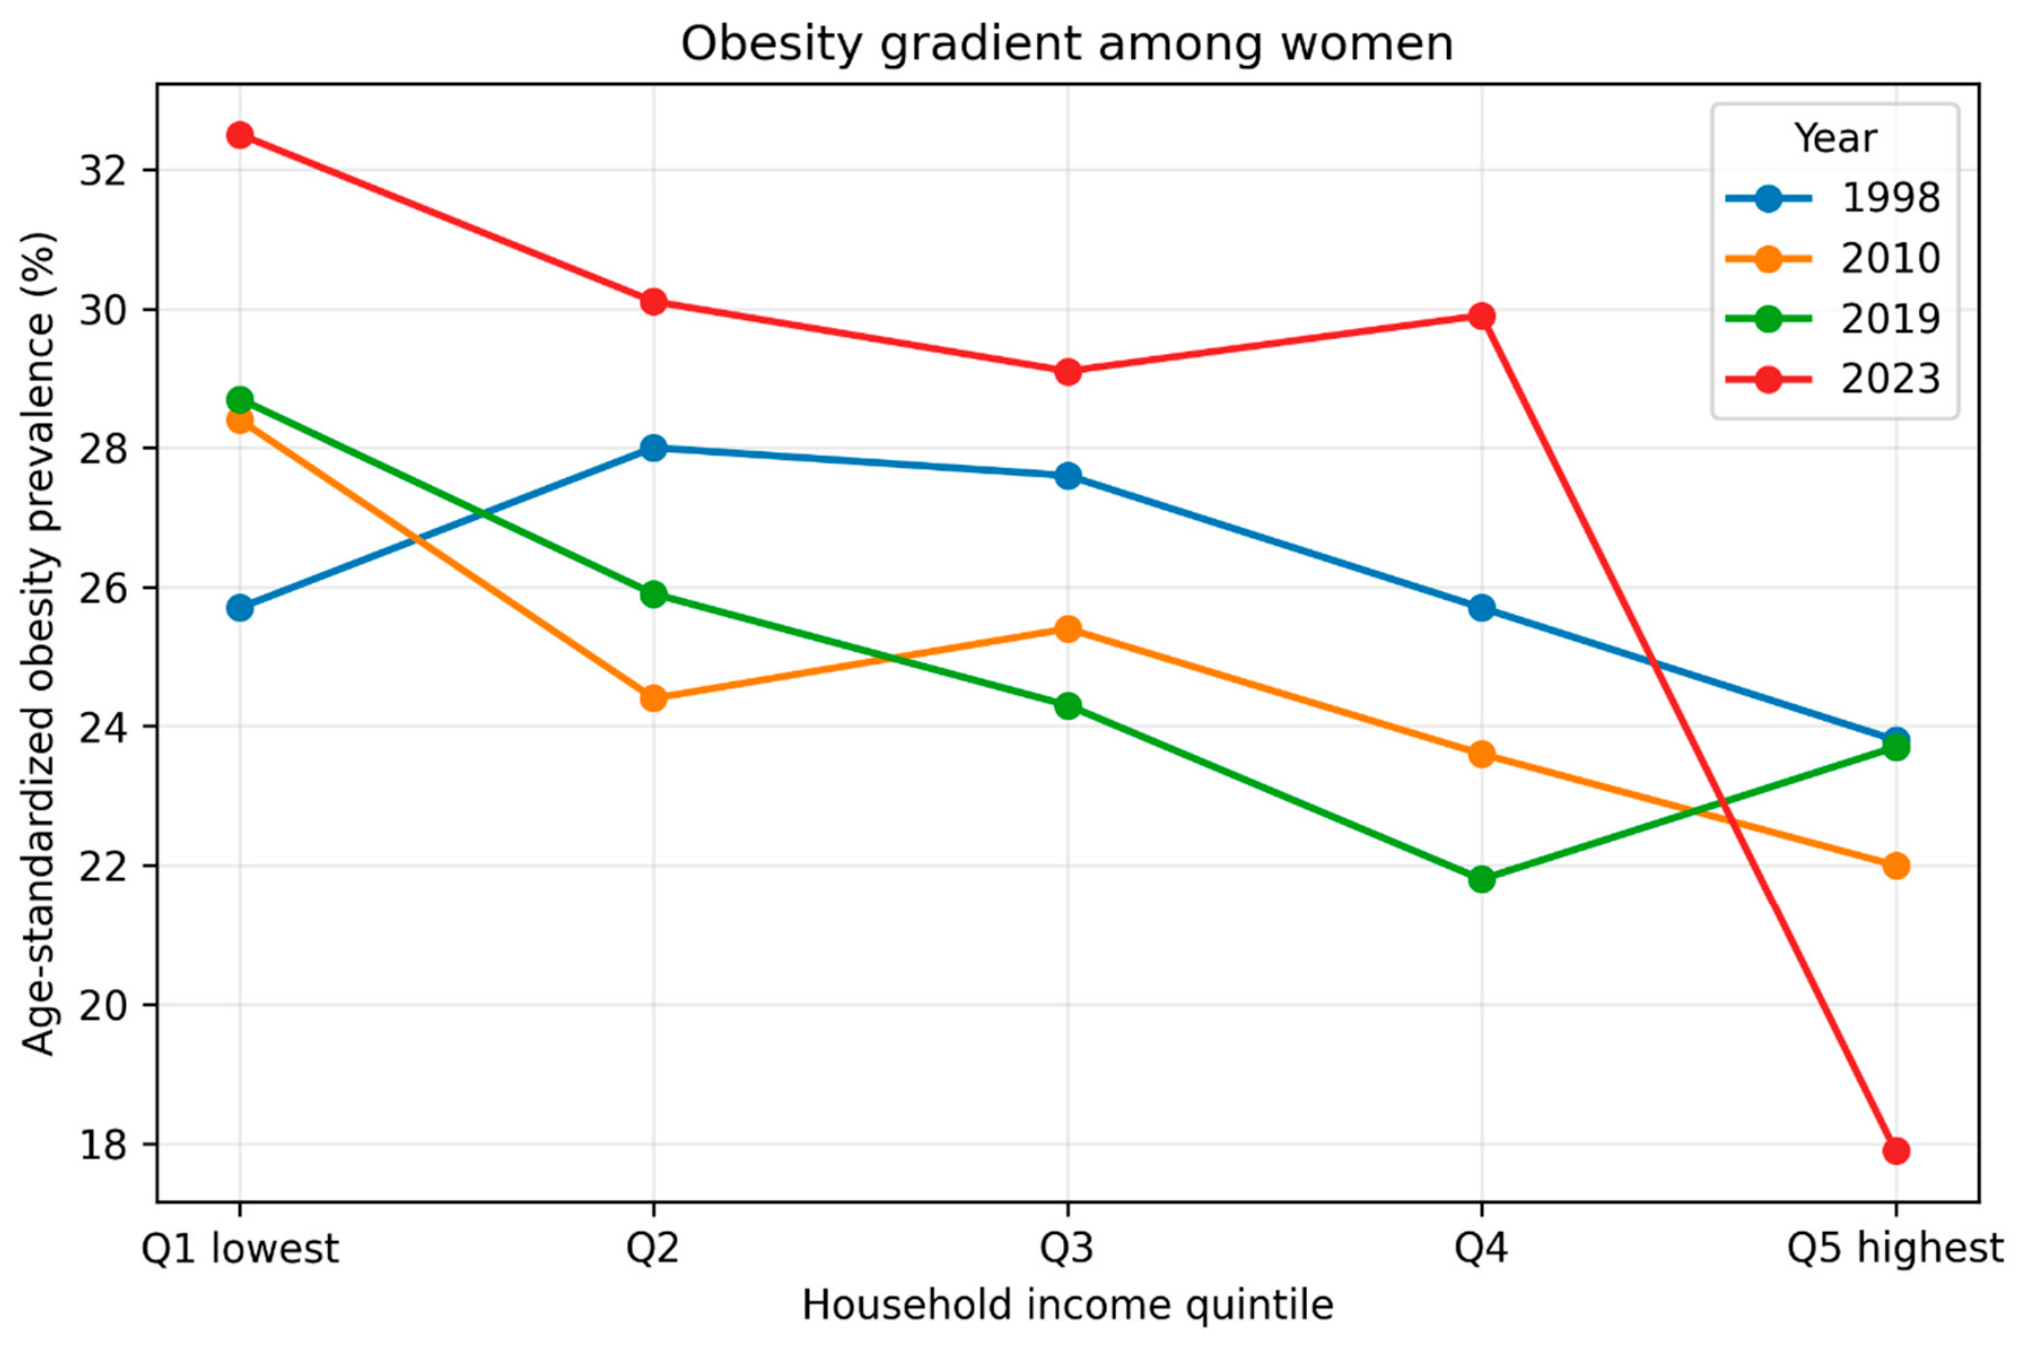
The obesity gradient was strongly sex-specific. Among women, prevalence was 32.5% in Q1 and 17.9% in Q5, yielding a 14.6 percentage-point gap (95% CI, 8.9 to 20.3), a prevalence ratio of 1.82, and an RII of 1.92. Among men, the corresponding gap was 2.5 percentage points, and the RII was 1.10. The female obesity gradient was visible across income quintiles in selected survey years (Figure 3).
Hypertension and diabetes showed smaller low-income disadvantages in 2023. Among total adults, the hypertension gap was 2.2 percentage points, and the RII was 1.16; the diabetes gap was 1.7 percentage points, and the RII was 1.28. Hypertriglyceridemia was also more prevalent among lower-income adults, with a total-adult gap of 1.6 percentage points and an RII of 1.21. In contrast, hypercholesterolemia did not show a low-income disadvantage: prevalence was 19.8% in Q1 and 21.5% in Q5, producing a −1.7 percentage-point gap and RII of 0.89.
The largest temporal change was observed for obesity (Table 3 and Figure 2). Among total adults, the low-minus-high gap changed from −2.3 percentage points in 1998 to 8.8 percentage points in 2023, a net widening of 11.1 percentage points. The inverse-variance weighted annual increase in the gap was 0.35 percentage points per year (95% CI, 0.17 to 0.53; false-discovery-rate q = 0.001). Among women, the gap increased from 1.9 to 14.6 percentage points. Among men, it changed by 2.5 percentage points. Diabetes shifted from a slight high-income disadvantage in 2011 to a low-income disadvantage in 2023 among total adults, whereas hypercholesterolemia moved toward slightly higher prevalence among higher-income adults.
Figure 2.
Trends in low-minus-high income gaps among total adults. Lines show absolute income gaps across available survey years for each cardiometabolic outcome among total adults. Positive values indicate concentration among lower-income adults. Availability differed by outcome according to the official table release years.
Figure 2.
Trends in low-minus-high income gaps among total adults. Lines show absolute income gaps across available survey years for each cardiometabolic outcome among total adults. Positive values indicate concentration among lower-income adults. Availability differed by outcome according to the official table release years.
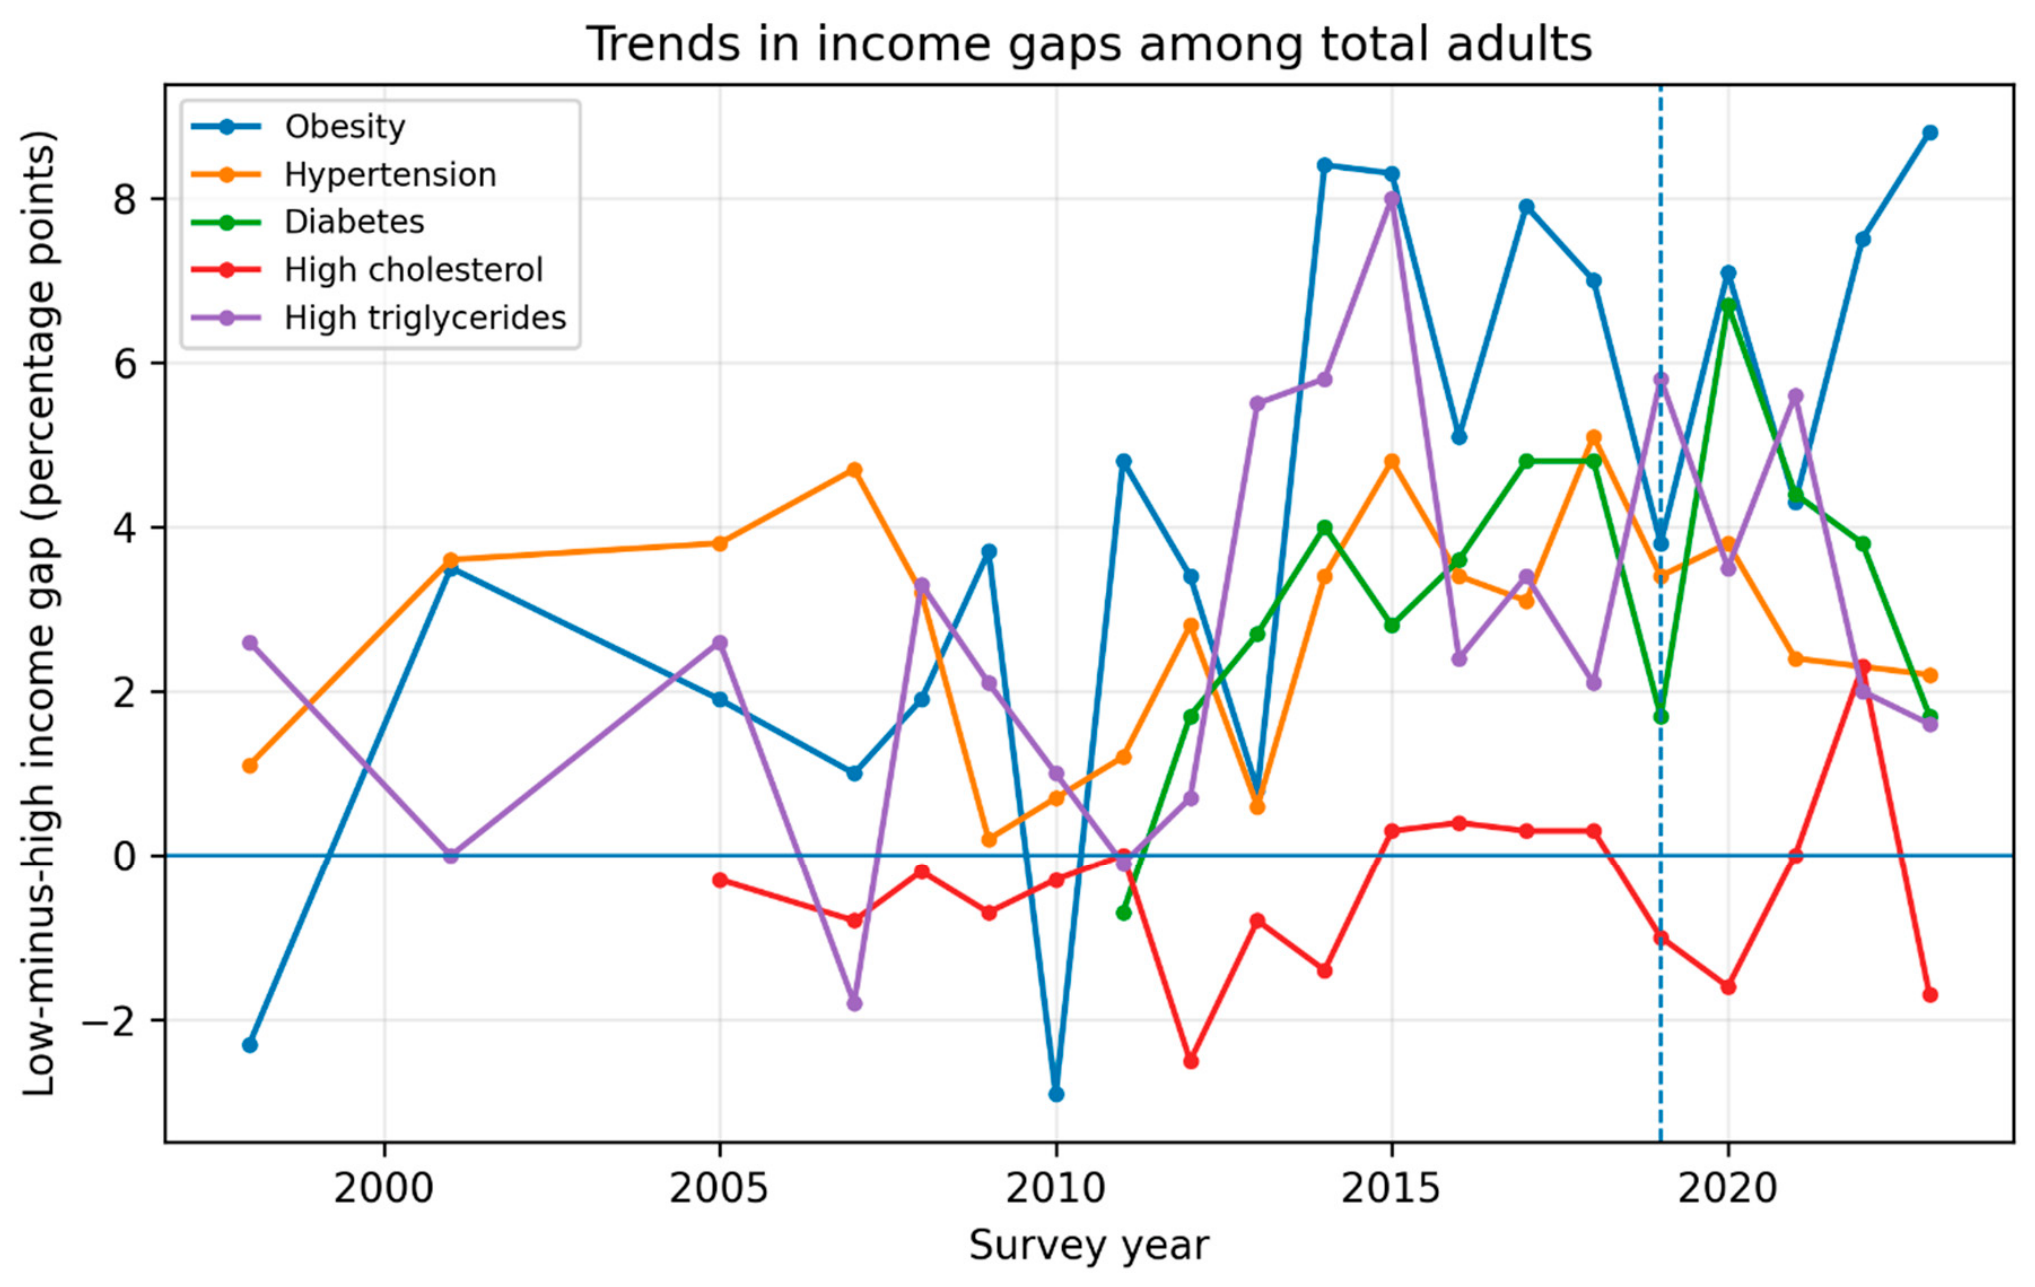
Figure 3.
Obesity prevalence among women by income quintile across selected years. Age-standardized obesity prevalence among women is shown for selected years to illustrate the emergence and widening of the full income gradient. Q1 denotes the lowest income quintile and Q5 the highest income quintile.
Figure 3.
Obesity prevalence among women by income quintile across selected years. Age-standardized obesity prevalence among women is shown for selected years to illustrate the emergence and widening of the full income gradient. Q1 denotes the lowest income quintile and Q5 the highest income quintile.
Discussion
This repeated cross-sectional analysis of official KNHANES aggregate statistics shows that socioeconomic inequalities in Korean cardiometabolic disease are disease-specific and sex-specific rather than uniform. The dominant finding is a large and widening low-income disadvantage in obesity, especially among women. Hypertension, diabetes, and hypertriglyceridemia showed smaller low-income disadvantages, while hypercholesterolemia followed a different pattern in the latest year.
The obesity findings extend earlier Korean evidence. Prior KNHANES studies reported stronger obesity inequality among women and socioeconomic gradients in several cardiovascular risk factors [13,14,15,16,17,18]. Our analysis confirms that this pattern remains visible through 2023 using updated official age-standardized estimates and both simple and rank-based inequality metrics. The stronger gradient among women is also consistent with broader literature showing that socioeconomic gradients in obesity differ by sex and by stage of nutrition transition [40,41,42,44].
The comparison across outcomes is central. If obesity, hypertension, diabetes, and lipid indicators had all shown similar gradients, a single broad cardiometabolic inequality narrative would have been sufficient. Instead, the evidence indicates a more precise epidemiologic profile: obesity is the largest and most rapidly widening inequality; diabetes and hypertension show smaller low-income disadvantages; and lipid outcomes diverge. This distinction matters because obesity prevention, blood-pressure control, glycemic screening, and lipid management depend on different combinations of behavior, clinical care, medication access, and environmental policy.
The heterogeneous lipid findings are epidemiologically important. Hypercholesterolemia and hypertriglyceridemia are often discussed under the common label of dyslipidemia, yet they may reflect different combinations of adiposity, diet, alcohol intake, medication use, screening, diagnosis, and treatment [11,12,22]. A higher prevalence of hypercholesterolemia in higher-income groups should not be interpreted as lower metabolic risk among disadvantaged adults; it may reflect detection and lipid-lowering treatment patterns and should be interpreted alongside triglycerides, obesity, diabetes, and hypertension.
Several mechanisms may plausibly contribute to the widening low-income obesity gap. Lower-income adults may experience greater exposure to energy-dense diets, irregular work schedules, constrained leisure-time physical activity, limited access to preventive health resources, and higher chronic stress. Among women, household caregiving burden, labor-market conditions, pregnancy-related weight retention, social norms, and socioeconomic differences in health-related opportunities may intensify the gradient. These mechanisms could not be tested with aggregate data and should be examined using individual-level KNHANES microdata.
The findings support a prevention strategy that does not rely only on national averages. Universal cardiometabolic prevention remains necessary, but obesity prevention should include targeted, sex-sensitive strategies for socioeconomically disadvantaged women. Examples include affordable healthy-food environments, community-based physical activity opportunities, workplace interventions for irregular or low-wage workers, health-literacy support, and primary-care counseling that is realistic for lower-income households. For hypertension, diabetes, and lipid outcomes, surveillance should separate prevalence, diagnosis, treatment, and control to avoid confusing disease occurrence with healthcare access.
Future work should use individual-level KNHANES microdata to test the mechanisms suggested by this aggregate analysis. Important extensions include survey-weighted regression with age, education, occupation, region, marital status, employment, food insecurity, alcohol use, physical activity, medication use, and health-care access; decomposition of absolute inequality into compositional and coefficient components; and age-period-cohort approaches to distinguish birth-cohort patterns from period effects. Such analyses could clarify whether the female obesity gradient reflects differential exposure, differential vulnerability, differential healthcare contact, or interactions among these pathways.
This study has strengths relevant to epidemiologic surveillance: it used nationally representative official statistics, covered five outcomes over a long period, compared total adults, men, and women, and applied absolute, relative, and full-gradient inequality measures. The main limitation is that the analysis used published aggregate statistics rather than individual-level KNHANES microdata. Therefore, survey-weighted multivariable adjustment, causal mediation, age-specific modeling, and formal income-by-sex interaction tests could not be performed. SII, RII, and concentration indices were approximated from grouped quintile data and should be interpreted as surveillance measures. Confidence intervals for some inequality metrics were approximate because the covariance between income-quintile estimates was unavailable. Changes in diagnosis, measurement protocols, and medication use may also affect temporal comparisons, especially for diabetes and hypercholesterolemia.
In conclusion, Korea’s cardiometabolic equity profile is dominated by widening socioeconomic disadvantage in obesity, particularly among women. Hypertension, diabetes, and hypertriglyceridemia show smaller low-income disadvantages, whereas hypercholesterolemia does not follow the same gradient. Routine cardiometabolic surveillance should report disease-specific, sex-specific, and income-sensitive inequality metrics alongside national prevalence.
Author Contributions
R.K.M.A.D. conceptualized the study, curated the aggregate data, designed the analysis, interpreted the results, and drafted the manuscript. Additional author contributions should be completed after the final author list is confirmed.
Funding
None.
Data Statement
All data generated or analyzed during this study are included in this article and Supplementary Files. Source: KNHANES public statistics are available from the Korea Disease Control and Prevention Agency/Korea National Health Statistics website. Derived analytic CSV files, figure source data, and Python scripts used to calculate inequality metrics and to create figures are included in the submission package.
Acknowledgments
None.
Declaration of Competing Interests
The author declares no competing interests.
Declaration of Generative AI and AI-Assisted Technologies in the Manuscript Preparation Process
During the preparation of this work, the author used ChatGPT to assist with language editing, organization, and journal-format preparation. After using this tool, the author reviewed and edited the content as needed and takes full responsibility for the publication’s content.
References
- Kweon, S.; Kim, Y.; Jang, M.J.; Kim, Y.; Kim, K.; Choi, S.; et al. Data resource profile: The Korea National Health and Nutrition Examination Survey (KNHANES). Int. J. Epidemiol. 2014, 43, 69–77. [Google Scholar] [CrossRef] [PubMed]
- Oh, K.; Kim, Y.; Kweon, S.; Kim, S.; Yun, S.; Park, S.; et al. Korea National Health and Nutrition Examination Survey, 20th anniversary: Accomplishments and future directions. Epidemiol. Health 2021, 43, e2021025. [Google Scholar] [CrossRef] [PubMed]
- Lee, H.A.; Kim, H.R.; Park, H.; Jung, S.Y.; Jeon, J.P.; Park, B.; et al. Data Resource Profile: The Statistics of the Korea National Health and Nutrition Examination Survey Biobank Project. J. Korean Med. Sci. 2025, 40, e189. [Google Scholar] [CrossRef] [PubMed]
- Kim, Y.; Nho, S.J.; Woo, G.; Kim, H.; Park, S.; Kim, Y.; et al. Trends in the prevalence and management of major metabolic risk factors for chronic disease over 20 years: Findings from the 1998-2018 Korea National Health and Nutrition Examination Survey. Epidemiol. Health 2021, 43, e2021028. [Google Scholar] [CrossRef] [PubMed]
- Lee, G.B.; Kim, Y.; Park, S.; Kim, H.C.; Oh, K. Obesity, hypertension, diabetes mellitus, and hypercholesterolemia in Korean adults before and during the COVID-19 pandemic: A special report of the 2020 Korea National Health and Nutrition Examination Survey. Epidemiol. Health 2022, 44, e2022041. [Google Scholar] [CrossRef] [PubMed]
- Kweon, S.; Park, J.Y.; Park, M.; Kim, Y.; Kim, Y.; Kim, K.; et al. Trends in food and nutrient intake over 20 years: Findings from the 1998-2018 Korea National Health and Nutrition Examination Survey. Epidemiol. Health 2021, 43, e2021027. [Google Scholar] [CrossRef] [PubMed]
- Oh, K.; Park, S.; Park, S.; Yun, S.; Choi, H.; Jeong, E.K. Changes in food and nutrient intakes in Korean adults before and during the COVID-19 pandemic: Data from the 2011-2020 Korea National Health and Nutrition Examination Survey. Epidemiol. Health 2023, 45, e2023015. [Google Scholar] [CrossRef] [PubMed]
- Jeong, S.M.; Jung, J.H.; Yang, Y.S.; Kim, W.; Cho, I.Y.; Lee, Y.B.; et al. 2023 Obesity Fact Sheet: Prevalence of obesity and abdominal obesity in adults, adolescents, and children in Korea from 2012 to 2021. J. Obes. Metab. Syndr. 2024, 33, 27–35. [Google Scholar] [CrossRef] [PubMed]
- Kim, H.C.; Lee, H.; Lee, H.H.; Sohn, D.; Cho, M.; Shin, S.; et al. Korea Hypertension Fact Sheet 2023: Analysis of nationwide population-based data with a particular focus on hypertension in special populations. Clin. Hypertens. 2024, 30, 7. [Google Scholar] [CrossRef] [PubMed]
- Bae, J.H.; Han, K.D.; Ko, S.H.; Yang, Y.S.; Choi, J.H.; Choi, K.M.; et al. Diabetes Fact Sheet in Korea 2021. Diabetes Metab. J. 2022, 46, 417–426. [Google Scholar] [CrossRef] [PubMed]
- Jin, E.S.; Shim, J.S.; Kim, S.E.; Bae, J.H.; Kang, S.; Won, J.C.; et al. Dyslipidemia Fact Sheet in South Korea, 2022. Diabetes Metab. J. 2023, 47, 632–642. [Google Scholar] [CrossRef] [PubMed]
- Cho, S.M.J.; Lee, H.; Lee, H.H.; Baek, J.; Heo, J.E.; Joo, H.J.; et al. Dyslipidemia Fact Sheets in Korea 2020: An analysis of nationwide population-based data. J. Lipid Atheroscler. 2021, 10, 202–209. [Google Scholar] [CrossRef] [PubMed]
- Kim, Y.J.; Lee, J.S.; Park, J.; Choi, D.S.; Kim, D.M.; Lee, K.H.; et al. Trends in socioeconomic inequalities in five major risk factors for cardiovascular disease in the Korean population: A cross-sectional study using data from KNHANES, 2001-2014. BMJ Open 2017, 7, e014070. [Google Scholar] [CrossRef] [PubMed]
- Hwang, J.; Lee, E.Y.; Lee, C.G. Measuring socioeconomic inequalities in obesity among Korean adults, 1998-2015. Int. J. Environ. Res. Public Health 2019, 16, 1617. [Google Scholar] [CrossRef] [PubMed]
- Yoo, S.; Cho, H.J.; Khang, Y.H. General and abdominal obesity in South Korea, 1998–2007: Gender and socioeconomic differences. Prev. Med. 2010, 51, 460–465. [Google Scholar] [CrossRef] [PubMed]
- Choi, E.; Cho, H.N.; Seo, D.H.; Park, B.; Park, S.; Cho, J.; et al. Socioeconomic inequalities in obesity among Korean women aged 19-79 years: The 2016 Korean Study of Women’s Health-Related Issues. Epidemiol. Health 2019, 41, e2019005. [Google Scholar] [CrossRef] [PubMed]
- Kim, S.; Oh, J.; Heo, J.; Lee, H.Y.; Lee, J.K.; Subramanian, S.V.; et al. Socioeconomic inequalities in the prevalence of biomarkers of cardio-metabolic disease in South Korea: Comparison of the Health Examinees Study to a nationally representative survey. PLoS ONE 2018, 13, e0195091. [Google Scholar] [CrossRef] [PubMed]
- Kim, I.; Bahk, J.; Kim, Y.Y.; Lee, J.; Kang, H.Y.; Lee, J.; et al. Prevalence of overweight and income gaps in 245 districts of Korea: Comparison using the National Health Screening Database and the Community Health Survey, 2009–2014. J. Korean Med. Sci. 2018, 33, e3. [Google Scholar] [CrossRef] [PubMed]
- Cha, S.H.; Park, H.S.; Cho, H.J. Socioeconomic disparities in prevalence, treatment, and control of hypertension in middle-aged Koreans. J. Epidemiol. 2012, 22, 425–432. [Google Scholar] [CrossRef] [PubMed]
- Hwang, J.; Shon, C. Relationship between socioeconomic status and type 2 diabetes: Results from Korea National Health and Nutrition Examination Survey (KNHANES) 2010-2012. BMJ Open 2014, 4, e005710. [Google Scholar] [CrossRef] [PubMed]
- Kim, Y.J.; Jeon, J.Y.; Han, S.J.; Kim, H.J.; Lee, K.W.; Kim, D.J. Effect of socio-economic status on the prevalence of diabetes. Yonsei Med. J. 2015, 56, 641–647. [Google Scholar] [CrossRef] [PubMed]
- Nam, G.E.; Cho, K.H.; Park, Y.G.; Han, K.D.; Choi, Y.S.; Kim, S.M.; et al. Socioeconomic status and dyslipidemia in Korean adults: The 2008-2010 Korea National Health and Nutrition Examination Survey. Prev. Med. 2013, 57, 304–309. [Google Scholar] [CrossRef] [PubMed]
- Park, M.J.; Yun, K.E.; Lee, G.E.; Cho, H.J.; Park, H.S. A cross-sectional study of socioeconomic status and the metabolic syndrome in Korean adults. Ann. Epidemiol. 2007, 17, 320–326. [Google Scholar] [CrossRef] [PubMed]
- Park, S.J.; Kang, H.T.; Nam, C.M.; Park, B.J.; Linton, J.A.; Lee, Y.J. Sex differences in the relationship between socioeconomic status and metabolic syndrome: The Korean National Health and Nutrition Examination Survey. Diabetes Res. Clin. Pract. 2012, 96, 400–406. [Google Scholar] [CrossRef] [PubMed]
- Lim, S.; Shin, H.; Song, J.H.; Kwak, S.H.; Kang, S.M.; Won Yoon, J.; et al. Increasing prevalence of metabolic syndrome in Korea: The Korean National Health and Nutrition Examination Survey for 1998-2007. Diabetes Care 2011, 34, 1323–1328. [Google Scholar] [CrossRef] [PubMed]
- Mackenbach, J.P.; Kunst, A.E. Measuring the magnitude of socio-economic inequalities in health: An overview of available measures illustrated with two examples from Europe. Soc. Sci. Med. 1997, 44, 757–771. [Google Scholar] [CrossRef] [PubMed]
- Wagstaff, A.; Paci, P.; van Doorslaer, E. On the measurement of inequalities in health. Soc. Sci. Med. 1991, 33, 545–557. [Google Scholar] [CrossRef] [PubMed]
- Moreno-Betancur, M.; Latouche, A.; Menvielle, G.; Kunst, A.E.; Rey, G. Relative index of inequality and slope index of inequality: A structured regression framework for estimation. Epidemiology 2015, 26, 518–527. [Google Scholar] [CrossRef] [PubMed]
- Sergeant, J.C.; Firth, D. Relative index of inequality: Definition, estimation, and inference. Biostatistics 2006, 7, 213–224. [Google Scholar] [CrossRef] [PubMed]
- Schlotheuber, A.; Hosseinpoor, A.R. Summary measures of health inequality: A review of existing measures and their application. Int. J. Env. Res. Public Health 2022, 19, 3697. [Google Scholar] [CrossRef] [PubMed]
- O’Donnell, O.; van Doorslaer, E.; Wagstaff, A.; Lindelow, M. Analyzing Health Equity Using Household Survey Data: A Guide to Techniques and Their Implementation; World Bank: Washington, DC, USA, 2008. [Google Scholar]
- Clarke, P.; Van Ourti, T. Calculating the concentration index when income is grouped. J. Health Econ. 2010, 29, 151–157. [Google Scholar] [CrossRef]
- Ahn, J.; Harper, S.; Yu, M.; Feuer, E.J.; Liu, B.; Luta, G. Variance estimation and confidence intervals for 11 commonly used health disparity measures. JCO Clin. Cancer Inf. 2018, 2, 1–19. [Google Scholar] [CrossRef] [PubMed]
- Ahn, J.; Harper, S.; Yu, M.; Feuer, E.J.; Liu, B.; Luta, G. Improved Monte Carlo methods for estimating confidence intervals for eleven commonly used health disparity measures. PLoS ONE 2019, 14, e0219542. [Google Scholar] [CrossRef] [PubMed]
- Benjamini, Y.; Hochberg, Y. Controlling the false discovery rate: A practical and powerful approach to multiple testing. J. R. Stat. Soc. Ser. B 1995, 57, 289–300. [Google Scholar] [CrossRef]
- von Elm, E.; Altman, D.G.; Egger, M.; Pocock, S.J.; Gotzsche, P.C.; Vandenbroucke, J.P.; STROBE Initiative. The Strengthening the Reporting of Observational Studies in Epidemiology (STROBE) statement. PLoS Med. 2007, 4, e296. [Google Scholar] [CrossRef] [PubMed]
- Di Cesare, M.; Khang, Y.H.; Asaria, P.; Blakely, T.; Cowan, M.J.; Farzadfar, F.; et al. Inequalities in non-communicable diseases and effective responses. Lancet 2013, 381, 585–597. [Google Scholar] [CrossRef] [PubMed]
- Schultz, W.M.; Kelli, H.M.; Lisko, J.C.; Varghese, T.; Shen, J.; Sandesara, P.; et al. Socioeconomic status and cardiovascular outcomes: Challenges and interventions. Circulation 2018, 137, 2166–2178. [Google Scholar] [CrossRef] [PubMed]
- Stringhini, S.; Carmeli, C.; Jokela, M.; Avendano, M.; Muennig, P.; Guida, F.; et al. Socioeconomic status and the 25 x 25 risk factors as determinants of premature mortality: A multicohort study and meta-analysis. Lancet 2017, 389, 1229–1237. [Google Scholar] [CrossRef] [PubMed]
- McLaren, L. Socioeconomic status and obesity. Epidemiol. Rev. 2007, 29, 29–48. [Google Scholar] [CrossRef] [PubMed]
- Dinsa, G.D.; Goryakin, Y.; Fumagalli, E.; Suhrcke, M. Obesity and socioeconomic status in developing countries: A systematic review. Obes. Rev. 2012, 13, 1067–1079. [Google Scholar] [CrossRef] [PubMed]
- Jaacks, L.M.; Vandevijvere, S.; Pan, A.; McGowan, C.J.; Wallace, C.; Imamura, F.; et al. The obesity transition: Stages of the global epidemic. Lancet Diabetes Endocrinol. 2019, 7, 231–240. [Google Scholar] [CrossRef] [PubMed]
- Agardh, E.; Allebeck, P.; Hallqvist, J.; Moradi, T.; Sidorchuk, A. Type 2 diabetes incidence and socio-economic position: A systematic review and meta-analysis. Int. J. Epidemiol. 2011, 40, 804–818. [Google Scholar] [CrossRef] [PubMed]
- NCD Risk Factor Collaboration. Worldwide trends in body-mass index, underweight, overweight, and obesity from 1975 to 2016: A pooled analysis of 2416 population-based measurement studies in 128.9 million children, adolescents, and adults. Lancet 2017, 390, 2627–2642. [Google Scholar] [CrossRef] [PubMed]
- NCD Risk Factor Collaboration. Worldwide trends in hypertension prevalence and progress in treatment and control from 1990 to 2019: A pooled analysis of 1201 population-representative studies with 104 million participants. Lancet 2021, 398, 957–980. [Google Scholar] [CrossRef] [PubMed]
Figure 1.
Latest low-minus-high income gaps by outcome and sex. Low-minus-high gaps were calculated as the prevalence in the lowest-income quintile minus the prevalence in the highest-income quintile in 2023. Positive values indicate higher prevalence among lower-income adults. Error bars show approximate 95% confidence intervals derived from published standard errors.
Figure 1.
Latest low-minus-high income gaps by outcome and sex. Low-minus-high gaps were calculated as the prevalence in the lowest-income quintile minus the prevalence in the highest-income quintile in 2023. Positive values indicate higher prevalence among lower-income adults. Error bars show approximate 95% confidence intervals derived from published standard errors.
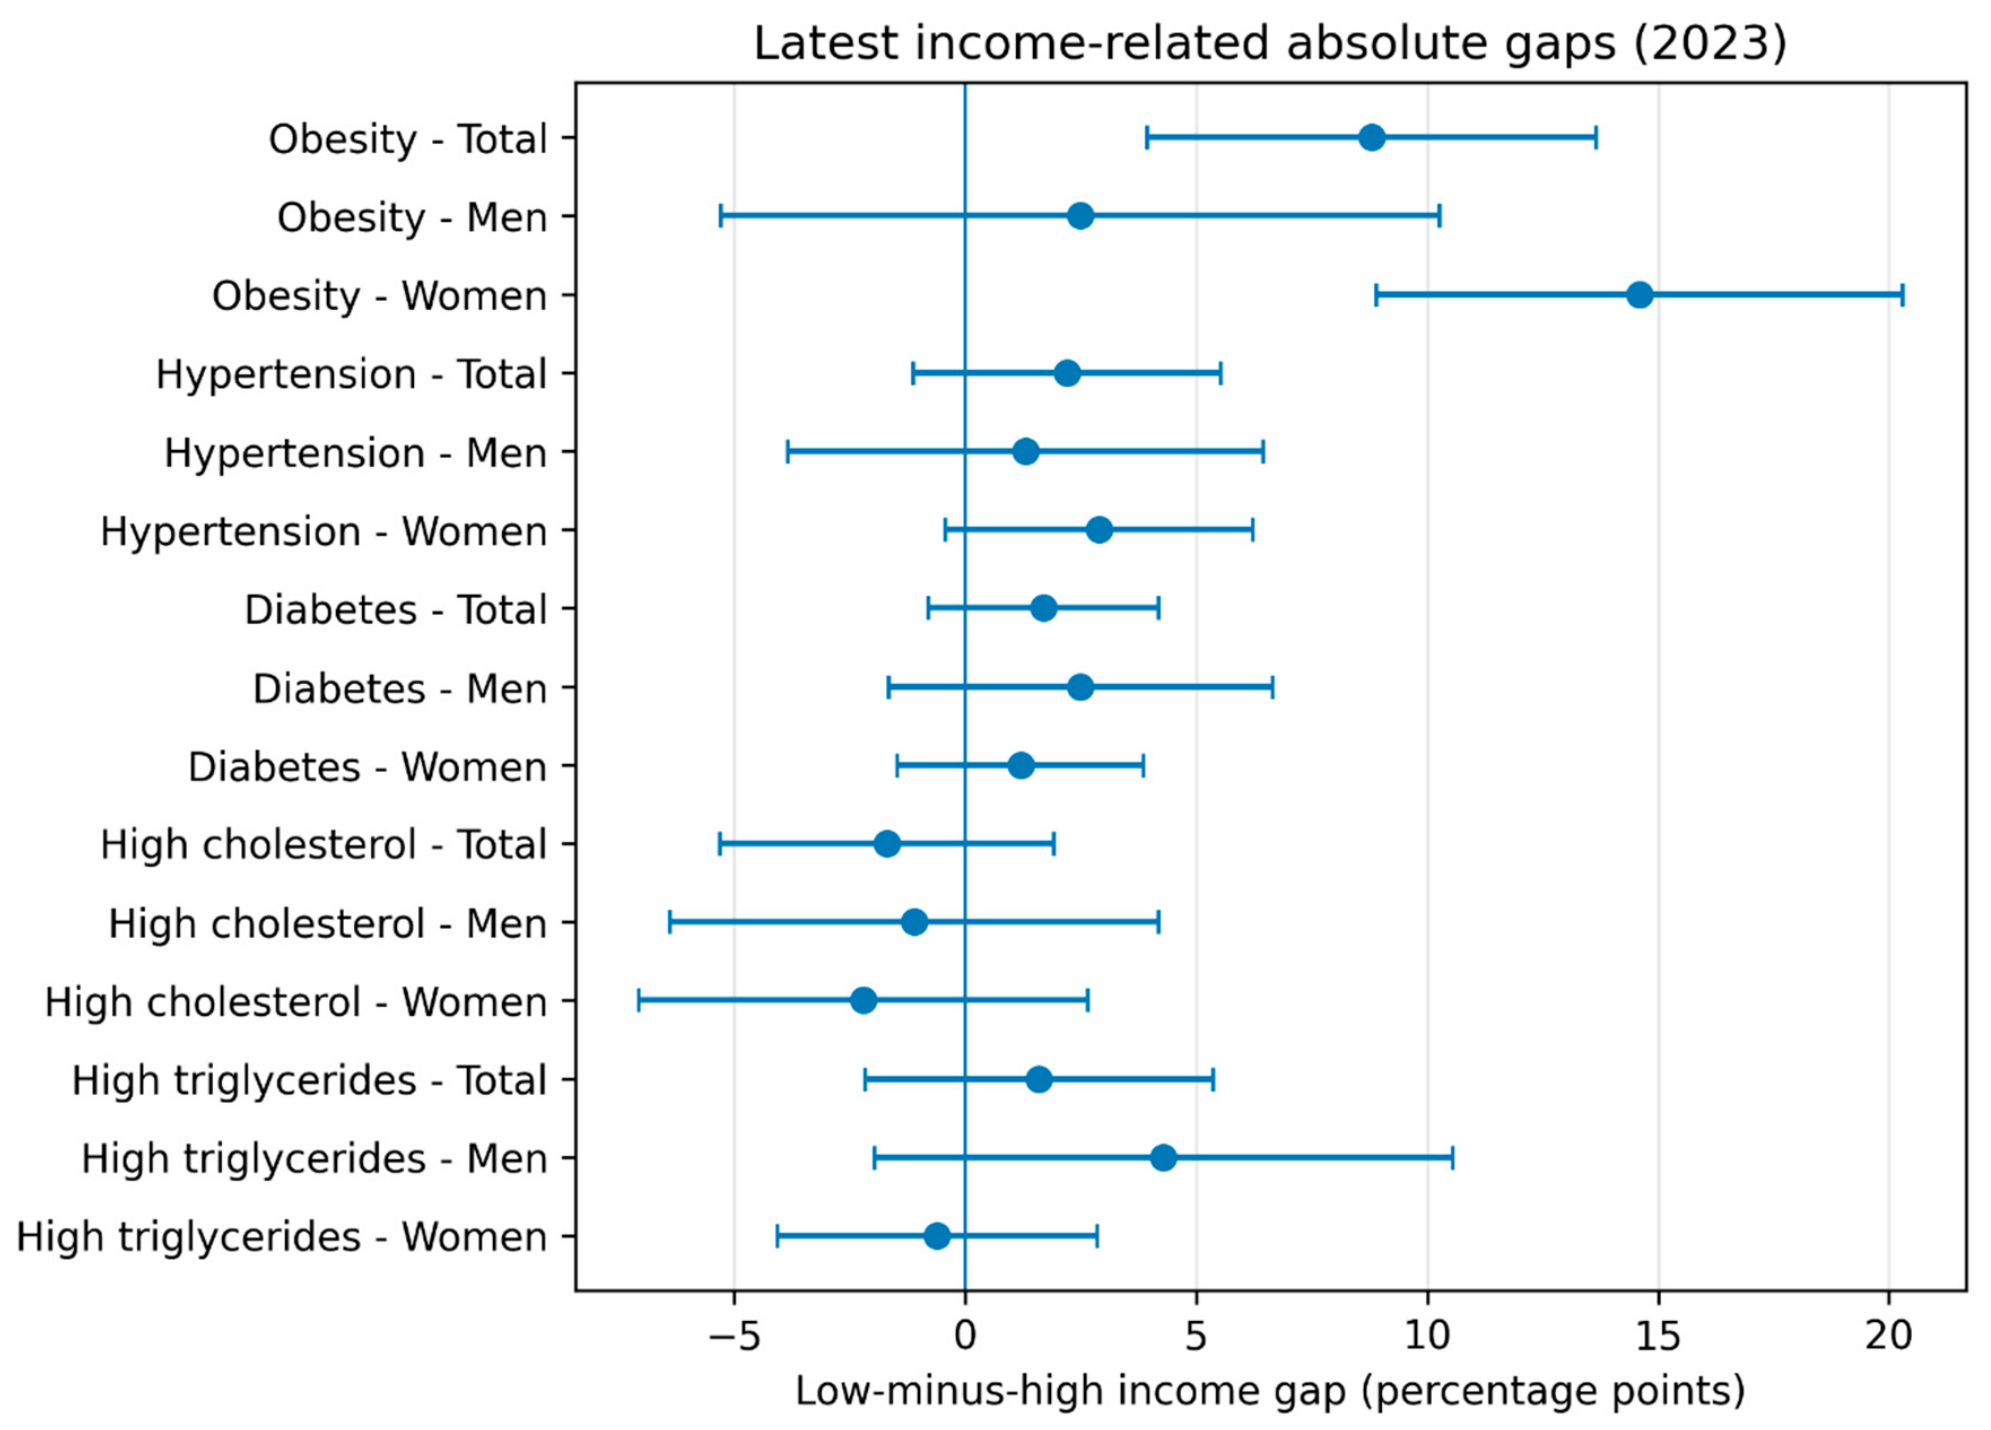

Table 1.
Outcome definitions and analytic availability.
| Outcome | Definition | First Year | Latest Year | No. of Years |
|---|---|---|---|---|
| Obesity | BMI >= 25 kg/m2 | 1998 | 2023 | 20 |
| Hypertension | SBP >= 140 mmHg, DBP >= 90 mmHg, or antihypertensive medication | 1998 | 2023 | 20 |
| Diabetes | Fasting glucose >= 126 mg/dL, physician diagnosis, glucose-lowering medication/insulin, or HbA1c >= 6.5% | 2011 | 2023 | 13 |
| Hypercholesterolemia | Total cholesterol >= 240 mg/dL or cholesterol-lowering medication | 2005 | 2023 | 18 |
| Hypertriglyceridemia | Triglycerides >= 200 mg/dL | 1998 | 2023 | 20 |
Table 2.
Latest income-quintile prevalence and inequality metrics, 2023. Values are age-standardized prevalence percentages unless otherwise indicated. Gap = Q1-Q5, where positive values indicate higher prevalence in the lowest income quintile. pp = percentage points; SII = slope index of inequality; RII = relative index of inequality.
Table 2.
Latest income-quintile prevalence and inequality metrics, 2023. Values are age-standardized prevalence percentages unless otherwise indicated. Gap = Q1-Q5, where positive values indicate higher prevalence in the lowest income quintile. pp = percentage points; SII = slope index of inequality; RII = relative index of inequality.
| Outcome | Sex | Q1 | Q2 | Q3 | Q4 | Q5 | Gap (pp) | Gap 95% CI | Ratio | SII (pp) | RII |
|---|---|---|---|---|---|---|---|---|---|---|---|
| Obesity | Total | 39.2 | 40.8 | 36.7 | 38.9 | 30.4 | 8.8 | 3.9 to 13.7 | 1.29 | 10.3 | 1.34 |
| Obesity | Men | 45.2 | 50.1 | 43.2 | 46.6 | 42.7 | 2.5 | −5.3 to 10.3 | 1.06 | 4.4 | 1.10 |
| Obesity | Women | 32.5 | 30.1 | 29.1 | 29.9 | 17.9 | 14.6 | 8.9 to 20.3 | 1.82 | 15.9 | 1.92 |
| Hypertension | Total | 21.4 | 20.6 | 20.4 | 18.9 | 19.2 | 2.2 | −1.1 to 5.5 | 1.11 | 3.0 | 1.16 |
| Hypertension | Men | 25.8 | 23.9 | 22.7 | 20.8 | 24.5 | 1.3 | −3.8 to 6.4 | 1.05 | 2.2 | 1.10 |
| Hypertension | Women | 16.9 | 17.4 | 17.7 | 16.9 | 14.0 | 2.9 | −0.4 to 6.2 | 1.21 | 3.1 | 1.22 |
| Diabetes | Total | 9.8 | 10.5 | 9.5 | 9.5 | 8.1 | 1.7 | −0.8 to 4.2 | 1.21 | 2.2 | 1.28 |
| Diabetes | Men | 12.9 | 13.9 | 10.7 | 12.4 | 10.4 | 2.5 | −1.7 to 6.7 | 1.24 | 3.5 | 1.34 |
| Diabetes | Women | 7.1 | 7.1 | 8.1 | 6.3 | 5.9 | 1.2 | −1.5 to 3.9 | 1.20 | 1.8 | 1.32 |
| Hypercholesterolemia | Total | 19.8 | 20.6 | 20.1 | 22.0 | 21.5 | −1.7 | −5.3 to 1.9 | 0.92 | −2.3 | 0.89 |
| Hypercholesterolemia | Men | 19.2 | 20.1 | 17.0 | 22.4 | 20.3 | −1.1 | −6.4 to 4.2 | 0.95 | −2.2 | 0.90 |
| Hypercholesterolemia | Women | 20.2 | 20.3 | 23.1 | 21.0 | 22.4 | −2.2 | −7.1 to 2.7 | 0.90 | −2.5 | 0.89 |
| Hypertriglyceridemia | Total | 12.4 | 11.9 | 11.5 | 10.6 | 10.8 | 1.6 | −2.2 to 5.4 | 1.15 | 2.2 | 1.21 |
| Hypertriglyceridemia | Men | 20.2 | 18.0 | 17.4 | 15.1 | 15.9 | 4.3 | −2.0 to 10.6 | 1.27 | 5.5 | 1.37 |
| Hypertriglyceridemia | Women | 5.4 | 5.8 | 5.7 | 5.8 | 6.0 | −0.6 | −4.1 to 2.9 | 0.90 | −0.6 | 0.90 |
Table 3.
Changes in low-minus-high income gaps and weighted trend models. Trend slopes estimate annual change in the low-minus-high income gap using inverse-variance weighted least squares with heteroskedasticity-robust standard errors. FDR q-values are Benjamini-Hochberg-adjusted across trend tests. pp = percentage points.
Table 3.
Changes in low-minus-high income gaps and weighted trend models. Trend slopes estimate annual change in the low-minus-high income gap using inverse-variance weighted least squares with heteroskedasticity-robust standard errors. FDR q-values are Benjamini-Hochberg-adjusted across trend tests. pp = percentage points.
| Outcome | Sex | First Year | First Gap | 2019 Gap | 2023 Gap | Change | Slope pp/Year | 95% CI | p | FDR q |
|---|---|---|---|---|---|---|---|---|---|---|
| Obesity | Total | 1998 | −2.3 | 3.8 | 8.8 | 11.1 | 0.35 | 0.17 to 0.53 | <0.001 | 0.001 |
| Obesity | Men | 1998 | −6.5 | 3.4 | 2.5 | 9.0 | 0.39 | 0.21 to 0.56 | <0.001 | <0.001 |
| Obesity | Women | 1998 | 1.9 | 5.0 | 14.6 | 12.7 | 0.35 | 0.08 to 0.62 | 0.010 | 0.051 |
| Hypertension | Total | 1998 | 1.1 | 3.4 | 2.2 | 1.1 | 0.05 | −0.04 to 0.14 | 0.301 | 0.500 |
| Hypertension | Men | 1998 | 0.4 | 5.1 | 1.3 | 0.9 | 0.02 | −0.15 to 0.20 | 0.800 | 0.949 |
| Hypertension | Women | 1998 | 1.6 | 1.5 | 2.9 | 1.3 | 0.07 | −0.02 to 0.17 | 0.115 | 0.345 |
| Diabetes | Total | 2011 | −0.7 | 1.7 | 1.7 | 2.4 | 0.20 | −0.17 to 0.57 | 0.281 | 0.500 |
| Diabetes | Men | 2011 | −1.8 | 0.9 | 2.5 | 4.3 | 0.39 | −0.05 to 0.83 | 0.081 | 0.304 |
| Diabetes | Women | 2011 | 0.3 | 2.4 | 1.2 | 0.9 | 0.01 | −0.46 to 0.48 | 0.974 | 0.974 |
| Hypercholesterolemia | Total | 2005 | −0.3 | −1.0 | −1.7 | −1.4 | 0.01 | −0.08 to 0.10 | 0.822 | 0.949 |
| Hypercholesterolemia | Men | 2005 | 0.3 | −1.7 | −1.1 | −1.4 | −0.06 | −0.16 to 0.05 | 0.276 | 0.500 |
| Hypercholesterolemia | Women | 2005 | −0.7 | −0.4 | −2.2 | −1.5 | 0.07 | −0.08 to 0.22 | 0.333 | 0.500 |
| Hypertriglyceridemia | Total | 1998 | 2.6 | 5.8 | 1.6 | −1.0 | 0.08 | −0.04 to 0.21 | 0.192 | 0.480 |
| Hypertriglyceridemia | Men | 1998 | 4.1 | 8.6 | 4.3 | 0.2 | 0.01 | −0.23 to 0.24 | 0.960 | 0.974 |
| Hypertriglyceridemia | Women | 1998 | 0.9 | 3.1 | −0.6 | −1.5 | 0.08 | −0.13 to 0.29 | 0.440 | 0.600 |
Disclaimer/Publisher’s Note: The statements, opinions and data contained in all publications are solely those of the individual author(s) and contributor(s) and not of MDPI and/or the editor(s). MDPI and/or the editor(s) disclaim responsibility for any injury to people or property resulting from any ideas, methods, instructions or products referred to in the content. |
© 2026 by the authors. Licensee MDPI, Basel, Switzerland. This article is an open access article distributed under the terms and conditions of the Creative Commons Attribution (CC BY) license (http://creativecommons.org/licenses/by/4.0/).
Copyright: This open access article is published under a Creative Commons CC BY 4.0 license, which permit the free download, distribution, and reuse, provided that the author and preprint are cited in any reuse.


