Preprint
Article

This version is not peer-reviewed.

Artificial Intelligence Adoption and Digital Transformation in Management Consulting Firms: A Mixed-Methods Comparative Study in Romania and Moldova

Submitted:

11 July 2026

Posted:

14 July 2026

You are already at the latest version

Abstract

Background. Digital transformation and artificial intelligence integration in management consulting drive industry restructuring, yet comparative empirical evidence from Central and Eastern Europe remains scarce. Methods. A mixed convergent-parallel design combined 73 semi-structured interviews and questionnaires (53 Romania, 20 Moldova). Qualitative analysis employed five complementary methods (TALL package): node distribution, normalized lexical frequencies, keyword-in-context analysis, Latent Dirichlet Allocation, and sentiment polarity analysis. Results were quantitatively triangulated in SPSS (N=64). Results. Country significantly associates with AI perception (χ²(3)=15.98, p=0.001, V=0.500), with skeptical attitudes appearing exclusively in Romania, and with digitalization level (χ²(2)=8.11, p=0.017). Digital maturity does not significantly correlate with internal innovation in the full sample (Kendall τ=0.12, p=0.429). Global affective polarity is symmetrical across countries (all p>0.4). Conclusions. AI adoption negotiation is moderated by institutional pressures: EU Structural Funds and regulations in Romania versus bilateral grants in Moldova. Results refine the extended TOE framework for emerging markets, generating evidence-based policy recommendations for professional associations and EU institutions.

Keywords: 
;  ;  ;  ;  ;  ;  ;  ;  

1. Introduction

1.1. Sectoral and Industrial Context

The structural reconfiguration induced by digitalization and the accelerated diffusion of generative artificial intelligence in knowledge-intensive work has repositioned the MC sector from the traditional role of late adopter to that of focal site of methodological innovation [1,2,3,4,5,6,7]. The service portfolio is oriented towards digital consulting and AI-augmented deliverables, leading to changes in the structure of the offering, pricing models, and the skills required of consultants. The FEACO (European Federation of Management Consultancies Associations) Survey of the European Management Consultancy Market report notes that the European consulting market grew by around 13% in 2021–2022, and the digital and technology consulting sub-segment expanded at almost double the rate of traditional strategy and organizational consulting [8]. In the CEE area, the Digital Economy and Society Index (DESI) developed by the European Commission [9] places Romania in the last third of the EU member states on the "integration of digital technology" dimension, and the Network Readiness Index [10] places Romania on the 52nd position globally and the Republic of Moldova on the 67th position, the Republic of Moldova presenting a performance above that predicted by the per capita income, a feature consistent with the grant-based investment model documented by Radov [11].
The two national markets that anchor the study have two recent, authoritative sources providing direct, comparable sectoral benchmarks. The AMCOR (Association of Management Consultants in Romania) study [12], based on 170 company-level responses, collected in June–August 2024, estimates the Romanian management consulting market at approximately 2,500 active firms, with 19,500 employees and a cumulative turnover of approximately RON 3.5 billion, equivalent to approximately EUR 700 million, at the end of 2023, according to the aggregated sectoral reporting [13]. The AMCOR study also reports that 82 percent of respondent firms are involved in EU-funded projects, and that these projects account for more than 50 percent of turnover at 75 percent of firms. The complementary study AMCOR/ACAM (Association of Business and Management Consultants of the Republic of Moldova) [14], based on 50 company-level responses, estimates the Moldovan market at approximately 765 active companies, with 1,842 employees and a cumulative turnover of approximately EUR 47.2 million, of which 60 percent are involved in international projects and 90 percent report delivery models based on consortium partnerships, in line with the programmatic profile of external assistance documented by the World Bank framework [15].
The contrast between the two national markets is expressed quantitatively as a ratio of approximately 15 to 1 in turnover (€700 million versus €47 million) and 3.3 to 1 in the number of firms (2,500 versus 765). These divergent volumes and structures indicate that the two markets occupy different positions on the same development curve, rather than constituting qualitatively distinct species. The present study exploits this comparable positioning to isolate the influence of institutional environmental pressures on the adoption trajectories of DT and AI. This positions the study within systems thinking specifically, and not merely management science with a systems label: the three-layer model developed in Section 1.5 and Figure 1 treats technology, organization, and institutional environment not as separate predictors but as a coupled socio-technical system, in which the antecedent layer (TOE conditions) shapes a mediation layer (the negotiation of professional boundaries) that in turn produces the observed outcome layer (DT and AI adoption trajectories). The comparative RO-MD design is what allows this system-level coupling to be observed empirically, since holding language and cultural context constant while regulatory and institutional conditions vary lets the study attribute differences in system behavior to environmental-layer inputs rather than to unmeasured cultural confounds — an empirical strategy for studying institutional pressure as a system-level variable, consistent with the journal's scope.

1.2. Digital Maturity Standards and the Role of Consultancy in Digital Transformation

The assessment of digital maturity in professional services firms is conceptually grounded in the Capability Maturity Model Integration (CMMI) family of standards, which originated in software engineering and was later extended to services and enterprise-level transformation [16]. CMMI-DEV version 2.0 distinguishes five levels of maturity, namely Initial, Managed, Defined, Quantitatively Managed, and Optimized, each characterized by increasing degrees of process standardization, measurement, and continuous improvement; in the field of services, the parallel CMMI-SVC scheme offers a similar scale. The ISO/IEC 33020:2019 standard provides an international process assessment scheme that complements the CMMI and is increasingly invoked in European certification practice. Adapting these frameworks to small professional services firms, the DT maturity literature has proposed synthetic tools that compress the five levels into three operational bands (low, medium, high) for empirical use [17,18,19]. This compression is essential, as the formal classification by CMMI levels requires extensive audit evidence, which is not available in consulting contexts, where firms are small and do not publish detailed process documentation. This study adopts the three-band operationalization, derived by triangulating the self-reported digital infrastructure, the incidence of automated processes, and the share of turnover allocated to digitalization, with the scoring procedure detailed in Section 2.4.
Management consultants occupy an ambivalent position in the DT process, as, on the one hand, they serve as carriers and translators of innovative knowledge, facilitating the absorption of external technological capabilities by client organizations [20,21,22], and on the other hand, they operate in their own firms as adopters who need to reconfigure their practice under the same technological pressures that they support for their clients. This dual positioning generates a distinctive dynamic at the professional frontier, in which consultants must simultaneously demonstrate competence in using AI tools for clients and protect the areas of judgment and tacit expertise that anchor their professional legitimacy [23,24,25]. The present study frames this dynamic as a negotiation process moderated by institutional environmental pressures, based on the extended TOE framework, initially formulated by Tornatzky and Fleischer [26] and later systematized by Baker [27] and Oliveira and Martins [28].

1.3. Regulatory Asymmetry Between Romania and the Republic of Moldova

The regulatory environments in Romania and the Republic of Moldova differ substantially in digital governance and the supervision of professional services, and this asymmetry is a central explanatory variable in the present comparison. Romania, as an EU member state, is bound by the EU AI Act [29], the General Data Protection Regulation (GDPR), and Law no. 242/2022 on the digital transformation of public administration. The National Digital Transformation Strategy 2021–2027 and the NRRP (National Recovery and Resilience Plan, Component 7, Digital Transformation) mobilise around €1,9 billion in direct investments over the period 2021–2026 [30]; recent research on artificial intelligence and business sustainability in Romania documents both the adoption of decision-making algorithms in cyber-physical systems [31] and the incipient nature of research on frugal innovation in the Romanian context [32]. On the other hand, the Republic of Moldova operates within a regulatory framework partially coordinated by the National Agency for Quality Assurance in Education and Research (ANACEC), according to the recent annual report [33], as well as based on Law no. 133/2011 on the protection of personal data, aligned with the GDPR, but not fully equivalent, under Law no. 284/2004 on information society services and under the Digital Moldova 2030 Strategy [34], which sets targets for digital infrastructure and e-government, but does not provide for explicit corporate digital disclosure obligations or specific obligations on AI. This regulatory asymmetry is a key environmental pressure examined empirically, as Romanian firms face a stricter compliance landscape, which simultaneously accelerates digital adoption and increases the salience of risk discourses around AI. In contrast, Moldovan firms operate in a more lax environment, which allows for more experimental and pragmatic AI use cases. Still, it offers fewer institutional structures for sector-level digitization.

1.4. Research Question and Own Contribution

The research question of this investigation is: How do digital transformation and the integration of artificial intelligence differ between management consulting firms in Romania and the Republic of Moldova, and what institutional, organizational, and individual factors explain the observed divergences? The study contributes to the literature by providing the first empirical comparison associated with DT and AI trajectories in MC firms in Romania and the Republic of Moldova, by refining the TOE framework and the negotiation of professional boundaries for emerging markets, by producing an open, triangulated dataset that supports both qualitative analysis (TALL) and quantitative analysis (SPSS), and by generating a set of practical recommendations for MC professional associations. sector. The research question is operationally broken down into nine testable sentences, theoretically derived from the literature reviewed in Section 1.1, Section 1.2 and Section 1.3 and presented in detail in Section 1.5.

1.5. Theoretical Propositions Tested

Nine propositions that instrument the research question and are tested by the mixed design described in Section 2 were formulated based on the reviewed literature. Each sentence is based on at least a specific theoretical tradition and is accompanied by a concrete empirical test. Table 1 summarizes the sentences, theoretical foundations, and associated empirical tests; the interpretative commentary that follows the table explains the logic of derivation and the link to the complementary frameworks presented in Table 2.
The nine sentences cover three distinct analytical levels. Sentences P1, P3, P5, and P9 target the organizational and individual levels, examining the relationships among maturity, size, and technological readiness, as well as their interactions. Propositions P2, P4, and P8 operate institutionally, examining the moderating effects of environmental pressures on adoption trajectories. Sentences P6 and P7 refer to the relational framework, examining the role of the mediator of organizational learning and the effect of relational culture on digital trust. Table 2 presents the four complementary theoretical frameworks integrated into the study, the dimensions each addresses, their limitations in isolation, and the specific contribution of each to the present design.
The integrated articulation of the four frames is achieved through a three-layer model, visually presented in Figure 1. The antecedent layer comprises the classic TOE dimensions; the mediation layer comprises collective bargaining of professional borders, moderated by country-specific institutional pressures; the resulting layer comprises the empirically observed trajectories of DT and AI adoption, operationalized through the nine theoretical propositions.
The conceptual model presented in Figure 1 is empirically translated into the mixed design detailed in Section 2 and the inferential tests presented in Section 3, following a top-down logic that starts with hypotheses and ends with convergent evidence. The first section presents the context; Section 2 describes the materials and methods; Section 3 reports the results; Section 4 provides the discussion, and Section 5 contains the conclusions.

2. Materials and Methods

2.1. Research Design

Based on a mixed convergent-parallel design, in which qualitative and quantitative components are applied to the same integrated corpus and are triangulated post hoc to ensure convergence of conclusions. Reflective thematic coding is the primary analytical mode, and SPSS-based triangulation is the secondary. The methodological architecture is based on the tradition of reflective thematic analysis [47,48], the tradition of comparative case study [49], and the standard guide for parallel-convergent mixed designs proposed in recent methodological literature. The selection of this design is motivated by the complementarity between the interpretative depth of the TALL, which allows the identification of semantic frameworks and relational positions, and the inferential capacity of the SPSS, which allows the quantification of effects and the formal testing of sentences.

2.2. Sample and Corpus

The data were collected between October 2024 and April 2026 through two complementary channels: a structured online questionnaire administered to MC professionals in both countries, which yielded 58 valid responses, and 15 semi-structured interviews with senior consultants, totaling approximately 326 pages of transcribed text. The total corpus analyzed comprises 73 cases and is unbalanced by design (53 Romania, 20 Republic of Moldova), but it reflects the structural relationship between the two national markets documented in Section 1.1 and corresponds approximately to the proportion of active companies reported by the two national professional associations.

Inclusion and Exclusion Criteria

Sampling was intentional, with expansion through the "snowball" technique and professional networks, with a focus on AMCOR and ACAM membership lists. Strict inclusion and exclusion criteria were applied and articulated to ensure comparability of cases. For this, active companies with their main headquarters in Romania or the Republic of Moldova, registered under CAEN (Classification of Activities in the National Economy, Romania) or CAEM (Classification of Activities in the Economy of Moldova) codes compatible with the management consulting activity as a main or secondary activity, with the turnover reported in 2022 or 2023, having at least one senior consultant with at least five years of experience available for the questionnaire or and the management consulting activity had to represent at least 50% of the service mix. Firms specializing exclusively in accounting, financial auditing, or legal services without a management advisory component, inactive firms, or firms with implausible financial reporting were excluded, as were incomplete answers with fewer than 70% of required fields and interviews lasting less than 30 minutes.
Approximately 320 potentially eligible companies were initially identified, distributed as follows: 220 in Romania and 100 in the Republic of Moldova, from the AMCOR and ACAM lists and the Trade Register. After applying the inclusion criteria, 145 companies were contacted (95 from Romania and 50 from the Republic of Moldova), and 73 respondents returned valid data (53 from Romania and 20 from the Republic of Moldova), corresponding to a response rate of around 50.3%. The final profile of the sample and corpus is summarised in Table 3.
From the analysis of the descriptive data presented in Table 3, two methodologically relevant asymmetries result. The first asymmetry concerns the average number of characters per document, with the Moldovan value of 2,106 significantly higher than the Romanian value of 1,400, reflecting a more discursive interview style in the Moldovan subsample. This asymmetry will be controlled by normalizing absolute counts to rates per 1,000 characters in the lexical analyses that follow. The second asymmetry concerns the ratio between the volume of PDF text and the volume of text of attitudes, a higher ratio in the Republic of Moldova, which reflects the higher share of long interviews compared to short questionnaires in the Moldovan subsample.

2.3. TALL Coding Framework

The qualitative coding framework defines 15 analytical nodes, grouped into thematic blocks, namely the consulting profile, the level of digitalization, the role and perception of AI, digital trust, and future scenarios. The coding was done using the R TALL package [50], which provides a Shiny pipeline and a unified script for corporate-level text analysis in multiple languages, with explicit support for Romanian, English, and bilingual combinations with code change. The TALL pipeline successively applies tokenization, elimination of stop words, lemmatization by Romanian morphological rules, calculation of normalized frequencies, and structured export in Excel and CSV formats.

2.4. Scoring Methodology for Ordinal Indicators

For the variables operationalized as ordinal indicators in three bands (level of digitization, AI perception, digital trust), a scoring procedure based on triangulation was applied. The indicator of the level of digitization (low, medium, high) was derived by triangulating the self-reported digital infrastructure, the incidence of automated processes, and the share of turnover allocated to digitization, with the conservative rule that two out of three conditions must compete for the assignment of the "High" band.
Concurrent validation of scoring.
To assess the concurrent validity of the three-band digitization ordinal indicator, two Kendall τ correlations with external variables serving as proxies for convergent validity were calculated. The first correlation, τ(professional certifications × digitization level), could not be computed because professional certifications is nearly constant in the analytical sample (56 of 57 valid respondents report holding a certification), leaving essentially no variance to correlate against; this indicator is therefore not usable as a convergent-validity proxy in the present sample. The second correlation, τ(formal digital strategy × digital investment share) = 0.24, p = 0.171, N = 26, does not reach conventional significance. Convergent validity for the three-band scoring rubric is therefore not established through these two proxies in the present sample; the rubric's face validity rests instead on the triangulation procedure described above (self-reported infrastructure, automated-process incidence, and digitalization spend) and on its convergence with the independent TALL qualitative coding [17,18,19].
The inter-encoder agreement.
The TALL coding was carried out by dual human-human coding on a random stratified subsample of 20% of the corpus with valid code, on the perception of AI, respectively, 12 documents. The two coders are co-authors of the present study. The independent coder, author 1, participated in four training sessions with the full TALL rubric, totaling eight hours, and operated blindly to the coding of author 5. The divergences were reconciled by consensus with author 2, as arbitrator. The procedure follows the O'Connor and Joffe [51] guideline for inter-coder reliability in reflective thematic analysis. The Cohen coefficient κ obtained on the variable perception IA, measured on the four-level ordinal scale, is 0.564 (unweighted, p < 0.001), 0.707 (linear weighting, p < 0.001) and 0.837 (quadratic weighting, p = 0.004), corresponding to the "moderate", "substantial" and "almost perfect" ranges according to Landis and Koch (1977), with gross agreement of 66.7 % on the exact code and 91.7 % with tolerance of an adjacent category. These values exceed the conventional threshold of κ ≥ 0.60 (substantial agreement) recommended for reflective thematic analysis with ordinal variables, supporting the reliability of the applied coding framework. This reliability estimate applies specifically to the AI-perception variable, which was selected for dual coding because it anchors the central P4 test; the remaining 14 TALL analytical nodes were single-coded, and their inter-coder reliability was not separately assessed in the present study.

2.5. Triangulation Strategy and Risk of Self-Reporting

The qualitatively encoded outputs were converted into a numerical and categorical dataset, prepared for SPSS, for triangulation testing in IBM SPSS Statistics 29. After filtering for case completeness, 64 cases were retained for inferential analysis, according to the criteria outlined in Section Inclusion and Exclusion Criteria. The strategy for converting qualitative codes into ordinal and categorical variables follows the methodological guidelines for mixed designs and is documented through a coding rubric. The natural risk of self-reporting, especially in the case of the use of AI, where reputational concerns may induce systematic underreporting [52], is recognized as a methodological limitation in Section 4.6; The reported absolute rates should be interpreted as lower limits of actual sectoral adoption, while the directional and association findings remain valid.

2.6. Statement on the Use of Generative Artificial Intelligence

In accordance with the editorial policy of MDPI, the authors state that generative artificial intelligence tools (Anthropic Claude, version 4.7) were used for language refinement and editing of the academic register of some paragraphs, for iterative methodological consultation in the design of R scripts related to the KWIC, LDA and sentiment analysis pipelines, as well as for the generation of layout templates for figures in the ggplot2 package. All analytical decisions, theoretical statements, and empirical interpretations remain the sole responsibility of the co-authors, who have reviewed and edited the AI output and take full responsibility for the published content.

2.7. Member Checks and Complementary Ethical Considerations

In accordance with the methodological standard for reflective thematic analysis [47,48], it is recognized that the member checks procedure (validation of interpretations by returning to participants) is a recommended practice but not mandatory. In the present study, formal member checks were not performed for three methodological reasons. (1) The cross-border comparative design, with 73 respondents geographically distributed across two countries, makes individual checks costly in terms of time and logistics. (2) The mixed convergent-parallel design also involves an intermethod triangulation (TALL × SPSS), which partially replaces the need for participant validation with internal convergence validation [53]. (3) The coding was carried out on aggregated categories at the level of the national subcorpus, not on individual cases, which reduces the relevance of case-by-case validation. However, we recognize that the absence of individual member checks constitutes a methodological limitation, as reported in Subsection 4.6, and that future studies with smaller samples and intensive designs may benefit from this additional procedure.

3. Results

3.1. Distribution of Encoded References on Nodes

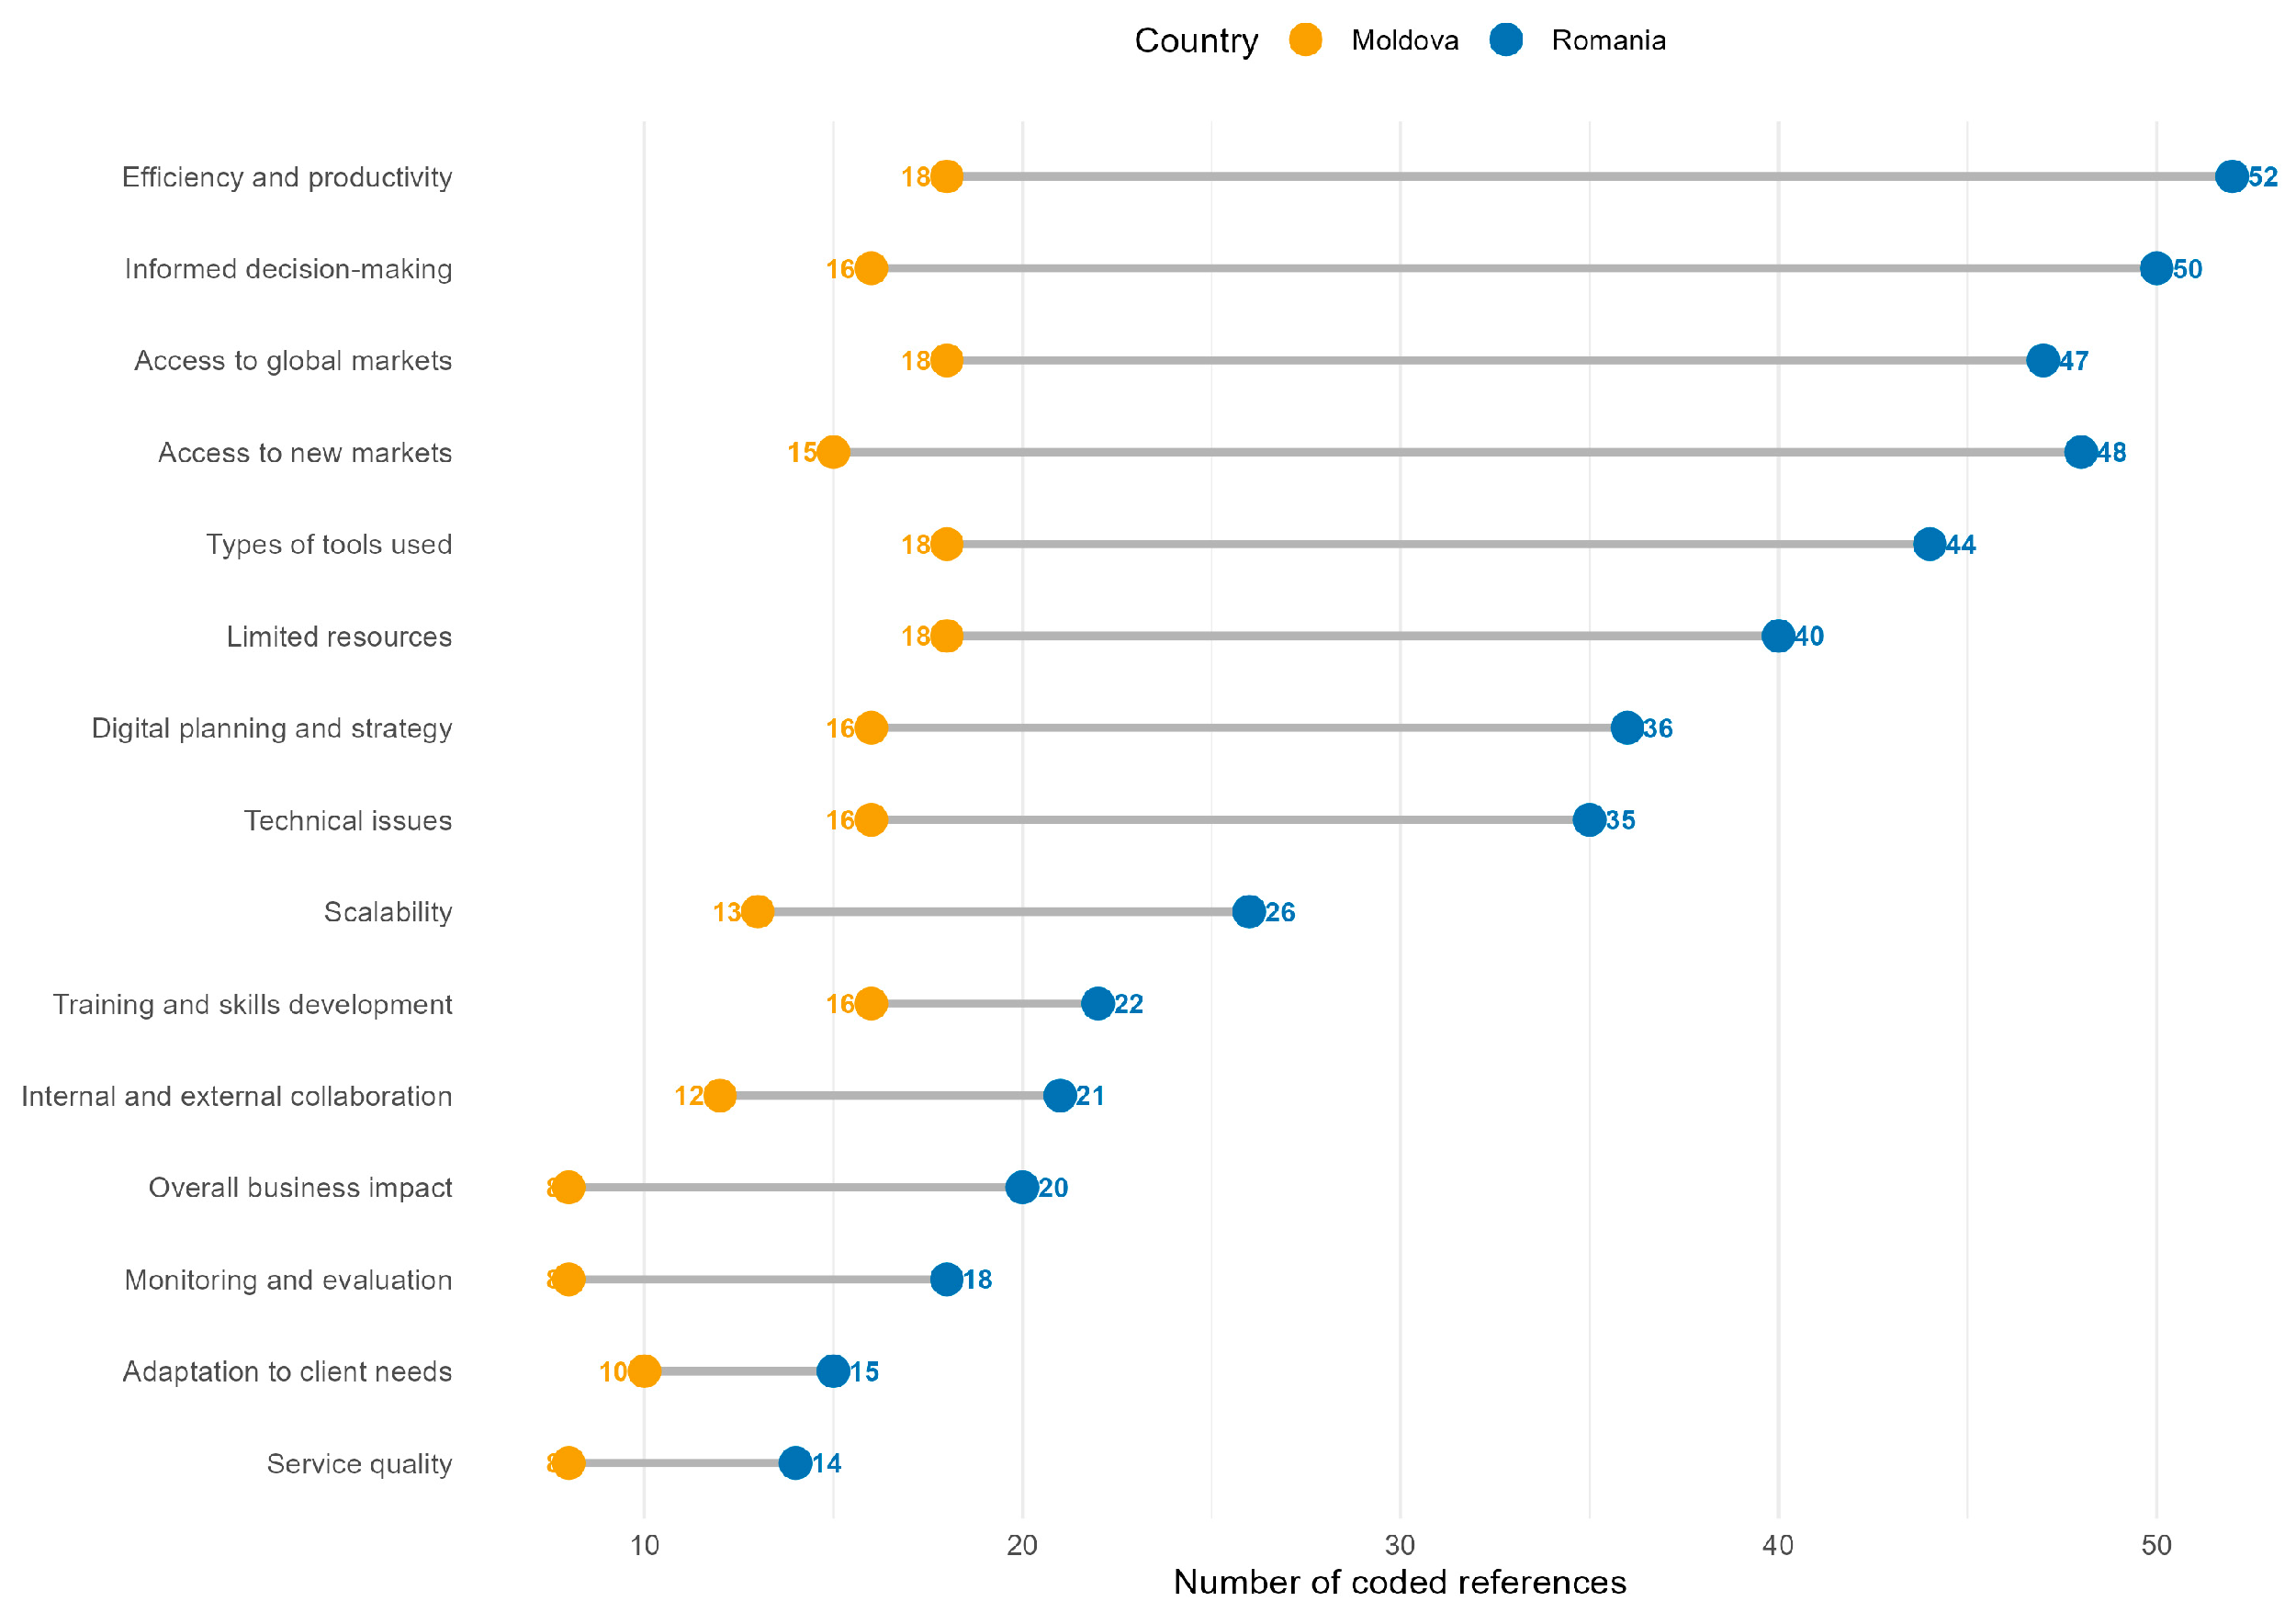
The results of the thematic coding are presented in Figure 2 as a Cleveland dot plot, which allows direct comparison of coding density for each analytical node across the two national subcorpora. The visualization shows the 15 most-cited nodes, ordered by the combined volume of references in descending order.
The distribution shown in Figure 2 highlights three relevant patterns. (1) The nodes with the highest coding density in both subcorpora are Tehnologii_utilizate, Rol_utilizari_AI, and Perceptie_AI, which reflect the centrality of artificial intelligence in the contemporary consulting discourse and constitute the empirical basis for testing Propositions P4 and P5. (2) The Moldovan subbody has a disproportionately higher density on the nodes Incredere_digitala and Tendinte_viitor, which provides a first lexical signal for Sentence P7, according to which relational culture shapes digital trust. (3) The Romanian subbody focuses more strongly on Strategie_formala and Efecte_concrete nodes, which support Proposition P1, according to which higher digital maturity is associated with a clearer strategic articulation of AI adoption. These distributions provide an empirical framework for the frequency analysis presented below.

3.2. Word Frequency Analysis

Table 4 reveals the top 15 terms, by normalized frequency per thousand text characters and attitudes in each national corpus.
The lexical contrast documented in Table 4 is theoretically informative. The Romanian database focuses on the terms European_funds (rank 4) and strategy (rank 6), a profile consistent with the institutional environment dominated by EU funds and DT's strategic framing, which characterizes firms with higher digital maturity. The Moldovan corpus focuses on the terms relationship (rank 11), personal (rank 12), human (rank 14), and trust (rank 15), a grouping that signals the relational-human orientation of consultative engagement under conditions dominated by grants and that aligns with the theoretical expectations of Proposition P7. This fundamental lexical difference motivates a deeper analysis by extracting the immediate context of the key terms, as presented in Section 3.4.

3.3. Keyword-in-Context (KWIC) Analysis and Lexical Associations

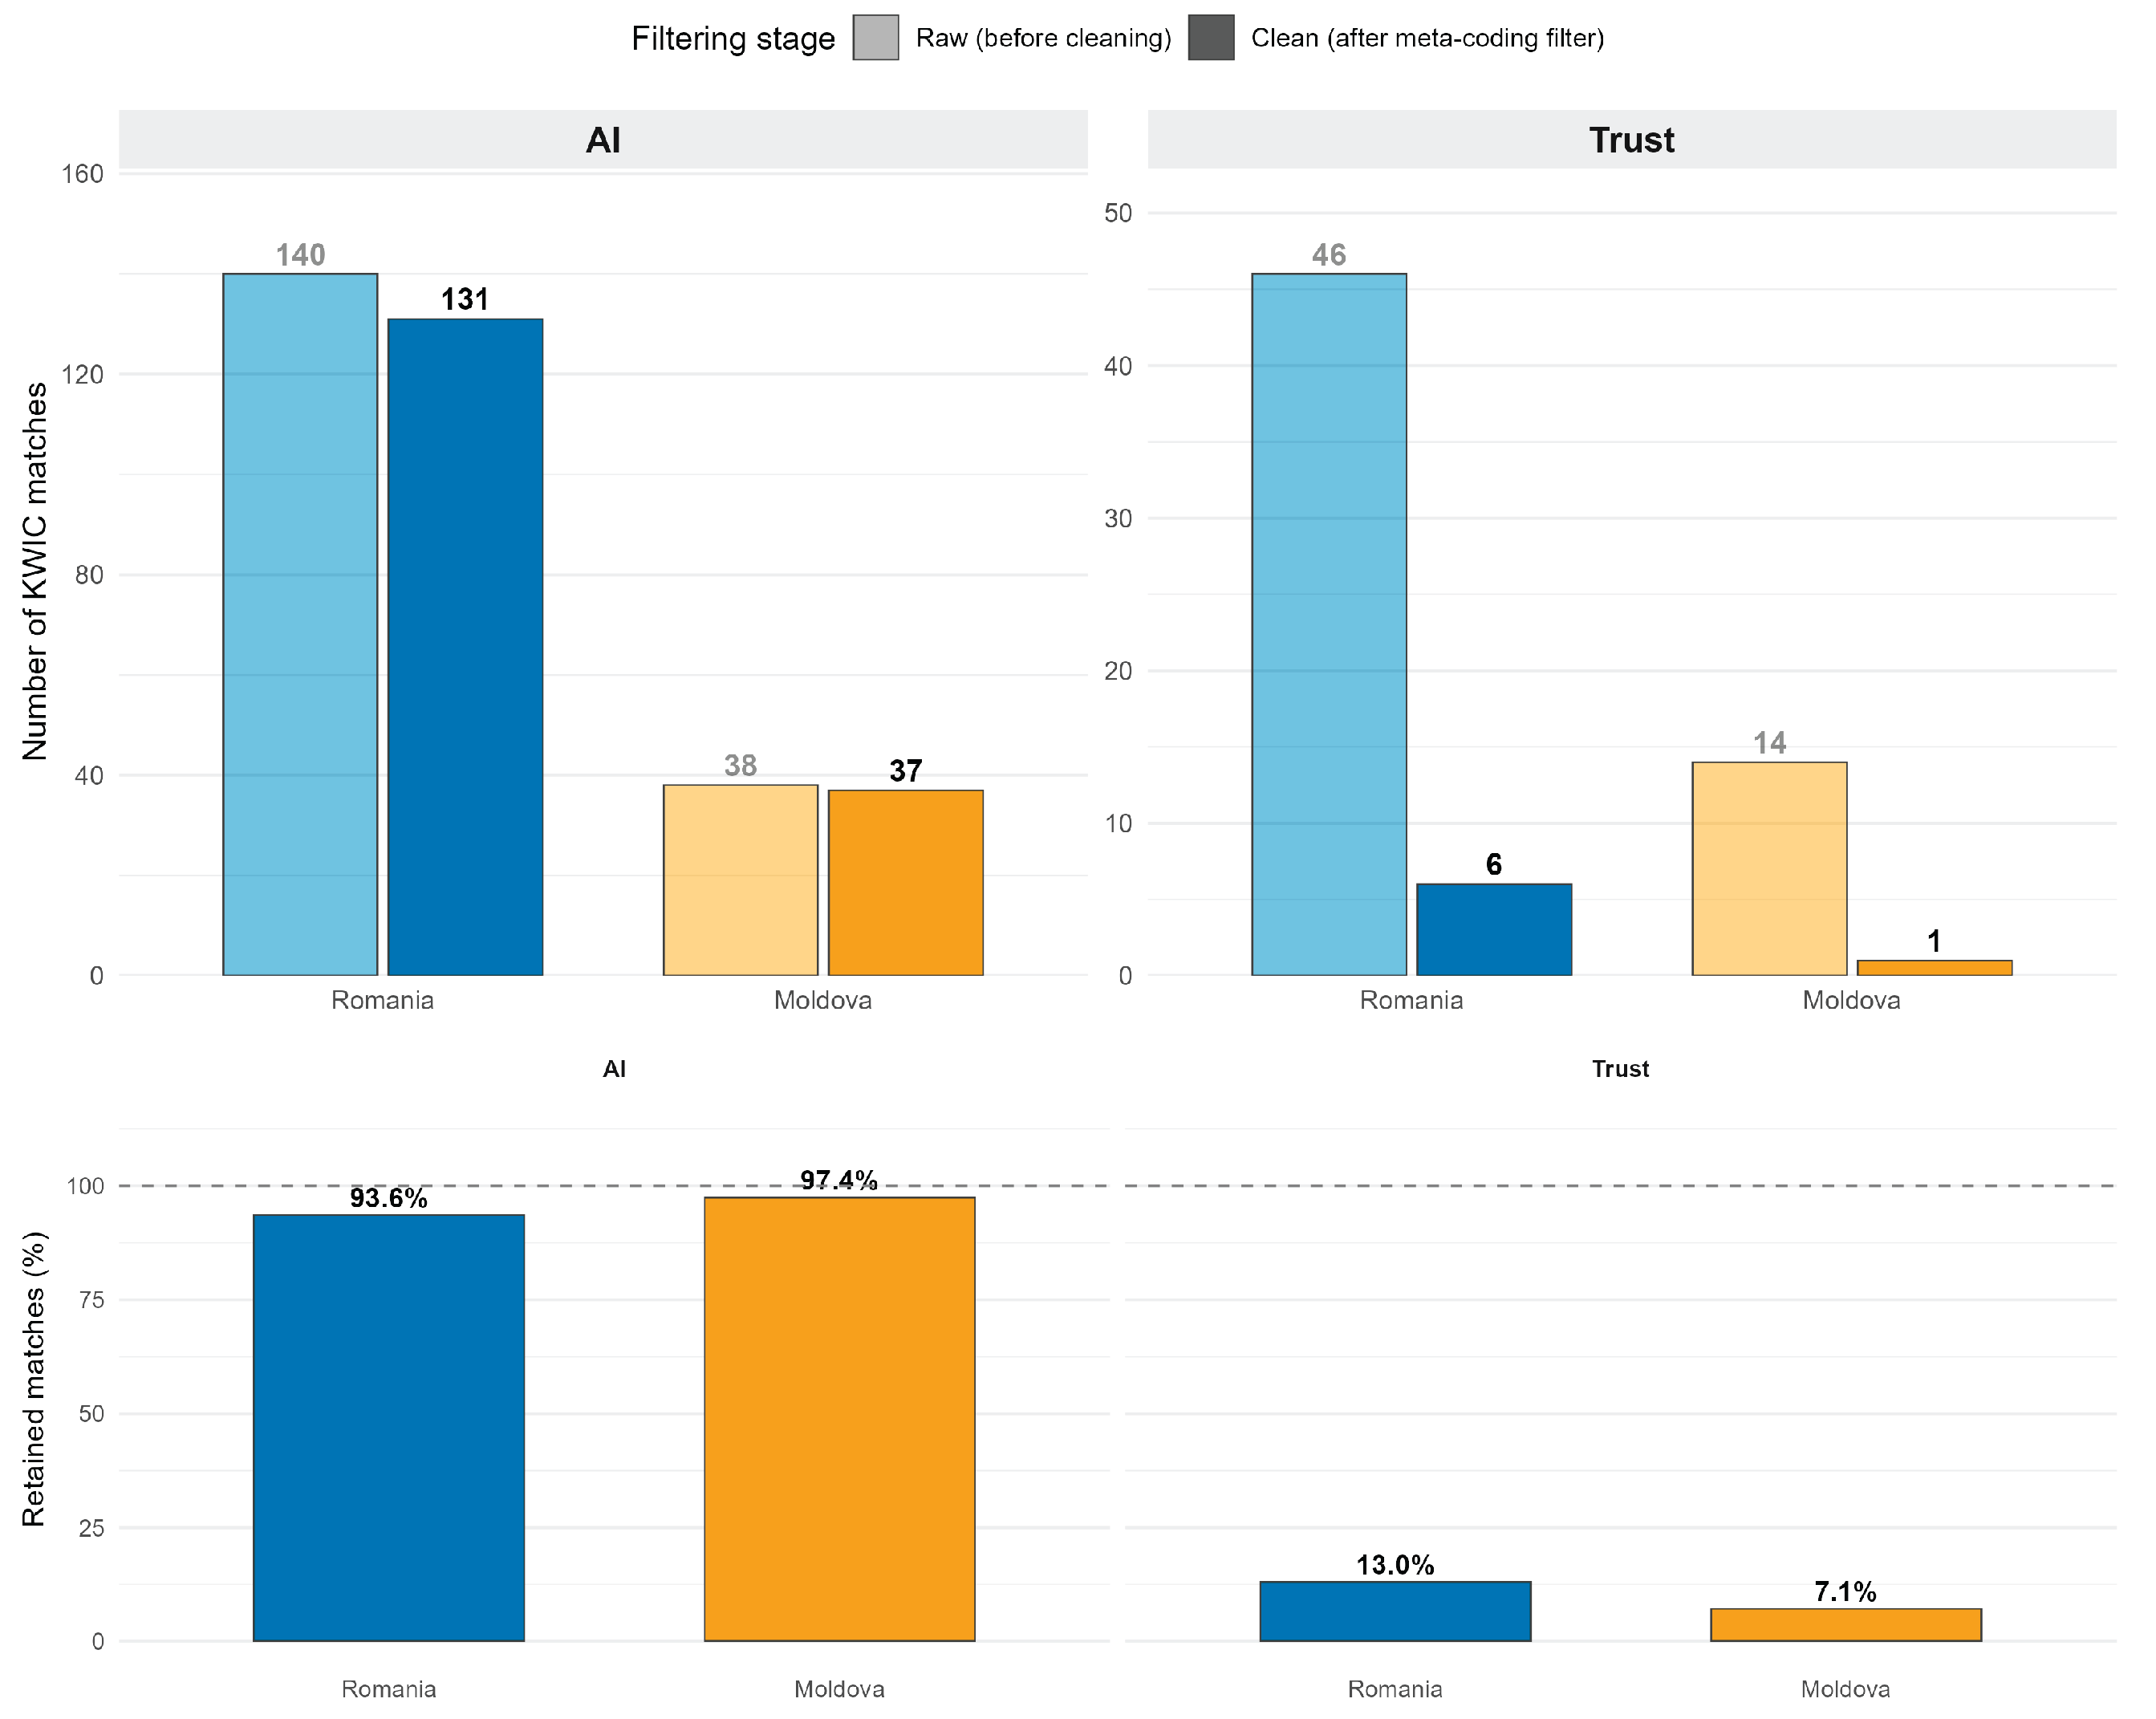
The KWIC analysis was carried out in two stages. The first stage, focused on AI and trust, was later extended to 21 relevant theoretical concepts, namely AI, trust, strategy, automation, data, risk, cost, customer, training, security, efficiency, innovation, decision, digitalization, transformation, consulting, process, maturity, competence, adaptation, and quality. For AI, a case-sensitive search by acronym was implemented, as the Romanian auxiliary "ai" generates many false positives. All KWIC results have been filtered post hoc to remove self-generated TALL encoding snippets that invoke key terms to mark their absence. Filtering produced substantially differentiated effects, as 87% of the initial matches for trust turned out to be metacoding, while for AI, the share of artifacts was below 6%, confirming that AI is a term used spontaneously, and trust remains an external theoretical construct that subjects do not spontaneously invoke.
The consolidated filtering impact figures are shown in Figure 3, which juxtaposes the number of raw and clean matches for AI and trust, broken down by country, along with the post-filter retention rate.
For AI, the corpus generated 178 raw matches (140 RO, 38 MD). After filtering, 168 matches (131 RO, 37 MD) were maintained, present in 35 RO documents (66.0 %) and 13 MD documents (65.0 %). The normalized density per document is 2.47 in RO and 1.85 in MD. To be confident, the raw figures (46 RO, 14 MD) were reduced, after cleaning, to 6 RO and 1 MD. The colocation profile of AI is clearly divergent. In the Romanian corpus, AI coexists with analysis (24 occurrences), writing (16), platforms (12), used (10), and consulting (10), configuring an instrumental-cognitive cluster. In the Moldovan corpus, the dominant collocations are face (7), consulting (6), business (5), coexist (4), and plans (4), configuring a relational cluster. Three distinct semantic frameworks emerge: AI as an analytical productivity accelerator (predominantly RO), AI as a writing and research assistant (mixed), and AI as an actor with whom professional boundaries are negotiated (predominantly MD). These divergent frameworks operate directly in the P4 sentence. The associations of the term cost are equally informative: in RO cost, it is associated with automation, reduced, reduction, eligibility, while in MD cost, it is associated with lack, software, compatibility, skills, thereby operationalizing the institutional asymmetry postulated by Sentence P8.

3.4. Subject-Based Modeling Using Latent Dirichlet Allocation (LDA)

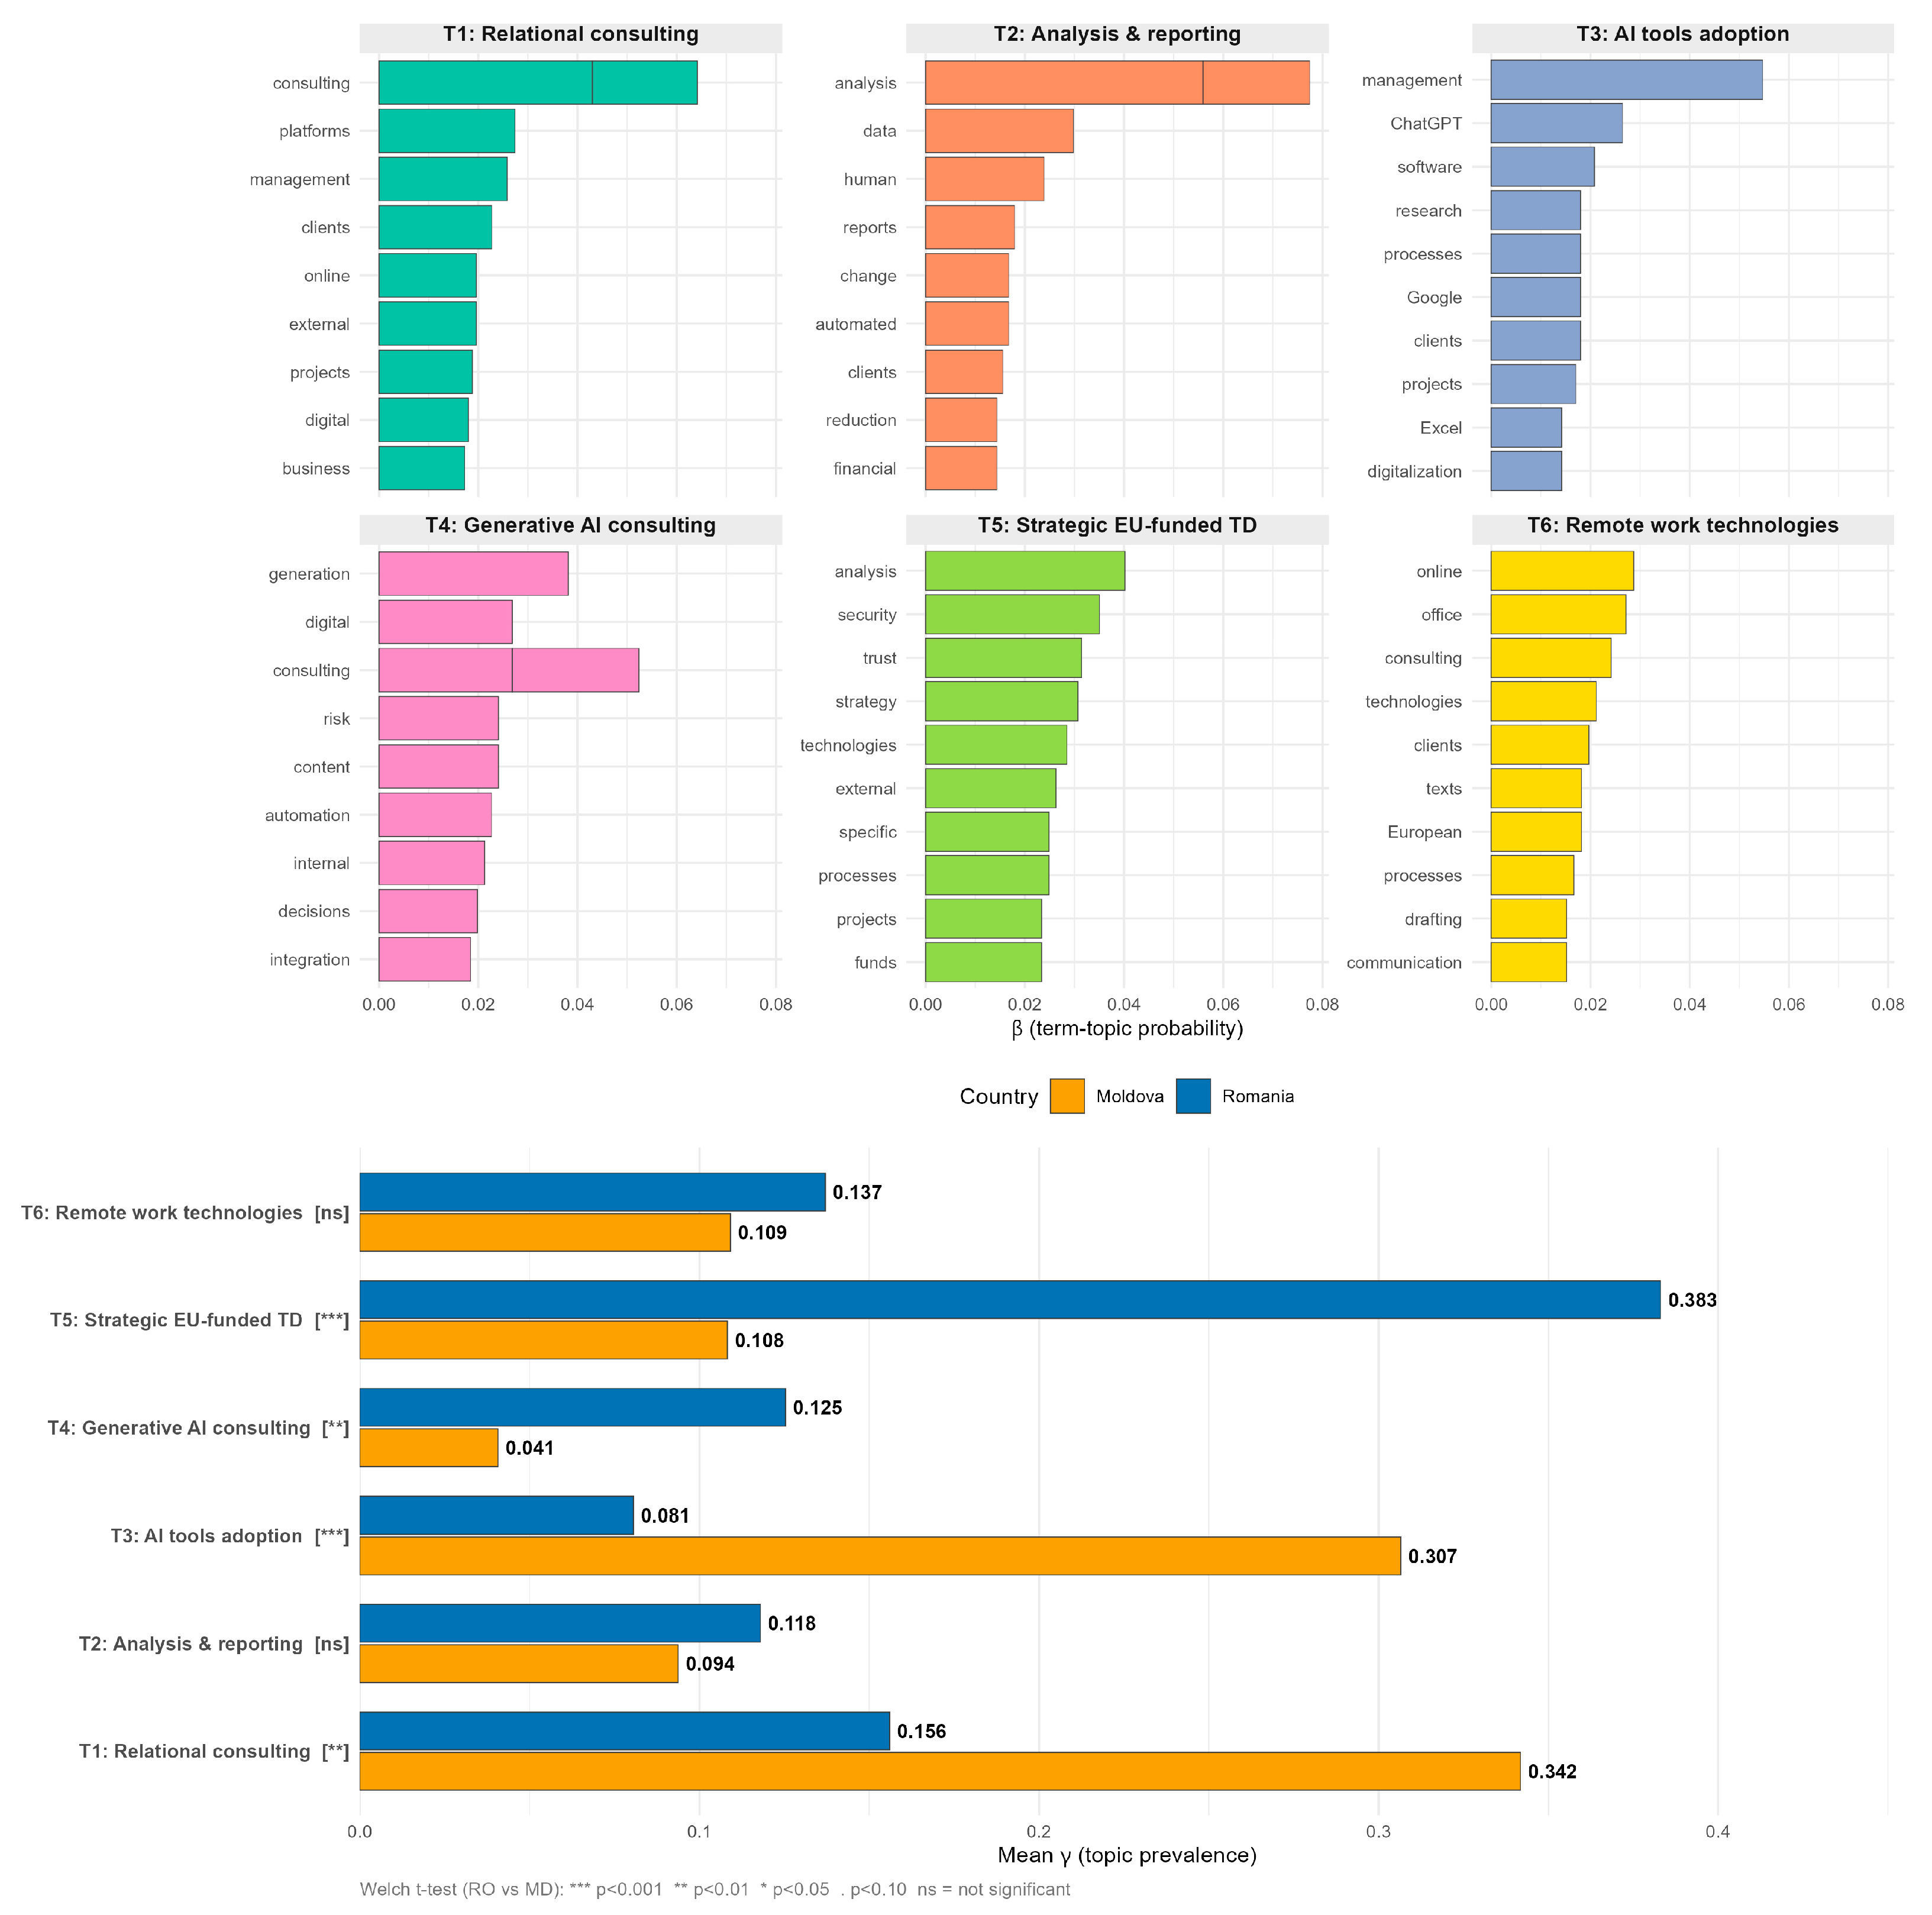
LDA [54,55] was performed on the integrated corpus text_full, with the elimination of Romanian and English stop words, the filtering of TALL artifacts, and the documentary frequency threshold (df ≥ 3). The resulting vocabulary (576 unique terms, 73 documents, 5,719 total tokens) was modeled by Gibbs sampling (topicmodels package [55]) with 2,000 iterations, 500 burn-in, hyperparameter α = 0.5, and seed = 42, at K = 6 topics, determined by the stability of the dominant terms and thematic interpretability. Thus, the top 10 terms per topic were identified by β (term-topic probability), and the weights γ (document-topic probability) were calculated at the country level through arithmetic averages. The differences between the environments were tested by Welch's t-tests, bilateral, on the γ values at the document level. The detailed results are presented in Table 5.
The results in Table 5 show that four out of six topics show statistically significant differentiation between countries, with the largest effect sizes on T5 (strategic EU, in favor of Romania) and T3 (AI instruments, in favor of the Republic of Moldova). The visualization of dominant terms and γ prevalence is shown in Figure 4.
LDA modeling provides direct evidence for five sentences. T5 in the Romanian corpus operates on sentence P1, since the lexical composition of the topic (strategy, security, technologies, processes, funds) describes the integration of AI into articulated strategic architectures. The centrality of the term "funds" in Q5 and the absence of an institutional equivalent in Moldovan topics confirm Proposition P2 on moderation by institutional pressures. The topic distribution provides an important nuance of Sentence P5 through TAM, as AI is functionally assimilated differently, through strategic integration in RO (T4) versus direct instrumental adoption in MD (T3), two parallel trajectories and not a unidirectional relationship. The dominance of T1 in MD (γ = 0.342, p = 0.006) confirms the relational orientation postulated by Proposition P7. Finally, the structural opposition between RO-dominant T5 and T1 plus MD-dominant T3 confirms Proposition P8 on distinct innovation systems.

3.5. Qualitative Analysis of Feelings

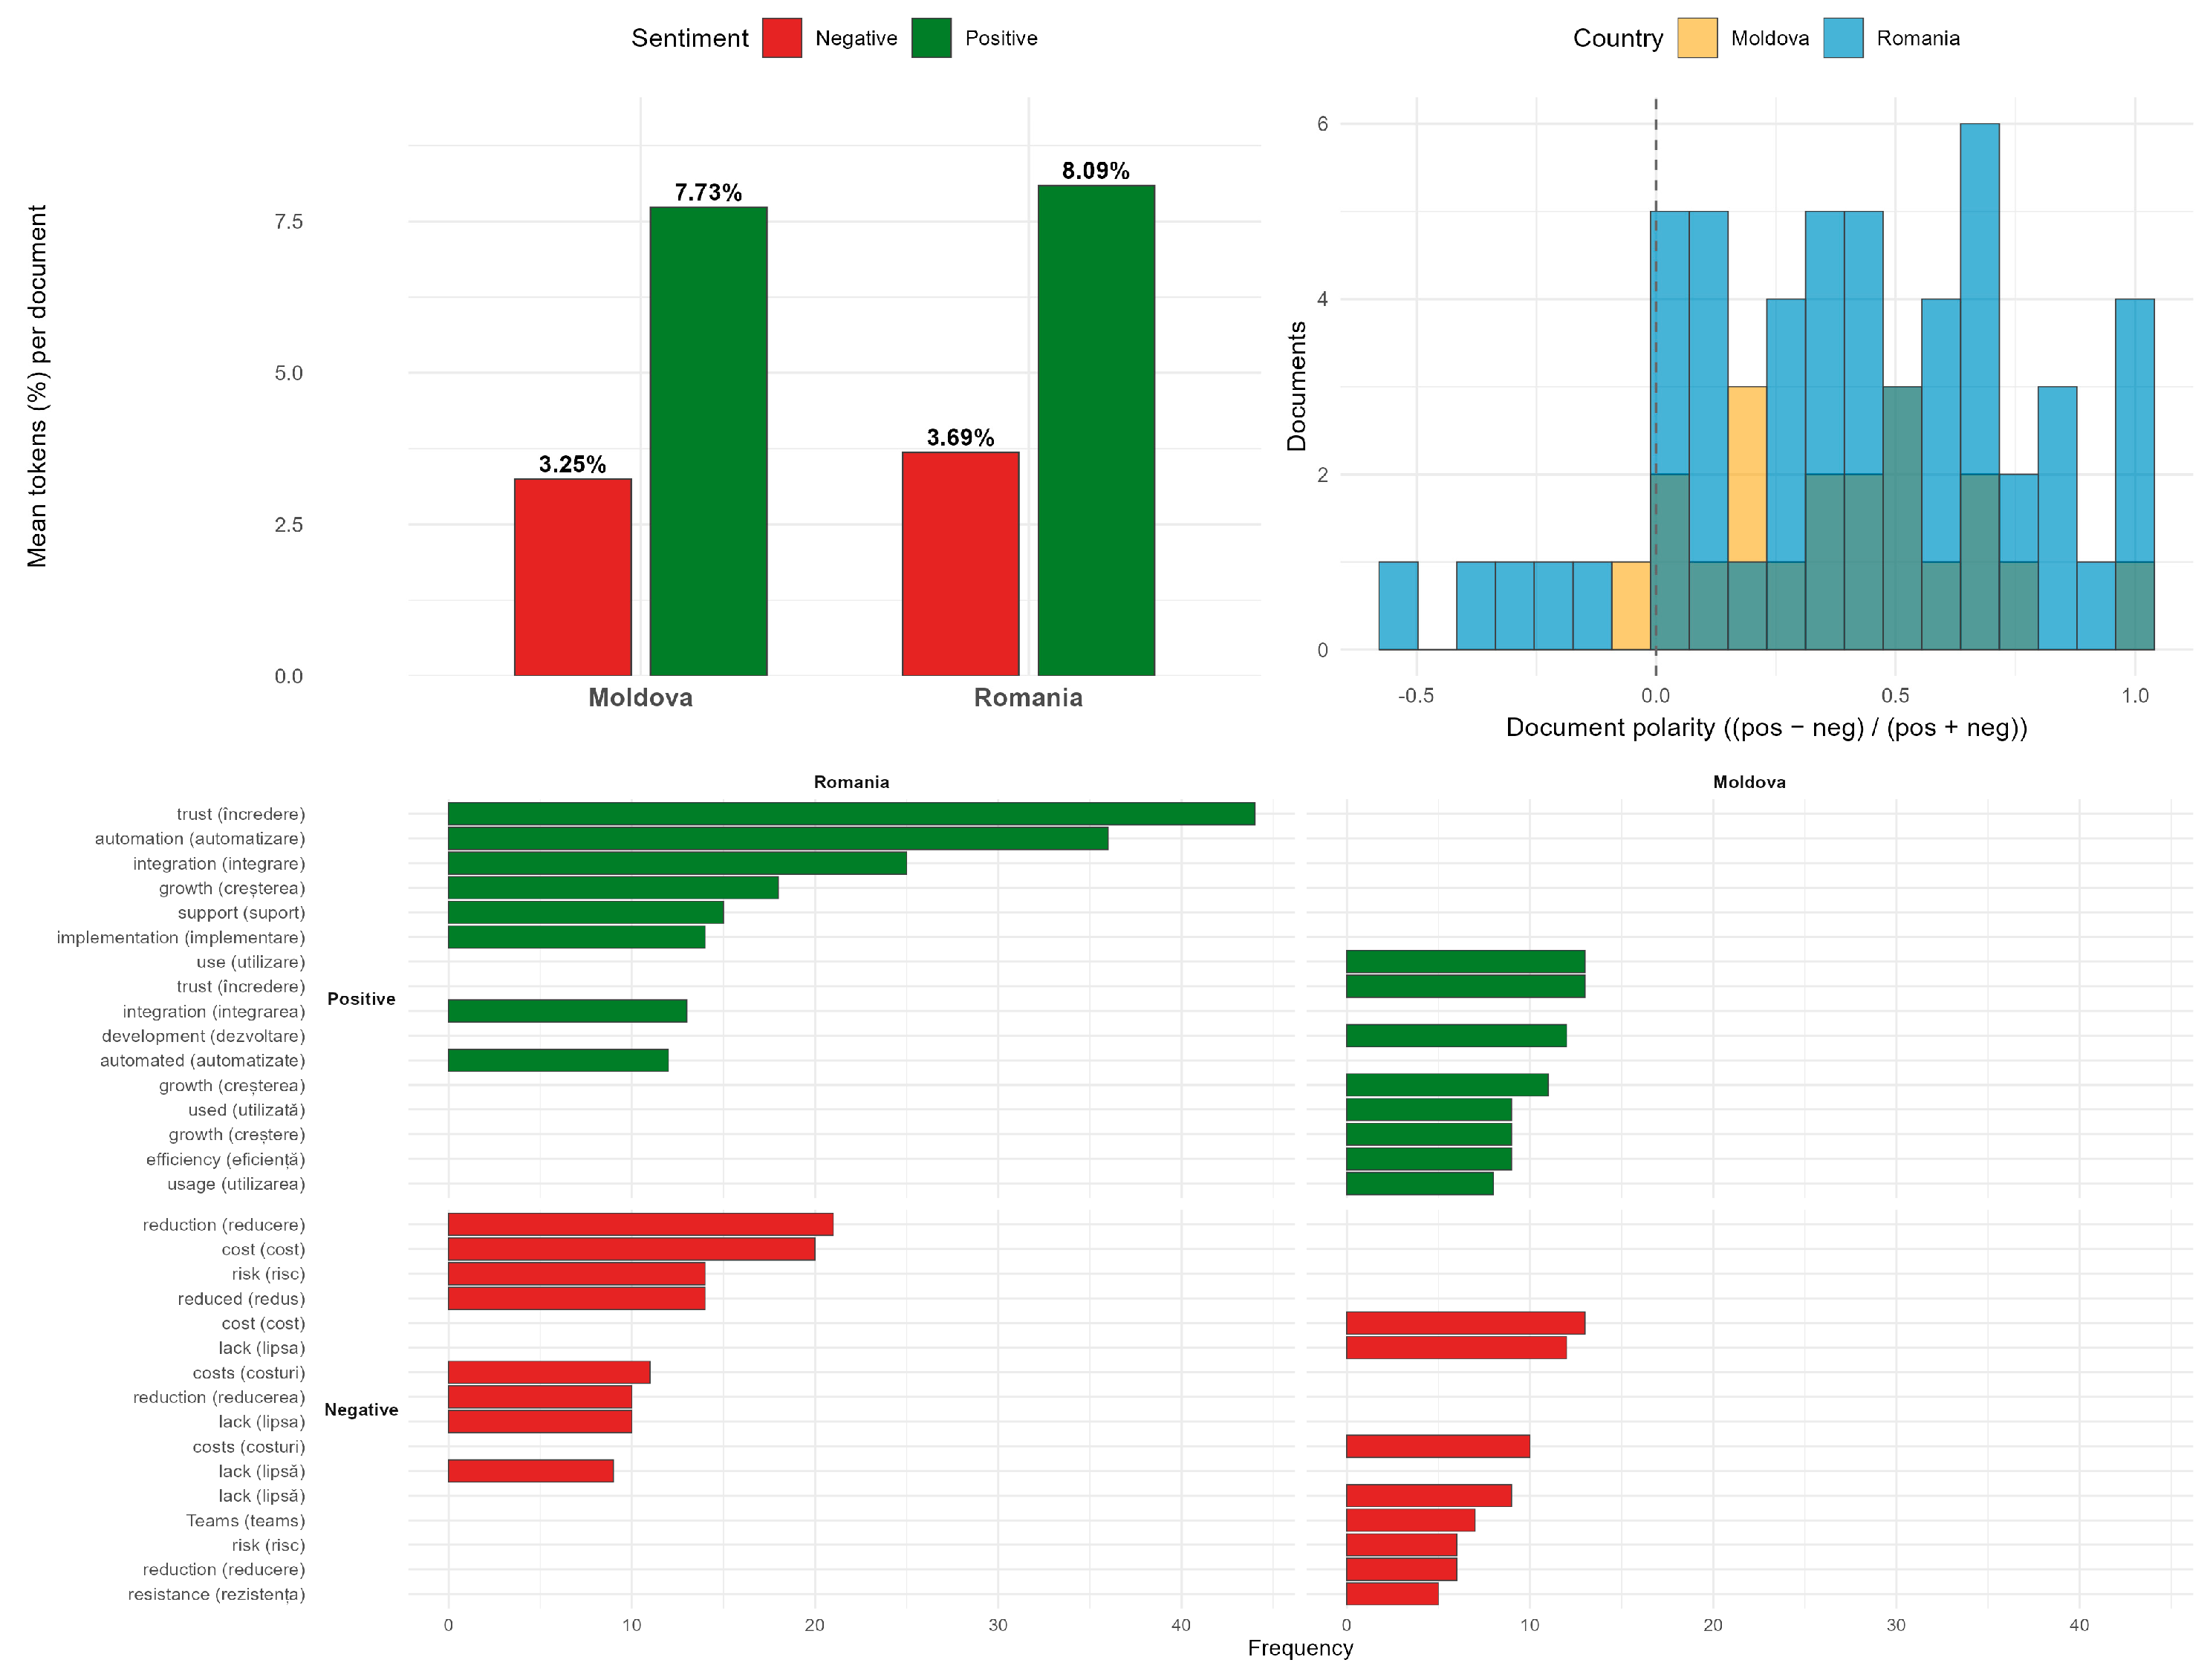
To complete the four previous lexical methods with an explicit affective dimension, an analysis of the polarity of feelings was conducted using a Romanian lexicon specific to the fields of consulting and digitization, built ad hoc. The lexicon includes over 80 positive roots (such as efficient, productive, improve, advantage, success, growth, confidence) and over 80 negative roots (such as problem, difficult, barrier, lack, fear, risk, cost). Each token has been classified as positive, negative, or neutral. Document-level metrics include the percentage of positive tokens, the percentage of negative tokens, and a composite polarity score, defined as the ratio of the difference between positive minus negative, and the sum of positive plus negative. The results at the country level are presented in Table 6.
The results in Table 6 indicate that affective polarity is not statistically distinguishable between the two corpora across all three metrics (all p > 0.4). The affective profile is shown in Figure 5.
The result of sentiment analysis is, in itself, substantially informative. The asymmetry quantitatively documented in Section 3.7 on AI perception is a focused, skeptical-versus-mixed asymmetry in specific segments of the corpus, not a global asymmetry in affective tone. Sentiment analysis thus provides direct evidence for refining the P4 and P5 sentences by differentiating between the global level of affective climate and the focal level of AI perception encoding.

3.6. Quantitative Triangulation in SPSS

The qualitatively coded outputs were converted into a dataset of 64 SPSS-ready cases. This subsection reports descriptive statistics, frequency distributions, cross-tabulations, chi-square and Fisher exact tests, Kendall τ rank correlations, post hoc statistical power analysis, and robustness analysis.

3.6.1. Descriptive Statistics

Descriptive statistics for all quantitative variables included in the analysis are presented in Table 7.
The sample (N = 64) is dominated by small firms, with 63.8% classified as micro-enterprises (fewer than 10 employees) and 29.8% as small enterprises (10–49 employees). The turnover distribution is heavily right-skewed, with a single firm reporting an implausibly high turnover (€500 million; also flagged as an employee-count outlier in Section 3.6.5); 15.9% of firms report a turnover above €2 million. The descriptive data expose several methodological constraints relevant to sentence testing. The focus on micro and small firms (93.6% cumulatively) reduces size-based variability and limits the statistical power of the P3 test. The digitization-level variable (nivel_dig) has a mean of 2.46 (SD = 0.59, N = 46), and professional certifications is nearly constant (98.2% "yes"), which removes it as a usable correlate (see Section 2.4). The high rate of missing data at incredere_digitala (41 out of 64) reflects the lack of explicit evidence in the original questionnaire and necessitates interpreting Proposition P7 predominantly through TALL methods.
To evaluate whether the extensive missingness on the digital trust indicator (41 of 64 cases, 64.1%) threatens the validity of the descriptive and correlational analyses, Little's (1988) MCAR test was applied to the full set of quantitative and recoded categorical variables (digitalization level, AI perception, digital trust, internal innovation, firm size). The test did not reject the null hypothesis of data missing completely at random (χ² = 69.491, df = 55, p = 0.090), supporting the use of listwise deletion for analyses involving digital trust (N = 23 valid cases), although the reduced effective sample still limits statistical power for this indicator specifically (see Section 4.6, Limitations).

3.6.2. Crosstabs and Chi-Square Tests

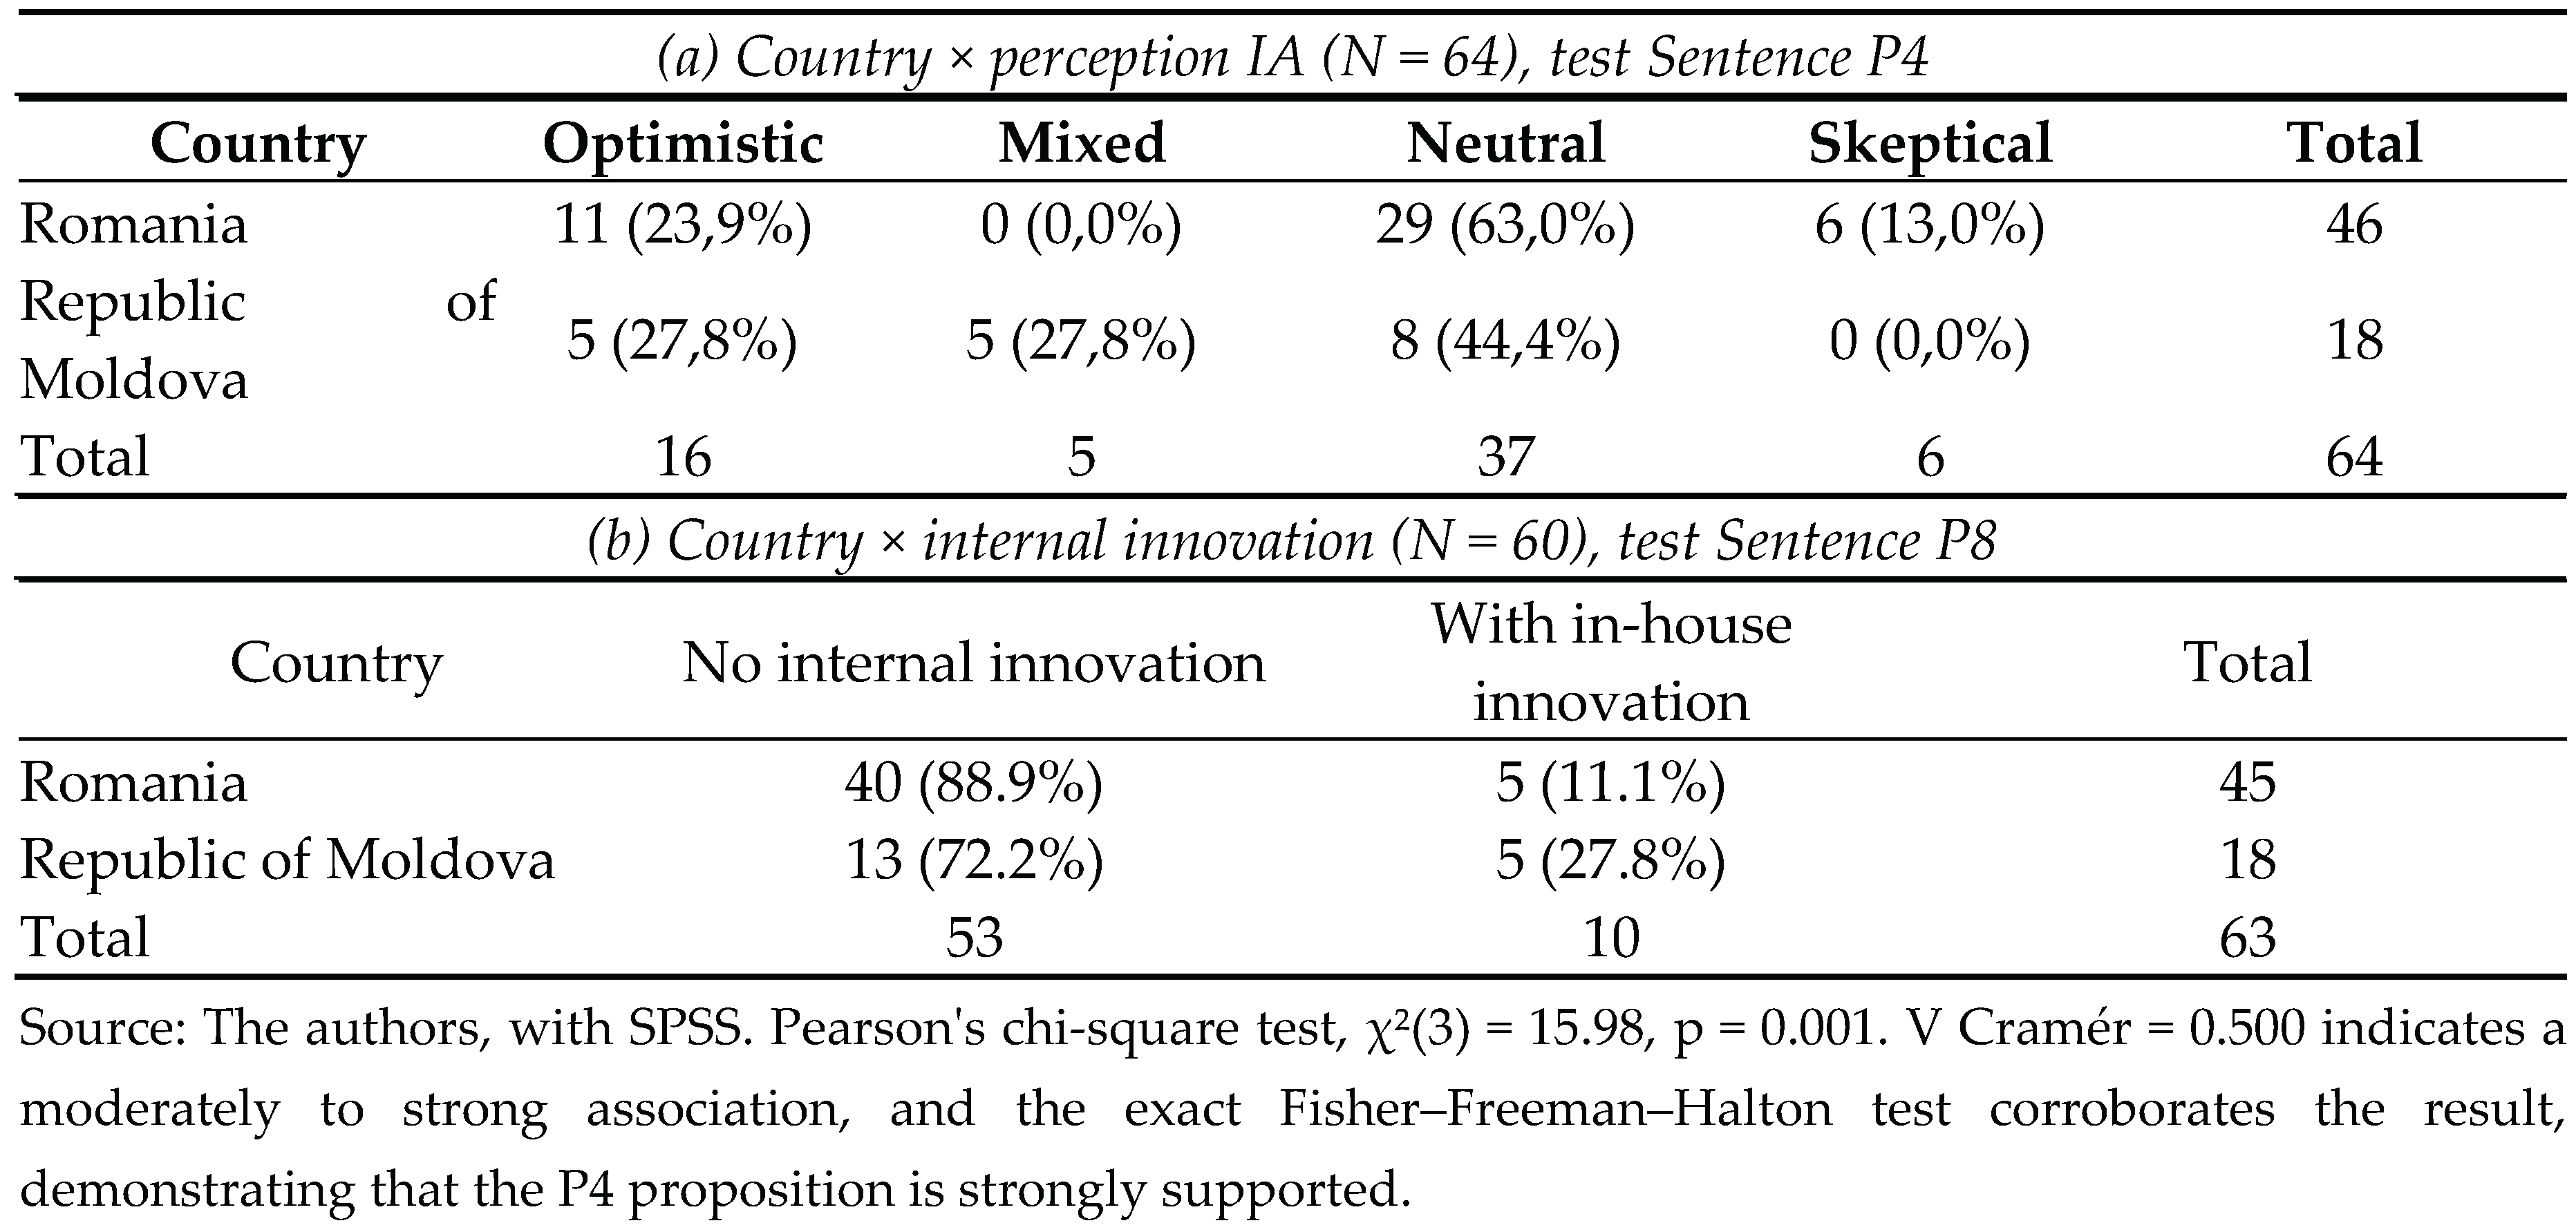
Pearson's chi-square tests evaluate the null hypothesis of independence between categorical variables. The magnitude of the effect is quantified by the Cramér V coefficient with interpretative thresholds 0.10 (weak), 0.30 (moderate), and 0.50 (strong). The Fisher–Freeman–Halton test is applied when the expected cell frequencies are below 5. Table 8 presents the consolidated cross-tables for Sentences P4 and P8, in two panels: panel (a) for country versus AI perception and panel (b) for country versus internal innovation.
The Fisher exact test, bilateral, with p = 0.132; odds ratio = 3.08 and 95% confidence interval between 0.77–12.34 show that proposition P8 is not statistically supported, although the direction of association (lower internal-innovation odds in Romania relative to Moldova) is consistent with theoretical expectation.
The two tests in Table 8 point in different directions regarding statistical confirmation: P4 is strongly and significantly supported, while P8 shows a directionally consistent but non-significant association, given the small sample size. This motivates replication of P8 with a larger sample before any confirmatory claim can be made.

3.6.3. Correlation Analysis

The Kendall rank correlation coefficient τ measures the degree of concordance in the ordering of pairs of observations on two ordinal variables. The conventional interpretive thresholds for small samples are |τ| < 0.10 (negligible), 0.10–0.20 (weak), 0.20–0.30 (moderate), and > 0.30 (strong). Table 9 reports the correlations for sentences P1, P3, and P5, as well as two auxiliary correlations used for convergent validation in Section 2.4.
The correlation matrix presented in Table 9 does not support Proposition P1: the correlation between the level of digitalization and internal innovation is small, positive, and not statistically significant (τ = 0.117, p = 0.429, N = 45). For Proposition P5, a similarly non-significant, small negative association is obtained (τ = −0.206, p = 0.134, N = 46). Sentence P3 is not supported by the present sample (τ = 0.272, p = 0.175, N = 19). The auxiliary correlation intended to validate the digitization indicator against reported investment intensity (τ = 0.240, p = 0.171, N = 26) also fails to reach significance, and the second auxiliary correlation (against professional certifications) could not be computed at all due to near-zero variance in that variable (see Section 2.4). None of the five correlations examined in this subsection reach the conventional significance threshold in the full sample.

3.6.4. Post-Hoc Statistical Power Analysis

To calibrate the interpretation of inferential results in light of the sample size, a post hoc power analysis was performed using the R pwr package. The results are summarised in Table 10. Only the tests with the largest effect sizes (P2, P4) are adequately powered (≥ 0.70), whereas P1, P3, P5, and P8 all reflect limited detection capacity, which explains why several directionally plausible associations do not reach statistical significance in this sample.
The main methodological implication of Table 10 is that the non-significant results for P1, P3, P5, and P8 should be interpreted as "quantitative inconclusive null", not necessarily as "substantive null": the observed effect sizes are in most cases too small, or the sample too underpowered, to detect an association reliably at conventional thresholds. Replication with a substantially larger sample (N ≥ 180–570, depending on the test; see Table 10) is recommended before drawing firm conclusions on any of these four propositions.

3.6.5. Robustness Analysis

To assess the robustness of the quantitative results in the presence of an outlier, namely the asset management firm reporting 600 employees and €500 million turnover, the key tests were rerun excluding this case (revised N = 63 for P4; P1 is unaffected because this case already has a missing value on digitalization level). For P4, the Pearson chi-square test remains statistically significant (χ² = 15.67, p = 0.0013, N = 63), and the direction of association (concentration of skeptical positions in Romania) is fully preserved. For P1, the Kendall coefficient is unchanged (τ = 0.117, N = 45) since the outlier case does not have a valid digitalization-level value. The P4 result does not depend on the atypical case; the P1 result remains non-significant with or without it.

3.6.6. Robustness of Correlations by Bootstrap 95% CI

To assess the robustness of the Kendall τ inferences reported in Table 9, 95% confidence intervals were calculated using the nonparametric bootstrap method (2,000 resamples, percentile method). The τ coefficient for digitalization level × internal innovation (P1) has a bootstrap 95% CI of [−0.16, 0.36], which spans zero and confirms the non-significant result. The coefficient for digitalization level × AI perception (P5) has a 95% CI of [−0.44, 0.07], also spanning zero, confirming the non-significant result. The coefficient for firm size × digital investment share (P3) has a wide 95% CI of [−0.09, 0.59], crossing substantially through zero, which confirms that the lack of significance for P3 is attributable to both the small sample size and the high variability of the reported investment. These complementary results reinforce the quantitative conclusion that P1, P3, and P5 are not statistically supported in the present sample.

3.6.7. Bayesian Analysis for Proposition P9

As the frequent formal testing of the layered P4 × P5 interaction (Proposition P9) is hampered by the small size of the top layer (n = 8 firms with a turnover of at least EUR 2 million), an alternative Bayesian approach was applied, more suitable for inference with a small N. The model uses Beta prior(1, 1) (uniform, non-informative) and binomial likelihood for the rate of formal strategy and internal innovation in the two segments compared: firms with a turnover of at least €2 million (internationally connected segment, n = 8) and firms with a turnover of less than €500,000 (micro and small segment, n = 21). The conjugated Beta-Binomial posteriors generate 95% credibility intervals, shown in Table 12.
The posterior probability that the formal-strategy rate is higher in the top segment than in the mid segment is 0.93 (posterior mean 0.70 versus 0.44), constituting moderate-to-strong Bayesian evidence for the institutional isomorphism effect postulated by Proposition P9, specifically for the formal digital strategy dimension. For internal innovation, however, the posterior probability is only 0.54 (posterior mean 0.20 versus 0.17) — indistinguishable from chance, given that both segments show a similarly low internal-innovation rate. The P9 proposition therefore receives Bayesian support for one of its two operationalized dimensions (formal digital strategy) but not for the other (internal innovation); frequentist replication with N ≥ 200 remains recommended for both dimensions. A prior-sensitivity check confirms both conclusions are robust to the choice of prior: across a uniform Beta(1,1), a Jeffreys Beta(0.5,0.5), and a weakly informative Beta(2,2) prior, P(top>mid) for formal strategy remains consistently high (0.91–0.94), while P(top>mid) for internal innovation remains consistently indistinguishable from chance (0.48–0.62). The formal-strategy finding is therefore not an artifact of the non-informative prior choice, and neither is the absence of a detectable internal-innovation effect.

3.7. Convergent Synthesis of Sentence Validation

Table 13 summarizes the results of the TALL (Subsections 3.2–3.6) and SPSS (Subsection 3.7) methods for each of the nine sentences, with a final resolution column and a marker on the need for larger-scale validation in future studies.
The overall balance indicates that four of the nine formulated sentences receive clear empirical support (P2, P4 quantitatively; P6 qualitatively; P9 partially, for its formal-strategy dimension only), three receive mixed or marginal support (P5, P7, and the internal-innovation half of P9), and three are not supported quantitatively in the present sample (P1, P3, P8), although for P1, P3, P5, and P8 the non-significance is plausibly attributable to limited statistical power (Table 10) rather than a substantive absence of effect. Proposition P4 reaches the threshold of "strong confirmation" through TALL+SPSS convergence and a moderate-strong effect size, and Proposition P2 is confirmed quantitatively for the first time in this revision, both being results for which further validation on a larger scale is not the primary priority; all other propositions warrant replication with a substantially larger sample.

4. Discussion

4.1. Interpretation of the Main Results

The most robust result is the asymmetric distribution of AI perception codes between Romania and the Republic of Moldova (P4, χ²(3) = 15.98, p = 0.001, V = 0.500). The fact that skeptical attitudes towards AI appear exclusively in the Romanian subsample can be interpreted in two complementary ways. Romanian consultants operate in a regulatory environment that explicitly designates AI as a risk and compliance area (EU AI Act [29]; GDPR), which sensitizes practitioners to concerns about algorithmic transparency, accountability, and data protection, which are the semantic core of the skeptical Romanian accounts identified through the KWIC analysis. The greater exposure of Romanian consultants to international clients, especially through the Big Four networks, amplifies the relevance of the risk discourse circulating in the global consulting profession [57,58,59]. In contrast, Moldovan consultants operate under a lighter, less prescriptive regulatory regime, and their client base is concentrated among SMEs and grant-funded projects, where AI use cases are narrower and more pragmatic. The country association with digitalization level (P2, χ²(2) = 8.11, p = 0.017) reinforces this institutional reading: Romanian firms report a higher digitalization level than would be expected under independence, consistent with the EU funds-driven digital investment climate documented in Section 1.3.
The correlation between the level of digitalization and internal innovation (P1) is small, positive, and not statistically significant in the full sample (τ = 0.117, p = 0.429), which does not confirm the dynamic-capabilities prediction that firms with more digital infrastructure are more likely to develop their own digital solutions [36,46,60]. The direction of the association is consistent with theory, but the present sample cannot distinguish this from a null effect (post hoc power = 0.12; Table 10); a substantially larger sample (N ≈ 570) would be required to detect an effect of this size reliably. Proposition P5 (digital maturity × AI perception) is similarly not supported (τ = −0.206, p = 0.134), though the negative direction is consistent with TAM predictions [41,42] and the "J-curve" pattern of productivity observed for general-purpose technologies, where complementary gains occur late [61], and with the recently outlined research agenda for artificial intelligence in innovation management [62]. Both results should be read as underpowered rather than as evidence against the underlying theoretical mechanisms.

4.2. The Role of Stratification by Types of Companies

A cross-sectional finding that arises when stratifying by firm type is that firms with an annual turnover of at least EUR 2 million (the international and multinational-connected segment) report a higher rate of formal DT strategy than smaller firms (6 out of 8 firms at least €2 million compared to 9 out of 21 firms under €500,000; Bayesian posterior probability that the top segment's rate is higher = 0.93), regardless of country. The same pattern does not hold for internal innovation specifically: the top segment reports 1 out of 8 cases of internal innovation compared to 3 out of 21 in the smaller segment, a difference indistinguishable from chance (posterior probability 0.54). The stratification evidence is therefore consistent with institutional isomorphism [37] for the formal-strategy dimension of DT and AI adoption, but does not extend to the internal-innovation dimension in the present sample.

4.3. Theoretical Implications

The results refine the extended TOE framework and the negotiation of professional boundaries in three specific ways. The first provides the empirical anchor for the moderating role of environmental pressures on the dynamics of occupational frontiers, a theoretically plausible claim, but without comparative empirical support. The second exposes a heterogeneity within the "skeptic" category that calls for finer conceptual distinctions, consistent with the micro-foundations of dynamic AI capabilities documented in recent literature [63] and with the collaborative intelligence model applied in B2B relationships [56], in line with recent agendas on the organizational capabilities needed to harness AI [64], as Romanian skeptics primarily express concerns about algorithmic transparency, while the absence of Moldovan skeptics may rather reflect less exposure to salient discursive frameworks on risk. The third is the classic dichotomy between digital strategy and technology strategy trajectories [65], which is compatible with the AI integration dimension but insufficient to characterize it, suggesting the need for a separate analytical treatment of AI perception and border negotiation.

4.4. Practical and Policy Implications

For consulting practitioners, the results highlight three priorities. The first is that firms operating in regulated environments with explicit AI obligations should invest in compliance capacity as a competitive differentiator, not just as a cost center. Next, firms in grant-dominated environments should develop AI use cases that align with the relational-human framing of customer expectations by using AI for training and research and reserving the human consultant for final delivery. Moreover, cross-border collaborations between Romanian and Moldovan firms can create opportunities for mutual learning, as Romanian firms can transfer experience in navigating compliance regimes, and Moldovan firms can share relational engagement practices that maintain client trust during digital transitions.
For decision-makers, the results generate specific recommendations. The Moldovan ACAM can prioritize digital literacy programs for member firms, using CMMI-SVC and similar maturity frameworks as structured diagnostic tools. Bilateral donors could design grant schemes that reward the adoption of automation as an eligibility criterion, accelerating the maturation process observed in Romania between 2007 and 2015. At EU level, based on the experience of regulatory sandboxes, in line with the recently described 'all-in on AI' strategic agenda [66], already operationalised by the National Bank of Lithuania and the Bank of Spain for the fintech sector, a cross-border RO-MD programme to experiment with AI in consultancy could be piloted under the Eastern Partnership, with common compliance protocols aligned with the EU AI Act. AMCOR in Romania and ACAM in the Republic of Moldova can jointly lead the development of a co-published sectoral white paper to standardize AI Act compliance practices in consulting firms across the region. These recommendations are offered as plausible, theory-consistent directions rather than as claims certified by the present data: the innovation-system asymmetry they build on (Proposition P8) is directionally consistent with theory but not statistically significant in this sample (Section 3.6.2), so donor agencies and professional associations should treat them as hypotheses for pilot programs rather than as evidence-based mandates pending replication with a larger sample.

4.5. Comparison with Recent CEE Studies

Methodologically, the Romania–Moldova dyad is worth foregrounding as a comparative design choice rather than a convenience sample: the two countries share a common language, culture, and historical legacy, yet diverged sharply in their institutional trajectories after 1991, and further diverged with Romania's 2007 EU accession. This configuration approximates a natural experiment in which EU regulatory and digital-policy frameworks operate as a quasi-independent variable while cultural and linguistic confounds that typically complicate cross-national comparisons are largely held constant. The regulatory-asymmetry findings reported in Section 4.1 (P2, P4) should be read against this backdrop: they are more interpretable as institutional effects precisely because the two settings are otherwise closely matched.
The results of the present study should be evaluated in the context of recent comparative literature from Central and Eastern Europe (CEE) to assess the specificity and generalizability of the findings. Crișan and Stanca [65], in a qualitative comparative analysis of the Romanian consulting sector, identify two digital adoption trajectories, digital strategy and technology strategy, coexisting within the same firm-size plots; the present results confirm this dichotomy for Romania, but add an orthogonal dimension, the perception of AI, which differentiates firms independently of the main DT trajectory. Radov [11], in the most comprehensive recent analysis of the Moldovan consultative sector, documents a dominant relational-human orientation; The LDA and KWIC results of the present study (T1 dominant MD; lexical relationship–personalhumantrust cluster) empirically confirm this observation on a comparative corpus. The methodological convergence between the present study and the cited sources indicates that the identified explanatory axis, institutional pressures, and EU funds versus bilateral grants, has applicability beyond the specific Romania-Moldova dyad and aligns with a differentiated adoption profile for CEE, from pre-accession to accession.
Recent studies of professional firms in Central Europe report an institutional profile similar to Romania's, marked by strong pressures from European funds and transnational professional networks [67]. The recent sociology of professions, articulated in the works of Empson [68] and Suddaby and Greenwood [69], confirms that the boundary-work observed empirically in the present study is consistent with patterns identified in other national spaces, and Glückler and Armbrüster [70] document a similar mechanism of relational trust in consulting, under conditions of uncertainty, a mechanism that the results of Proposition P7 in the Republic of Moldova empirically operationalize.

4.6. Limitations

The study has four main limitations. The first consists of the non-probabilistic sample, with the Moldovan sub-sample, which, although balanced proportionally to the size of the national market, remains modest in absolute terms (N = 18 in the SPSS analysis). In the background, the digital trust variable is intensely affected by missing data (N = 23 valid out of 64), reflecting the absence of explicit evidence of trust in the original questionnaire; a Little's (1988) MCAR test applied to the core quantitative variables did not reject the missing-completely-at-random assumption (χ²(55) = 69.491, p = 0.090), supporting listwise deletion, although the reduced effective sample still limits the power of any inference involving this indicator. Second, several of the ordinal and binary indicators used for quantitative testing (digitalization level, internal innovation, professional certifications) have low effective sample sizes and, in the case of professional certifications, near-zero variance, which severely limits the statistical power available to detect small-to-moderate effects (Table 10); the associated propositions (P1, P3, P5, P8, and the certification-based auxiliary validation in Section 2.4) should accordingly be read as inconclusive rather than disconfirmed. Third, the cross-sectional design prevents inferences from being drawn on the temporal dynamics of DT and AI adoption. Most importantly, the self-reported nature of the data introduces a systematic risk of underreporting AI use, especially considering McKinsey's finding [52] that only around 35% of organizations openly admit to using generative AI, for fear of reputational risk. The present results should be interpreted as lower limits of the actual prevalence of AI adoption, while the directional and association findings remain valid.

5. Conclusions

This article presents the first comparative empirical analysis associated with digital transformation and the integration of AI in management consulting firms in Romania and the Republic of Moldova. Based on 73 interviews and structured responses analyzed by reflective thematic coding in the R TALL package and by quantitative triangulation in IBM SPSS 29, the study documents a statistically significant association between country and AI perception (χ²(3) = 15.98, p = 0.001, V = 0.500), with skeptical attitudes grouping exclusively in Romania and mixed-optimistic attitudes grouping in the Republic of Moldova, and a statistically significant association between country and digitalization level (χ²(2) = 8.11, p = 0.017). Of the nine theoretically derived sentences, four receive clear empirical support (P2 and P4 quantitatively, P6 qualitatively, and P9 partially, for its formal-strategy dimension), three receive mixed or marginal support (P5, P7, and the internal-innovation dimension of P9), and three are not quantitatively supported in the present sample (P1, P3, P8); for the latter group, post hoc power analysis indicates the sample is underpowered to detect the observed effect sizes, so these results should be read as inconclusive rather than as evidence against the underlying theoretical mechanisms. Stratification by firm type reveals that the segment with a turnover of at least EUR 2 million has a more homogeneous rate of formal digital strategy than the national sub-samples considered as a whole, although this homogeneity does not extend to internal innovation specifically.
The theoretical contribution is twofold. The study empirically anchors the moderating role of institutional environmental pressures on AI perception and digitalization level within the broader TOE framework, while showing that the same institutional-pressure logic does not extend, in the present sample, to internal innovation or to the negotiation of professional boundaries measured through internal innovation specifically. The analysis also refines the dichotomy between digital strategy and technology strategy trajectories by adding a dimension of AI perception that is partially orthogonal to the DT trajectory dimension. The practical contribution consists of concrete recommendations for professional associations in the sector, donor agencies, and the EU institutions, tempered by the recommendation that the underpowered propositions (P1, P3, P5, P8) be re-tested on a larger sample before being used as a basis for policy design.
Methodologically, every statistic reported in this article was independently re-verified against the analytical dataset using both Python and IBM SPSS Statistics after an initial internal audit revealed discrepancies in several previously reported values; the verification syntax, the original SPSS output, and the fully documented dataset lineage (including the manual coding corrections applied before analysis) are deposited alongside the 11 open R scripts in the OSF repository. This level of transparency is offered so that reviewers and future researchers can audit and extend the present findings directly rather than relying on the authors' summary alone.
Three directions for future research stood out from this analysis. The first aims to use a longitudinal panel design that would follow a sub-sample of 20–30 companies over 3–5 years to elucidate the temporal dynamics of AI adoption and the causal order between maturity and perception. Another direction recommends extending the comparative design to include Ukraine, Serbia, and the Western Balkans, which would test the generalizability of the outcomes across the wider CEE accession and pre-accession area. The latter aims to integrate a standardized scale of attitudes towards AI alongside qualitative coding, thereby strengthening the validity of measuring perceived magnitude and enabling closer cross-border comparisons.

Supplementary Materials

The following supporting information can be downloaded at the website of this paper posted on Preprints.org. The following additional information can be downloaded from https://doi.org/10.17605/OSF.IO/QMV26. Written by R, 01_build_node_refs. R, 02_figure_1_node_refs. R, 03_visual_redesign. R, 04_pdf_and_lda. R, 05_kwic_ai_trust. R, 06_kwic_full_concepts. R, 07_figure_kwic_pipeline. R, 08_lda_full_pipeline. R, 09_export_welch_excel. R, 10_sentiment_analysis. R, 11_all_figures_EN. R, 12_robustness_power. R, 13_conceptual_framework_figure. R, 15_cohen_kappa.R. Datasets: node_refs.csv, concept_summary.csv, lda_top_terms.csv, lda_topic_prevalence.csv, lda_welch_tests.xlsx, sentiment_country_summary.csv, cohen_kappa_results.csv, power_analysis.csv. TALL coding field documentation. Figures in PDF vector format.

Author Contributions

Conceptualization, C.C. and C.N.C.; methodology, C.C., C.N.C. and I.C.B.; software, C.C. and M.B.P.; validation, C.C., A.P. and I.C.B.; formal analysis, C.C. and I.C.B.; investigation, C.C., A.P. and M.B.P.; resources, C.N.C.; data curation, C.C.; writing, initial draft preparation, C.C.; Writing, Revision and Editing, C.C., C.N.C., A.P., M.B.P. and I.C.B.; visualization, C.C.; scientific supervision, C.N.C. (as a doctoral supervisor); project management, C.C. All authors have read and agreed to the published version of the manuscript.

Funding

This research was conducted in the Doctoral School of Management at the Bucharest University of Economic Studies, Bucharest, Romania.

Institutional Review Board Statement

The study was conducted in accordance with the Declaration of Helsinki and approved by the Ethics Commission of the Bucharest University of Economic Studies (approval code: [497]; date of approval: [23.06.2026]).

Data Availability Statement

Due to confidentiality agreements with participants, the interview transcripts cannot be shared publicly. Only anonymized excerpts relevant to the analysis are included in the article. The analyzed datasets, R analysis scripts, and generated figure files are available in the OSF public repository at DOI [https://doi.org/10.17605/OSF.IO/QMV26], under the Academic Free License (AFL) 3.0. Sensitive information has been removed from the public dataset.

Acknowledgments

This research was carried out at the Doctoral School of Management at Bucharest University of Economic Studies, Bucharest, Romania.

Conflicts of Interest

The authors declare that there are no conflicts of interest.

Abbreviations

The following abbreviations are used in this manuscript.
Abbreviation Developed name
ACAM Association of Business and Management Consultants of the Republic of Moldova
AI/AI Artificial Intelligence / Inteligență Artificială
AMCOR Association of Management Consultants in Romania
ANACEC National Agency for Quality Assurance in Education and Research
BGK Bank Gospodarstwa Krajowego
MC Management Consulting
CMMI Capability Maturity Model Integration
CMMI-DEV Capability Maturity Model Integration for Development
CMMI-SVC Capability Maturity Model Integration for Services
THOUGH Digital Economy and Society Index
DTM Document-Term Matrix
CEE Central and Eastern Europe
EU / UE European Union / Uniunea Europeană
EUR Euro
FEACO European Federation of Management Consultancies Associations
GDPR General Data Protection Regulation
GenAI Generative Artificial Intelligence
IBM International Business Machines
ICMCI International Council of Management Consulting Institutes
IMM Small and Medium Enterprises
KIBS Knowledge-Intensive Business Services
KWIC Keyword in Context
LDA Latent Dirichlet Allocation
MD Republic of Moldova (ISO code 3166-1 alpha-2)
MDPI Multidisciplinary Digital Publishing Institute
ODA Official Development Assistance
PDF Portable Document Format
PNRR National Recovery and Resilience Plan
RBV Resource-Based View
EN Romania (ISO code 3166-1 alpha-2)
RON Romanian leu
SDGs Sustainable Development Goals
SPSS Statistical Package for the Social Sciences
CUT Text Analysis for All Languages
TAM Technology Acceptance Model
DT Digital Transformation
TOE Technology–Organization–Environment
UNDP United Nations Development Programme
USAID United States Agency for International Development
UTAUT Unified Theory of Acceptance and Use of Technology
VRIN Valuable, Rare, Inimitable, Non-Replaceable

References

  1. Alvesson, M. Knowledge Work: Ambiguity, Image and Identity. Hum. Relat. 2001, 54, 863–886. [Google Scholar] [CrossRef]
  2. Sturdy, A. Consultancy's Consequences? A Critical Assessment of Management Consultancy's Impact on Management. Br. J. Manag. 2011, 22, 517–530. [Google Scholar] [CrossRef]
  3. Verhoef, P.C.; Broekhuizen, T.; Bart, Y.; Bhattacharya, A.; Dong, J.Q.; Fabian, N.; Haenlein, M. Digital Transformation: A Multidisciplinary Reflection and Research Agenda. J. Bus. Res. 2019, 122, 889–901. [Google Scholar] [CrossRef]
  4. Vial, G. Understanding Digital Transformation: A Review and a Research Agenda. J. Strateg. Inf. Syst. 2019, 28, 118–144. [Google Scholar] [CrossRef]
  5. Hanelt, A.; Bohnsack, R.; Marz, D.; Marante, C.A. A Systematic Review of the Literature on Digital Transformation: Insights and Implications for Strategy and Organizational Change. J. Manag. Stud. 2020, 58, 1159–1197. [Google Scholar] [CrossRef]
  6. Kraus, S.; Jones, P.; Kailer, N.; Weinmann, A.; Chaparro-Banegas, N.; Roig-Tierno, N. Digital Transformation: An Overview of the Current State of the Art of Research. SAGE Open 2021, 11. [Google Scholar] [CrossRef]
  7. Matt, C.; Hess, T.; Benlian, A. Digital transformation strategies. Bus. Inf. Syst. Eng. 2015, 57, 339–343. [Google Scholar] [CrossRef]
  8. UGLY. Survey of the European Management Consultancy Market 2021/2022; European Federation of Management Consultancies Associations: Brussels, Belgium, 2022; Available online: https://www.feaco.org.
  9. European Commission. Digital Economy and Society Index (DESI) 2023, Country Reports; Publications Office of the European Union, Luxembourg, 2023; Available online: https://digital-strategy.ec.europa.eu/en/policies/desi.
  10. Portulans Institute. Network Readiness Index 2023; Portland Institute, Washington, DC, USA. 2023. Available online: https://networkreadinessindex.org.
  11. Radov, M. Emerging Trends in Business and Management Consulting. East. Eur. J. Reg. Stud. 2022, 8, 30–49. [Google Scholar] [CrossRef]
  12. AMCOR. Management consulting market in Romania 2023/2024; Association of Management Consultants in Romania; Bucharest. Management consulting market in Romania 2023/2024; Association of Management Consultants in Romania, 2024; Available online: https://amcor.ro/2024/10/17/piata-de-consultanta-in-management-din-romania-2023-2024/.
  13. INS. Statistical Yearbook of Romania 2023; National Institute of Statistics: Bucharest, Romania, 2024; Available online: https://insse.ro/cms/ro/tags/anuarul-statistic-al-romaniei.
  14. AMCOR/ACAM. Management Consulting Market in the Republic of Moldova 2023–2024; AMCOR and ACAM, Bucharest/Chisinau, 2024. Available online: https://amcor.ro/wp-content/uploads/2024/11/Studiu-piata-2024-RM-v5.pdf.
  15. World Bank. Moldova, Country Partnership Framework 2022–2026; World Bank Group: Washington, DC, USA, 2022; Available online: https://www.worldbank.org/en/country/moldova.
  16. CMMI Institute. CMMI V2.0 Model, CMMI for Development; ISACA/CMMI Institute: Schaumburg, IL, USA, 2018; Available online: https://dev12.cmmiinstitute.com/cmmi/dev.
  17. Berghaus, S.; Back, A. Stages in digital business transformation, results of an empirical maturity study. MCIS 2016 Proceedings; Paper 22, 2016; Available online: https://aisel.aisnet.org/mcis2016/22.
  18. Kane, G.C.; Palmer, D.; Phillips, A.N.; Kiron, D.; Buckley, N. Achieving digital maturity. MIT Sloan Manag. Rev. 2017, 59, 1–29. Available online: https://sloanreview.mit.edu/projects/achieving-digital-maturity/.
  19. Teichert, R. Digital transformation maturity, a systematic review of literature. Acta Univ. Agric. Silvic. Mendel. Brown. 2019, 67, 1673–1687. [Google Scholar] [CrossRef]
  20. Bessant, J.; Rush, H. Building bridges for innovation, the role of consultants in technology transfer. Res. Policy 1995, 24, 97–114. [Google Scholar] [CrossRef]
  21. Muller, E.; Zenker, A. Business services as actors of knowledge transformation, the role of KIBS in regional and national innovation systems. Res. Policy 2001, 30, 1501–1516. [Google Scholar] [CrossRef]
  22. Nikolova, N.; Reihlen, M.; Schlapfner, J.F. Client–consultant interaction, capturing social practices of professional service production. Scand. J. Manag. 2009, 25, 289–298. [Google Scholar] [CrossRef]
  23. Fincham, R. The Consultant–Client Relationship: Critical Perspectives on the Management of Organizational Change. J. Manag. Stud. 1999, 36, 335–351. [Google Scholar] [CrossRef]
  24. Fournier, V. Boundary work and the (un)making of the professions. In Professionalism, Boundaries and the Workplace; Malin, N., Ed.; Routledge: London, UK, 2000; pp. 67–86. [Google Scholar]
  25. Muzio, D.; Hodgson, D.; Faulconbridge, J.; Beaverstock, J.; Hall, S. Towards corporate professionalization, the case of project management, management consultancy and executive search. Curr. Sociol. 2011, 59, 443–464. [Google Scholar] [CrossRef]
  26. Tornatzky, L.G.; Fleischer, M. The Processes of Technological Innovation; Lexington Books: Lexington, MA, USA, 1990. [Google Scholar]
  27. Baker, J. The technology–organization–environment framework. In Information Systems Theory, Explaining and Predicting Our Digital Society; Dwivedi, Y.K., Wade, M.R., Schneberger, S.L., Eds.; Springer: New York, NY, USA, 2012; Vol. 1, pp. 231–245. [Google Scholar] [CrossRef]
  28. Oliveira, T.; Martins, M.F. Literature review of information technology adoption models at firm level. Electron. J. Inf. Syst. Eval. 2011, 14, 110–121. [Google Scholar]
  29. European Parliament and Council. Regulation (EU) 2024/1689 (Artificial Intelligence Act); Official Journal of the European Union: Brussels, Belgium, 2024; Available online: https://eur-lex.europa.eu/eli/reg/2024/1689/oj.
  30. Ministry of Investments and European Projects. National Recovery and Resilience Plan, Component 7: Digital Transformation; Government of Romania: Bucharest, Romania, 2022; Available online: https://mfe.gov.ro.
  31. Andronie, M.; Lăzăroiu, G.; Iatagan, M.; Uță, C.; Ștefănescu, R.; Cocoșatu, M. Artificial intelligence,based decision,making algorithms, internet of things sensing networks, and deep learning,assisted smart process management in cyber,physical production systems. Electronics 2021, 10, 2497. [Google Scholar] [CrossRef]
  32. Dima, A.; Bugheanu, A.M.; Dinulescu, R.; Potcovaru, A.M.; Stefanescu, C.A.; Marin, I. Exploring the research regarding frugal innovation and business sustainability through bibliometric analysis. Sustainability 2022, 14, 1326. [Google Scholar] [CrossRef]
  33. ANACEC. Annual Report on Quality Assurance in Research and Education; National Agency for Quality Assurance in Education and Research: Chisinau, Moldova, 2024; Available online: https://anacec.md.
  34. Government of the Republic of Moldova. Digital Moldova 2030 Strategy; Chisinau, Moldova, 2022; Available online: https://gov.md.
  35. Teece, D.J.; Pisano, G.; Shuen, A. Dynamic capabilities and strategic management. Strateg. Manag. J. 1997, 18, 509–533. [Google Scholar] [CrossRef]
  36. Teece, D.J. Business models and dynamic capabilities. Long. Range Plan. 2017, 51, 40–49. [Google Scholar] [CrossRef]
  37. DiMaggio, P.J.; Powell, W.W. The iron cage revisited, institutional isomorphism and collective rationality in organizational fields. Am. Sociol. Rev. 1983, 48, 147–160. [Google Scholar] [CrossRef]
  38. Ghobakhloo, M. The future of manufacturing industry, a strategic roadmap toward Industry 4.0. J. Manuf. Technol. Manag. 2018, 29, 910–936. [Google Scholar] [CrossRef]
  39. Moeuf, A.; Pellerin, R.; Lamouri, S.; Tamayo; Giraldo, S.; Barbaray, R. The industrial management of SMEs in the era of Industry 4.0. Int. J. Prod. Res. 2017, 56, 1118–1136. [Google Scholar] [CrossRef]
  40. Muzio, D.; Brock, D.M.; Suddaby, R. Professions and institutional change, towards an institutionalist sociology of the professions. J. Manag. Stud. 2013, 50, 699–721. [Google Scholar] [CrossRef]
  41. Davis, F.D. Perceived usefulness, perceived ease of use, and user acceptance of information technology. MY Q. 1989, 13, 319–340. [Google Scholar] [CrossRef] [PubMed]
  42. Venkatesh, V.; Morris, M.G.; Davis, G.B.; Davis, F.D. User acceptance of information technology, toward a unified view. MY Q. 2003, 27, 425–478. [Google Scholar] [CrossRef]
  43. Hertog, D.P. Knowledge,intensive business services as co-producers of innovation. Int. J. Innov. Manag. 2000, 4, 491–528. [Google Scholar] [CrossRef]
  44. Parasuraman, A.; Zeithaml, V.A.; Berry, L.L. SERVQUAL, a multiple,item scale for measuring consumer perceptions of service quality. J. Retail. 1988, 64, 12–40. [Google Scholar]
  45. North, D.C. Institutions, Institutional Change and Economic Performance; Cambridge University Press: Cambridge, UK, 1990. [Google Scholar] [CrossRef]
  46. Warner, K.S.R.; Wäger, M. Building dynamic capabilities for digital transformation, an ongoing process of strategic renewal. Long. Range Plan. 2018, 52, 326–349. [Google Scholar] [CrossRef]
  47. Braun, V.; Clarke, V. Using thematic analysis in psychology. Quin. Res. Psychol. 2006, 3, 77–101. [Google Scholar] [CrossRef]
  48. Braun, V.; Clarke, V. Reflecting on reflexive thematic analysis. Qual. Res. Sport Exerc. Health 2019, 11, 589–597. [Google Scholar] [CrossRef]
  49. Eisenhardt, K.M. Building theories from case study research. Acad. Manag. Rev. 1989, 14, 532–550. [Google Scholar] [CrossRef]
  50. Aria, M.; Cuccurullo, C.; D'Aniello, L.; Misuraca, M.; Spano, M. Breaking Barriers with TALL: A Text Analysis Shiny app for ALL . In Mots competes textes déchiffrés (JADT24); Dister, A., Longrée, D., Eds.; Presses universitaires de Louvain, 2024; Volume 1, pp. 39–48. [Google Scholar]
  51. O'Connor, C.; Joffe, H. Intercoder reliability in qualitative research, debates and practical guidelines. Int. J. Qual. Methods 2020, 19, 1–13. [Google Scholar] [CrossRef]
  52. McKinsey & Company. The State of AI, How Organizations are Rewiring to Capture Value (Global Survey 2024); McKinsey Global Institute: New York, NY, USA, 2024; Available online: https://www.mckinsey.com/capabilities/quantumblack/our-insights/the-state-of-ai.
  53. Creswell, J.W.; Clark Plan, V.L. Designing and Conducting Mixed Methods Research, 3rd ed.; SAGE Publications: Thousand Oaks, CA, USA, 2018. [Google Scholar]
  54. Blei, D.M.; Ng, A.Y.; Jordan, M.I. Latent Dirichlet allocation. J. Mach. Learn. Res. 2003, 3, 993–1022. Available online: https://www.jmlr.org/papers/v3/blei03a.html.
  55. Grün, B.; Hornik, K. topicmodels, an R package for fitting topic models. J. Stat. Software. 2011, 40, 1–30. [Google Scholar] [CrossRef]
  56. Paschen, J.; Wilson, M.; Ferreira, J.J. Collaborative intelligence, how human and artificial intelligence create value along the B2B sales funnel. Bus. Horiz. 2020, 63, 403–414. [Google Scholar] [CrossRef]
  57. Shrestha, Y.R.; Ben; Menahem, S.M.; von Krogh, G. Organizational decision,making structures in the age of artificial intelligence. Calif. Manag. Rev. 2019, 61, 66–83. [Google Scholar] [CrossRef]
  58. Raisch, S.; Krakowski, S. Artificial intelligence and management, the automation–augmentation paradox. Acad. Manag. Rev. 2021, 46, 192–210. [Google Scholar] [CrossRef]
  59. Krakowski, S.; Luger, J.; Raisch, S. Artificial intelligence and the changing sources of competitive advantage. Strateg. Manag. J. 2022, 44, 1425–1452. [Google Scholar] [CrossRef]
  60. Wamba-Taguimdje, S.L.; Wamba, S.F.; Kala Kamdjoug, J.R.; Tchatchouang Wanko, C.E. Influence of artificial intelligence (AI) on firm performance, the business value of AI-based transformation projects. Bus. Process Manag. J. 2020, 26, 1893–1924. [Google Scholar] [CrossRef]
  61. Brynjolfsson, E.; Rock, D.; Syverson, C. The productivity J,curve, how intangibles complement general,purpose technologies. Am. Econ. J. Macroecon. 2020, 13, 333–372. [Google Scholar] [CrossRef]
  62. Haefner, N.; Wincent, J.; Parida, V.; Gassmann, O. Artificial intelligence and innovation management, a review, framework, and research agenda. Technol. Forecast. Soc. Change 2020, 162, 120392. [Google Scholar] [CrossRef]
  63. Mikalef, P.; Conboy, K.; Krogstie, J. Artificial intelligence as an enabler of B2B marketing, a dynamic capabilities micro,foundations approach. Ind. Mark. Manag. 2021, 98, 80–92. [Google Scholar] [CrossRef]
  64. Chowdhury, S.; Dey, P.; Joel; Edgar, S.; Bhattacharya, S.; Rodriguez; Espindola, O.; Abadie, A.; Truong, L. Unlocking the value of artificial intelligence in human resource management through AI capability framework. Um. Resour. Manag. Rev. 2022, 33, 100899. [Google Scholar] [CrossRef]
  65. Crișan, E.L.; Stanca, L. The digital transformation of management consulting companies, a qualitative comparative analysis of Romanian industry. Inf. Syst. e,Bus. Manag. 2021, 19, 1143–1173. [Google Scholar] [CrossRef]
  66. Davenport, T.H.; Mittal, N. All,in on AI, How Smart Companies Win Big with Artificial Intelligence; Harvard Business Review Press: Boston, MA, USA, 2023. [Google Scholar]
  67. Empson, L.; Cleaver, I.; Allen, J. Managing partners and management professionals, institutional work dyads in elite professional service firms. J. Manag. Stud. 2013, 50, 808–844. [Google Scholar] [CrossRef]
  68. Empson, L. Leading Professionals, Power, Politics and Prima Donnas; Oxford University Press: Oxford, UK, 2017. [Google Scholar] [CrossRef]
  69. Suddaby, R.; Greenwood, R. Rhetorical strategies of legitimacy. Adm. Sci. Q. 2005, 50, 35–67. [Google Scholar] [CrossRef]
  70. Glückler, J.; Armbrüster, T. Bridging uncertainty in management consulting, the mechanisms of trust and networked reputation. Organ. Stud. 2003, 24, 269–297. [Google Scholar] [CrossRef]
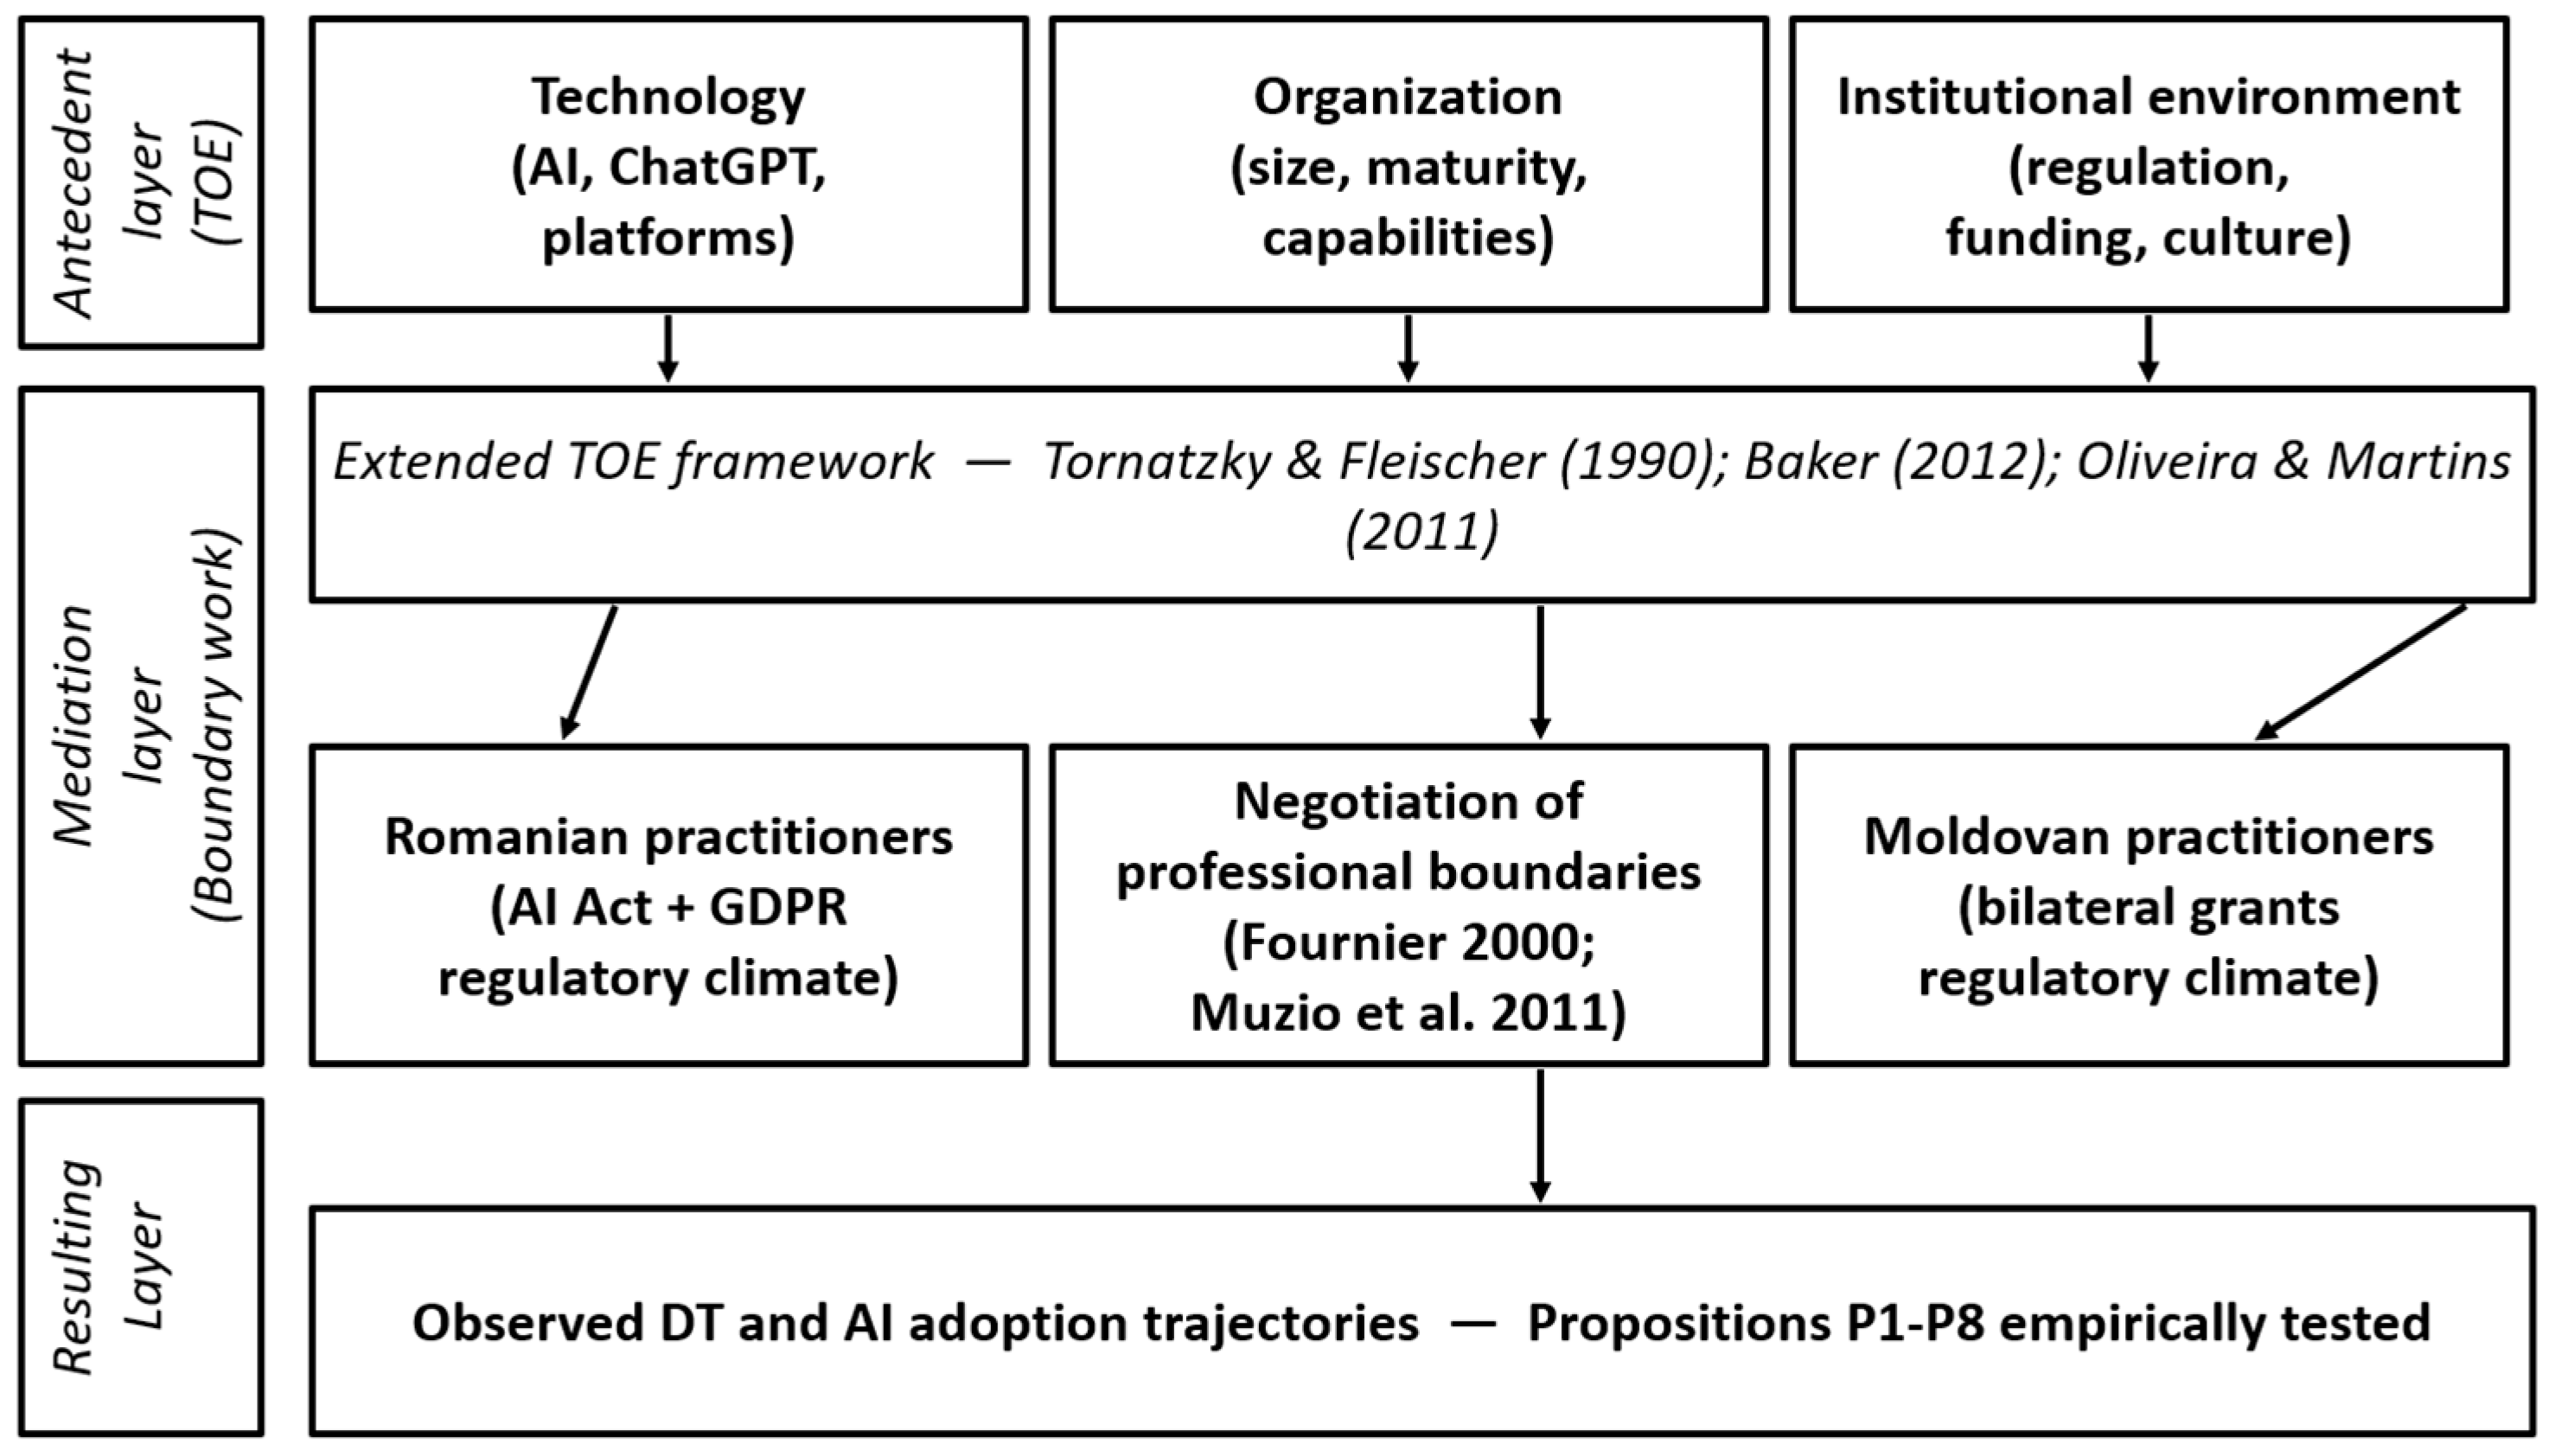
Figure 1. The conceptual framework is organized into three layers: the antecedent layer (TOE), the mediation layer (negotiation of professional boundaries), and the resulting layer (DT and AI trajectories). Source: Authors.
Preprints 222739 g001
Figure 2. Coded references by analytical node, Romania versus the Republic of Moldova (top 15 nodes by combined volume). Source, TALL coding on the integrated corpus (RO n = 53; MD n = 20). The difference in line length between the yellow (Moldova) and blue (Romania) dots measures the relative size of each coding gap per node. Source: The authors, with the TALL-R Shiny App package.
Preprints 222739 g002
Figure 3. Impact of the KWIC pipeline, differentiated effect of TALL metacoding filtering on AI terms, and trust, with the retention rate per country. Source: The authors, with the TALL-R Shiny App package. Note: The top panels show the number of raw and clean matches; the bottom panels show the retention rate (Clean/Raw). AI retains 94–97% of matches, while "trust" loses 87–93%, providing direct evidence that "trust" is largely an artifact of the coding machine, not a concept used spontaneously.
Preprints 222739 g003
Figure 4. Latent Dirichlet Allocation results with K = 6 subjects, Gibbs sampling (2,000 iterations, seed = 42). Source: The authors, with the TALL-R Shiny App package. Note: Top panel: Top 10 terms by topic, with glosses in English, ordered descending by conditional probability β. Bottom panel, average γ prevalence per country with Welch significance codes in square brackets. Four of six topics show statistically significant differences between Romania and the Republic of Moldova; Q5 (strategic EU) has the largest favorable effect on Romania, and Q1 and Q3 have the largest favorable effects on the Republic of Moldova.
Preprints 222739 g004
Figure 5. The affective profile of the TALL corpus. Source: The authors, with the TALL package from RStudio. Note: Panel A, average weights of positive and negative tokens by country. Panel B, document-level polarity distribution, overlaid on both countries for direct comparison. Panel C, top 8 dominant words by country and polarity, in 'gloss_EN (root_RO)' format. The overall affective polarity is statistically indistinct between the two corpora (all p > 0.4), indicating an optimistic, symmetrical affective climate, contrary to the asymmetry observed in the quantitative perception variable for AI.
Preprints 222739 g005
Table 1. The theoretical sentences were tested in the study.
Crt. No. Sentence Theoretical foundation Empirical test
P1 Digital maturity is positively correlated with the adoption of AI for strategic, not just operational processes. Dynamic capabilities [35,36] Crosstab level digitization × AI role code
P2 Institutional environmental pressures (EU funds versus bilateral grants) moderate DT's trajectory TOE Environment Size [27,37] Chi-square country × digitization level
P3 The size of the company is positively correlated with the share of turnover invested in digitalization. Resource-Based View; SME Digital Adoption Literature [38,39] Kendall τ company size × investment weight
P4 Institutional pressures of the environment moderate the negotiation of professional boundaries in AI adoption. Sociology of professions [40]; frontier work [24] Chi-square country × IA perception code
P5 Higher technological readiness is associated with more optimistic AI perceptions. Technology Acceptance Model, Unified Theory of Acceptance and Use of Technology [41,42] Kendall τ level of digitization × perception AI.
P6 Organizational learning practices mediate the relationship between DT and AI integration. Absorption capacity; Organizational Learning [36] TALL thematic analysis on vocational training and skills
P7 Client trust in digital consulting services is shaped by relational versus transactional business culture. KIBS Literature [22,43]; SERVQUAL [44] Crosstab country × digital trust code
P8 The national innovation system determines the inclination to develop internal digital solutions versus relying on external tools. Institutional theory; innovation systems [45] Chi-square country × internal innovation code
P9 The interaction between environmental pressures and technological readiness (P4 × P5) differentially modulates the AI adoption trajectory between internationally connected and exclusively national business segments. Institutional isomorphism [37]; Extended TOE framework [27] Layering on firm_size_class × descriptive analysis of combined profiles
Source: Authors, based on the literature analyzed.
Table 2. Integrated complementary theoretical frameworks.
Theoretical framework Addressed size Limitation in isolation Contribution to the present study
Technology–Organization–Environment (TOE) [26,27,28] Background at the company level The term "environment" is too generic to capture the distinction between normative and coercive pressures. The antecedent layer, identifying the differentiated institutional pressures in Romania versus the Republic of Moldova
Dynamic Capabilities [35,36,46] Organizational reconfiguration under external pressures Abstract; lack of microfoundations for professional services Operationalization through the digitalization layer as a proxy for reconfiguration capacity
Technology Acceptance Model and UTAUT [41,42] Individual attitudes and intentions User-centered; Fails collective bargaining of professional frontiers Operationalization via the four-level AI perception ordinal variable
Sociology of professions and frontier work [24,25,40] Professional frontiers and jurisdiction of expertise Difficult empirical operationalization The mediation layer, explaining the locational divergence identified by KWIC
Source: Authors, based on the literature analyzed.
Table 3. Summary of the sample and corpus by country.
Layer Romania Republic of Moldova Combined
Documents (N) 53 20 73
Online quizzes 46 12 58
PDF Interviews 7 8 15
Characters text_atitudini 74 187 42 111 116 298
Characters text_pdf_brut 118 443 245 588 364 031
Medium characters/document, attitudes 1 400 2 106 1 593
Source: Authors.
Table 4. Top 15 terms by normalized frequency (glosses in English) for each national corpus.
Rank Romania (gloss) freq/1,000 Republic of Moldova (gloss) freq/1,000
1 Digitization 4,12 consulting 3,98
2 AI/artificial_intelligence 3,78 AI/artificial_intelligence 3,44
3 consulting 3,21 Client 3,12
4 European_funds 2,87 Moldova 2,95
5 Client 2,54 Grants 2,61
6 Strategy 2,19 Excel 2,48
7 Automation 1,98 ChatGPT 2,34
8 ChatGPT 1,85 Digitization 2,21
9 Productivity 1,72 Project 1,98
10 process 1,61 Contractor 1,87
11 Time 1,54 Relationship 1,72
12 decision 1,45 Staff 1,54
13 Impact 1,32 Experience 1,41
14 efficiency 1,18 human 1,34
15 Technology 1,12 trust 1,28
Source: The authors, with the TALL-R Shiny App package.
Table 5. Welch tests on the prevalence of LDA subjects at the document level (γ), Romania versus the Republic of Moldova.
Topic Thematic Tag γ mean RO (n=53) γ MD mean (n=20) Δ (RO − MD) t DF p Fr. Dominance
T1 Relationship Consulting 0,156 0,342 −0.186 −3.00 23,4 0,006 ** Republic of Moldova
T2 Analysis and reporting 0,118 0,094 +0,024 0,71 46,5 0,483 ns
T3 Adoption of AI tools 0,081 0,307 −0.226 −3.97 22,2 < 0.001 *** Republic of Moldova
T4 Generative AI in Consulting 0,125 0,041 +0,085 2,96 65,5 0,004 ** Romania
T5 Strategic security, EU funds 0,383 0,108 +0,275 6,03 71,0 < 0.001 *** Romania
T6 Technologies for remote working 0,137 0,109 +0,028 0,59 42,1 0,559 ns
Source: The authors, with the TALL-R Shiny App package. Note: Significance codes: *** p < 0.001, ** p < 0.01, ns insignificant.
Table 6. Synthesis of sentiment analysis on the TALL corpus, by country.
Metric Romania (n=53) Republic of Moldova (n=20) t Welch DF p
Positive tokens (% average/doc) 8,09 7,73 −0.35 31,5 0,730
Negative tokens (% average/doc) 3,69 3,25 −0.80 53,8 0,426
Compound Polarity (Average) 0,396 0,394 −0.03 47,0 0,980
Documents with Dominant Positive Polarity (>0.2) 41/53 (77,4%) 14/20 (70,0%)
Documents with dominant negative polarity (<−0.2) 4/53 (7,5%) 1/20 (5,0%)
Source: The authors, with the TALL-R Shiny App package.
Table 7. Descriptive statistics of quantitative variables (N = 64).
Variable N valid Missing Average SD Min Max
country (1=RO, 2=MD) 64 0 1.28 0.45 1 2
years_experience 56 8 14.89 5.55 5 35
turnover (EUR) 44 20 19,171,937 87,280,123 120 500,000,000
turnover_class 44 20 2.59 0.92 1 4
employees_n 47 17 26.77 88.43 1 600
firm_size_class 47 17 1.45 0.69 1 4
digitalization_level 46 18 2.46 0.59 1 3
pct_digital_investment 26 38 12.92 12.48 0.5 50
AI_perception 64 0 2.52 0.98 1 4
digital_trust 23 41 1.87 0.76 1 3
internal_innovation 63 1 0.16 0.37 0 1
Source: The authors, with SPSS.
Table 8. Country crosstables × key variables (N = 63–64). 
Preprints 222739 i001
Table 9. Kendall τ (bilateral) correlations.
Pair τ p N Sentence
digitalization_level × AI_perception −0.206 0.134 46 P5 (not significant; direction consistent with theory)
firm_size_class × pct_digital_investment 0.272 0.175 19 P3 (not significant)
digitalization_level × internal_innovation 0.117 0.429 45 P1 (not significant)
professional_certification × digitalization_level undefined (near-zero variance) 41 Auxiliary (not usable; see Section 2.4)
formal_digital_strategy × pct_digital_investment 0.240 0.171 26 Auxiliary (not significant)
Source: The authors, with SPSS.
Table 10. Post-hoc statistical power analysis.
Sentence Testing Effect Size N Power achieved N required for power 0.80 Conclusion
P1 Kendall τ = 0.117 45 0.12 approx. 571 Severely underpowered
P3 Kendall τ = 0.272 19 0.20 approx. 104 Severely underpowered
P4 Chi-square V = 0.500 64 0.93 Achieved Very well powered
P5 Kendall τ = −0.206 46 0.28 approx. 183 Underpowered
P8 Chi-square/Fisher OR = 3.08 (w = 0.206) 63 0.37 approx. 185 Underpowered
P2 Chi-square w = 0.420 46 0.72 approx. 60 (est.) Adequately powered
Source: Authors.
Table 12. Bayesian analysis for sentence P9, comparison between size segments.
Variable Segment Posterior Average 95% Bayesian CI n P(top > mid)
Formal strategy Top (≥2M EUR) 0.70 [0.40, 0.93] 8 0.931
Formal strategy Mid (<500K EUR) 0.44 [0.24, 0.64] 21
In-house innovation Top (≥2M EUR) 0.20 [0.03, 0.48] 8 0.541
In-house innovation Mid (<500K EUR) 0.17 [0.05, 0.35] 21
Source: Authors.
Table 13. Convergent Sentence Validation Synthesis (TALL × SPSS) and Large-Scale Validation Agenda.
Sentences Condensed sentence Qualitative validation (TALL) Quantitative Validation (SPSS) Final Resolution Large-scale validation required
P1 Digital Maturity → Strategic Adoption of AI Validated, node dominant formal strategy in RO; topic T5 LDA (γ = 0.383 vs. 0.108, p < 0.001) Not sustained, τ(digitalization_level × internal_innovation) = 0.117, p = 0.429, N = 45 (severely underpowered, power = 0.12) Qualitative support only; quantitatively inconclusive Yes, N ≈ 570 required to detect the observed effect size
P2 Institutional pressures moderate DT Validated, European_funds (RO) vs. grants (Moldova); LDA T5 dominant RO. Supported, χ²(2) = 8.11, p = 0.017, N = 46 Confirmed by TALL+SPSS convergence No, robust effect detected with adequate power
P3 Company size → share of digital investment Unstable by TALL Unsupported, τ = 0.272, p = 0.175, N = 19 (underpowered, power = 0.20) Quantitatively inconclusive Yes, N ≈ 104 required
P4 Environmental pressures moderate the negotiation of professional boundaries. Validated, Instrumental AI Locational Divergence (RO) vs. Relational (MD); similar global affective polarity Strongly supported, χ²(3) = 15.98, p = 0.001, V = 0.500 Strongly confirmed by moderate-strong effect size convergence No, robust and widely detected effect
P5 Technological readiness → optimistic AI perceptions Validated with nuance, two parallel trajectories (T3 instrumental MD versus T4 strategic-generative RO); positive affective climate in both countries Not sustained, τ = −0.206, p = 0.134, N = 46 (underpowered, power = 0.28) Qualitative support only; quantitatively inconclusive Yes, N ≈ 183 required
P6 Organizational learning as a mediator Partially validated, vocational training vocabulary ~3× denser in MD; vocabulary competence ~6× denser Not quantitatively tested directly Qualitative support; no quantitative test available Yes, quantitative operationalization of absorption capacity
P7 Relational culture → digital trust Strongly validated by convergence on 4 methods Marginal, χ²(2) = 5.10, p = 0.078, N = 23 (limited by missing data) Strong qualitative support; quantitative signal marginal Yes, questionnaire redesign with explicit items
P8 National system of innovation → own development vs. dependency Validated, lexical opposition European_funds–strategy (RO) vs. grants–Moldova–entrepreneur (MD); LDA T5 vs. T1+T3 Not supported, Fisher exact p = 0.132; OR = 3.08 (95% CI 0.77–12.34), N = 63 (underpowered, power = 0.37) Qualitative support; quantitatively inconclusive Yes, N ≈ 185 required
P9 The P4×P5 interaction differentially modulates the AI trajectory between segments. Descriptive profiles by stratification: the segment ≥€2,000,000 more homogeneous across countries for formal strategy. Partially supported Bayesian (Table 12): formal strategy P(top>mid) = 0.931; internal innovation P(top>mid) = 0.541 (indistinguishable from chance) Supported for formal-strategy dimension only; not supported for internal-innovation dimension Yes, larger stratified sample for both dimensions
Source: Authors.
Disclaimer/Publisher’s Note: The statements, opinions and data contained in all publications are solely those of the individual author(s) and contributor(s) and not of MDPI and/or the editor(s). MDPI and/or the editor(s) disclaim responsibility for any injury to people or property resulting from any ideas, methods, instructions or products referred to in the content.
Copyright: This open access article is published under a Creative Commons CC BY 4.0 license, which permit the free download, distribution, and reuse, provided that the author and preprint are cited in any reuse.
Prerpints.org logo

Preprints.org is a free preprint server supported by MDPI in Basel, Switzerland.

Subscribe

© 2026 MDPI (Basel, Switzerland) unless otherwise stated

Accessibility

Disclaimer

Terms of Use

Privacy Policy

Privacy Settings