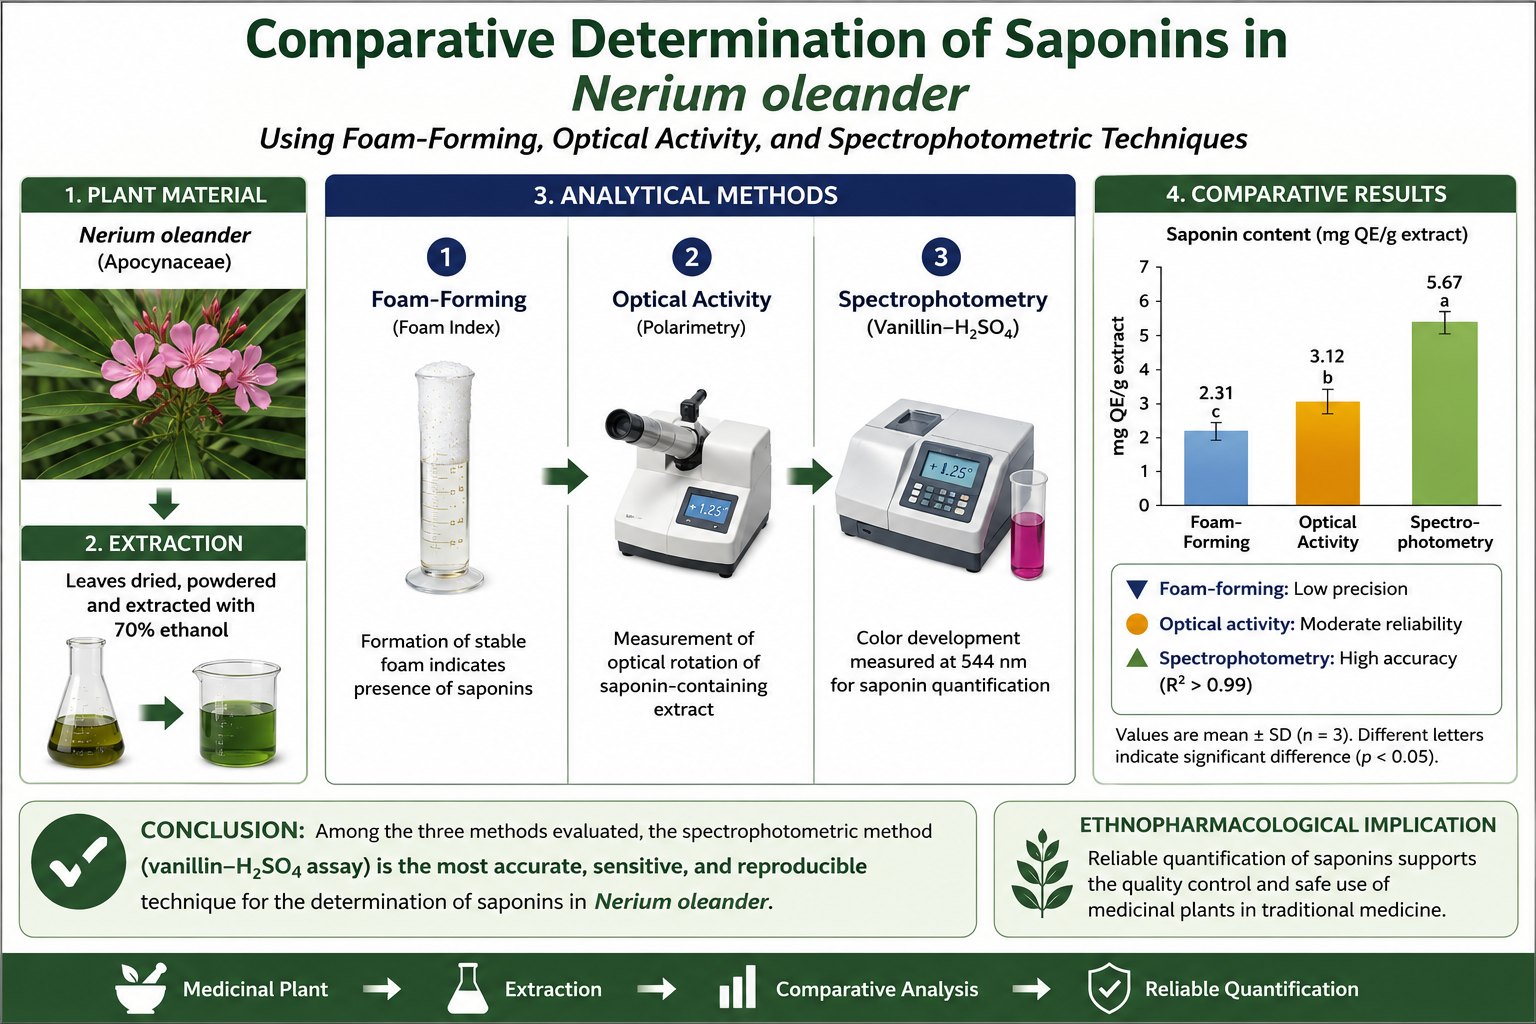
Preprint
Article

This version is not peer-reviewed.

Comparative Evaluation of Extraction Solvents and Analytical Methods for Saponin Quantification in Nerium oleander Leaves: Implications for Phytochemical Standardization

Submitted:

06 July 2026

Posted:

14 July 2026

You are already at the latest version

Abstract

Nerium oleander L is a medicinal plant of significant ethnopharmacological importance, yet its well-documented toxicity necessitates rigorous phytochemical characterization and standardization. This study comprehensively evaluated the influence of eight extraction solvents of varying polarity (water, methanol, ethanol, acetone, dichloromethane, chloroform, ethyl acetate, and hexane) and three analytical methods (foam-forming, optical activity, and spectrophotometric vanillin-acetic acid) on saponin quantification in N. oleander leaf extracts. Plant material was collected, dried, pulverized, and extracted via maceration, with saponin content determined using the three analytical approaches. Data were analyzed using two-way ANOVA with replication and Tukey’s HSD post-hoc testing. Results demonstrated statistically significant variation in saponin yield attributable to both extraction solvent (F = 143.44, p < 0.001) and analytical method (F = 90.53, p < 0.001), with a significant interaction effect (F = 6.35, p < 0.001). Polar solvents, particularly methanol (18.22 ± 0.57%) and ethanol (16.32 ± 3.94%), exhibited superior extraction efficiency, consistent with the glycosidic nature of saponins. Hexane yielded anomalously elevated content (18.00 ± 2.57%), potentially due to unique hydrogen-bonding interactions. The spectrophotometric method consistently produced the highest saponin values due to enhanced sensitivity, while the foam-forming method proved suitable only for preliminary screening, and optical activity lacked specificity due to interference from other chiral constituents. This study conclusively demonstrates that methodological selection critically influences saponin quantification, with significant implications for ethnopharmacological standardization and quality control. Based on these findings, methanol extraction followed by spectrophotometric vanillin-acetic acid analysis is recommended as the optimal protocol for routine quantitative analysis, providing the highest sensitivity, reproducibility, and practical feasibility. These findings provide an evidence-based framework for method selection and underscore the necessity of harmonized analytical protocols to ensure accuracy, reproducibility, and comparability in natural product research, thereby supporting the safe and effective development of N. oleander-based therapeutics and cosmetic formulations.

Keywords: 
;  ;  ;  ;  ;  

1. Introduction

Medicinal plants have served as a cornerstone of traditional healthcare systems for millennia, with approximately 80% of the global population relying on plant-based remedies for primary healthcare needs, particularly in developing regions [1]. The therapeutic potential of these botanical resources lies in their diverse array of secondary metabolites, which have garnered increasing scientific interest for pharmaceutical development and ethnopharmacological validation. Among the vast repertoire of medicinal flora, Nerium oleander L. (Apocynaceae) stands out as a species of considerable pharmacological significance and toxicological concern, having been utilized in traditional medicine across various cultures for the treatment of conditions ranging from cardiac disorders to dermatological ailments [2,3]. In South Africa, N. oleander is widely cultivated as an ornamental species, and its traditional medicinal applications include the treatment of skin conditions, hemorrhoids, and as a cardiotonic, despite the inherent risks of poisoning [4].
The bioactive profile of N. oleander is characterized by a complex mixture of phytochemicals, most notably cardiac glycosides (oleandrin, neriifolin) and saponins, which collectively mediate its diverse biological activities [3]. Saponins, a structurally heterogeneous class of amphiphilic glycosides, have attracted substantial research attention due to their demonstrated antimicrobial, anti-inflammatory, immunomodulatory, and anticancer properties, as well as their surface-active characteristics that render them valuable in pharmaceutical and cosmetic formulations [5,6]. Saponins are classified into two major groups—triterpenoid and steroidal glycosides—based on their aglycone structure, with the former being more prevalent in dicotyledonous plants such as N. oleander (Apocynaceae). This structural diversity influences their physicochemical properties and, consequently, their extractability and detectability by various analytical methods [7]. However, the same glycosidic nature that underpins their therapeutic potential also contributes to their hemolytic activity and, in conjunction with cardiac glycosides, the well-documented toxicity of N. oleander, necessitating rigorous phytochemical characterization and standardization for safe and effective therapeutic application [8,9].
Despite the ethnopharmacological significance of N. oleander, the accurate quantification of its saponin content remains a formidable analytical challenge. Methodological inconsistencies arising from the selection of extraction solvents and analytical techniques have led to considerable variability in reported saponin yields, undermining the reproducibility and comparability of research findings [8,10]. The efficiency of saponin extraction is intrinsically linked to solvent polarity, given the amphiphilic nature of these compounds comprising hydrophilic sugar moieties and lipophilic aglycones [11]. Polar solvents such as methanol and aqueous ethanol are generally favored for their ability to disrupt hydrogen bonding and solubilize glycosidic compounds, whereas non-polar solvents may preferentially extract the aglycone fractions [6]. Concurrently, the choice of analytical methodology—ranging from conventional gravimetric approaches (foam-forming, optical activity) to more sensitive spectrophotometric techniques—profoundly influences detection limits, specificity, and quantitative accuracy [12,13].
The selected solvents in this study encompass a broad polarity range (water, polarity index 9.0; hexane, 0.1), enabling systematic evaluation of polarity-dependent extraction efficiency. Additionally, these solvents represent those commonly employed in phytochemical laboratories and industrial extraction processes, enhancing the practical relevance of findings. Extensive research has documented the inherent variability in phytochemical quantification arising from methodological differences across various plant species; however, limited systematic investigation has been directed toward evaluating how these factors specifically influence saponin determination in N. oleander [14,15]. For N. oleander, accurate saponin quantification is particularly critical given the species’ narrow therapeutic index. Saponins contribute to both the therapeutic (anti-inflammatory, antimicrobial) and toxicological (hemolytic, membrane-disrupting) profiles of the plant. Without reliable quantification, the risk-benefit assessment of N. oleander-based preparations remains inherently compromised, potentially endangering consumers in traditional medicine settings where dosage standardization is lacking [9].
This knowledge gap is further compounded by the absence of standardized analytical protocols, which impedes the development of quality control measures for N. oleander-based phytopharmaceuticals and cosmetic products, potentially compromising consumer safety and product efficacy [6,8]. Regulatory frameworks, including the African Traditional Medicine (ATM) policy and the World Health Organization’s guidelines on herbal quality control, emphasize the necessity of validated analytical protocols for ensuring product safety and efficacy [16]. However, the lack of harmonized methodologies for saponin quantification remains a significant barrier to regulatory compliance in developing countries.
Therefore, the present study was undertaken to comparatively evaluate the influence of eight extraction solvents of varying polarity (water, methanol, ethanol, acetone, dichloromethane, chloroform, ethyl acetate, and hexane) and three analytical methods (foam-forming, optical activity, and spectrophotometric) on the quantification of saponins in N. oleander leaf extracts. By employing rigorous statistical analysis, including two-way ANOVA with replication and post-hoc Tukey’s HSD testing, this study aims to delineate the methodological factors contributing to analytical variability and identify optimal protocols for reliable saponin quantification. The findings are intended to contribute to the standardization of phytochemical analysis protocols, enhance the reproducibility of ethnopharmacological data, and provide a robust framework for quality control in the development of plant-based therapeutics and cosmetic formulations derived from N. oleander.

2. Materials and Methods

2.1. Plant Material Collection and Preparation

Fresh leaves of Nerium oleander L. were collected from a cultivated nursery in Vereeniging, Gauteng Province, South Africa (26°40′S, 27°55′E) during the flowering stage. The plant material was identified by a traditional healer and was purchased at Magic Lawns Nursery in Vereeniging. To comply with botanical documentation and alignment with scientific standards, the plant name was cross-checked and validated using internationally recognized taxonomic databases, including Plants of the World Online (POWO), World Flora Online (WFO), and the Medicinal Plant Names Services (MPNS). Leaves were thoroughly washed with distilled water, air-dried at ambient temperature (25 ± 2 °C) for 14 days, and ground to a fine powder (particle size < 0.5 mm) using a laboratory mill. The powdered material was stored in airtight containers at 4 °C until further analysis.

2.2. Plant Material Extraction

Powdered leaf material (50 g) was extracted with 500 mL of each solvent (1:10 w/v ratio) by maceration at room temperature (25 ± 2 °C) with intermittent shaking (150 rpm) for 72 hours. The solvents evaluated included water, methanol, ethanol, acetone, dichloromethane, chloroform, ethyl acetate, and hexane, selected to encompass a broad polarity range (polarity index: 0.1–9.0). The extract was filtered through Whatman No. 1 filter paper, and the residue was re-extracted twice with fresh solvent (2 × 250 mL) to ensure complete extraction. The combined filtrates were concentrated under reduced pressure at 40 °C using a rotary evaporator (Büchi Rotavapor R-210) to obtain the crude extract, which was then dried to constant weight in a vacuum desiccator and stored at 4 °C until analysis. All extractions were performed in triplicate, and results are expressed as mean ± standard deviation.

2.3. Determination of Saponins Using Foam-Forming Method

The foam-forming assay was performed according to the ASTM D1173 International method [17] with modifications. Filtrate obtained after extraction (5 mL) was transferred to a 100 mL graduated measuring cylinder and diluted with 10 mL of distilled water. The cylinder was stoppered and shaken vigorously for 30 seconds, then allowed to stand for 1 minute. Foam height (cm) was measured from the surface of the liquid to the top of the foam layer. Foam stability was recorded as the time taken for the foam to collapse completely. Each sample was analyzed in triplicate. A standard curve was prepared using a commercially available saponin standard (e.g., quillaja saponin) at concentrations ranging from 0.1–2.0 mg/mL. Saponin content was calculated using the equation derived from the standard curve and expressed as percentage of raw material used (w/w).

2.4. Determination of Saponins Using Optical Activity Method

Optical rotation was measured using a polarimeter (Model [SAC-i Saccharimeter], Atago) at the sodium D line (589 nm) at 25 ± 0.5 °C. Filtrates (1 mL) were placed in a 10 cm polarimeter tube, and the observed rotation (α) was recorded in triplicate. Specific rotation [α] was calculated using the equation:
[α]25D = α×100 /l × c
  • α = observed rotation
  • l = path length in decimetres
  • c = concentration in g/100 mL
A solvent blank was measured for each solvent system and subtracted from the sample readings to correct for any baseline optical activity. Saponin content was calculated by reference to a standard curve prepared using oleanolic acid, a triterpenoid sapogenin standard commonly employed for saponin quantification, and expressed as percentage of raw material used (w/w).

2.5. Spectrophotometric Determination of Saponins Using a Sapogenin Standard

The spectrophotometric method was performed according to the modified vanillin-acetic acid method of Sharma et al. [12]. Briefly, extract (1 mL) was transferred to a test tube and the solvent was evaporated at 60 °C. To the dried residue, 0.5 mL of vanillin reagent (8% w/v vanillin in ethanol) and 5 mL of 72% (v/v) sulfuric acid were added. The mixture was heated in a water bath at 60 °C for 15 minutes, cooled to room temperature, and absorbance was measured at 550 nm using a UV-Vis spectrophotometer (Model [Cary 60]). A calibration curve was prepared using oleanolic acid (sapogenin standard) at concentrations of 0.1–1.0 mg/mL. The colour was allowed to develop for 30 minutes and remained stable for at least 2 hours. All measurements were performed in triplicate, and saponin content was expressed as percentage of raw material used (w/w) calculated from the calibration curve equation.

2.6. Data Analysis

Statistical analysis was performed using Microsoft Data Analysis tools. All experiments were conducted with three biological replicates, each analyzed in triplicate (technical replicates), and results are expressed as mean ± standard deviation. Q-Q plots. Two-way analysis of variance (ANOVA) with replication was employed to evaluate the effects of extraction solvent (8 levels) and analytical method (3 levels), as well as their interaction, on saponin content. Post-hoc comparisons were performed using Tukey’s Honestly Significant Difference (HSD) test. Significance was set at α = 0.05. The criteria for methodological evaluation included sensitivity (detection limit and quantification limit), linearity (coefficient of determination, R2), and reproducibility (intra-day and inter-day precision).

3. Results

3.1. Comparative Analysis of Saponins in Nerium oleander (N. oleander) Using Foam-Forming, Optical Activity, and Spectrophotometric Methods

3.1.1. Determination of Saponin Content Using Foam-Forming Method

  • Table 1 shows the results for the estimation of saponin content from the Foam-forming method;
  • The most stable foam was produced by water, methanol, and hexane solvents with stability time of more than 60, 120, and 180 minutes, respectively;
  • The highest saponin content of 14.24% of raw material used, was provided by hexane;
  • Generally, highly polar solvents resulted in the highest saponin content.

3.1.2. Determination of Saponin Content Using Optical Activity Method

  • Table 2 shows the results for the estimation of saponin content using Optical Activity method;
  • The highest saponin content of 17.28% of raw material used, was also provided by hexane
  • Generally, highly polar solvents resulted in the highest saponin content.

3.1.3. Determination of Saponin Content from Spectrophotometric Method Using Sapogenin Standard

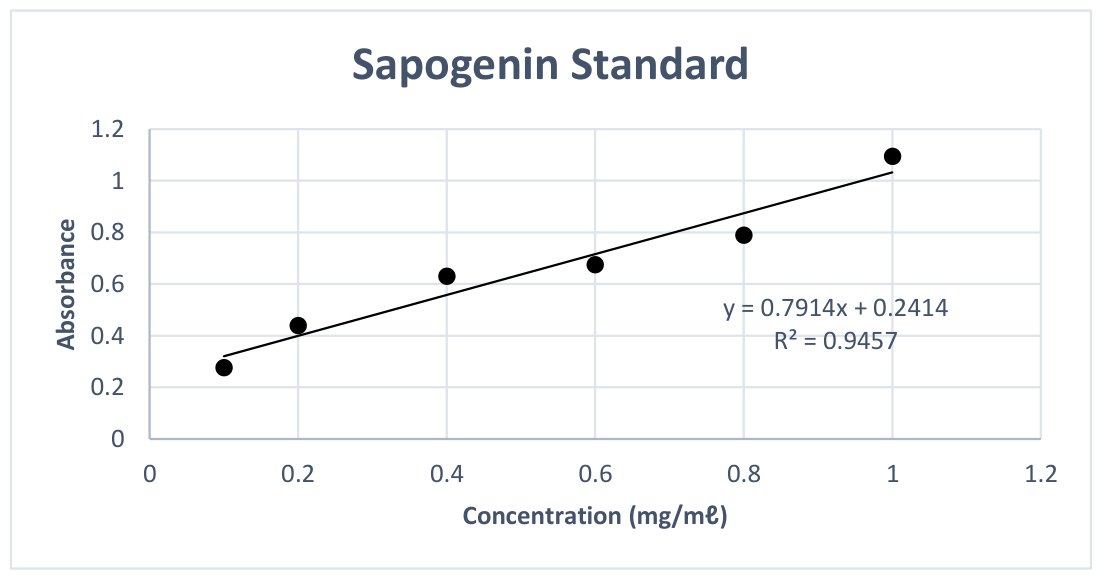
  • Figure 1 is the calibration curve of the sapogenin standard with a good correlation coefficient (R2 = 0.9457);
  • Table 3 shows the results of the absorbance versus concentration for the sapogenin standard;
  • Table 4 shows the results for the estimation of saponin content using Spectrophotometric method;
  • The highest saponin content or 18.0% was again provided by hexane;
  • Generally, highly polar solvents resulted in the highest saponin content.

3.1.4. Comparative Analysis of the Saponin Content from Foam-Forming, Optical Activity, and Spectrophotometric Methods

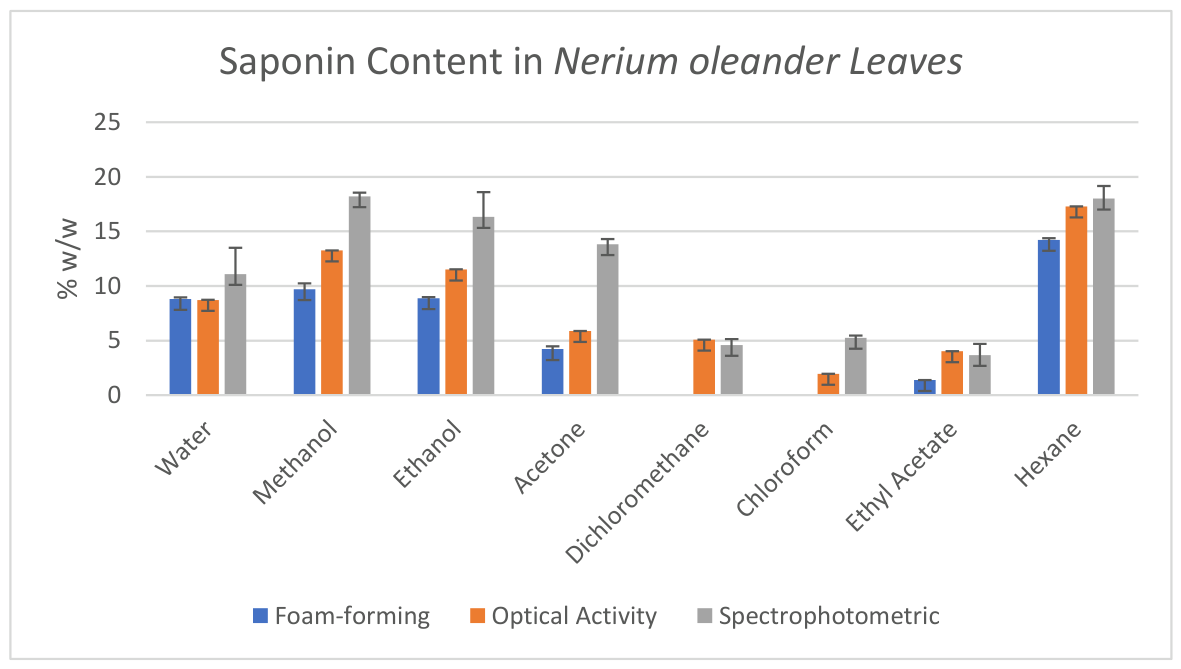
  • Figure 2 is a bar chart illustrating the comparison of the saponin content of N. oleander from the foam-forming, optical activity and spectrophotometric methods;
  • Saponin content from spectrophotometric method decreased with decrease in polarity of the solvent from methanol (18.22 ± 0.57%) to dichloromethane (4.60 ± 0.92%);
  • Foam-forming method showed a decrease in saponin content from methanol (9.71 ± 0.92%) to acetone (4.20± 0.45%);
  • Optical Activity method decreased in saponin content from methanol (13.25 ± 0.012%) to acetone (1.95± 0.01%);
  • Generally, spectrophotometric method produced higher saponin content;
  • There seemed to be no significant difference between the saponin content between Foam-forming and Optical Activity methods or between Optical activity and Spectrophotometric methods.

3.1.5. Investigating Whether or Not the Saponin Content Between Any Two Methods Was Significant

  • Table 5 illustrates the descriptive statistics of the saponin data to evaluate if the data followed normal distribution. Normal distribution is determined by the closeness of the mean to the median of the data points;
  • Both the mean and median, which are 8.49 and 8.71 respectively, are very close to each other. The other determining factor is the skewness of the data, which should be nearly zero. The skewness of the data was 0.28 which was closer to zero;
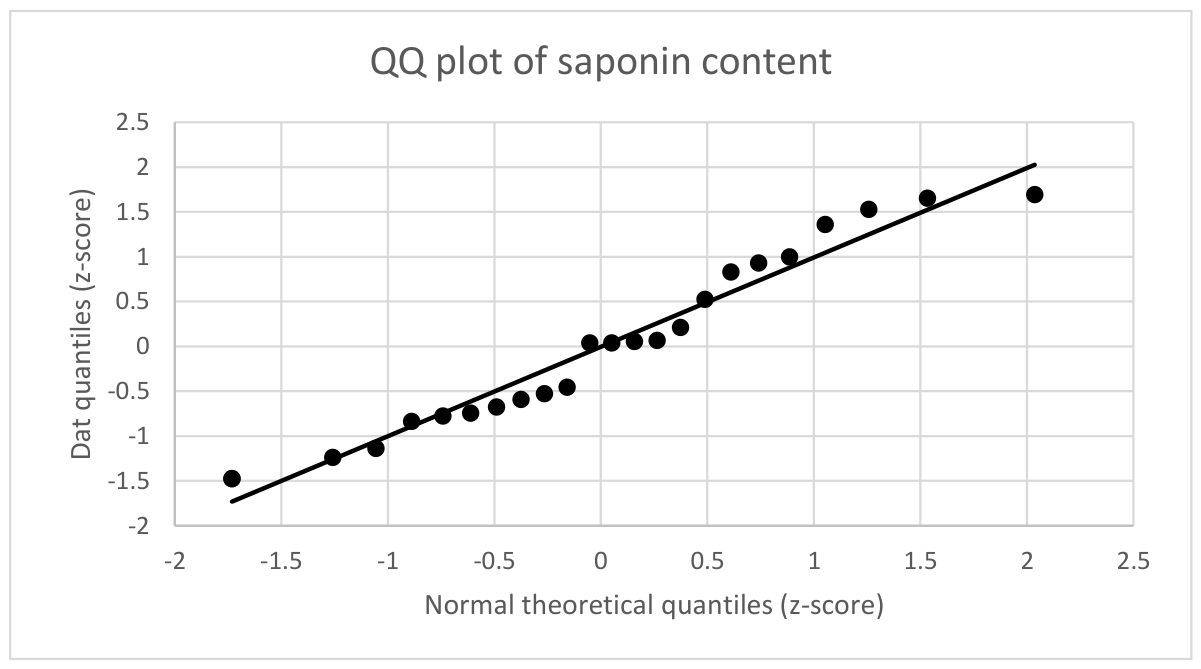
  • Figure 3 shows the Q-Q plot of the normal distribution curve for the data obtained from the saponin content derived from the foam-forming, optical activity and spectrophotometric methods. For data that comes from a normal distribution, most data points should lie on or near the straight line;
  • The Q-Q plot of the data quantiles (z-score) versus the normal theoretical quantiles (z-score) showed that most data points lied on or near the straight line, which confirmed the data was normally distributed;
  • Table 6 shows the results obtained with the two-way ANOVA (with replication) to investigate whether or not the means of the three analysis methods were significantly different;
  • Table 7 shows the mean saponin content from foam-forming, optical activity and spectrophotometric methods;
  • Table 8 illustrates the post hoc Tukey’s HSD test results;
  • The analysis showed a significant effect of extraction solvent (F = 143.44, p < 0.001), indicating that solvent type played a critical role in the extraction efficiency of saponins;
  • The analytical method also had a significant effect (F = 90.53, p < 0.001), demonstrating differences in sensitivity and quantification among the three methods used;
  • A significant interaction effect between extraction solvent and analytical method was observed (F = 6.35, p < 0.001), suggesting that the effectiveness of each method depends on the solvent employed. This interaction was particularly evident for methanol extracts, where spectrophotometric analysis yielded significantly higher values than foam-forming (18.22% vs. 9.71%), while for hexane extracts, the difference was less pronounced (18.00% vs. 14.24%);
  • Post-hoc analysis using Tukey’s HSD test indicated that the spectrophotometric method vs optical activity method produced moderate significant difference in some extracts (p < 0.05), while in others there were no significant difference (p > 0.05);
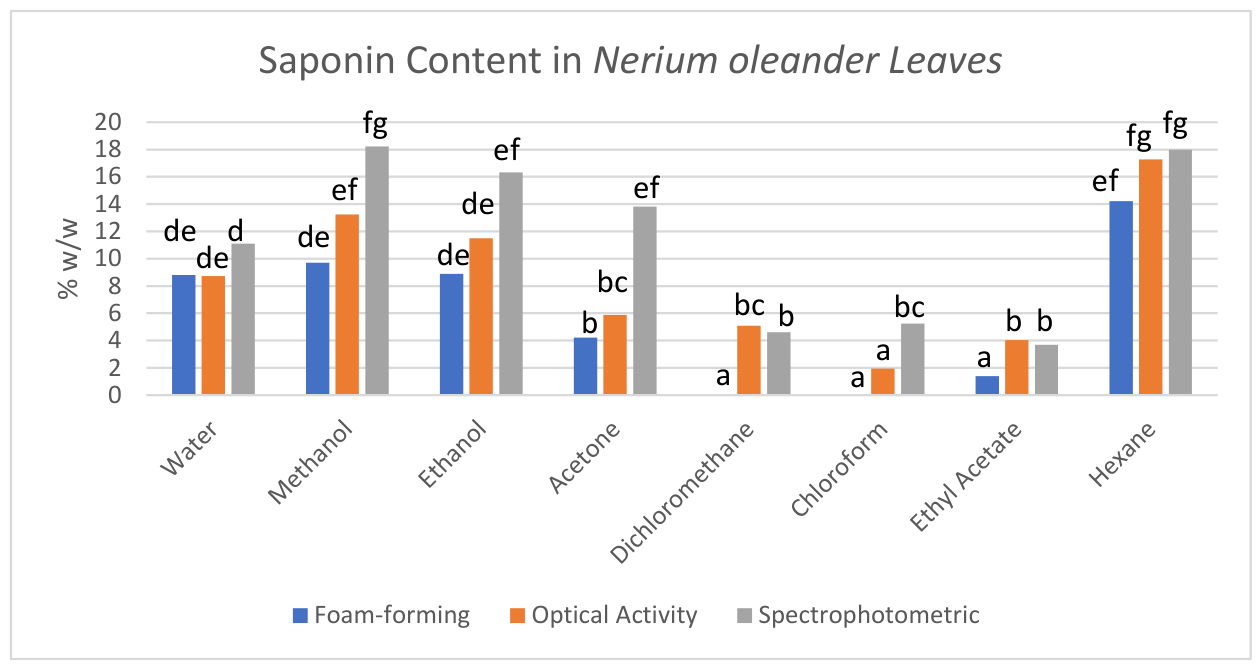
  • Figure 4 is an account of the observed trends between the different methods as outlined in the post-hoc analysis;
  • Figure 4 demonstrated that methanol extracts analyzed by spectrophotometric method (letter designation: de and fg) and acetone extracts (letters: b and ef) showed significant differences compared to foam-forming method results. This is illustrated by the similar and overlapping letters shown by all the extracting solvents;
Table 8 showed that there was no significant difference in the saponin content obtained between foam-forming and optical activity methods, as well as between optical and spectrophotometric methods. This is illustrated by the similar and overlapping letters shown by all the extracting solvents. The significant difference in the saponin content between foam-forming and spectrophotometric methods is illustrated by the methanol (de and fg) and acetone (b and ef) solvents.

3.2. Formatting of Mathematical Components

The saponin content of samples using Foam-forming method was calculated using the following equation,
% S a p o n i n s   ( F o a m f o r m i n g ) = F o a m v o l u m e F i n a l v o l u m e g E x t r a c t g S a m p l e T o t a l v o l u m e F i l t r a t e v o l u m e 100  
where Total volume = Filtrate + Water.
The saponin content of samples using Optical Activity method was calculated using the following equation,
% S a p o n i n s   ( o p t i c a l   a c t i v i t y ) = [ ] A R m a x g E x t r a c t g S a m p l e 100
where
  • α = observed rotation
  • [ ] = A R m i n
  • ARmin = minimum degrees of angular rotation (AR) = +45o
  • ARmax = maximum degrees of angular rotation (AR) = +225o.
The saponin content of samples using Spectrophotometric method was calculated using the following equation,
C o n c e n t r a t i o n = A b s o r b a n c e 0.2414 0.7914 m g / m L × V o l u m e   o f   s o l u t i o n   ( m L ) M a s s   o f   e x t r a c t   d i s s o l v e d ( m g ) × g E x t r a c t g S a m p l e × 100

4. Discussion

Polar solvents, particularly methanol (9.71 ± 0.92%) and water (8.82 ± 0.25%), provided appreciable foam formation, consistent with the glycosidic nature of saponins and their affinity for polar media through hydrogen bonding [12]. The observed absence of foam formation in dichloromethane and chloroform extracts suggests that non-polar solvents failed to extract saponins effectively, likely due to the hydrophilic nature of the glycosidic moieties, which require polar environments for solubilization [6].
Contrariwise, hexane produced substantial foam formation (14.24 ± 0.27%) despite its low polarity (polarity index = 0.1), consistent with previously reported anomalous behaviour [18]. This unexpected result requires further investigation through complementary analytical techniques, such as thin-layer chromatography (TLC) or high-performance liquid chromatography (HPLC), to confirm whether the foam-active substances are indeed saponins or other surface-active compounds co-extracted by hexane. The foam stability data further supported these observations, with hexane extracts demonstrating exceptional foam stability (>180 minutes), followed by methanol (>120 minutes) and water (>60 minutes). In contrast, ethanol, acetone, dichloromethane, chloroform, and ethyl acetate extracts exhibited rapid foam collapse (<1 minute), indicating either low saponin content or the presence of foam-destabilizing compounds.
The foam-forming method, while useful as a rapid preliminary screening tool, exhibited inherent limitations for precise quantitative analysis. The subjective nature of foam height measurement, the influence of factors such as temperature, pH, and the presence of other surface-active agents, and the lack of specificity (as other compounds may also produce foam) render this method suitable primarily for qualitative or semi-quantitative assessment rather than definitive quantification [15]. These limitations underscore the need for more sensitive and specific analytical approaches for accurate saponin determination.
The relationship between optical rotation and saponin concentration is not strictly linear due to the potential contribution of other optically active compounds, including flavonoids, which were inconclusively detected in preliminary phytochemical screening [18]. This lack of specificity represents a significant limitation of the optical activity method, rendering it suitable primarily for preliminary screening rather than definitive quantification. Furthermore, the use of a fixed minimum angular rotation value of +45° lacks mechanistic justification and may introduce systematic bias, as baseline optical activity can vary depending on the solvent system and the presence of other chiral constituents. The method also assumes that all observed optical activity is attributable to saponins, an assumption that may not hold true for complex plant extracts containing multiple chiral secondary metabolites [5].
Despite these limitations, the optical activity method demonstrated greater sensitivity than the foam-forming method, as evidenced by the detection of saponin-related optical activity in all extracts, including those where foam formation was minimal or absent. This enhanced sensitivity, combined with the relative simplicity and speed of the measurement, positions the optical activity method as a useful complementary tool for preliminary screening. However, for accurate quantification, more specific techniques such as spectrophotometry or chromatography are essential.
The spectrophotometric method produced the highest saponin values among the three analytical approaches, with methanol (18.22 ± 0.57%) and hexane (18.00 ± 2.57%) yielding the highest content, followed by ethanol (16.32 ± 3.94%) and acetone (13.83 ± 0.81%). The enhanced sensitivity of the spectrophotometric method is attributable to the chromogenic reaction between vanillin and the aglycone moiety of saponins in acidic conditions, which enables detection of saponin-related compounds across a broader concentration range, including those present at trace levels that may escape detection by gravimetric approaches [12,15].
The relatively high standard deviation observed for ethanol extracts (3.94%) may reflect incomplete extraction or batch-to-batch variability, emphasizing the need for rigorous quality control in routine applications. Similarly, the elevated standard deviation for hexane extracts (2.57%) suggests variability in the anomalous extraction behaviour discussed previously, further underscoring the need for method validation and optimization. These results are comparable with findings from other studies. For example, a saponin content of 20 ± 2.845% using the spectrophotometric method was obtained from Sapindus mukorossi Gaertn (pericarp of fruit) by Singh and co-workers using methanol:water (1:1) (Singh et al. 2019). Similarly, studies on other saponin-rich plants have reported values ranging from 5–25% depending on the extraction solvent and analytical method employed [11,14].
It is important to note that the spectrophotometric method quantifies sapogenin equivalents rather than true saponin content, as the vanillin-acetic acid reaction primarily detects the aglycone moiety following acid hydrolysis of the glycosidic bonds. This should be considered when interpreting results and comparing with studies using different standards (e.g., quillaja saponin, aescin). The spectrophotometric method is not without limitations, including potential interference from other chromogenic compounds (e.g., phenolic acids, flavonoids) and the requirement for a suitable reference standard. Future studies employing HPLC-MS would provide more specific saponin profiles and enable accurate quantification of individual saponin congeners.
The observed differences between spectrophotometric and gravimetric methods align with previous reports indicating that spectrophotometric techniques provide greater sensitivity (detection limits typically 0.1–1.0 μg/mL versus mg/mL for gravimetric methods) and broader analyte coverage [14]. The foam-forming method, while rapid and cost-effective, is inherently semi-quantitative and influenced by factors such as temperature, pH, and the presence of other surface-active agents. The optical activity method offers intermediate performance but suffers from a lack of specificity, as previously discussed.
From an ethnopharmacological perspective, reliable quantification of bioactive compounds such as saponins is essential for validating traditional medicinal uses and ensuring the safety and efficacy of plant-based therapies. Furthermore, the results have implications for the development of phytopharmaceuticals and cosmetic formulations, where consistent bioactive content is required for quality control.

5. Conclusions

This study provides a comprehensive comparative evaluation of extraction solvents and analytical methodologies for saponin quantification in Nerium oleander, revealing critical insights with significant implications for ethnopharmacological research, phytochemical standardization, and natural product quality control. The findings unequivocally demonstrate that both the choice of extraction solvent and analytical technique exert substantial and statistically significant influences on measured saponin content (p < 0.001), confirming that methodological selection is not merely a procedural consideration but a determinant factor affecting the reproducibility and comparability of phytochemical data.
Among the solvents evaluated, polar solvents—particularly methanol (18.22 ± 0.57%) and ethanol (16.32 ± 3.94%)—consistently yielded the highest saponin recoveries across all analytical methods, attributable to their superior capacity to solubilize the glycosidic moieties of saponin molecules through hydrogen bonding and dipole-dipole interactions. The comparative analytical evaluation demonstrated that the spectrophotometric vanillin-acetic acid method provided the highest sensitivity and broadest detection capability, yielding consistently higher saponin values than both the foam-forming and optical activity methods. The foam-forming method, while useful as a rapid preliminary screening tool, exhibited inherent limitations for precise quantitative analysis due to subjective endpoint determination and susceptibility to interference from other surface-active compounds. Similarly, the optical activity method, despite offering greater sensitivity than foam-forming, lacked sufficient specificity for reliable saponin quantification.
Based on these findings, we recommend the use of methanol extraction followed by spectrophotometric vanillin-acetic acid analysis for routine saponin quantification in N. oleander, as this combination provides the highest sensitivity, reproducibility, and practical feasibility. However, for studies requiring definitive identification of saponin constituents, chromatographic techniques such as HPLC-MS should be employed as a confirmatory step.
The study has several limitations that should be acknowledged. First, the spectrophotometric method quantifies sapogenin equivalents rather than true saponin content, as the vanillin-acetic acid reaction primarily detects the aglycone moiety following acid hydrolysis. Second, the anomalous hexane extraction results require further investigation using complementary spectroscopic techniques to confirm the identity of the extracted compounds. Third, the study was conducted on plant material from a single geographical location and collection period, and seasonal or geographic variations in saponin content were not evaluated. Fourth, the lack of chromatographic confirmation limits the specificity of the saponin identification.
From an ethnopharmacological perspective, reliable quantification of bioactive compounds such as saponins is essential for validating traditional medicinal uses and ensuring the safety and efficacy of plant-based therapies. For N. oleander, a species with a narrow therapeutic index, accurate saponin quantification is particularly critical for establishing safe dosage parameters and standardizing herbal preparations. The demonstrated variability arising from methodological differences poses a significant challenge to regulatory compliance and may contribute to inconsistent clinical outcomes or adverse effects if not adequately addressed. The findings of this study provide an evidence-based framework for method selection and advocate for the adoption of harmonized analytical protocols to enhance data reliability and facilitate meaningful inter-study comparisons in natural product research, thereby supporting the safe and effective development of N. oleander-based therapeutics and cosmetic formulations.
Based on the findings of this study and the identified methodological limitations, the following recommendations are proposed to advance phytochemical standardization, enhance analytical reliability, and support the safe development of N. oleander-based products. These recommendations are organized according to methodological priorities, research gaps, and practical applications.
Methodological Recommendations for Routine Analysis
The comparative evaluation conducted in this study provides a clear basis for methodological selection in saponin quantification. For routine quantitative analysis of saponins in N. oleander, the spectrophotometric vanillin-acetic acid method using methanol extracts is recommended as the optimal protocol. This combination demonstrated superior sensitivity (mean saponin content of 18.22 ± 0.57%), excellent reproducibility (standard deviation of 0.57%), and practical feasibility, making it suitable for quality control laboratories and research settings. The high polarity of methanol facilitates efficient extraction of glycosidic saponins through hydrogen bonding and dipole-dipole interactions, while the chromogenic vanillin-acetic acid reaction enables sensitive detection of sapogenin equivalents across a broad concentration range [11,12].
The foam-forming method should be retained exclusively for qualitative screening and preliminary assessment of surface-active properties in plant extracts. Given its inherent limitations—including subjective endpoint determination, susceptibility to interference from other surface-active compounds, and lack of specificity—this method is unsuitable for precise quantitative analysis [14]. Similarly, the optical activity method should be employed with caution and only as a complementary tool in conjunction with more specific analytical techniques. The lack of specificity arising from potential interference by other chiral phytochemicals (e.g., flavonoids, alkaloids) renders this method inadequate for definitive saponin quantification [10].
Researchers are strongly encouraged to report all methodological details comprehensively in their publications, including solvent type, extraction conditions (temperature, duration, solvent-to-sample ratio), analytical method specifications (wavelength, reagents, reaction conditions), and reference standards used. Such transparency is essential for facilitating cross-study comparisons, enabling method validation, and contributing to the development of harmonized analytical protocols [16].
Priority Areas for Future Research
Chromatographic Confirmation and Speciation
The spectrophotometric method employed in this study quantifies total sapogenin equivalents rather than individual saponin congeners. Given the structural diversity of saponins in N. oleander and their differential biological activities, future studies should employ high-performance liquid chromatography coupled with mass spectrometry (HPLC-MS) or ultra-performance liquid chromatography (UPLC-MS) to achieve definitive identification and quantification of individual saponin constituents [19]. Such approaches would enable the development of saponin-specific fingerprints, facilitate structure-activity relationship studies, and improve the specificity of quality control protocols. Additionally, chromatographic methods can distinguish between triterpenoid and steroidal saponins, which may have different pharmacological and toxicological profiles [7].
Investigation of the Hexane Extraction Anomaly
The unexpectedly high saponin yield obtained with hexane (18.00 ± 2.57%) represents a significant anomaly requiring further investigation. While hydrogen bonding interactions between hexane hydrogens and glycosidic hydroxyl groups have been proposed [18], this hypothesis requires verification through complementary spectroscopic techniques. Fourier-transform infrared spectroscopy (FTIR) and nuclear magnetic resonance (NMR) spectroscopy should be employed to characterize the compounds responsible for the anomalous yield. Alternative explanations that warrant investigation include: (i) the co-extraction of non-saponin surface-active compounds such as fatty acids or phospholipids that produce false-positive results in the foam-forming assay; (ii) the presence of saponin aglycones (sapogenins) rather than intact saponin glycosides, which would exhibit different polarity characteristics; or (iii) the formation of reverse micelles that facilitate the extraction of hydrophilic saponins into the non-polar phase [20]. Resolution of this anomaly is essential for developing reliable and universally applicable extraction protocols.
Seasonal and Geographic Variation Studies
The current study was conducted on plant material collected from a single geographical location during a specific flowering period. However, secondary metabolite production in plants is known to be influenced by environmental factors, including seasonal changes, soil composition, temperature, and rainfall patterns [21]. Future research should systematically evaluate seasonal and geographic variation in saponin content across different collection periods and locations to establish baseline concentration ranges for quality control purposes. Such studies would also inform optimal harvesting times for maximum saponin yield and help identify chemotypes with favourable saponin profiles for pharmaceutical and cosmetic applications.
Stability Studies and Storage Conditions
The stability of saponins during processing and storage significantly affects the quality and efficacy of herbal products [6]. Future studies should investigate the effects of storage conditions—including temperature, light exposure, humidity, and duration—on saponin content in N. oleander preparations. Accelerated stability studies under varying temperature and humidity conditions (e.g., 25 °C/60% RH, 30 °C/65% RH, 40 °C/75% RH) would provide valuable data for establishing appropriate storage recommendations for raw materials, extracts, and finished products. Such studies are essential for ensuring product quality throughout the supply chain and for meeting regulatory requirements for herbal medicines [16].
Evaluation of Green Extraction Technologies
Conventional maceration, while widely used, is time-consuming and solvent-intensive. The adoption of green extraction technologies offers opportunities for improved efficiency, reduced solvent consumption, and enhanced extract quality [20]. Future research should evaluate the application of ultrasound-assisted extraction (UAE), microwave-assisted extraction (MAE), pressurized liquid extraction (PLE), and supercritical fluid extraction (SFE) for saponin extraction from N. oleander. Parameters to be optimized include solvent composition, extraction time, temperature, pressure, and power settings. Comparative studies with conventional maceration would establish the most efficient and environmentally sustainable extraction protocols for industrial-scale applications.
Comparative Evaluation of Different Plant Parts
Saponin content may vary significantly among different plant parts (leaves, stems, roots, flowers, fruits) depending on the biosynthetic capacity and physiological function of each tissue [3]. Future studies should extend the methodological framework developed in this investigation to evaluate saponin content across different organs of N. oleander. Such studies would identify the optimal plant material for specific applications and support the sustainable utilization of plant resources by enabling targeted harvesting of high-value organs while preserving the plant population.
Toxicological Correlation Studies
Given the narrow therapeutic index of N. oleander and the contribution of saponins to both therapeutic and toxicological effects [9], future research should investigate the correlation between quantified saponin content and biological activities—including hemolytic activity, cytotoxicity, and antimicrobial efficacy. Establishing such correlations would support the development of biological activity-based quality control parameters and facilitate the establishment of safe dosage ranges for N. oleander-based preparations.
Practical Applications and Implementation
Quality Control Protocols for Herbal Products
Manufacturers of N. oleander-based herbal products and dietary supplements should incorporate the recommended extraction and analytical methods—methanol extraction followed by spectrophotometric vanillin-acetic acid analysis—into their quality control protocols. This would ensure batch-to-batch consistency, product safety, and therapeutic efficacy. Quality control specifications should include acceptance criteria for minimum saponin content, maximum allowable variation between batches, and limits for potentially toxic compounds. The implementation of Good Manufacturing Practices (GMP) for herbal products, as recommended by the World Health Organization, should be prioritized [16].
Ethnopharmacological Standardization
Ethnopharmacological studies investigating the therapeutic efficacy of N. oleander should adopt standardized analytical protocols to ensure that biological activity data can be correlated with quantified saponin content. Researchers are strongly encouraged to report all methodological details comprehensively, including solvent type, extraction conditions, analytical method specifications, and reference standards used. This transparency will facilitate data integration across studies, support meta-analyses, and accelerate the translation of traditional knowledge into evidence-based therapeutic applications.
Regulatory Harmonization
Regulatory bodies, including national medicines regulatory authorities (NMRAs), the African Traditional Medicine (ATM) policy implementers, and the African Medicines Regulatory Harmonization (AMRH) initiative, should be encouraged to adopt standardized protocols for saponin quantification in medicinal plants. Harmonized analytical standards would enhance consumer safety, facilitate cross-border trade of herbal products, and support the integration of traditional medicines into national healthcare systems. Such regulatory harmonization is particularly important in the context of the African Union’s Agenda 2063 and the WHO’s Traditional Medicine Strategy 2025-2035 [22].
Cosmetic Industry Applications
The surface-active properties of saponins, combined with their demonstrated antimicrobial and antioxidant activities, render them valuable ingredients in cosmetic formulations [6]. Manufacturers of N. oleander-based cosmetic products should implement the recommended analytical methods for routine quality control to ensure consistent bioactive content, product performance, and consumer safety. The European Union’s Cosmetics Regulation (EC) No 1223/2009 and similar regulatory frameworks in other jurisdictions require such quality control measures for market authorization.
Capacity Building and Training
The successful implementation of standardized analytical protocols requires appropriate laboratory infrastructure and trained personnel. Academic institutions, research organizations, and regulatory bodies should invest in capacity building initiatives, including training workshops, method transfer programs, and proficiency testing schemes. Collaboration between institutions in developed and developing countries could facilitate the sharing of expertise, equipment, and reference standards, thereby strengthening analytical capabilities in regions where traditional medicine use is most prevalent.

Supplementary Materials

No supplementary materials.

Author Contributions

Conceptualization, Majorobela Motaung and Fanyana Mtunzi; methodology, Majorobela Motaung and Fanyana Mtunzi; software, Majorobela Motaung; validation, Majorobela Motaung; formal analysis, Majorobela Motaung and Imelda Ledwaba; investigation, Majorobela Motaung; resources, Fanyana Mtunzi.; data curation, Majorobela Motaung; writing—original draft preparation, Majorobela Motaung; writing—review and editing, Qcobiza Manzane and Rosemary Montle; Michael Klink; visualization, Majorobela Motaung; supervision, Fanyana Mtunzi; project administration, Fanyana Mtunzi; funding acquisition, Fanyana Mtunzi.

Funding

This research received no external funding.

Institutional Review Board Statement

N/A.

Data Availability Statement

The data reported in this study is original.

Acknowledgments

ChatGPT was used to evaluate the manuscript if the basic requirements of MDPI have been met.

Conflicts of Interest

The authors declare no conflicts of interest.

Abbreviations

The following abbreviations are used in this manuscript:
ANOVA Analysis of Variance
ASTM American Society for Testing and Materials
HSD Honestly Significant Difference
WHO World Health Organization

References

  1. Sofowora, A. Medicinal Plants and Traditional Medicine in Africa; Spectrum Books: Ibadan, 2008. [Google Scholar]
  2. Hostettmann, K.; Marston, A. Saponins. Phytochemistry 1995, 40(4), 1049–1056. [Google Scholar] [CrossRef]
  3. Sparg, S.G.; Light, M.E.; Van Staden, J. Biological activities and distribution of plant saponins. J. Ethnopharmacol. 2004, 94(2–3), 219–243. [Google Scholar] [CrossRef] [PubMed]
  4. Van Wyk, B.E.; Van Oudtshoorn, B.; Gericke, N. Medicinal Plants of South Africa; Briza Publications: Pretoria, 2009. [Google Scholar]
  5. Trease, G.E.; Evans, W.C. Pharmacognosy, 16th ed.; Saunders: London, 2009. [Google Scholar]
  6. Güçlü-Üstündağ, Ö.; Mazza, G. Saponins: Properties, applications and processing. Crit. Rev. Food Sci. Nutr. 2007, 47(3), 231–258. [Google Scholar] [CrossRef] [PubMed]
  7. Vincken, J.P.; Heng, L.; de Groot, A.; Gruppen, H. Saponins, classification and occurrence in the plant kingdom. Phytochemistry 2007, 68(3), 275–297. [Google Scholar] [CrossRef] [PubMed]
  8. Doughari, J.H. Phytochemicals: extraction methods, basic structures and mode of action. J. Pharm. Chem. Biol. Sci. 2012, 1(2), 135–148. [Google Scholar]
  9. Ozkol, H.U.; Bulut, G.; Kaya, E. Determination of oleandrin in Nerium oleander by HPLC. J. Chromatogr. B 2012, 889-890, 58–63. [Google Scholar]
  10. Harborne, J.B. Phytochemical Methods: A Guide to Modern Techniques of Plant Analysis, 3rd ed.; Chapman & Hall: London, 1998. [Google Scholar]
  11. Cheok, C.Y.; Salman, H.A.K.; Sulaiman, R. Extraction and quantification of saponins: A review. Food Res. Int. 2014, 59, 16–40. [Google Scholar] [CrossRef]
  12. Sharma, O.P.; Kumar, K.; Singh, B.; Bhat, T.K. An improved method for thin layer chromatographic analysis of saponins. Food Chem. 2012, 132, 671–674. [Google Scholar] [CrossRef]
  13. Singh, R.; Sharma, R.; Sorens, P.; Mal, G.; Singh, B. Extraction and detection of saponin-enriched fractions from different plants of North-western Himalayas, India. J. Pharmacogn. Phytochem. 2019, 8(3), 3817–3820. [Google Scholar]
  14. Makkar, H.P.S.; Siddhuraju, P.; Becker, K. Plant Secondary Metabolites; Humana Press: Totowa, NJ, 2007. [Google Scholar]
  15. Hiai, S.; Oura, H.; Nakajima, T. Color reaction of some sapogenins and saponins with vanillin and sulfuric acid. Planta Medica 1976, 29(2), 116–122. [Google Scholar] [CrossRef] [PubMed]
  16. WHO. Quality Control Methods for Herbal Materials; World Health Organization: Geneva, 2011. [Google Scholar]
  17. ASTM Committee D12. Standard Test Method for Foaming Properties of Surface-Active Agents. ASTM International, 2015.
  18. Motaug, M.; Mtunzi, F.; Shooto, D.; Takaidza, S.; Monapathi, M.; Klink, M.; More, T.G.K. Extraction, Optimization and Phytochemical Screening of Nerium oleander Leaves. In Proceedings of the 2nd International Conference on Futuristic Materials for Sustainable Development Goals (FMSDG 2025). Springer Proceedings in Physics; Modise, S.J., et al., Eds.; Springer: Singapore, 2026; vol 434. [Google Scholar]
  19. Wang, Y.; Chen, L. Advances in saponin analysis by mass spectrometry. J. Mass Spectrom. 2021, 56(4), e4721. [Google Scholar]
  20. Gobbo-Neto, L.; Lopes, N.P. Medicinal plants: Factors of influence on the content of secondary metabolites. Quím. Nova 2007, 30(2), 374–381. [Google Scholar]
  21. WHO. WHO Traditional Medicine Strategy 2025-2035; World Health Organization: Geneva, 2024. [Google Scholar]
Figure 1. Sapogenin standard calibration curve for determination of saponin content.
Preprints 221876 g001
Figure 2. Bar chart comparing average saponin content of Nerium oleander leaves estimated from foam-forming, optical activity and spectrophotometric methods.
Preprints 221876 g002
Figure 3. Normal distribution curve of the data points obtained from analysis of saponin content of Nerium oleander leaves using foam-forming, optical activity and spectrophotometric method.
Preprints 221876 g003
Figure 4. Illustration of significant differences between the foam-forming, optical activity and spectrophotometric methods (common or overlapping letters indicate “no significant difference” in yields).
Preprints 221876 g004
Table 1. Estimation of saponin content from Nerium oleander leaf filtrates using foam-forming method.
Polarity 1 0,762 0,654 0,355
Polarity Index 9 5,1 5,2 5,1
Solvent Water Methanol Ethanol Acetone
Raw Material (g) 50,05 50,03 50,03 50,06
Extract (g) 12,31 10,41 8,98 10,51
Foam-forming:
Filtrate 5
Filtrate + Water (ml) 15
Final volume (ml) 17 18 18 16
Foam volume (ml) 2 3 3 1
Foam stability (min) >60 >120 <1 <1
Average Saponins (% of raw material used) 8,82 9,71 8,87 4,20
STDEV 0,25 0,92 0,17 0,45
Solvent Dichloromethane Chloroform Ethyl Acetate Hexane
Raw Material (g) 50,3 50,03 50,03 50,03
Extract (g) 4,25 3,93 3,68 14,09
Final volume (ml) 15 15 16 18
Foam volume (ml) 0 0 1 3
Foam stability (min) <1 - <1 >180
Saponins (% of raw material used) 0 0 1,38 14,24
STDEV 0 0 0 0,27
Table 2. Estimation of saponin content from Nerium oleander leaf filtrates using optical activity method.
Polarity Index 9 5,1 5,2 5,1
Solvent Water Methanol Ethanol Acetone
Raw Material (g) 50,05 50,03 50,03 50,06
Extract (g) 12,31 10,41 8,98 10,51
Optical activity
AR +45 to +225
α (◦) 124,5452 188,2477 189,3909 107,9124
[α] (◦) 79,5452 143,2477 144,3909 62,9124
Average Saponins (% of raw material used) 8,70 13,25 11,5 5,87
STDEV 0,02 0,01 0,05 0,01
Dichloromethane Chloroform Ethyl Acetate Hexane
Raw Material (g) 50,3 50,03 50,03 50,03
Extract (g) 4,25 3,93 3,68 14,09
α (◦) 180,3143 100,7245 167,9023 183,0075
[α] (◦) 135,3143 55,7245 122,9023 138,0075
Average Saponins (% of raw material used) 5,08 1,95 4,02 17,28
STDEV 0 0,01 0,01 0,01
Table 3. Estimation of saponin content from Nerium oleander leaf filtrates using optical activity method.
Concentration (mg/mℓ) 0,1 0,2 0,4 0,6 0,8 1
Absorbance 0,2751 0,4391 0,6302 0,674 0,7883 1,0947
Table 4. Estimation of saponin content from Nerium oleander leaf filtrates using spectrophotometric method.
Solvent Water Methanol Ethanol Acetone
Raw Material (g) 50,05 50,03 50,03 50,06
Extract (g) 12,31 10,41 8,98 10,51
Calibration equation x = A b s o r b a n c e 0,2414 0,7914
1   m g   e x t r a c t   d i s s o l v e d   i n   1   m l s o l v e n t
Absorbance 0,5986 0,9345 0,9609 0,7628
Average Saponins (% of raw material used) 11,1 18,22 16,32 13,83
STDEV 0,38 0,57 3,94 0,81
Solvent Dichloromethane Chloroform Ethyl acetate Hexane
Raw Material (g) 50,3 50,03 50,03 50,03
Extract (g) 4,25 3,93 3,68 14,09
Absorbance 0,6717 0,7698 0,6373 0,7472
Conc (% w/w of raw material) 4,6 5,25 3,68 18
STDEV 0,92 0,05 1,75 2
Table 5. Descriptive statistics.
Saponin content
Mean 8,486806
Standard Error 1,173719
Median 8,715
Mode 0
Standard Deviation 5,750026
Sample Variance 33,0628
Kurtosis -1,06284
Skewness 0,284217
Range 18,22333
Minimum 0
Maximum 18,22333
Sum 203,6833
Count 24
Table 6. Two-way ANOVA.
Source of Variation df F P-value F crit Significance Difference
Solvent 7 143,437631 5,98642E-30 2,20743604 Significant
Methods 2 90,5345497 5,13563E-17 3,190727336 Significant
Interaction 14 6,34804385 6,09587E-07 1,903652567 Significant
Within 48
Total 71
Table 7. Mean Saponin Content.
Total Foam-forming Optical activity Spectrophotometric
Count 24 24 24
Sum 141,67 202,98 266,44
Average 5,90 8,46 11,10
Variance 25,45 24,81 38,60
STDEV 5,05 4,98 6,21
Table 8. Tukey’s HSD Summary.
Group Pairs Absolute Difference Standard Error q_tukey q_critical Result
Foam-forming vs Optical Activity 2,55 1,41 1,81 3,44 Not significant
Foam-forming vs Spectrophotometric 5,2 1,41 3,69 3,44 Significant
Optical Activity vs Spectrophotometric 2,64 1,41 1,87 3,44 Not significant
Disclaimer/Publisher’s Note: The statements, opinions and data contained in all publications are solely those of the individual author(s) and contributor(s) and not of MDPI and/or the editor(s). MDPI and/or the editor(s) disclaim responsibility for any injury to people or property resulting from any ideas, methods, instructions or products referred to in the content.
Copyright: This open access article is published under a Creative Commons CC BY 4.0 license, which permit the free download, distribution, and reuse, provided that the author and preprint are cited in any reuse.
Prerpints.org logo

Preprints.org is a free preprint server supported by MDPI in Basel, Switzerland.

Subscribe

© 2026 MDPI (Basel, Switzerland) unless otherwise stated

Accessibility

Disclaimer

Terms of Use

Privacy Policy

Privacy Settings