

Submitted:
10 July 2026
Posted:
14 July 2026
You are already at the latest version
Abstract
Based on daily precipitation observations from six national meteorological stations in the Zhangye region from 1960 to 2023, this study examines the spatiotemporal evolution and possible driving factors of extreme precipitation using four ETCCDI-recommended indices (SDII, R10mm, R95p, and RX1day). Trends were evaluated using linear regression and the Mann–Kendall test, with Sen's slope estimation. Results reveal significant (p < 0.05) increasing trends in both frequency and intensity of extreme precipitation, with a shift from low-intensity, low-frequency to high-intensity, high-variability modes. Temporally, all indices exhibited a step-like surge around 2000, entering a period of high-level oscillation, with extreme characteristics amplified during strong El Niño years. Spatially, a distinct "higher in the south, lower in the north" pattern prevails among the six stations, with the southern Qilian Mountains as the primary contributor and central plains showing a bimodal distribution, reflecting joint modulation by westerly troughs and local strong convection. The intensification is linked to enhanced atmospheric water vapor, northward penetration of the East Asian summer monsoon, and topographically forced lifting. While alleviating drought stress, this trend substantially elevates the risk of flash floods and debris flows in mountainous areas.
Keywords:
extreme climate indices
; climate change
; precipitation intensity
; precipitation frequency
; Hexi Corridor
1. Introduction
In the context of global warming, the increasing frequency of extreme precipitation events has emerged as a critical climate challenge, threatening regional ecological security and sustainable socioeconomic development. According to the IPCC Sixth Assessment Report, rising global surface temperatures have significantly intensified the Earth’s hydrological cycle, leading to a marked increase in the frequency, intensity, and spatial extent of extreme precipitation events across most regions worldwide [1,2]. As a representative extreme weather phenomenon, extreme precipitation is characterized by its abrupt onset, high destructive potential, and propensity to trigger secondary hazards such as flash floods, debris flows, and urban inundation. These impacts pose significant risks to regional ecosystems, agricultural productivity, and human life and property [3,4,5]. Consequently, a systematic examination of the spatiotemporal patterns of extreme precipitation at regional scales is essential. Such analysis not only addresses a key scientific question regarding climate change mechanisms but also provides a crucial foundation for regional disaster prevention and mitigation, water resource management, and sustainable development planning [6,7].
Existing research offers substantial theoretical support for understanding the spatiotemporal variability of extreme precipitation. Methodologically, a mature analytical framework has been established, centered on extreme precipitation indices recommended by the Expert Team on Climate Change Detection and Indices (ETCCDI) [10,11]. Widely adopted techniques in such studies include linear trend analysis, Mann–Kendall non-parametric testing, Sen’s slope estimation, correlation analysis, and wavelet analysis [3,6,8,9]. The ETCCDI index system has become the dominant tool in this field due to its simplicity, strong inter-study comparability, and clear ecological relevance [10,11]. In recent decades, both domestic and international scholars have conducted extensive investigations into extreme precipitation trends. Frich et al.[12] were among the first to apply extreme climate indices to assess global changes, reporting an increasing trend in heavy precipitation events during the latter half of the 20th century. Alexander et al.[10] further provided a comprehensive global assessment of extreme temperature and precipitation indices from 1951 to 2003 using station-based data, noting enhanced intensity and frequency of extreme precipitation in most humid regions worldwide.
Regional studies indicate a general increase in heavy precipitation across Europe, although significant spatial variability exists in metrics such as consecutive dry days [13]. In the United States and Canada, extreme precipitation events have become more frequent in most areas [14]. Groisman et al.[15] reported a significant rise in heavy and extreme precipitation events in the United States during the latter half of the 20th century, particularly in the Northeast and Midwest. In the Asian monsoon region, extreme precipitation exhibits a “wetter in wet areas, drier in dry areas” pattern, with monsoon circulation, topography, and sea surface temperature anomalies identified as key drivers [16,17]. Research in Africa has detected signs of intensifying extreme precipitation in parts of sub-Saharan Africa, though conclusions remain highly uncertain due to limitations in data quality and station density [18]. Studies in the Hai River Basin using extreme precipitation indices have revealed an overall declining trend over the past 67 years, followed by a rebound since the early 21st century, accompanied by pronounced spatial heterogeneity in event frequency and intensity [19]. In the Yangtze River Basin, extreme precipitation displays a polarized pattern-characterized by decreasing light precipitation and increasing heavy precipitation-resulting in a highly volatile heavy precipitation index and elevated flood risk [20]. Globally, research consistently indicates that trends toward more intense extreme precipitation are more robust than changes in mean precipitation, especially in mid-to-high latitudes and humid regions [3,21].
As a typical arid-semi-arid transition zone, the inland regions of northwestern China exhibit pronounced spatiotemporal extremes in precipitation. The Hexi Corridor, a vital component of this arid region, lies at the confluence of the Qinghai-Tibet Plateau, the Loess Plateau, and the Mongolian Plateau. It features an arid climate and highly uneven precipitation distribution. Although extreme precipitation events are infrequent, they often trigger flash floods and landslides, severely impacting oasis ecosystem stability and regional socioeconomic security [22]. Accordingly, this study focuses on the Zhangye region. Using daily precipitation observations from six national meteorological stations spanning 1960 to 2023, four representative ETCCDI extreme precipitation indices were selected. Linear trend analysis, the Mann–Kendall test, Sen’s slope estimation, and the Pettitt change-point test were applied to systematically characterize the spatiotemporal evolution of extreme precipitation in Zhangye. The findings aim to contribute a theoretical basis for understanding the region’s transition toward a warmer and wetter climate and to provide scientific support for flood control, disaster mitigation, ecological conservation, and optimal water resource allocation.
2. Materials and Methods
2.1. Study Area
The Zhangye region (Figure 1) is located in northwestern Gansu Province, in the middle segment of the Hexi Corridor (37°28′-39°57′N, 97°20′-102°12′E). Situated at the junction of the Qinghai-Tibet Plateau, the Loess Plateau, and the Mongolian Plateau, it exhibits a complex, stepped topography with higher elevations in the southwest and lower elevations in the northeast. Elevations range from approximately 1,300 m in the northern desert areas to over 4,800 m in the southern Qilian Mountains, resulting in substantial topographic variation [22]. Owing to its deep inland position, topographic barriers, and prevailing atmospheric circulation patterns, the region experiences a typical temperate continental arid-semi-arid climate, characterized by low precipitation, high evaporation, large diurnal temperature ranges, and distinct seasonal contrasts. Annual mean temperatures range from 0.7 to 9.4 °C, with cold winters and hot summers, and both annual and diurnal temperature ranges are considerable. Mean annual precipitation varies from 120 to 431 mm, displaying a clear south-to-north gradient of decreasing totals. Precipitation is highly concentrated between June and September, accounting for approximately 70%-80% of the annual total [23,24]. These distinctive topographic and climatic features render Zhangye a representative area for investigating spatiotemporal variations in extreme precipitation and associated climatic responses in arid northwestern China, offering valuable insights into climate transition processes in such regions.
2.2. Data
Observational data from weather stations are considered a primary and reliable source of information for studying precipitation patterns. However, conventional weather stations may exhibit spatial heterogeneity, and discontinuities may arise in observational series owing to station relocations, instrument upgrades, or data gaps during specific periods. Despite these limitations, daily precipitation measurements from weather stations remain widely regarded as authoritative for characterizing regional precipitation patterns. In this study, daily precipitation data were obtained from the China Meteorological Science Data Sharing Service (http://cdc.cma.gov.cn/). These data include daily precipitation records and basic station information-such as longitude, latitude, and elevation-from six national meteorological stations in the Zhangye region (Table 1). To ensure the completeness and reliability of the data series, missing values were interpolated where necessary. For stations with a continuous one-month data gap (≤31 days), missing daily precipitation values were estimated using inverse-distance-weighted (IDW) averaging of precipitation data from the three nearest stations with complete records [26]. The weighting exponent was set to p = 2, following standard practice in climatological interpolation. For a continuous three-month data gap (≤93 days), a stepwise linear regression model was constructed with the target station’s precipitation as the dependent variable and precipitation records from the three nearest stations, together with elevation and the climatological mean of the same calendar day (1960–2023), as predictors. The adjusted R2 values for all six station regression models exceeded 0.65. These methods are commonly employed in regional precipitation studies and aim to enhance the continuity and comparability of time series while preserving the original characteristics of precipitation variability. Owing to differences in station establishment dates and data completeness, the common observation period across all stations was restricted to 1960-2023 to ensure consistency in the calculation of extreme precipitation indices.
To ensure the reliability of the precipitation series, the RHtestsV4 software package [25] was employed for homogeneity testing. No significant artificial discontinuities were detected at the annual scale for any station at the 95% confidence level, confirming that the station records are suitable for long-term trend analysis. The proportion of missing daily data over the study period ranged from 0.3% to 2.1% across the six stations, with the highest percentage at Shandan (2.1%).
2.3. Extreme Precipitation Index
To assess the multidimensional characteristics of extreme precipitation in the Zhangye region, this study selected four representative extreme precipitation indices (Table 2) recommended by the World Meteorological Organization’s Expert Team on Climate Change Detection and Indices (ETCCDI). These indices were chosen based on the climatic features of Zhangye’s arid environment and capture key aspects of extreme precipitation events in terms of intensity, frequency, and magnitude [10,11]. The Simple Daily Intensity Index (SDII) represents the average precipitation intensity on wet days, while the Number of Heavy Precipitation Days (R10mm) quantifies the frequency of days with precipitation ≥10 mm. The Very Wet Days (R95p) index measures the total precipitation on days exceeding the 95th percentile of daily precipitation, and the Maximum 1-day Precipitation Amount (RX1day) indicates the highest single-day precipitation total recorded in a year. These indices were computed from daily precipitation time series data spanning 1960 to 2023.
2.4. Statistical Methods
The long-term trends of extreme precipitation indices at each station were evaluated using three complementary approaches. First, the linear trend was estimated via ordinary least-squares regression to quantify the rate of change per decade (mm/10a for intensity indices, days/10a for frequency, and %/10a for relative changes). Second, the non-parametric Mann–Kendall (M-K) test [27] was applied to detect the statistical significance of monotonic trends. The M-K test does not require the data to follow a normal distribution and is robust to outliers, making it well suited for precipitation data. Third, the median-based Sen’s slope estimator [28] was used to quantify the magnitude of trends, as it is less sensitive to extreme values than ordinary least-squares regression. Trends were considered significant at the 95% confidence level (p < 0.05) and highly significant at the 99% confidence level (p < 0.01).
To objectively identify abrupt change points in the temporal evolution of extreme precipitation indices, the Pettitt test [29] was applied to the regional-mean series of each index. The Pettitt test is a non-parametric change-point detection method that does not require assumptions about the distribution of the data and identifies the most likely year of a shift in the central tendency. Change points were considered significant when p < 0.05.
All statistical analyses were performed using Python 3.12 with the pymannkendall and scipy libraries.
3. Results
3.1. Characteristics of the SDII Index
In terms of spatial distribution, the SDII index in the Zhangye region exhibits pronounced spatial heterogeneity, generally following a pattern of “lower values in the central plains and higher values in the northern and southern mountainous areas”. High-value areas are primarily concentrated in the Minle, Shandan, and Sunan mountainous regions along the northern foothills of the Qilian Mountains in the south. Conversely, low-value areas are mainly located in Gaotai, Linze, and Zhangye on the Heihe alluvial plain in the north. Minle recorded the highest SDII index (9.0-10.0 mm/d), reflecting the greatest average intensity of individual precipitation events in the region. In contrast, Gaotai and Linze exhibited the widest SDII index range (2.5-9.0 mm/d), indicating substantial interannual variability in precipitation intensity, driven by both frequent weak events and occasional intense precipitation episodes.
Regarding distribution morphology (Figure 2), the SDII violin plot for Minle station displays an extremely narrow “needle-point” shape, featuring a right-skewed unimodal distribution with a markedly elongated upper tail. The median precipitation intensity at this station is approximately 7.0 mm/d, with extreme values reaching 9.8 mm/d. This indicates not only high average precipitation intensity but also an elevated likelihood of heavy precipitation events, likely influenced by topographically forced lifting and frequent convective processes, thereby establishing Minle as a regional hotspot for precipitation intensity. The “wide at the top and narrow at the bottom” shape further underscores the dominant contribution of high-intensity events to the SDII index, highlighting its pronounced extreme characteristics. In contrast, the SDII violin plots for Sunan and Shandan stations exhibit slender, tall bell-shaped distributions that approximate normality with a distinct peak, suggesting relatively concentrated precipitation intensities and limited interannual fluctuations. Located on the eastern edge of the Hexi Corridor, these stations are less affected by the fringe influence of the East Asian monsoon, resulting in more uniform precipitation processes and fewer extreme events compared to Minle, which reflects greater stability in mountainous precipitation intensity. The SDII violin plots for Gaotai and Linze stations display a “barrel-shaped” or bimodal distribution with an overall right skew, a left-leaning peak, and a long right tail. This pattern indicates that precipitation in the oasis-plain region is predominantly light, yet occasional high-intensity events-triggered by westerly trough activity or localized strong convection-produce an asymmetric distribution. The bimodal structure further suggests that the SDII indices at these stations may be governed by two distinct precipitation regimes, associated with differing precipitation efficiencies under varying circulation patterns. Finally, the SDII violin plot for Zhangye station, situated between the mountainous and oasis-plain zones, shows a mildly right-skewed distribution, consistent with its relatively low regional average precipitation intensity and reflecting the combined influence of urban surface characteristics and surrounding topography.
Using the SDII index, we further analyzed the annual number of precipitation days (defined as days with daily precipitation > 1 mm) at six stations in the Zhangye region, with trends presented in Figure 3. From 1960 to 2023, the annual number of precipitation days across the region generally exhibited a fluctuating upward trend. However, the rates of increase and temporal variations differed markedly among stations, and no abrupt changes were detected. Overall, interannual fluctuations in precipitation days were pronounced, consistent with the characteristic “fluctuating moisture increase” in precipitation frequency observed in arid regions [30,31]. This pattern aligns with the broader upward trend in extreme precipitation event frequency reported for northwestern China’s arid zones [32,33]. Regionally, annual precipitation days varied substantially, ranging from a minimum of 25.7 days in 1962 to a maximum of 52.3 days in 2018, yielding an interannual range of 26.6 days. Prior to 2000, annual values predominantly fluctuated around the long-term mean, with a greater prevalence of low-precipitation years and relatively modest interannual variability. In contrast, the post-2000 period featured a marked increase in high-precipitation years and a significant amplification of fluctuations. This shift suggests that effective precipitation events have become more frequent in the Zhangye region since the 21st century, accompanied by an elevated likelihood of extreme precipitation [20]. These results are consistent with prior studies documenting increases in both annual precipitation totals and extreme precipitation events in this region [23].
From a spatial perspective, the Sunan region, located on the northern slope of the Qilian Mountains, has exhibited the highest rate of increase in the number of rainy days, suggesting that high-altitude mountainous regions are particularly sensitive to climate warming. Enhanced moisture transport or convective activity has contributed to a significant rise in the frequency of wet days. The Zhangye Oasis region, specifically Zhangye, has shown a moderate rate of increase, whereas the northwestern areas of Linze, Gaotai, and Minle-despite Minle’s higher elevation-have displayed relatively low rates of increase. This spatial gradient likely arises from topography and atmospheric circulation patterns. The southeastern region is more strongly influenced by orographic lifting induced by the Qilian Mountains and by warm, moist airflows from the southwest, whereas increases in precipitation days over the northwestern plains depend more on large-scale frontal processes, resulting in greater interannual variability but limited long-term trends.
3.2. Characteristics of the R10mm Index
From 1960 to 2023, both the R10mm index and the corresponding total heavy precipitation at six stations in the Zhangye region exhibited significant upward trends (M-K test, p < 0.05; Sen’s slope = 0.28 days/10a), indicating that the frequency of heavy precipitation events has increased concurrently with cumulative precipitation, accompanied by intensified interannual fluctuations. Overall, against the backdrop of a warming and moistening climate, both the frequency and intensity of extreme heavy precipitation events in the study area are rising. As shown in Figure 4, the changes in the number of heavy precipitation days (red bars) and the corresponding precipitation amounts (purple dashed lines) across the stations demonstrate a high degree of consistency. The Pettitt test identified 2000 as a significant change point (p < 0.05) in the regional-mean R10mm series, confirming the three-phase classification employed here. Since 2000, the frequency and intensity of high-intensity events have generally exceeded those observed during 1960-2000, with notable spatial variations in the magnitude of these changes among stations. In terms of temporal evolution, the R10mm index displays three distinct phases. The first phase (1960-1980) was a stable low-value period, during which R10mm days remained consistently low with pronounced interannual fluctuations but no significant trend. The second phase (1981-2000) represented an adjustment and transition period, with R10mm days remaining relatively stable and showing no significant increase. Although global warming accelerated during this interval, the Zhangye region may have experienced a delayed response in extreme precipitation, possibly due to adjustments in Northern Hemisphere circulation, such as the negative phase of the Arctic Oscillation. The third phase (2001-2023) marked an active surge period, with 2000 serving as a critical turning point. The number of R10mm days in Minle surged from 8 to 14, peaking at 18 days in 2016. Sunan, Shandan, and Zhangye also exhibited synchronous increases. Corresponding precipitation amounts doubled concurrently, with Minle reaching an extreme value of 350 mm in 2016. This surge is closely associated with the systematic northward shift of the northern edge of the East Asian summer monsoon after 2000, the strengthening of thermal forcing over the Tibetan Plateau, and global temperature anomalies, including the strong El Niño events of 1998 and 2015-2016.
3.3. Characteristics of the R95p Index
From 1960 to 2023, the frequency of R95p heavy precipitation events at six stations in the Zhangye region exhibited a significant overall upward trend (M-K test, p < 0.01; regional-mean Sen’s slope = 0.15 days/10a), indicating an increase in such events, intensified interannual variability, and more frequent extreme high-value occurrences. In the context of a warming and moistening climate, both the frequency and spatial extent of extreme heavy precipitation events in the study area are expanding. As shown in Figure 5, low-frequency zones predominated during the early period (1960-1990), whereas high-frequency zones increased notably during the later period (1990-2023), reflecting a continuous upward trend in heavy precipitation frequency across the Zhangye region over the past 60 years, with substantial spatial variation in the magnitude of change.
In terms of spatial distribution, Minle and Sunan constitute high-frequency zones for heavy precipitation, with multiple years exhibiting R95p values exceeding 7 days and locally reaching up to 11 days, designating them as the regions with the highest heavy precipitation frequency across the study area. Notably, Minle displayed clusters of significantly elevated values in 1979, 2006, and 2016-2018, whereas Sunan experienced consecutive high-frequency periods in 1979, 1986, and 2016-2017. Both locations lie within the mid- to high-elevation mountainous regions on the northern slope of the Qilian Mountains, where heavy precipitation frequency is generally high and interannual fluctuations are relatively pronounced. Shandan and Zhangye fall within the moderate-frequency zone, with R95p values predominantly ranging from 2 to 4 days and exhibiting relatively subdued interannual variability. The heatmap coloration for Zhangye remains relatively uniform, with no years showing extremely high-frequency values comparable to those observed in Minle. Linze and Gaotai are primarily classified as low-frequency zones, with R95p values mostly between 0 and 2 days and few high-value clusters, representing the regions with the lowest and most stable heavy precipitation frequency in the entire district.
Figure 6 presents a further analysis of heavy precipitation in the Zhangye region based on the R95p index. Data from 1960 to 2023 reveal a significant overall upward trend in R95p-based heavy precipitation, characterized by a continuous increase in total heavy precipitation amount and a marked intensification of interannual variability. The southern Qilian Mountains-specifically Shandan, Minle, and Sunan-constitute high-value zones for R95p-based heavy precipitation, exhibiting the most pronounced upward trend and serving as the primary contributors to extreme heavy precipitation events in the region. In contrast, Zhangye, Linze, and Gaotai, located in the central oasis and northern desert-oasis transition zones, are classified as medium- to low-value zones, where the upward trend is comparatively gradual, yet extremely high-value events still occur with notable frequency.
From a temporal perspective, R95p-based heavy precipitation exhibits distinct three-phase characteristics. The period from 1960 to 1980 represented a phase of high-value fluctuations, during which R95p-based heavy precipitation at Linze and Gaotai remained at relatively elevated levels, with average values of approximately 40 mm and 35 mm, respectively; extreme peaks occurred in 1975 and 1967, respectively. Although interannual fluctuations were substantial during this phase, no significant overall trend was evident. The interval from 1981 to 1995 constituted a trough adjustment phase, during which R95p-based heavy precipitation generally declined across all six stations. Specifically, values at Linze decreased to approximately 20 mm and at Gaotai to approximately 18 mm, marking the lowest phase of the observation period. The period from 1996 to 2023 marked a phase of rapid increase and heightened fluctuation, with 1996 serving as a significant turning point. Zhangye recorded an extreme peak (65 mm), after which R95p-based heavy precipitation at all stations entered a phase of high-magnitude fluctuations. Minle reached a peak in 2016 (52 mm), while Shandan exhibited double peaks in 2006 and 2019 (60 mm and 58 mm, respectively). After 2000, the mean R95p-based heavy precipitation increased by approximately 30%-50% relative to the 1981-1995 period, accompanied by intensified interannual variability, indicating that the contribution of extreme precipitation to total precipitation has entered a phase of high volatility.
3.4. Characteristics of the RX1day Index
From 1960 to 2023, the annual maximum daily precipitation (RX1day) in the Zhangye region exhibited an overall upward trend, characterized by continuously increasing extreme precipitation intensity and pronounced interannual fluctuations. This pattern reflects the influence of a warming and moistening climate, which has steadily elevated both the intensity and risk of extreme precipitation events in the study area. As shown in Figure 7, trend lines for all stations display positive slopes, confirming a general increase in extreme precipitation intensity over the past 64 years; however, significant spatial heterogeneity exists in both the rates of change and the magnitude of fluctuations. The trend coefficients for Minle and Shandan are significantly positive, with increases of 8.8% and 10.0%, respectively, indicating a statistically robust intensification of extreme precipitation on the northern slope of the Qilian Mountains. In contrast, trends in the plain counties are weak and insignificant, with Gaotai showing only a 2.8% increase, reflecting a clear “threshold effect” in the response of arid plains to global warming regarding extreme precipitation.
In terms of spatial distribution, the RX1day trend in the Zhangye region exhibits a distinct “higher in the south, lower in the north” gradient. The southern Qilian Mountains constitute a high-value zone for extreme precipitation intensity, with the most pronounced upward trends-rates of change all exceeding 1.0 mm/10a. Shandan recorded the highest rate at 1.8 mm/10a, which is 4.5 times that of Gaotai, and displayed a highly significant upward trend, identifying the southern mountains as the core area for regional intensification of extreme precipitation. In contrast, the central oasis and northern desert oasis regions show medium to low values, with trend rates primarily ranging between 0.4 and 0.8 mm/10a. The upward trend in these areas is relatively gentle, and extreme precipitation events are typically isolated and intense. Notably, despite the low average intensity in the plains, both Linze and Gaotai recorded extreme peak values during the observation period-approximately 50 mm in Linze and 65 mm in Gaotai in 1975-indicating that exceptionally heavy precipitation events can still occur in arid plains under specific atmospheric circulation conditions, albeit with low probability.
From a temporal perspective, the RX1day index exhibits distinct three-phase characteristics. The first phase was a period of low-value fluctuations (1960-1980), during which the overall RX1day in the Zhangye region remained at a relatively low level, with mean values 20%-30% lower than those after 1980. Interannual fluctuations were pronounced during this phase, but no significant upward trend was observed, indicating that changes in extreme precipitation were primarily driven by natural variability. Notably, a regional heavy precipitation event occurred in 1975, with Gaotai, Linze, and Minle counties simultaneously recording peak values of approximately 65 mm, 50 mm, and 45 mm, respectively. This may be associated with the unusually active southwest monsoon during the summer of that year. The second phase was the surge-plateau period (1981-2000). In the early 1980s, except for Gaotai, RX1day values at the remaining five stations all exhibited a systematic surge, with mean values increasing by approximately 15%-25%. During this phase, Minle and Shandan counties established relatively stable high-value plateaus, with mean values of approximately 35 mm and 28 mm, respectively, indicating that extreme precipitation intensity had entered a new climatic state. The third phase is the high-level fluctuation period (2001-2023). Since the beginning of the 21st century, RX1day has generally remained at historically high levels, but the rate of increase has slowed; some areas, such as Linze and Gaotai, have even shown a slight downward trend. Minle exhibited dual peaks of 55 mm and 53 mm in 2010 and 2016, respectively, but rapidly declined to below 25 mm between 2018 and 2020, suggesting signs of a phased weakening in recent extreme precipitation intensity.
4. Discussion
The increasing trends in extreme precipitation indices observed in the Zhangye region are consistent with findings from other arid and semi-arid regions of northwestern China. For example, the post-2000 surge in extreme precipitation frequency aligns with the broader wetting trend reported for the Hexi Corridor [22,23] and the Qilian Mountains [34,35], where total precipitation and heavy precipitation events have both increased since the late 1990s. The south-to-north gradient observed in this study—with stronger trends in mountainous areas and weaker trends in plains—is also consistent with the elevation-dependent amplification of precipitation extremes documented in the Tianshan Mountains [32] and the Tibetan Plateau [36]. Notably, the RX1day increase of 8.8–10.0% at the mountainous stations (Minle and Shandan) over 64 years is comparable to the ~7–12% increase per degree of warming reported globally for annual maximum daily precipitation [2,10], suggesting that the response of extreme precipitation in this arid region follows the Clausius–Clapeyron relationship.
In contrast, the weaker trends in the plains (Gaotai, Linze, and Zhangye) differ from findings in the Hai River Basin [19] and the Yangtze River Delta [20], where extreme precipitation trends are more uniform spatially. This discrepancy likely reflects the dominant role of topography in modulating the local precipitation response to large-scale circulation changes in the Hexi Corridor [37,38,39].
Several limitations of this study should be acknowledged. First, the spatial analysis relies on only six meteorological stations, which may not fully capture the fine-scale spatial variability of extreme precipitation in a topographically complex region of ~42,000 km2. The spatial patterns described here should therefore be interpreted as inter-station comparisons rather than as a continuous spatial field. Future studies could incorporate high-resolution gridded precipitation datasets (e.g., CN05.1, ERA5-Land) or satellite-based products (e.g., TRMM, GPM) to supplement station observations and enable more robust spatial interpolation.
Second, the attribution of extreme precipitation changes to circulation mechanisms is based on qualitative reasoning rather than quantitative correlation analysis. Incorporating formal attribution methods—such as Pearson or Spearman correlation between extreme precipitation indices and climate teleconnection indices (e.g., Niño 3.4 SST, East Asian Summer Monsoon Index, Arctic Oscillation Index)—would strengthen the mechanistic interpretation [40,41,42].
Third, the study period (1960–2023) may encompass inhomogeneities in station records due to instrument upgrades and changes in observation practices. Although homogeneity testing was performed at the annual scale, sub-annual heterogeneities may remain undetected.
Future research should pursue three directions. First, integrating CMIP6 climate model projections to assess how extreme precipitation in the Zhangye region may evolve under different emission scenarios (SSP2-4.5 and SSP5-8.5) would support long-term adaptation planning. Second, high-resolution convection-permitting numerical simulations (e.g., WRF at ≤ 3 km resolution) are needed to disentangle the relative contributions of large-scale circulation, mesoscale convective systems, and local topographic forcing to extreme precipitation formation in the Qilian foothills. Third, extending the analysis to compound extreme events—such as the co-occurrence of extreme precipitation and extreme temperature—would provide a more comprehensive assessment of climate risk in the region.
5. Conclusions
This study examined trends in four ETCCDI extreme precipitation indices (SDII, R10mm, R95p, and RX1day) at six meteorological stations in the Zhangye region from 1960 to 2023. The main findings are as follows:
(1) Extreme precipitation has increased significantly in both intensity and frequency, with distinct phased evolution. All four indices exhibited upward trends (M-K test, p < 0.05), with SDII increasing at a regional-mean rate of 0.12 mm·day−1/10a, R10mm at 0.28 days/10a, R95p at 0.15 days/10a, and RX1day at 0.9 mm/10a. The Pettitt test identified 2000 as a significant change point, after which the indices transitioned from low-intensity, low-frequency modes to high-intensity, high-variability modes.
(2) The spatial pattern displays a heterogeneous “higher in the south, lower in the north” distribution among the six stations. The southern Qilian Mountains (Minle, Sunan, Shandan) exhibited the highest intensity and frequency of extreme precipitation, attributable to topographically forced lifting and convective processes. The central plains (Zhangye, Gaotai, Linze) showed lower mean values and greater interannual variability.
(3) Extreme precipitation changes exhibit significant sensitivity to elevation gradients. The rate of RX1day increase at the mountainous stations (1.0–1.8 mm/10a) is 2–4.5 times higher than at the plains stations (0.4–0.8 mm/10a), indicating a stronger response to climate warming in elevated terrain.
Author Contributions
Conceptualization, C.Z. and S.Y.; methodology, C.Z. and T.D.; software, T.D. and J.Z.; formal analysis, C.Z. and S.Y.; writing—original draft preparation, S.Y. and C.Z.; writing—review and editing, J.Z. and T.D.
Funding
Please add: This research was funded by the National Natural Science Foundation of China, grant number 41771087 and 31960273.
Data Availability Statement
The daily precipitation data used in this study were obtained from the China Meteorological Science Data Sharing Service (http://cdc.cma.gov.cn/). The data are available upon reasonable request from the corresponding author, subject to the data sharing policies of the China Meteorological Administration.
Acknowledgments
The authors wish to thank the China Meteorological Administration (CMA) for sharing data. The authors would also like to thank the editors and the anonymous reviewers for their crucial comments that have improved the quality of the article.
Conflicts of Interest
The authors declare no conflicts of interest.
References
- Donat, M.; Lowry, A.; Alexander, L.; O’Gorman, P.; Maher, N. More extreme precipitation in the world’s dry and wet regions. Nat. Clim. Change 2016, 6(5), 508–513. [Google Scholar] [CrossRef]
- IPCC Climate Change 2021: The Physical Science Basis. Contribution of Working Group I to the Sixth Assessment Report of the Intergovernmental Panel on Climate Change [M]; Cambridge University Press: Cambridge, 2021. [Google Scholar]
- Sun, Q.; Zhang, X.; Zwiers, F.; Westra, S.; Alexander, L. A Global, Continental, and Regional Analysis of Changes in Extreme Precipitation. J. Clim. 2020, 34(1), 243–258. [Google Scholar] [CrossRef]
- Frei, A.; Gelda, R.; Mukundan, R. Characterizing and correcting for global climate models’ biases in multiyear extreme precipitation scenarios. Clim. Change 2025, 2025(178), 218. [Google Scholar] [CrossRef]
- Li, C.; Liu, J.; Du, F.; Zwiers, F.; Feng, G. Increasing certainty in projected local extreme precipitation change. Nat. Commun. 2025, 16(1), 1–12. [Google Scholar] [CrossRef]
- Nerantzaki, S.; Papalexiou, S. Assessing extremes in hydroclimatology: A review on probabilistic methods. J. Hydrol. 2022, 605, 127302. [Google Scholar] [CrossRef]
- Chang, P.; Fu, D.; Liu, X.; Castruccio, F.; Prein, A.; Danabasoglu, G.; Wang, X.; Bacmeister, J.; Zahng, Q.; Rosenbloom, N.; King, T.; Bates, S. Future extreme precipitation amplified by intensified mesoscale moisture convergence. Nat. Geosci. 2025, 19(1), 33–41. [Google Scholar] [CrossRef]
- Felix, S.; Jana, U.; Oscar, E.; Henning, W. Flexible and consistent quantile estimation for intensity–duration–frequency curves. Hydrol. Earth Syst. Sc. 2021, 25(12), 6479–6494. [Google Scholar] [CrossRef]
- Felix, S.; Henning, W. Non-stationary large-scale statistics of precipitation extremes in central Europe. Stoch. Env. Res. Risk A. 2023, 37(11), 4417–4429. [Google Scholar] [CrossRef]
- Alexander, L.; Zhang, X.; Peterson, T.; Peterson, T.; Caesar, J.; Gleason, B.; Tank, A.; Haylock, M.; Collins, D.; Trewin, B.; Rahimzadeh, F. Global observed changes in daily climate extremes of temperature and precipitation. J. Geophys. Res.-Atmos. 2006, 111(D5), D05109. [Google Scholar] [CrossRef]
- Moberg, A.; Jones, P. Trends in indices for extremes in daily temperature and precipitation in central and western Europe, 1901-1999. Int. J. Climatol. 2005, 25(9), 1149–1171. [Google Scholar] [CrossRef]
- Frich, P.; Alexander, L.; Della-Marta, P.; Gleason, B.; Haylock, M.; Tank, A.; Peterson, T. Observed coherent changes in climatic extremes during the second half of the twentieth century. Clim. Res. 2002, 19, 193–212. [Google Scholar] [CrossRef]
- Barriopedro, D.; Jiménez-Esteve, B.; Collazo, S.; Garrido-Perez, J.; Johnson, J.; García-Herrera, R. A Multimethod Attribution Analysis of Spain’s 2024 Extreme Precipitation Event. B. Am. Meteorol. Soc. 2025, 106(12). [Google Scholar] [CrossRef]
- Griffiths, M.; Bradley, R. Variations of twentieth-century temperature and precipitation extreme indicators in the northeast United States. J. Clim. 2007, 20(21), 5401–5417. [Google Scholar] [CrossRef]
- Groisman, P.; Knight, R.; Easterling, D.; Karl, T.; Hegerl, G.; Razuvaev, V. Trends in Intense Precipitation in the Climate Record. J. Clim. 2005, 18(9), 1326–1350. [Google Scholar] [CrossRef]
- Cinco, T.; de Guzman, R.; Orteza, A.; Wilson, D. Long-term trends and extremes in observed daily precipitation and near surface air temperature in the Philippines for the period 1951-2010. Int. J. Climatol. 2015, 35(7), 1550–1563. [Google Scholar]
- Zhang, W.; Zhou, T. Significant increases in extreme precipitation and the associations with global warming over the global land monsoon regions. J. Clim. 2019, 32(24), 8465–8488. [Google Scholar] [CrossRef]
- Habiyakare, F.; Jiang, T.; Yahaya, I.; Ndabagenga, D.; Kagabo, J.; Su, B. Spatial Variation and Trend of Extreme Precipitation in Africa during 1981-2019 and Its Projected Changes at the End of 21st Century. J. Geosci. Environ. Prot. 2024, 12, 192–221. [Google Scholar] [CrossRef]
- Du, H.; Xia, J.; Zeng, S.; She, D.; Liu, J. Variations and statistical probability characteristic analysis of extreme precipitation events under climate change in Haihe River Basin, China. Hydrol. Process. 2014, 28(3), 1–13. [Google Scholar]
- Gao, D.; Che, M.; Ma, Z.; Huang, T.; Zhang, J.; Wang, Y.; Xuan, Y. Spatiotemporal evolution characteristics of extreme precipitation indices in the Yangtze river delta region during 1961-2022. Theor. Appl. Climatol. 2026, 2026(157), 122. [Google Scholar]
- Jin, H.; Zhang, K.; Liu, M.; Yu, X.; Yang, X.; Chao, L.; Zhang, P.; Liu, G. Spatiotemporal evolution and hyetograph changes of global extreme precipitation. J. Hydrol. 2026, 672, 135325. [Google Scholar] [CrossRef]
- Yang, X.; Chen, J.; Zhao, H.; Ma, Z.; Wu, W. Temporal and spatial variation characteristics of extreme precipitation in the eastern Hexi Corridor. Arid Land Geogr. 2025, 42(8), 1394–1403. [Google Scholar]
- Zhang, J.; Guan, Q.; Zhang, Z.; Shao, W.; Zhang, E.; Kang, T.; Xiao, X.; Liu, H.; Luo, H. Characteristics of spatial and temporal dynamics of vegetation and its response to climate extremes in ecologically fragile and climate change sensitive areas – A case study of Hexi region. CATENA 2024, 239, 107910. [Google Scholar] [CrossRef]
- Yang, H.; Xu, P.; Wang, D.; Singh, V.; Zhang, Z.; Lu, M. Copula-Based Approach to Nonstationary Bivariate Frequency Analysis of Short-Duration Precipitation Extremes in Huaihe River Basin, China. Int. J. Climatol. 2025, 45(8). [Google Scholar] [CrossRef]
- Wang, X.; Feng, Y. RHtestsV4 User Manual; Climate Research Division, Atmospheric Science and Technology Directorate, Science and Technology Branch, Environment Canada: Toronto, ON, Canada, 2013. [Google Scholar]
- Shepard, D. A Two-Dimensional Interpolation Function for Irregularly-Spaced Data. In Proceedings of the 1968 23rd ACM National Conference, New York, NY, USA, 27–29 August 1968; pp. 517–524. [Google Scholar]
- Mann, H.B. Nonparametric tests against trend. Econometrica 1945, 13, 245–259. [Google Scholar] [CrossRef]
- Sen, P.K. Estimates of the regression coefficient based on Kendall’s tau. J. Am. Stat. Assoc. 1968, 63, 1379–1389. [Google Scholar] [CrossRef]
- Pettitt, A.N. A non-parametric approach to the change-point problem. J. R. Stat. Soc. Ser. C 1979, 28, 126–135. [Google Scholar] [CrossRef]
- Tan, L.; Qi, J.; Marek, G.; Zhang, X.; Ge, J.; Sun, D.; Li, B.; Feng, P.; Liu, D.; Li, B.; Srinivasan, R.; Cheng, Y. Assessing the impacts of extreme precipitation projections on Haihe Basin hydrology using an enhanced SWAT model. J. Hydrol.-Reg. Stud. 2025, 58, 102235. [Google Scholar] [CrossRef]
- Liu, B.; Qiu, L.; Tang, X.; Zhu, Z.; Zhang, P.; Wang, L.; He, J.; Yue, C. Non-linear drought responses of transpiration and water use efficiency in black locust plantations in semi-arid northwestern China. J. Hydrol. 2026, 664(pa), 134348. [Google Scholar] [CrossRef]
- Yun, X.; Wang, J.; Bao, H. Assessing climate change impacts on extreme hydrological characteristics of reservoir inflow in Tianshan Mountain Range, China. Sci. Rep.-UK 2025, 15(1), 14925. [Google Scholar] [CrossRef]
- Alizadeh, O. Changes in the mean and variability of temperature and precipitation over global land areas. Environ. Res. Clim. 2023, 2(3), 035006. [Google Scholar] [CrossRef]
- Thackeray, C.; Hall, A.; Norris, J.; Chen, D. Constraining the increased frequency of global precipitation extremes under warming. Nat. Clim. Change 2022, 12(5), 441–458. [Google Scholar] [CrossRef]
- Hou, M.; Cuo, L.; Xu, H. Hydrological response to twenty-first century climate change in the Amu Darya Basin, Central Asia. J. Hydrol.-Reg. Stud. 2025, 61(c), 102606. [Google Scholar] [CrossRef]
- Song, J.; Xie, X.; Wen, X. Assessment of Extreme Temperature in the Qinghai-Xizang Plateau and Surrounding Areas. Open Access Libr. J. 2024, 11, 1–13. [Google Scholar] [CrossRef]
- Wang, L.; Zhang, F.; Zeng, C.; Zhang, W. Variation of hydro-climatic extremes in headwater regions of Hei River basin under climate change. J. Hydrol.-Reg. Stud. 2023, 50(c), 101561. [Google Scholar] [CrossRef]
- Zhao, L.; Dong, X.; Liu, X.; Wang, N.; Eastoe, C.; Wei, N.; Xie, C.; Liu, H.; Han, C.; Hua, T.; Wang, L. Extreme precipitation stable isotopic compositions reveal unexpected summer monsoon incursions in the Qilian Mountains. Sci. Total Environ. 2023, 900, 165743. [Google Scholar] [CrossRef] [PubMed]
- Sun, W.; Huai, B.; Wang, Y.; Ji, K.; Yang, X.; Wang, L.; Du, W.; Qin, X. Comparison and evaluation of the performance of reanalysis datasets for compound extreme temperature and precipitation events in the Qilian Mountains. Atmos. Res. 2024, 304, 1–13. [Google Scholar] [CrossRef]
- Yang, Y.; Li, J. Novel monsoon indices based on vector projection and directed angle for measuring the East Asian summer monsoon. Clim. Dynam. 2025, 2025(63), 210. [Google Scholar]
- Hardiman, S.; Scaife, A.; Dunstone, N.; Bett-Williams, P.; Li, C. New mechanism for delayed ENSO impact on the East Asian Summer Monsoon. npj Clim. Atmos. Sci. 2026, 27. [Google Scholar]
- Nguyen–Le, D.; Ngo-Duc, T. Modulation of PDO and the Victoria Mode on the ENSO–East Asian Summer Monsoon Relationship. J. Clim. 2025, 38(20), 5655–5670. [Google Scholar] [CrossRef]
Figure 1.
Location of Zhangye regions and distribution of meteorological stations.
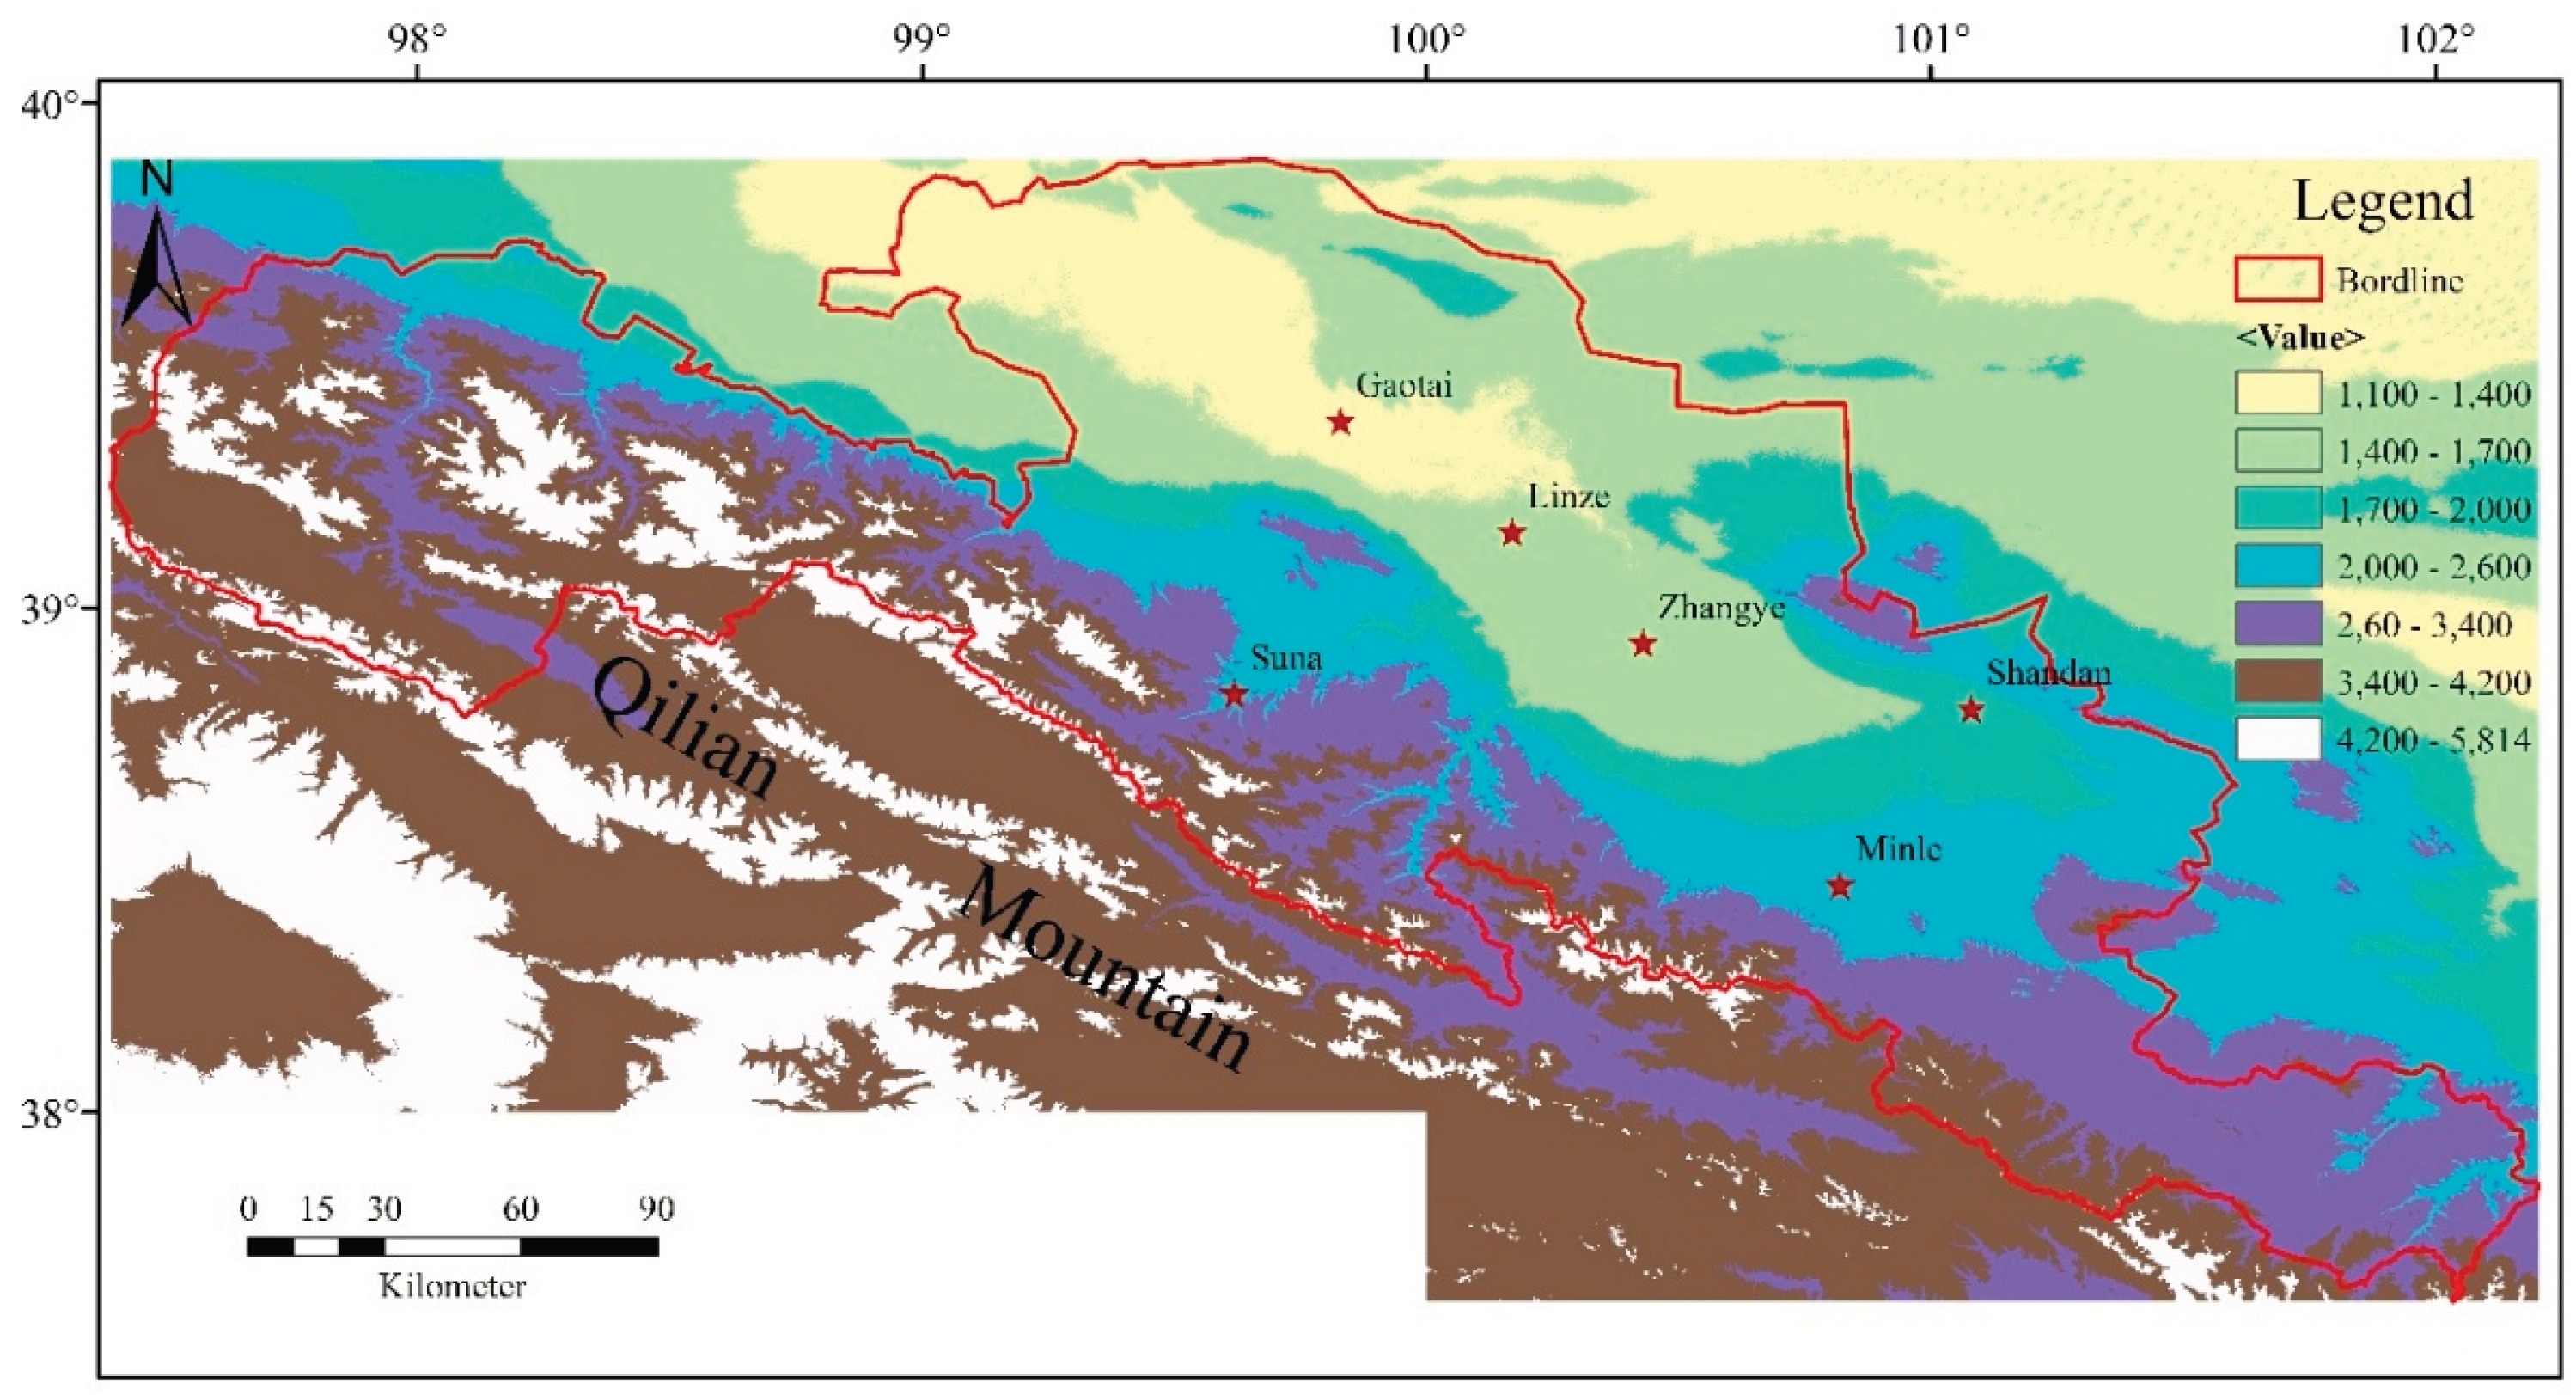
Figure 2.
Violin plots of the SDII indices.
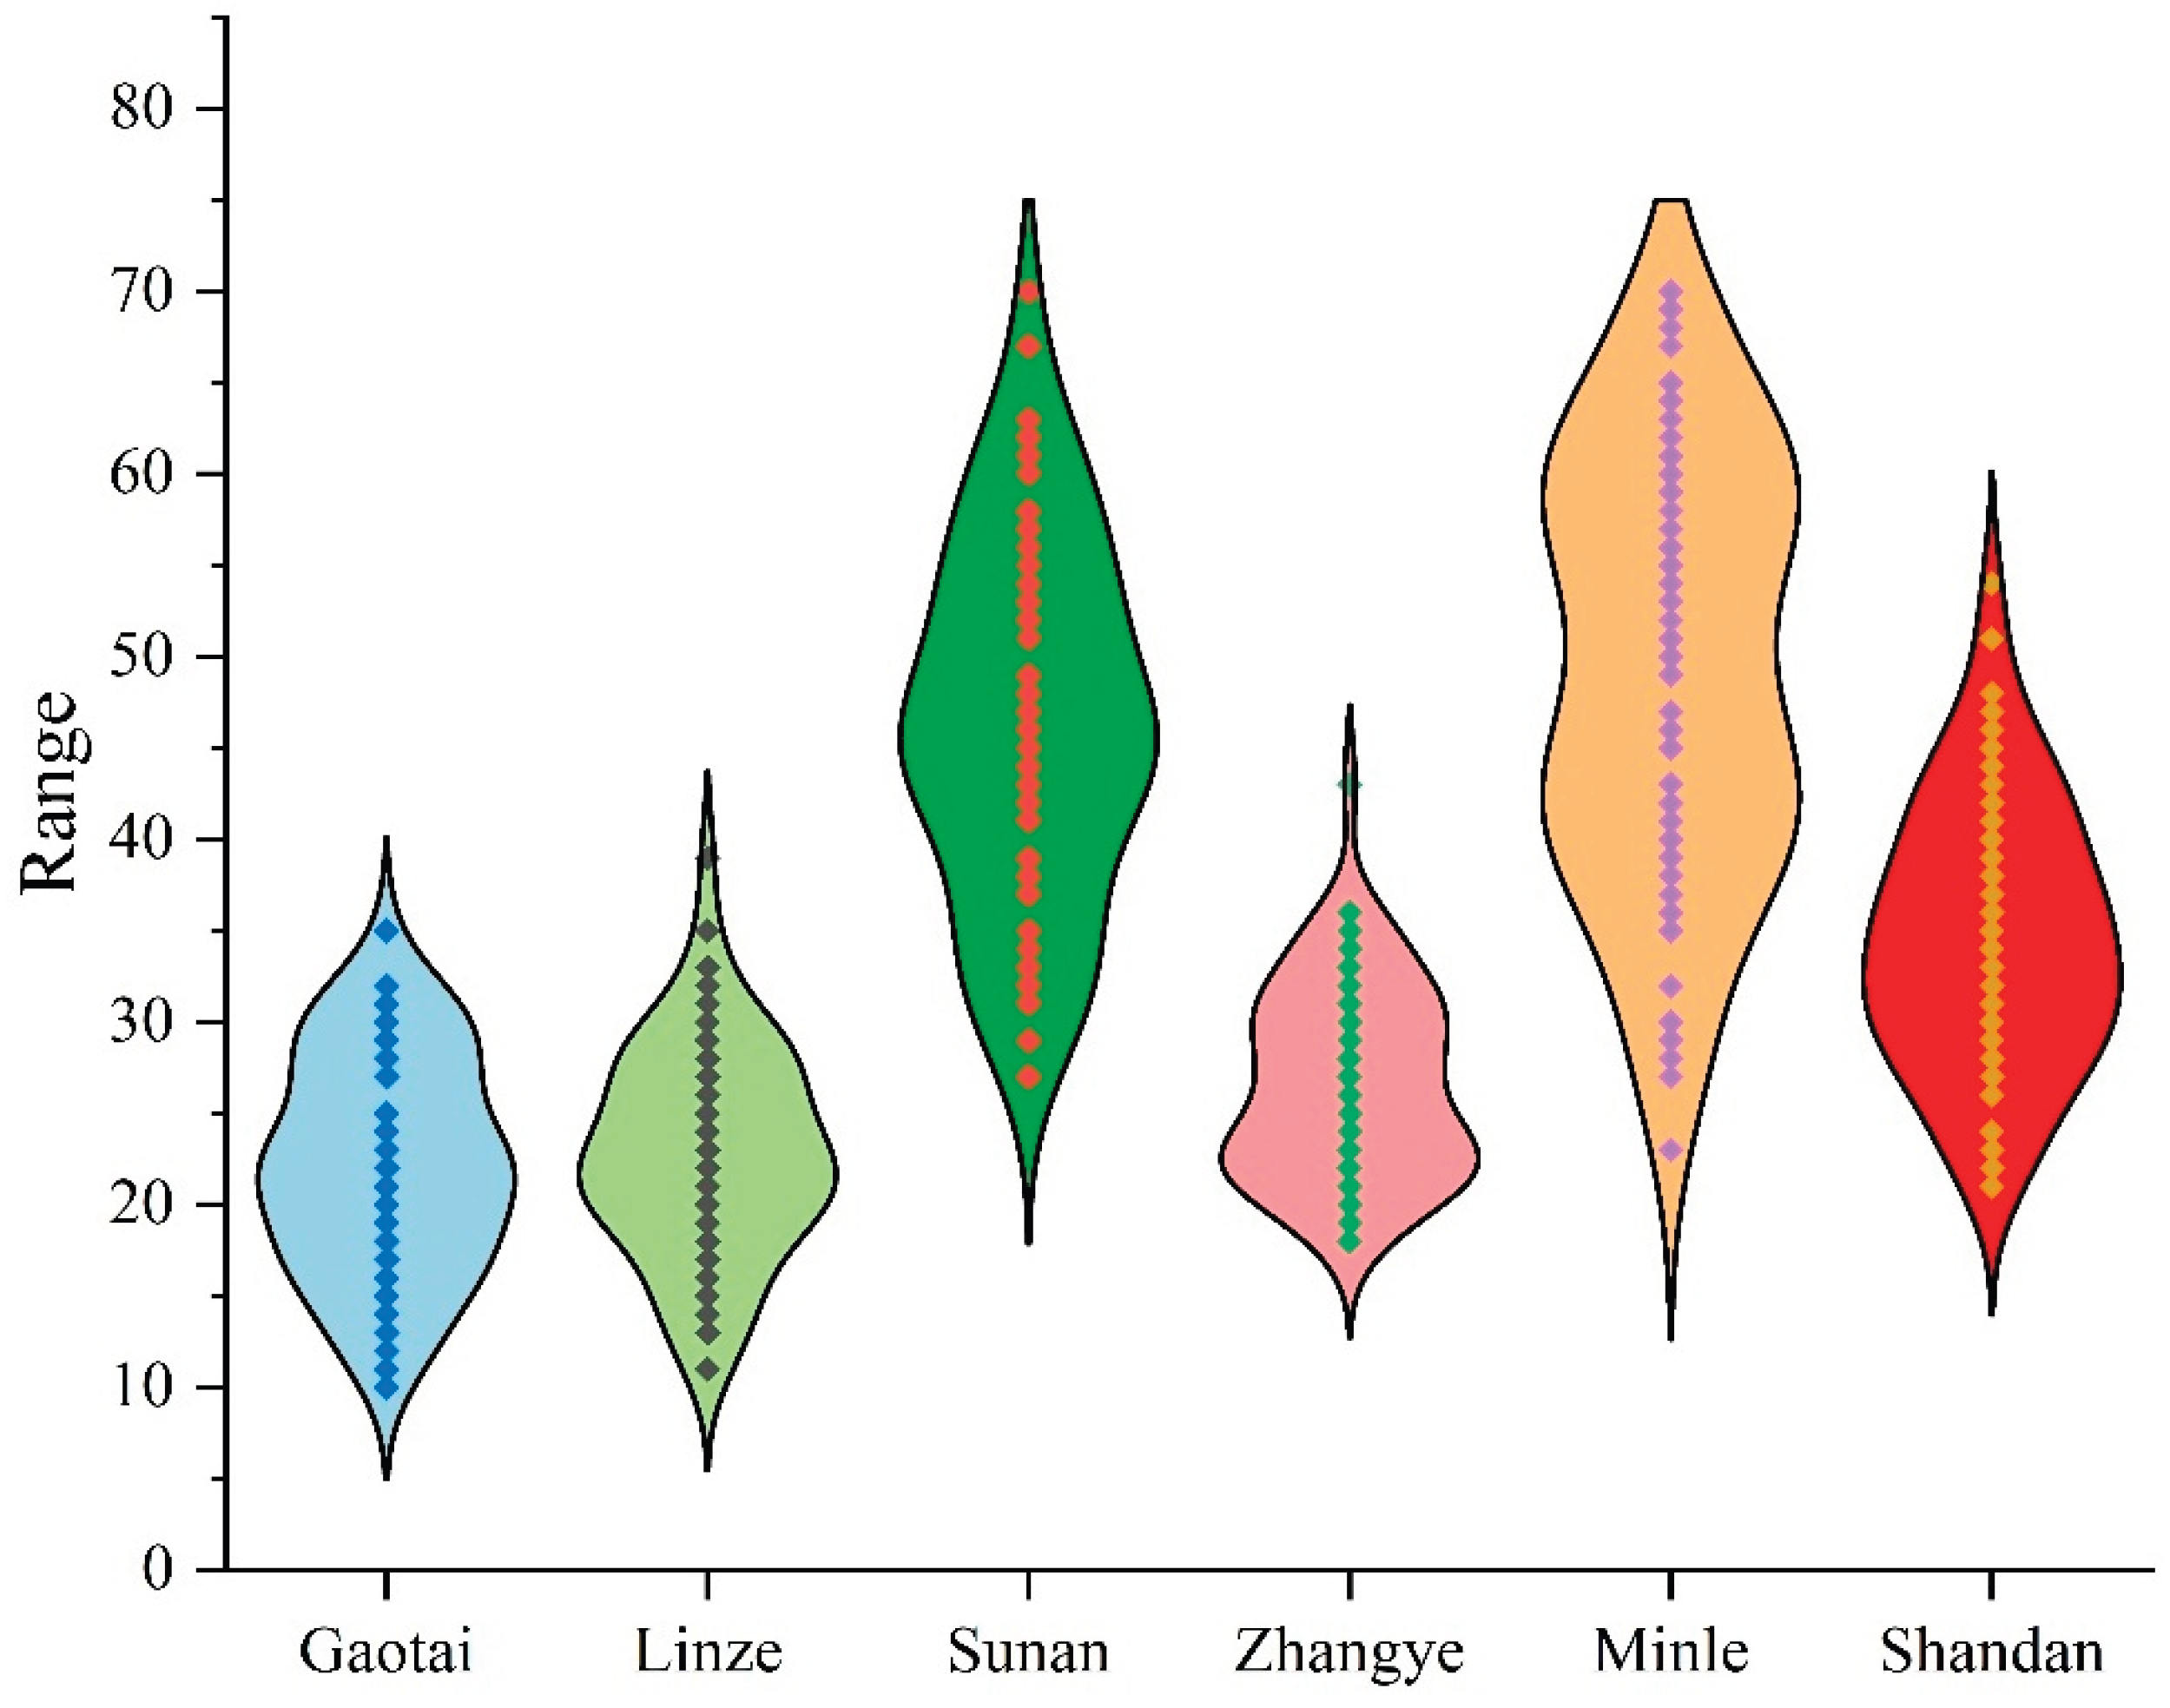
Figure 3.
Annual number of wet days (daily precipitation ≥ 1 mm) at six stations in the Zhangye region, 1960–2023. Dashed lines denote the linear trend.
Figure 3.
Annual number of wet days (daily precipitation ≥ 1 mm) at six stations in the Zhangye region, 1960–2023. Dashed lines denote the linear trend.
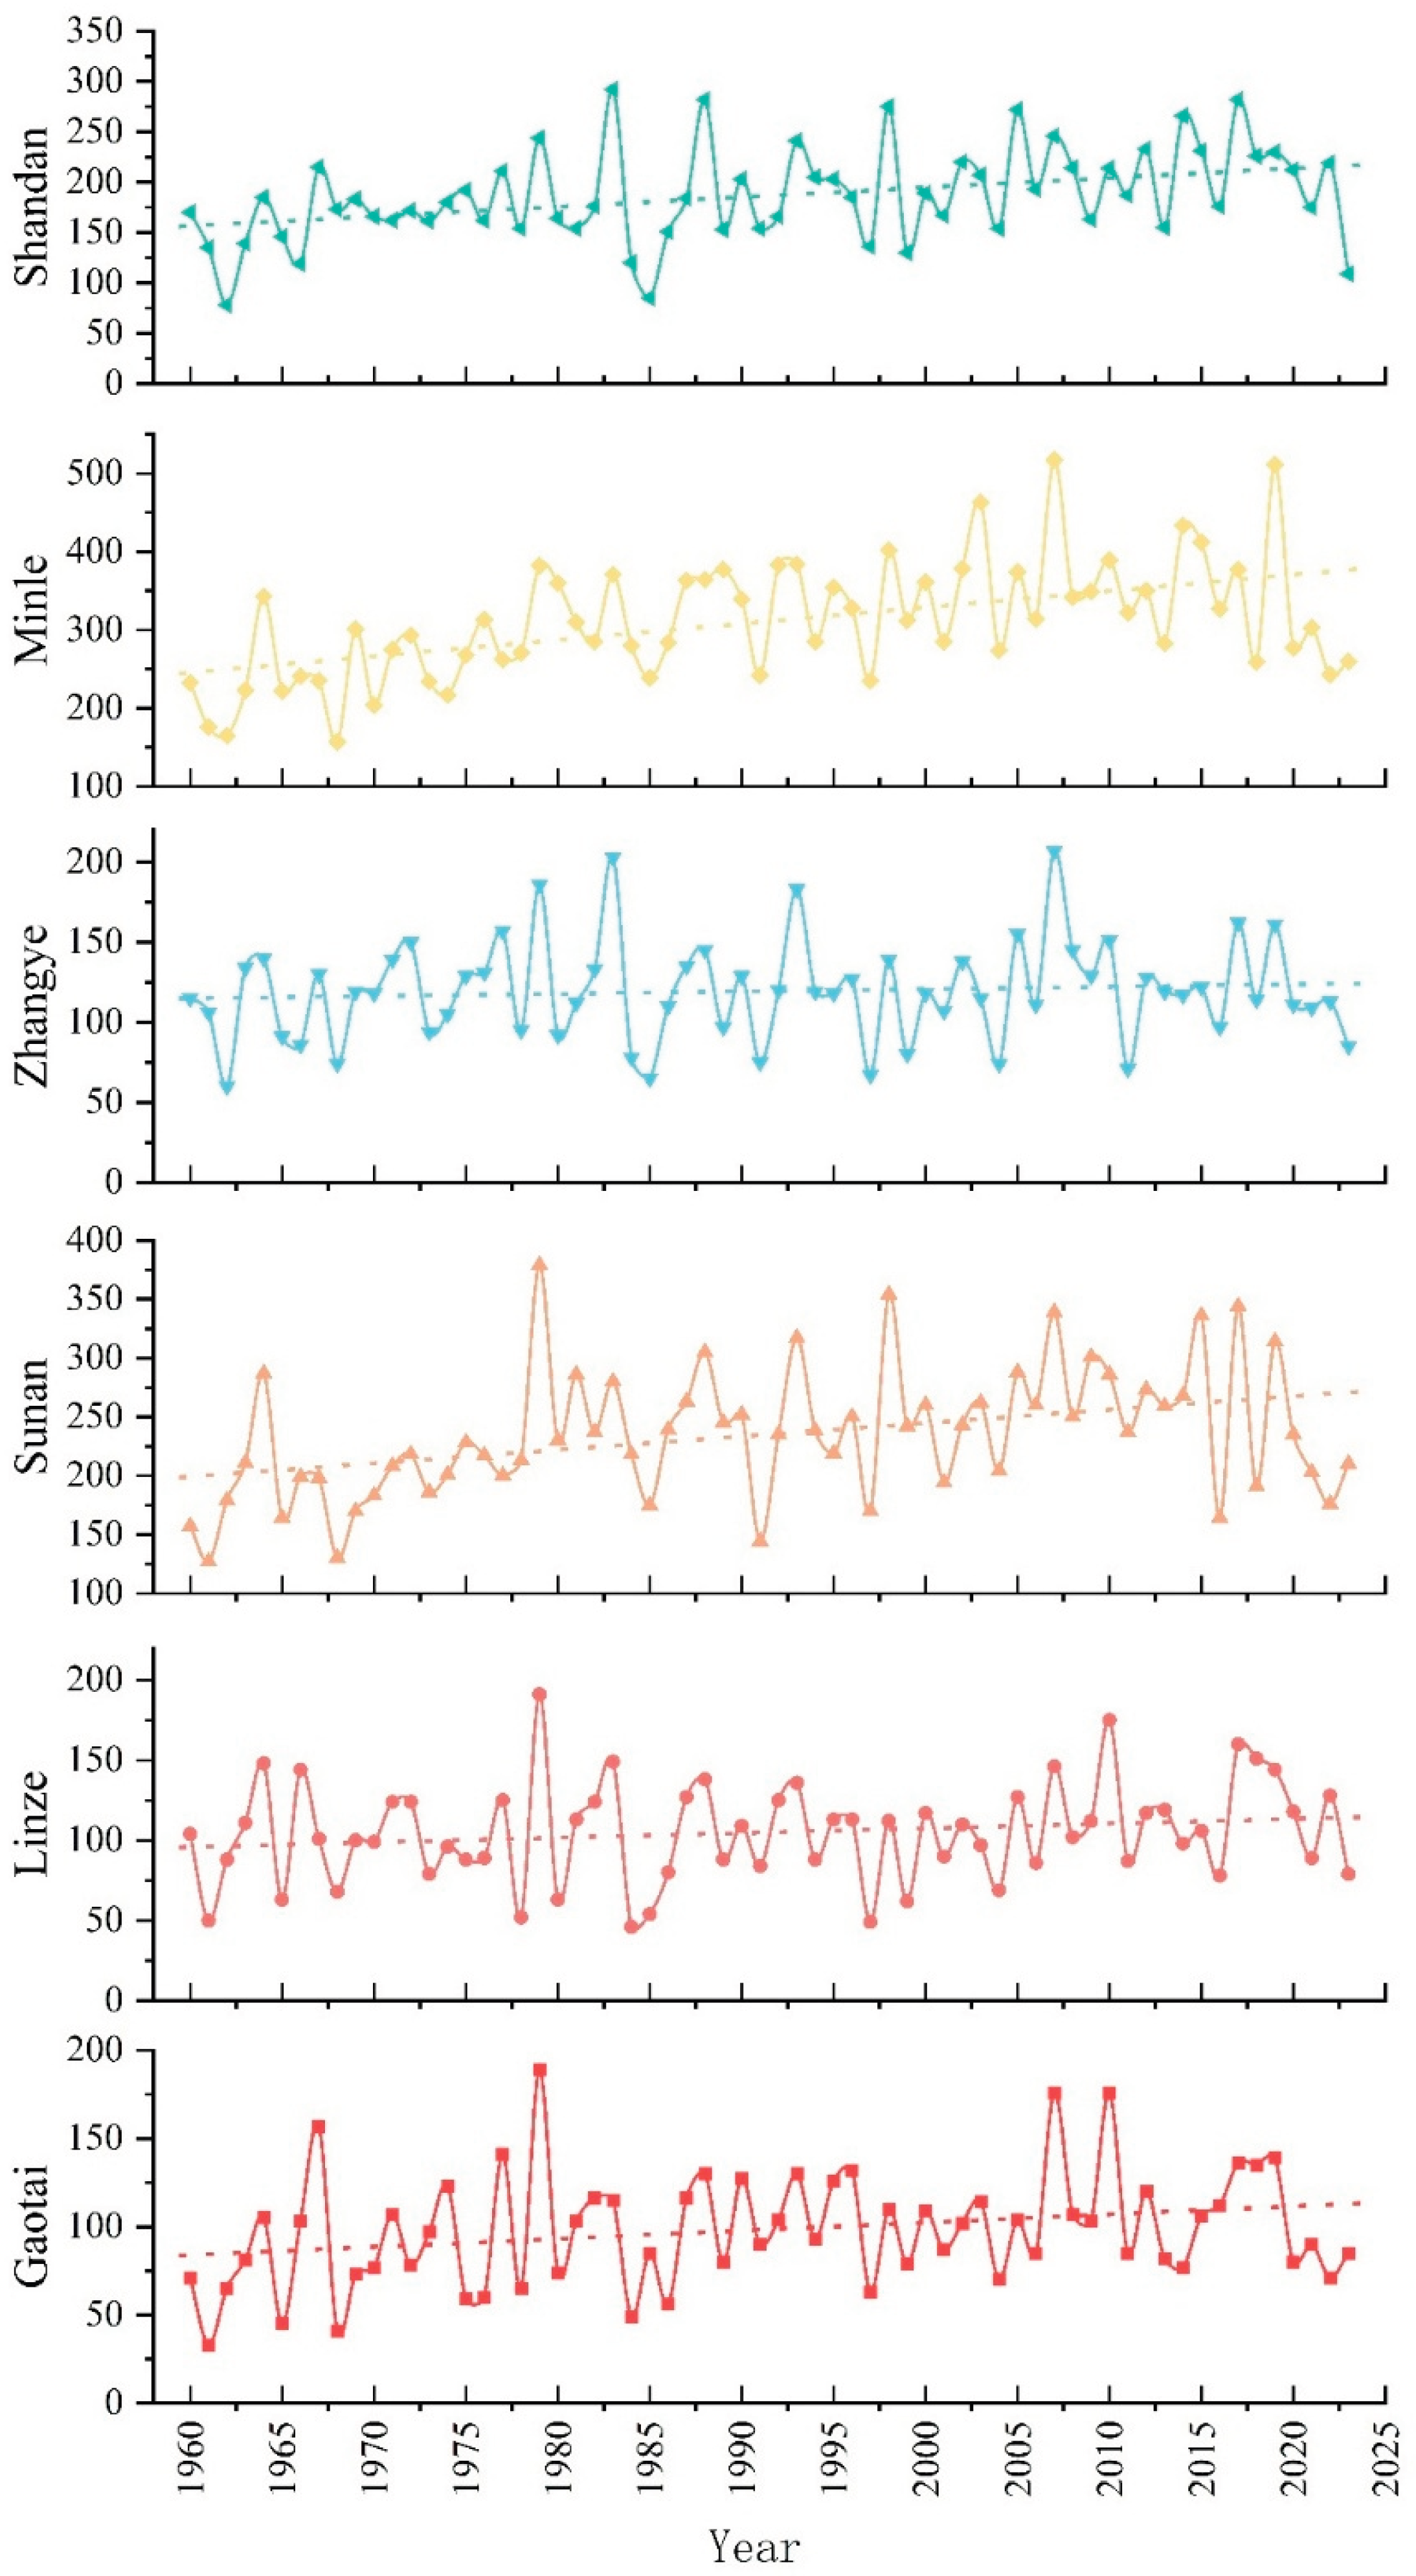
Figure 4.
Temporal trends of annual R10mm indices in Zhangye (1960-2023). Red bars denote annual R10mm days; purple dashed lines denote the annual total precipitation amount on R10mm days.
Figure 4.
Temporal trends of annual R10mm indices in Zhangye (1960-2023). Red bars denote annual R10mm days; purple dashed lines denote the annual total precipitation amount on R10mm days.
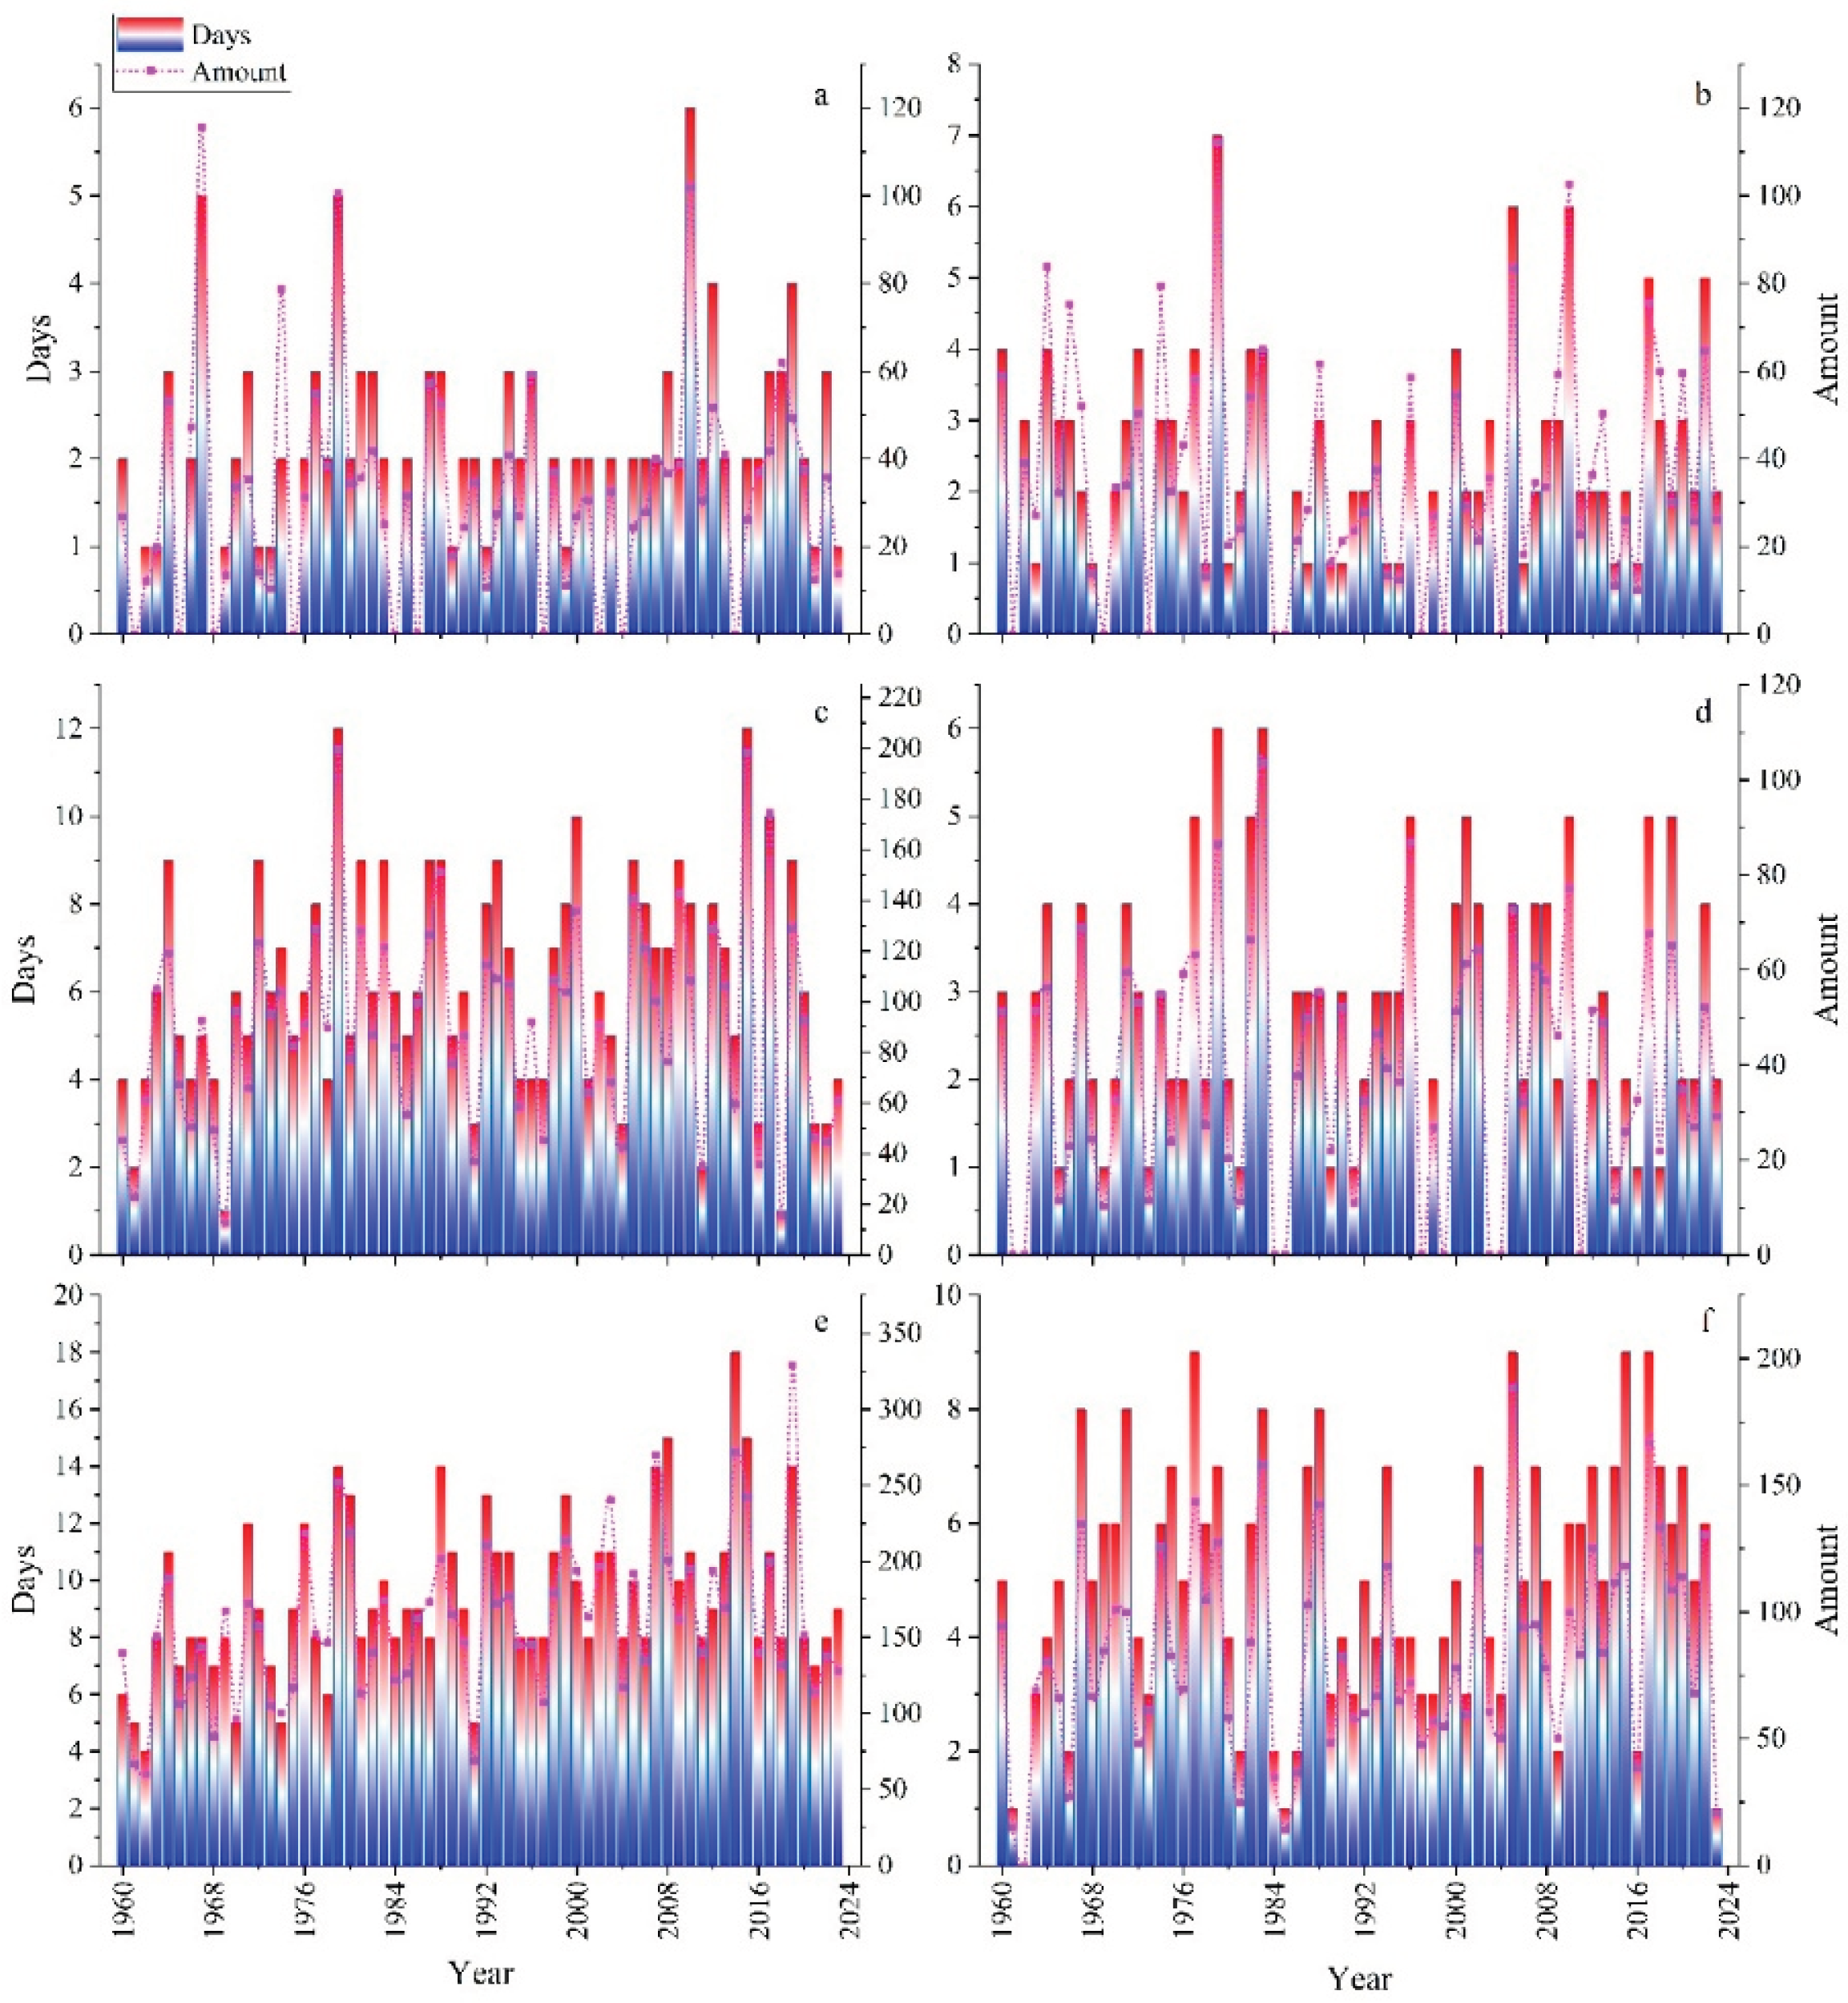
Figure 5.
Heatmap of annual R95p frequency (days) at six stations in the Zhangye region, 1960–2023.
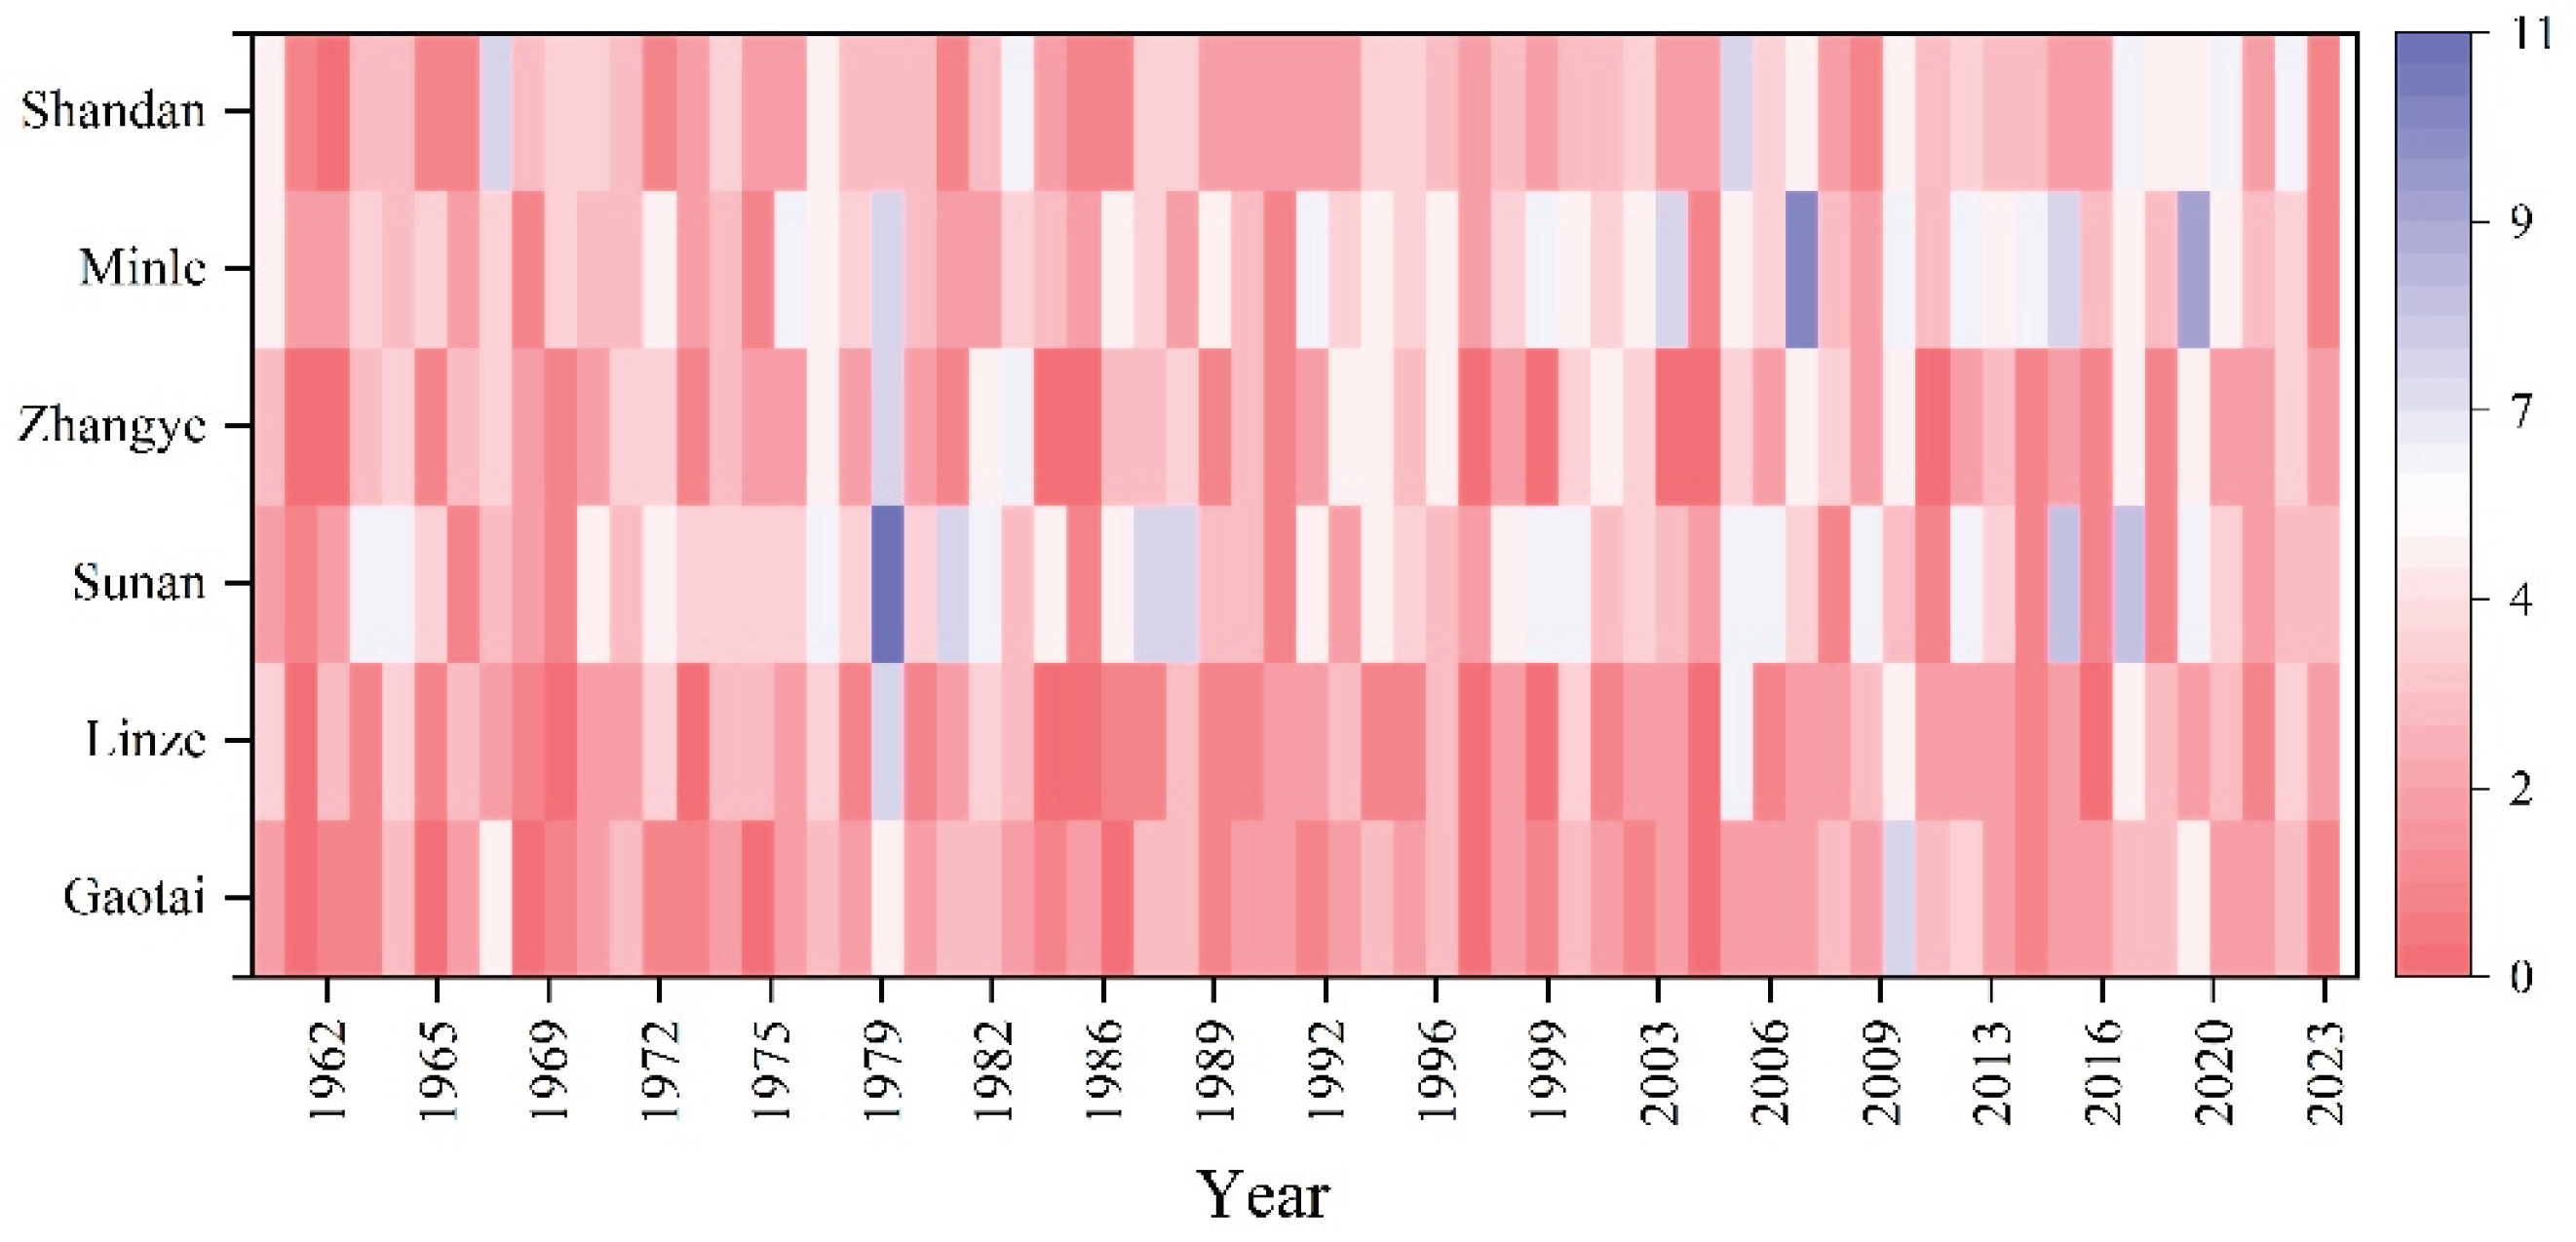
Figure 6.
Temporal trends of annual amount precipitation for R95p indices in Zhangye.
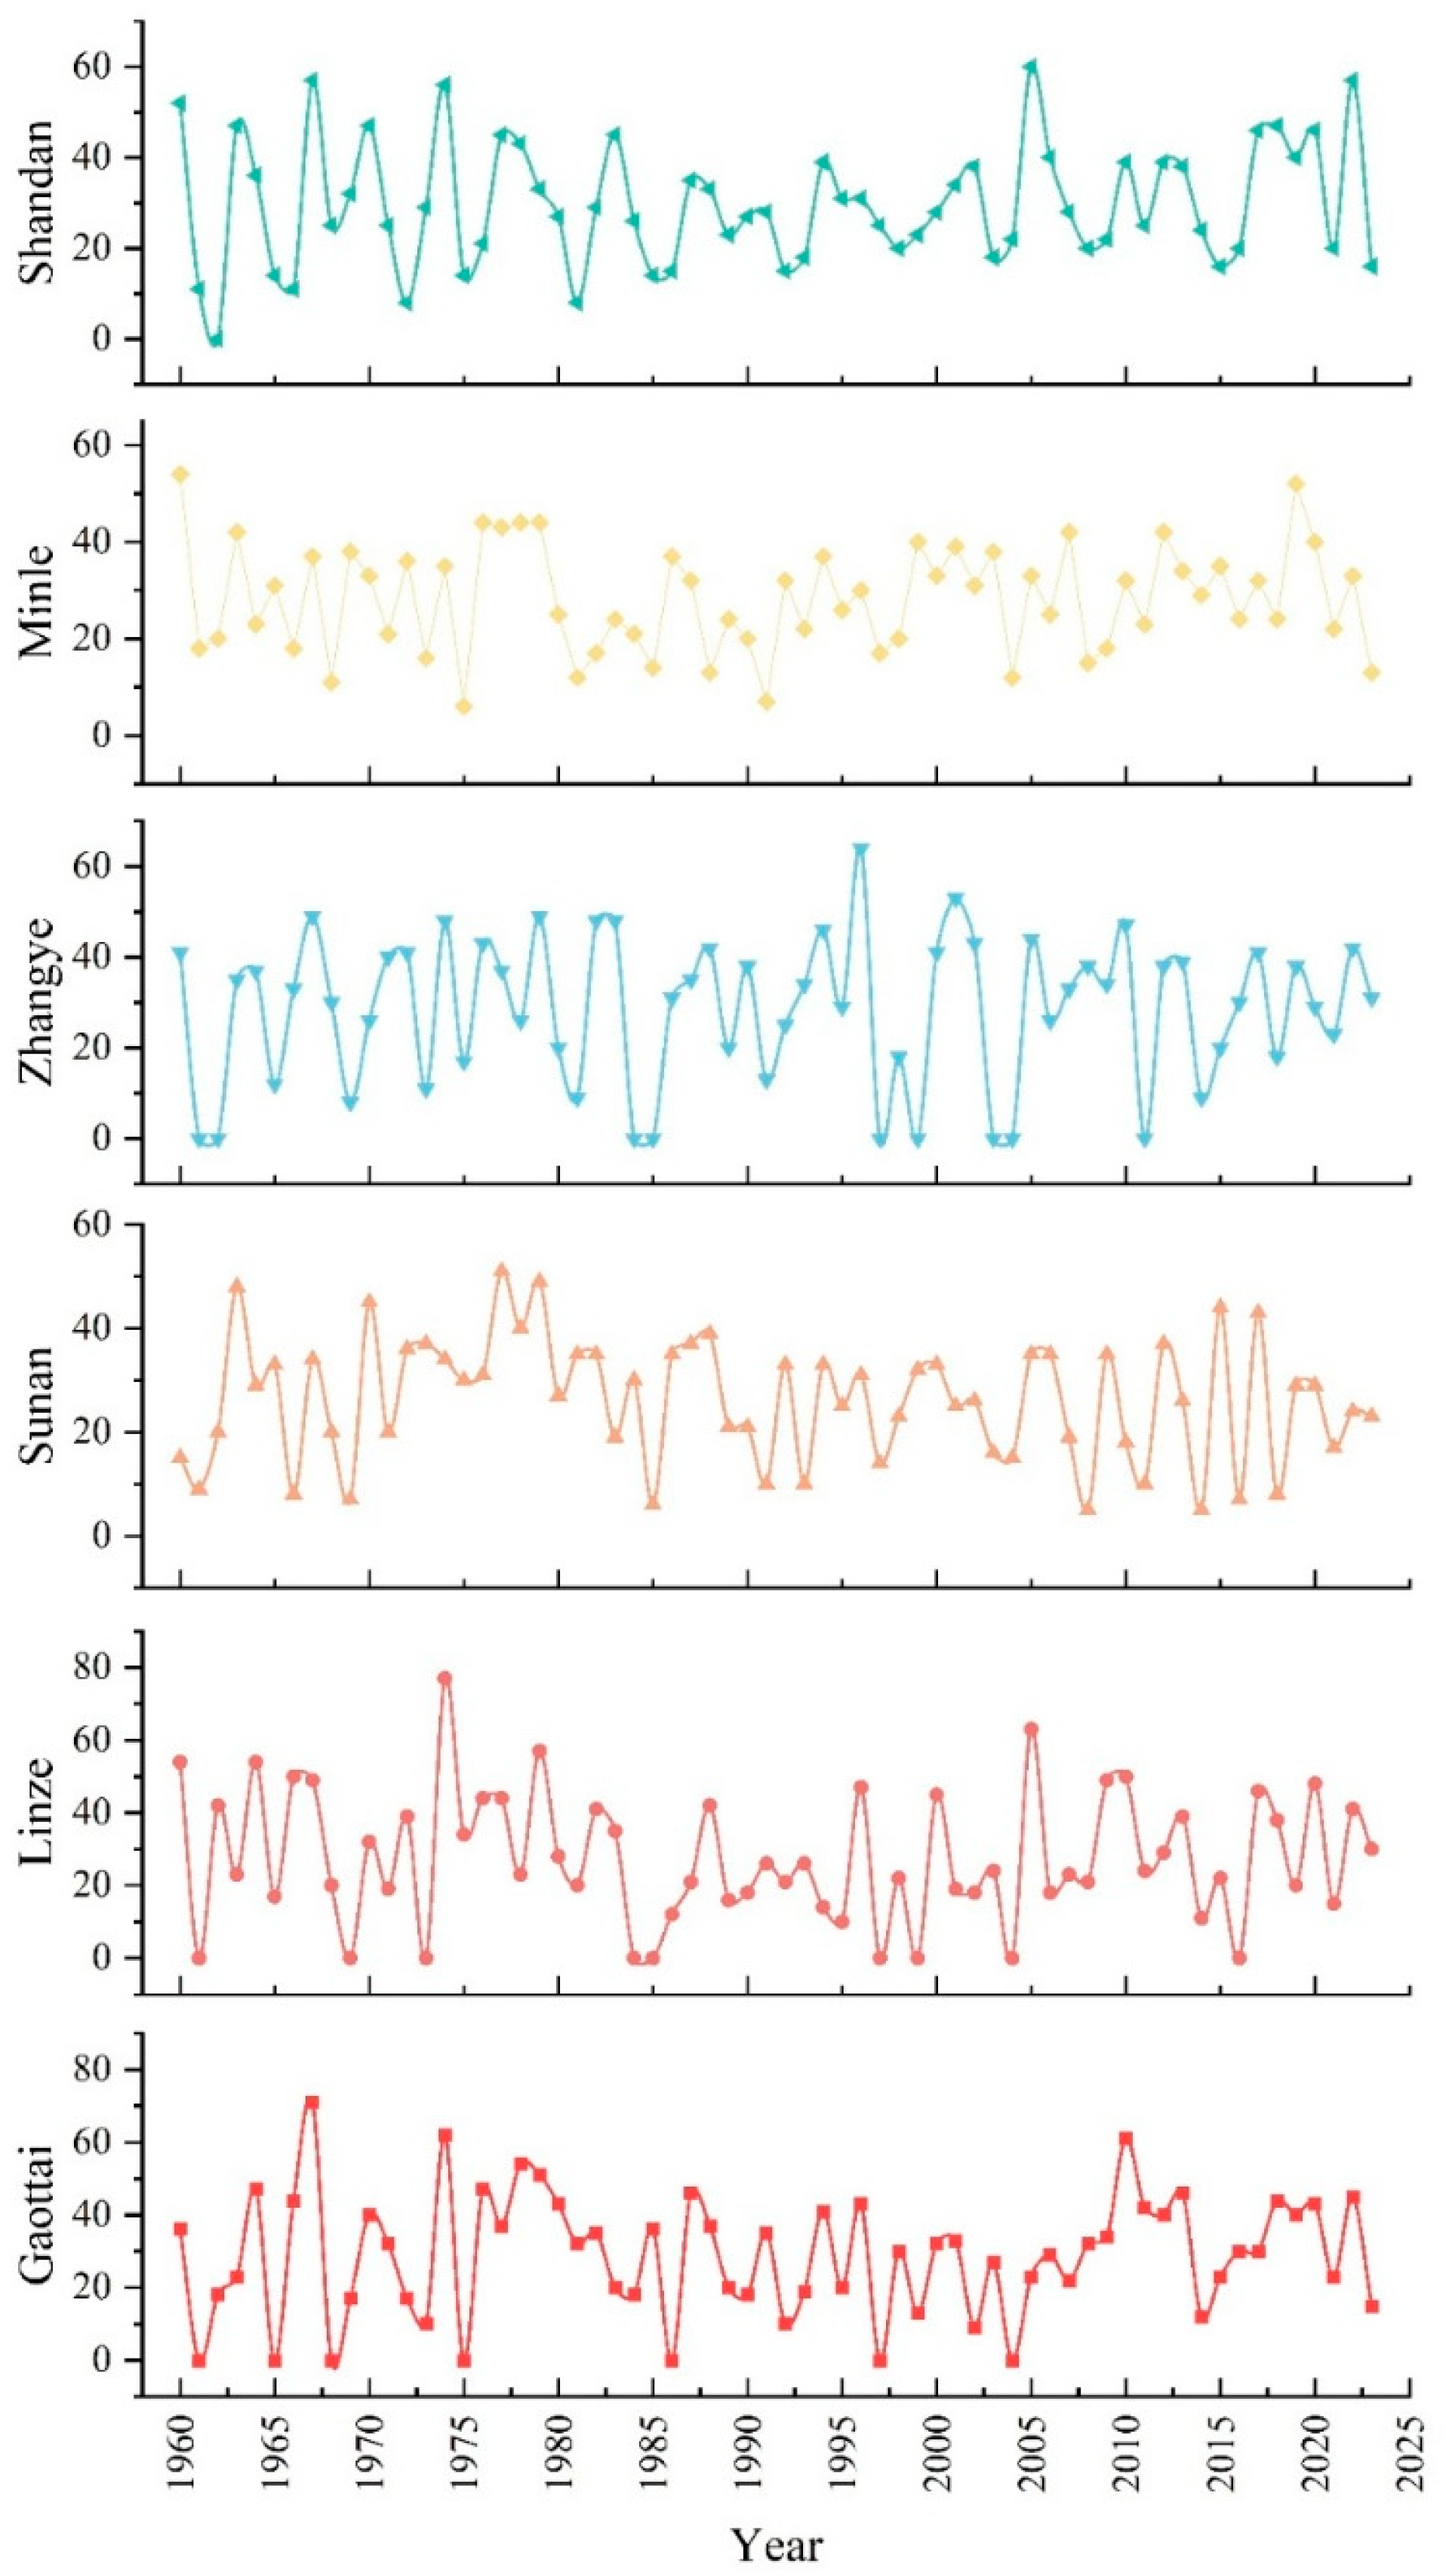
Figure 7.
Temporal trends of annual RX1day (mm) at six stations in the Zhangye region, 1960–2023. Dashed lines denote the linear trend.
Figure 7.
Temporal trends of annual RX1day (mm) at six stations in the Zhangye region, 1960–2023. Dashed lines denote the linear trend.
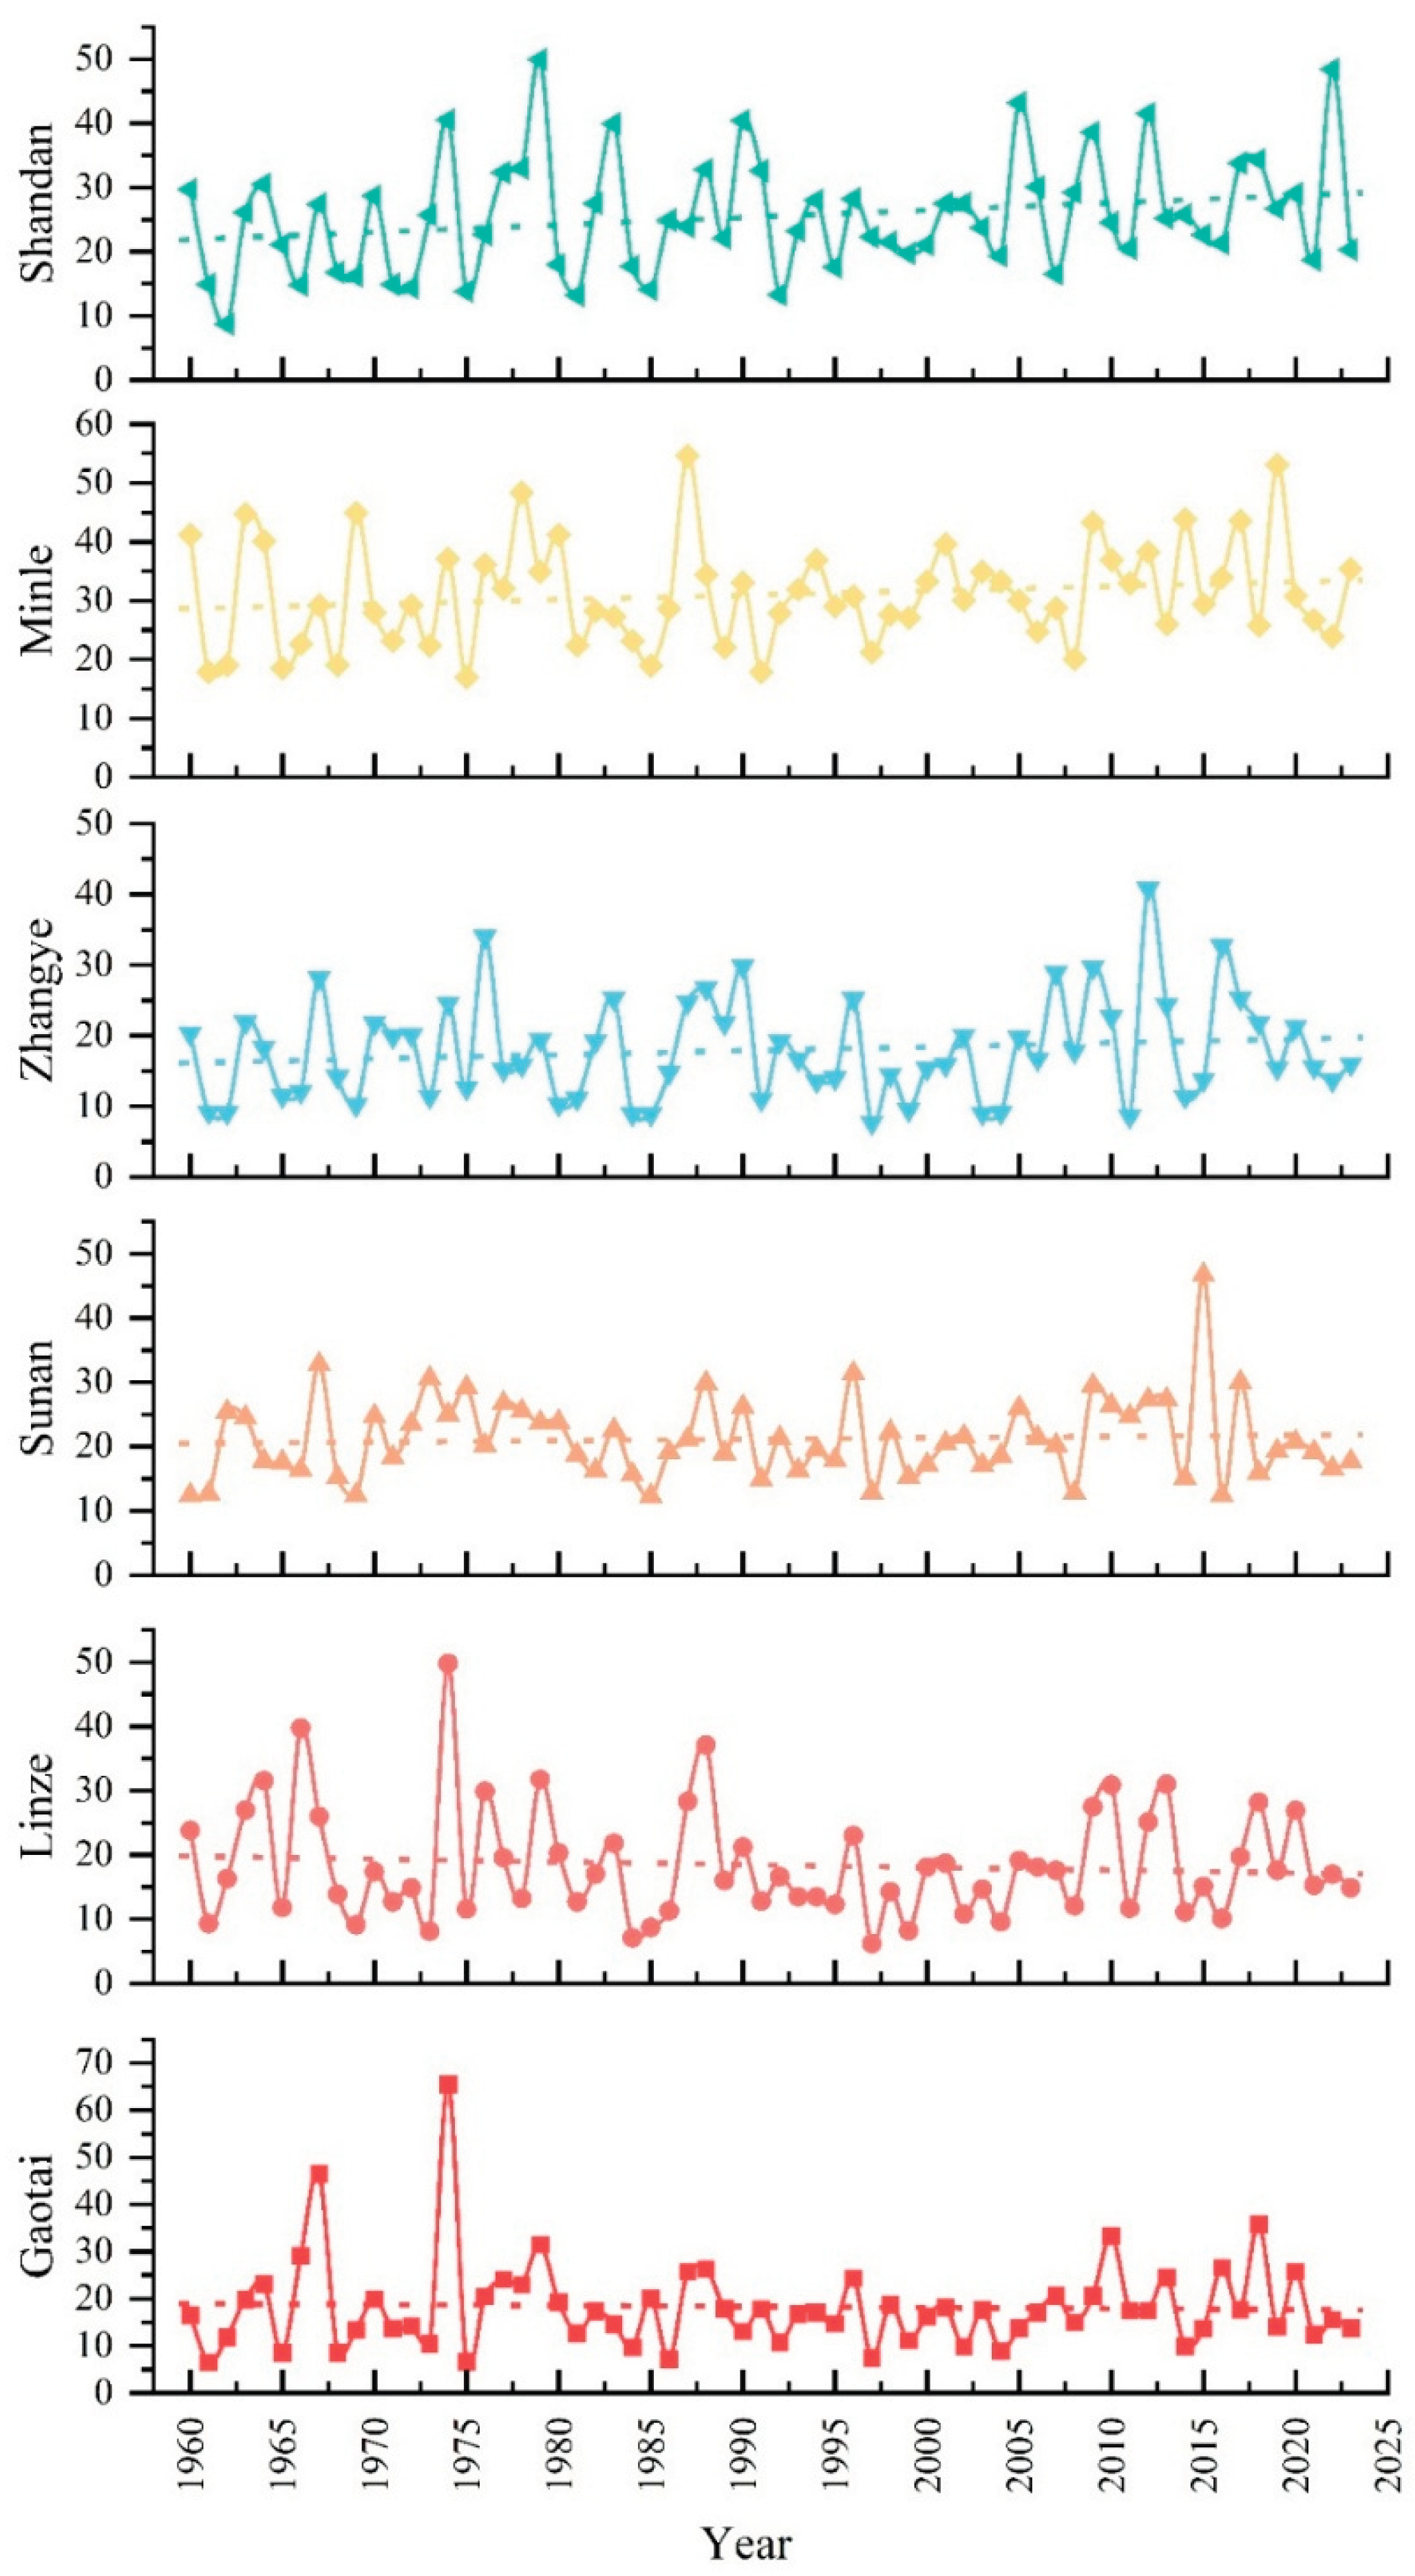

Table 1.
Basic Information on Meteorological Stations in the Zhangye Region
| ID | Name | Elevation (m) | Longitude(°) | Latitude(°) |
|---|---|---|---|---|
| 52652 | Zhangye | 1484 | 100.43 | 38.93 |
| 52546 | Gaotai | 1333 | 99.83 | 39.37 |
| 52557 | Linze | 1455 | 100.17 | 39.15 |
| 52643 | Sunan | 2311 | 99.62 | 38.83 |
| 52656 | Minle | 2272 | 100.82 | 38.45 |
| 52661 | Shandan | 1766 | 101.08 | 38.8 |
Table 2.
Description of the selected extreme precipitation indices.
| Index | Indicator name | Definition | Units |
|---|---|---|---|
| SDII | Simple daily intensity index | Annual total precipitation divided by the number of wet days (defined as PRCP ≥ 1.0 mm) in the year | mm/day |
| R10mm | Number of heavy precipitation days | Annual count of days when PRCP ≥ 10 mm | days |
| R95p | Very wet days | Annual total PRCP on days when RR > 95th percentile of wet-day precipitation (PRCP ≥ 1.0 mm) | mm |
| RX1day | Max 1-day precipitation amount | Annual maximum 1-day precipitation | mm |
Disclaimer/Publisher’s Note: The statements, opinions and data contained in all publications are solely those of the individual author(s) and contributor(s) and not of MDPI and/or the editor(s). MDPI and/or the editor(s) disclaim responsibility for any injury to people or property resulting from any ideas, methods, instructions or products referred to in the content. |
© 2026 by the authors. Licensee MDPI, Basel, Switzerland. This article is an open access article distributed under the terms and conditions of the Creative Commons Attribution (CC BY) license (http://creativecommons.org/licenses/by/4.0/).
Copyright: This open access article is published under a Creative Commons CC BY 4.0 license, which permit the free download, distribution, and reuse, provided that the author and preprint are cited in any reuse.


