

Submitted:
11 July 2026
Posted:
13 July 2026
You are already at the latest version
Abstract
Automation of semantic segmentation of binary detection of focal liver lesions (FLLs) in triphasic computed tomography (CT) scans is critical for knowledge extraction of hepatic malignancy, staging a disease, and planning a treatment. But standard models struggle with class imbalances, boundary differences, and tissue heterogeneity in different phases. This study proposes a modified architecture of a parallel dual-encoder network for FLL boundary refinement optimization. The proposed architecture implements an early feature fusion by stacking the non-contrast (NC), arterial (ART), and portal venous (PVP) phases in the channel dimension. Alongside a per scale, lightweight fusion strategy integrating localized convolutional details to global transformer context. The two architectures were modified and optimized: VGG-19 paired with a Swin Transformer and ConvNeXT-Small paired with a Cross-Shape Window (CSwin) Transformer. The study used a patient-grouped stratified 3-fold validation on 517-case MCT-LTDiag dataset. The networks were extensively benchmarked against standard U-Net, DECTNet and nnU-Net baselines across multiple performance metrics: generalization, segmentation, boundary, and computational. Statistical significance was precisely tested by using a two-tailed paired t-test with Benjamini-Hochberg False Discovery Rate (BH-FDR) adjustments. The ConvNeXT-Small + CSwin Transformer configurations turned out to be the best architecture, with an elite average Dice score of 0.9091 and a leading Intersection over Union (IoU) of 0.8924. This model reduced boundary errors and achieved the lowest 95th percentile Hausdorff Distance (HD95) of 13.86. It resolved the precision-sensitivity trade-off plaguing the baseline models by maintaining a leading sensitivity of 0.9484 and a precision of 0.9352. The champion architecture sustained a tight footprint of ~29M parameters and achieved an optimized average inference speed of 0.111 seconds per slice, even though it has an advanced attention mechanism. This cut the process delay of the VGG-19 variant in half. Qualitative and quantitative results confirm the synergy of modern localized depthwise convolutions and global cross-shaped attention mechanisms removed the bloated false-positive masks and broken under-segmentation. It is delivering a highly stable, precise, and reproducible tool for automated clinical workflows.
Keywords:
binary segmentation
; focal liver lesion
; convolutional neural networks
; dual encoder network
; benjamini-hochberg false rate discovery
1. Introduction
Binary segmentation is a foundational process of pixel-level classification. The network recognizes a focal liver lesion (foreground) from other anatomical structures like healthy liver parenchyma and blood vessels (background) [1,2,3]. Binary segmentation is crucial in the clinical pathway of knowledge extraction of hepatic malignancies leading to cancer-related mortality [4,5,6,7]. Binary masks allow identification of early-stage malignancies such as HCC or ICC, and the staging of disease according to protocols accurately [1,8,9]. It provides localization for thermal percutaneous ablation, radiotherapy, and localized drug distribution [8,10,11]. Precise segmentation enables clinicians to trace the trajectory of lesion growth gradually and evaluate the effectiveness of treatments like chemotherapy or arterial embolization [6,8,12]. Manual delineation of 3D CT scans congests the binary segmentation, which seeks to resolve in clinical practice [13,14]. Manual interpretation is subjective and shows inte[8,10,11r- and intra-expert variability. Automated binary segmentation provides an objective and repeatable reference [13,15]. Radiologists face an enormous burden reading hundreds of 3D slices [14]. Automated systems save significant human effort and time for faster diagnoses in urgent cases [5,12,16]. Precise binary segmentation serves as the core component for Computer-Aided Diagnosis (CAD) systems. It automatically identifies tumors without constant human intervention [5,14].
The study highlights binary segmentation due to the difficulty of standard models with the heterogeneity of focal liver lesions (FLLs) [8,17,18]. Liver tumors and healthy tissue share identical intensity values or Hounsfield Units on CT scans [1,14,19,20]. Binary segmentation is significant because it can “disentangle” or extract knowledge from these subtle boundary differences by being optimized through dual-encoder synergy [7,12]. Binary classification across triphasic CT phases (Non-Contrast, Arterial, and Venous leverages dynamic “wash-in and wash-out” patterns to confirm the presence of a lesion invisible in a single phase [19,21]. The binary task is significant for training models to focus on “hard” foreground samples by specialized compound loss functions like, Dice + Focal Loss because tumors typically occupy only 1% of an abdominal volume [13,18,22]. The binary task allows the use of convolutional branches for local textual edges and Transformer branches for global context and long-range dependencies. It ensures that small, scattered nodules and large heterogeneous masses are both accurately captured [3,23,24].
For binary semantic segmentation of focal liver lesions (FLLs) establishing nnU-Net (“no-new-U-Net”) as a baseline model is highly significant. It functions as the “gold standard” benchmark for several critical reasons in medical image analysis [25]. Medical image segmentation pipelines are notorious for being highly sensitive to implementation details. Minor alterations in data preprocessing or hyperparameter adjustments wildly skew the final performance of the same architectures [26]. nnU-Net established a standardized, reproducible baseline by automating fixed configurations such as specific learning rate decay, optimizers, and standard inference procedures. It removes human engineering bias in baseline [6]. Focal liver lesions are difficult to segment due to fuzzy or ill-defined tumor boundaries, variations in patient morphology, and highly anisotropic slice spacings across different hospital scanners. nn-UNet automatically reads a dataset’s “fingerprint” such as spatial resolution, voxel spacing, and intensity distribution. It dynamically configures rules for resampling and Hounsfield Unit (HU) intensity normalization. The manual guesswork is eliminated and yields an optimized data foundation. In the binary segmentation of focal liver lesions, the background voxel counts of healthy liver parenchyma and surrounding organs massively dwarf the foreground voxel counts of the tumor tissue, creating a severe class imbalance that paralyzes standard deep learning networks [6]. nnU-Net integrates foreground over-sampling strategies in its core training framework that forces the network to sample patches containing the actual tumor slices. This ensures robust positive-gradient signals despite the rarity of lesion pixels [26].
To address the challenges, a novel dual-encoder network architecture is proposed specifically optimized for the binary semantic segmentation of focal liver lesions to effectively balance local edge details in global semantic context. This is inspired by the Dual Encoder Network (DECTNet), our proposal is to develop, optimize, and evaluate the modification of dual architecture network architecture to improve the accuracy, efficiency, and reliability of automatic binary semantic segmentation of focal liver lesions (FLLs) in triphasic CT scans.
- We propose a modification of the dual encoder network by evaluating the best CNN encoder and Transformer encoder to replace the C-encoder and Transformer encoder of the standard DECTNet for binary semantic segmentation of focal liver segmentation of triphasic CT scan.
- We added the feature fusion strategy that will optimize the evaluation of the modified dual encoder network in comparison with the baseline models such as standard U-Net, DECTNet, and nnU-Net.
- We evaluated the models using 3-fold strategy cross-validation against the baseline models using Generalization Metrics: Dice and Intersection over Union, Image Segmentation Metrics: Accuracy, Sensitivity, Specificity, Precision, and F1-Score, Boundary and Shape Metrics: 95th Percentile Hausdorff Distance (HD95) and Normalized Surface Dice (NSD), and Qualitative Results.
- We performed statistical analysis for the validation of all the metrics for the model performance using two-tailed (dependent-samples) t-tests on the fold-wise scores on shared cross-validation folds. P-values within metrics were adjusted with the Benjamini-Hochberg procedure to control the false discovery rate.
2. Related Literature
2.1. Multi-Phase Frameworks Built on nnU-Net
Since nnU-Net is the “gold standard” for automated configuration, several researchers have optimized its architecture specifically for the temporal complexities of triphasic/multi-phasic liver CT scans. Liver Tumor Diagnosis (LIDIA) network is a model directly built upon the nnU-Net framework [10]. It introduces an Iterative Fusion Module (IFM) into the first layer of the nnU-Net encoder to handle multi-phase CT images even when certain phases like the delayed phase are missing [10]. LIDIA is evaluated against standard nnU-Net, proving superior in handling lesion heterogeneity [10]. The TriALS Challenge (Triphasic Aided Liver Lesion Segmentation) is a MICCAI-organized benchmark established that nnU-Net served as the backbone for 12 of 14 top-performing solutions for liver lesion segmentation [27]. While nnU-Net provides the robust baseline, optimization involves adding custom multi-scale encoders or contrastive learning heads for small-lesion discrimination [27].
2.2. Dual-Encoder Optimization Architectures
The state-of-the-art in “Dual-Encoder” design provides architectural blueprints of combining local spatial details with global context. The Dual Encoder Network (DECTNet) is a high-performance architecture combining a convolution-based encoder (C-Encoder) and a Swin Transformer-based encoder (ST-Encoder) [28]. It is cited as having superior feature extraction capabilities in contrast to standard U-Net variants. It uses depth-separable convolutions and feature selection blocks to suppress redundant background information [12,29]. The Dual-Encoder Double Concatenation Network (DEDC-Net) is a heterogeneous network using a 3D VGG-19 encoder that captures fine-grained spatial textures with a 3D ResNet encoder for deep contextual information [7]. Its “double concatenation” strategy at each decoder stage helps recover the high-resolution information lost in a standard nnU-Net contraction path [7]. X-Fuse is a dual-stream network integrating spatial and frequency domain information of dual encoders [11]. It is compared qualitatively against nnU-Net in liver and tumor segmentation tasks and distinguishes itself with heightened sensitivity in minute pathological structures [11]. Complementary CNN and Transformer Encoders (CATS) augments a U-shaped CNN in an independent Transformer encoder [30]. It provides a reference for multi-scale feature fusion of information from both encoders, which fuses at every resolution level by addition operations prior to the decoder [30].
2.3. Critical Literature for Binary Task Significance
Binary segmentation, distinguishing a lesion from the background, is the standard task for the datasets. Multi-Phase CT Scan of Liver Tumor Diagnosis (MCT-LTDiag) datasets provides the clinical rationale for segmenting five distinct tumor classes (HCC, ICC, HH, BCLM, and CRLM) across four temporal phases [29]. The Liver Tumor Benchmark (LiTS) is the foundational benchmark paper that highlights the “small object problem”, where tumors often occupy less than 1% of the image volume, necessitating the robust baseline provided by nnU-Net [7,8].
3. Methods
3.1. Preparation of Datasets
A comprehensive benchmark comprising 517 cases with four-phase contrast-enhanced CT scans: non-contrast (NC), arterial (ART), portal venous (PVP), and delayed (DP) called the Multi-phase CT Dataset for Liver Tumor Diagnosis (MCT-LTDiag) is used in this study. It has five liver tumor subtypes: hepatocellular (HCC), intrahepatic cholangiocarcinoma (ICC), colorectal liver metastasis (CRLM), breast cancer liver metastasis (BCLM), and hepatic hemangioma (HH). The study used three phases of MCT-LTDiag (NC, ART, and PVP) as input to the fusion pipeline. Delayed phase (DP) was excluded consistent with clinical practice where NC, ART, and PVP carry the primary discriminative signal for the tumor subtypes under study. While washout appearance in the portal venous phase is the primary discriminator for metastatic lesions (CRLM and BCLM), the arterial hyperenhancement is the hallmark feature of HCC.
One of the important preprocessing considerations in multi-phase CT studies is inter-phase misalignment. It arises from anatomical variations between acquisitions due to patient breathing and repositioning. The MCT-LTDiag dataset addresses it with a standardized non-rigid registration pipeline implemented prior to public release [30]. Registration was executed using B-spline deformable registration via ITKElastix v0.20.0. The deformable approach accounts for soft-tissue deformation between breath-holds, producing phase volumes that are spatially consistent at the voxel level. Registration quality was officially approved by the dataset authors by expert radiologist review of tumor masses in registered volumes. There was no additional registration applied in our experimental pipeline, as the provided NIfTI volumes reflect the post-registration state. This pre-registered nature is directly supported by our early fusion methodology. During the binary semantic segmentation training, a stratified 3-fold cross-validation strategy was implemented to ensure a robust evaluation and mitigate the risk of overfitting. The dataset was divided into three non-overlapping subsets where each fold maintained an identical distribution of benign and malignant focal liver lesions.
3.2. Data Pre-Processing
Three contrast phases: non-contrast (NC), arterial (ART), and portal venous (PVP)—of a liver CT scan are used in the study. The phases are treated as complementary views of the same anatomy. Additionally, the segmentation target is defined on the portal venous phase where focal liver lesions are most distinctly delineated. To reduce irrelevant anatomy and standardized intensities in patients and sanners, a fixed liver window is applied to every phase prior to learning. Hounsfield Unit (HU) intensities are clipped to the interval (-15, 135) HU where window level 60 HU and window width 150 HU, and linearly rescaled to the unit interval as,
where:
Since the three phases are acquired in separate breath-holds, image grids may differ slightly in spacing and orientation. Each phase is put into common spatial reference before fusion so that anatomically corresponding voxels are aligned across phases. Segmentation is performed in two dimensions on axial slices where each volume is decomposed into axial slices. Every slice is resampled to a fixed in-plane resolution, downsampled using bilinear interpolation for image channels and nearest-neighbor interpolation for label masks, which preserves discrete class indices. The three standardized phases are stacked along the channel dimension to form a three-channel input tensor, X ∈ R3×H×W with channel order (NC, ART, PVP). This constitutes the naive multi-phase representation used as the common input to all encoders.
All evaluation uses 3-fold cross-validation performed at the patient level where all slices belonging to a patient are assigned to the same fold to avoid data leakage where no patient contributes to both training and validation within any fold. To guarantee that every lesion type is represented in each fold, which is stratified by lesion type. Patients of each type are distributed across folds in a round-robin manner. This ensures that both the training and validation partitions of every fold contain all five lesion classes in approximately their dataset proportions. The same per-type stratification is also applied whenever a subset is drawn for development or ablation to ensure consistency regardless of the sampling size.
3.3. Network Architecture
The two proposed models share a common parallel dual-encoder framework with early feature fusion and per-scale additive integration. They only differ in the convolutional and transformer backbones. The non-contrast (NC), arterial (ART), and portal-venous (PVP) CT images are stacked along the channel dimension into a single input tensor X ∈ ℝ(3×H×W) before any learnable layer. This naive channel-stacking constitutes the early fusion of phase information so that both encoder branches observe the complete multi-phase context from the first layer. The stacked tensor is processed by two parallel encoders, a convolutional neural network (CNN) branch and a hierarchical vision-transformer branch. The CNN branch captures local texture and fine spatial detail while the transformer branch establishes long-range dependencies and global context. Each branch independently produces a four-level feature pyramid. The two pyramids are combined at first and passed through a convolution that aligns its channel dimension to the corresponding CNN feature , then bilinearly resized to the spatial resolution of , and finally added element-wise.
With this, the fusion is additive rather than concatenative and introduces only a lightweight alignment convolution as its sole learnable component. Meanwhile, the fused representation is retained at the channel count and spatial resolution of the CNN branch. The resulting fused pyramid is decoded by a U-Net-style decoder where the deepest fused map serves as the bottleneck and to is the skip connections. Each decoder block performs transposed-convolution upsampling, concatenation with the corresponding skip connection, and two convolution-normalization-activation operations. This is followed by a final upsampling state to restore the native resolution. For the binary task, a convolutional head projects the decoder output to a single logit channel which is passed through a sigmoid to yield the lesion-versus-background probability map. The networks are optimized with a compound objective DECTNetLoss combining a weighted binary cross entropy term, pos_weight = 500, with a sigmoid-based Dice term, weight of 0.5, a formulation designed to counteract the extreme foreground-background class imbalance characteristics of focal liver lesion segmentation.
Figure 1 illustrates the architecture of the proposed implementation of hybrid dual encoder using VGG-19, a pretrained ImageNet, as the CNN backbone and Swin Transformer as the transformer encoder. VGG-19 is used to extract features at four stages with channel widths of 128, 256, 512, and 512 at spatial reductions of ½, ¼, ⅛, and 1/16, respectively. Meanwhile, the Swin Transformer is trained from scratch, employing a patch embedding followed by four stages with channel dimensions 64, 128, 256, and 512, and stage depths 2-2-6-2. This branch uses shifted-window self-attention with a window size of 8 to achieve linear complexity. Because the Swin transformer branch produces features at reductions ¼ to 1/32 while VGG-19 produces features at ½ to 1/16, the transformer features are upsampled by the fusion module to meet the CNN resolution at each level. The fused pyramid inherits the VGG scales, with a bottleneck at 1/16 ( for a input).
Figure 1.
(a). Architecture of the Proposed Hybrid Dual Encoder Using VGG-19 and Swin Transformer with Early Fusion using Naive Stacking.
Figure 1.
(a). Architecture of the Proposed Hybrid Dual Encoder Using VGG-19 and Swin Transformer with Early Fusion using Naive Stacking.
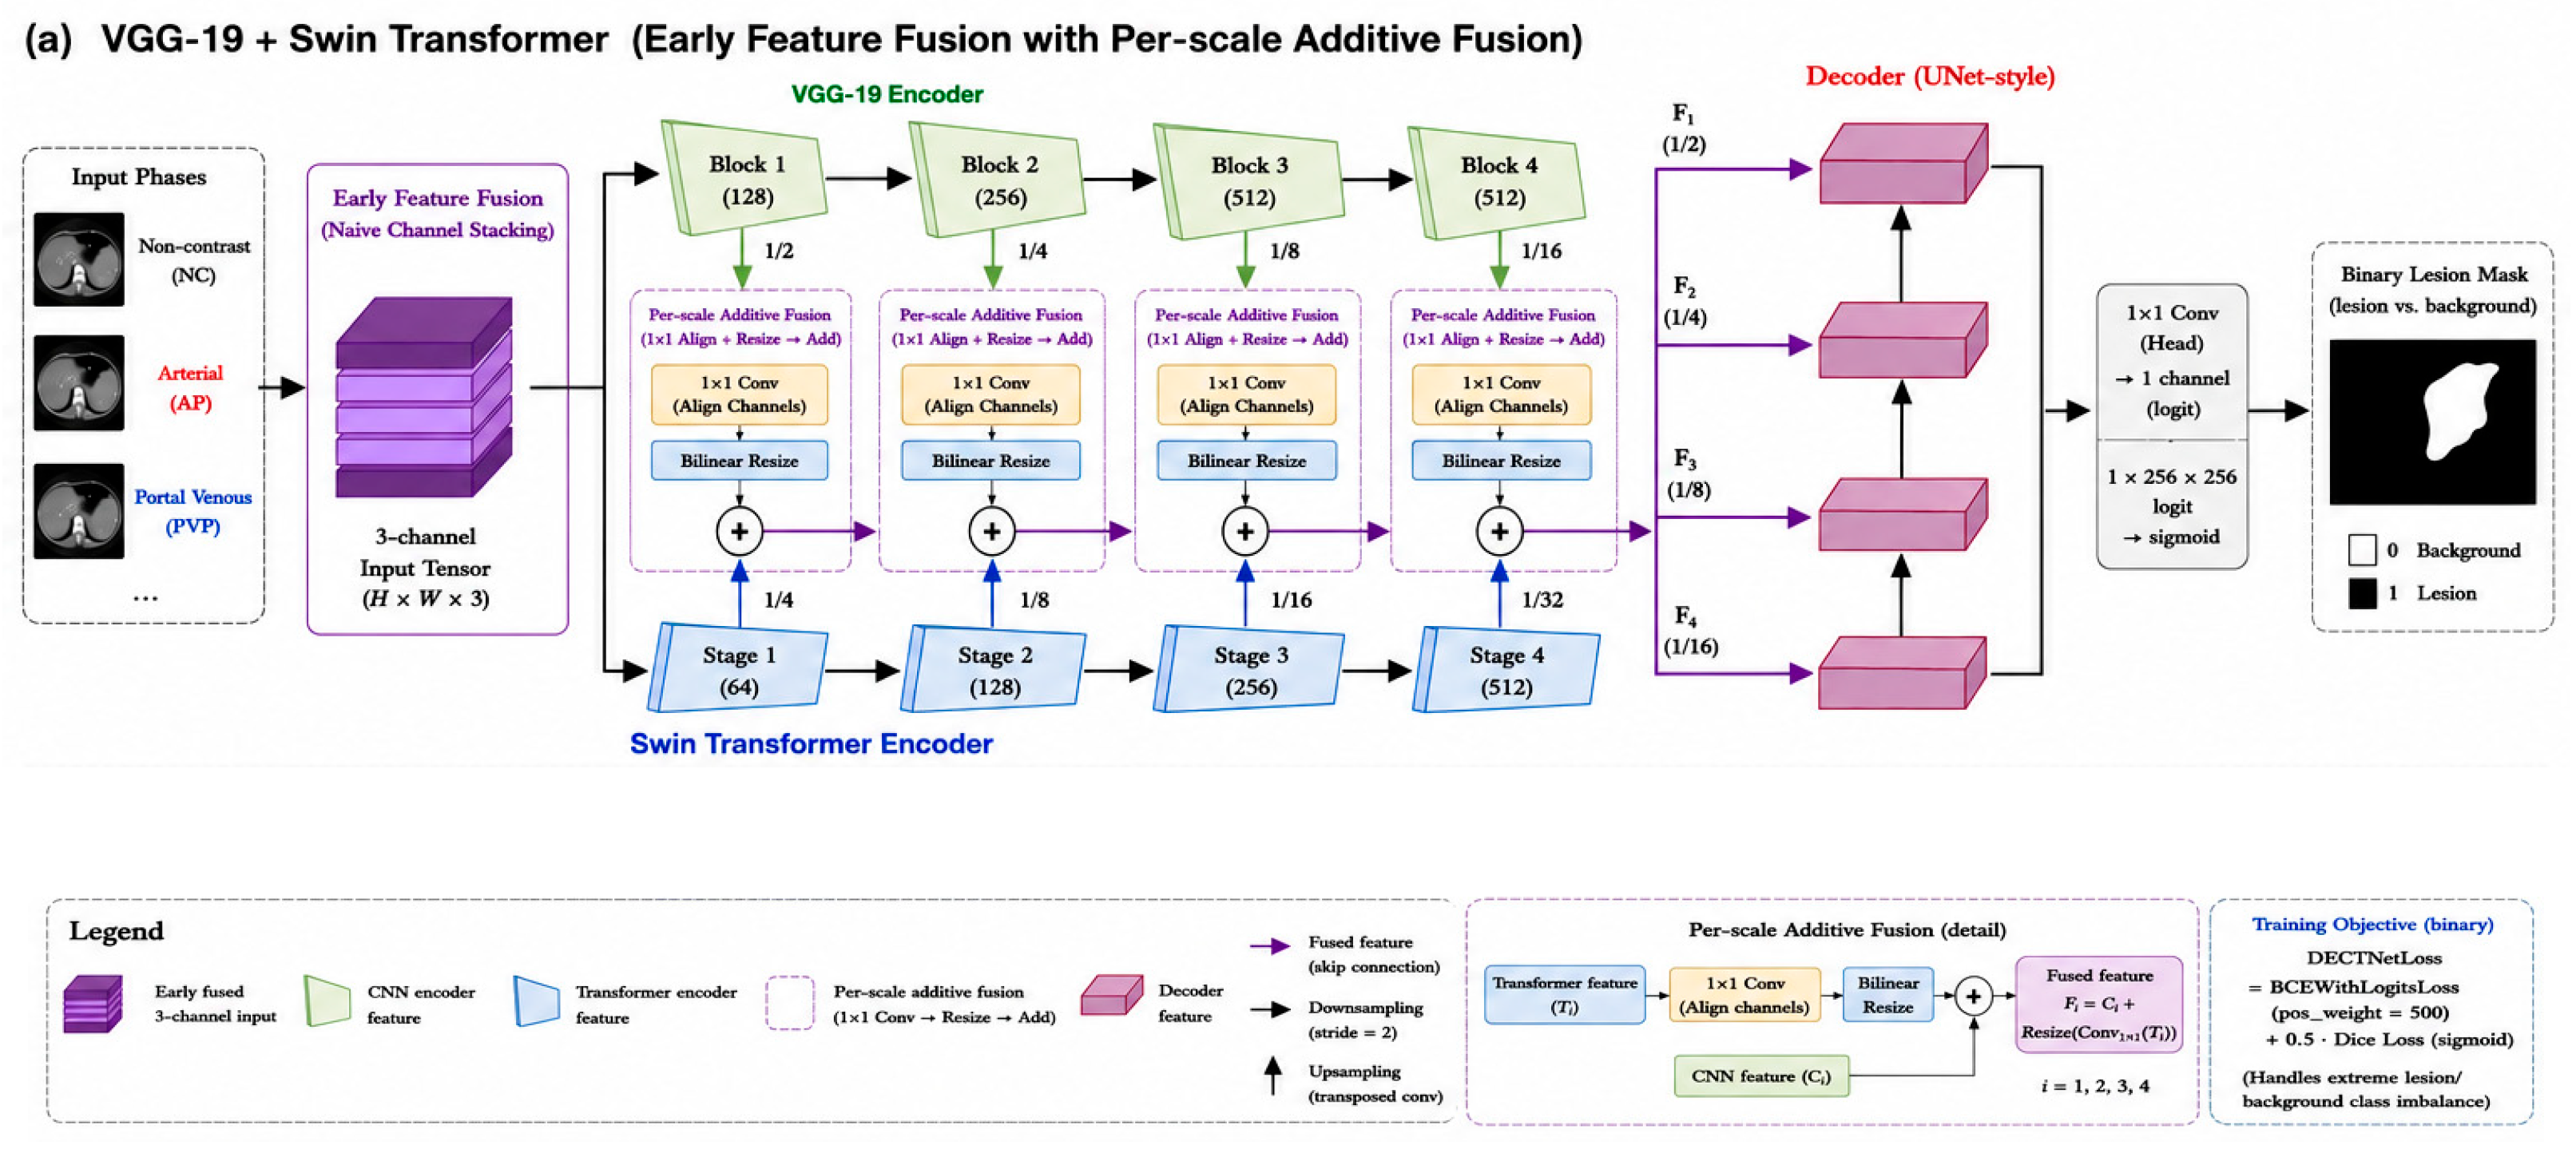
Figure 1.
(b). Architecture of the Proposed Hybrid Dual Encoder Using ConvNeXT and CSwin Transformer with Early Fusion using Naive Stacking.
Figure 1.
(b). Architecture of the Proposed Hybrid Dual Encoder Using ConvNeXT and CSwin Transformer with Early Fusion using Naive Stacking.
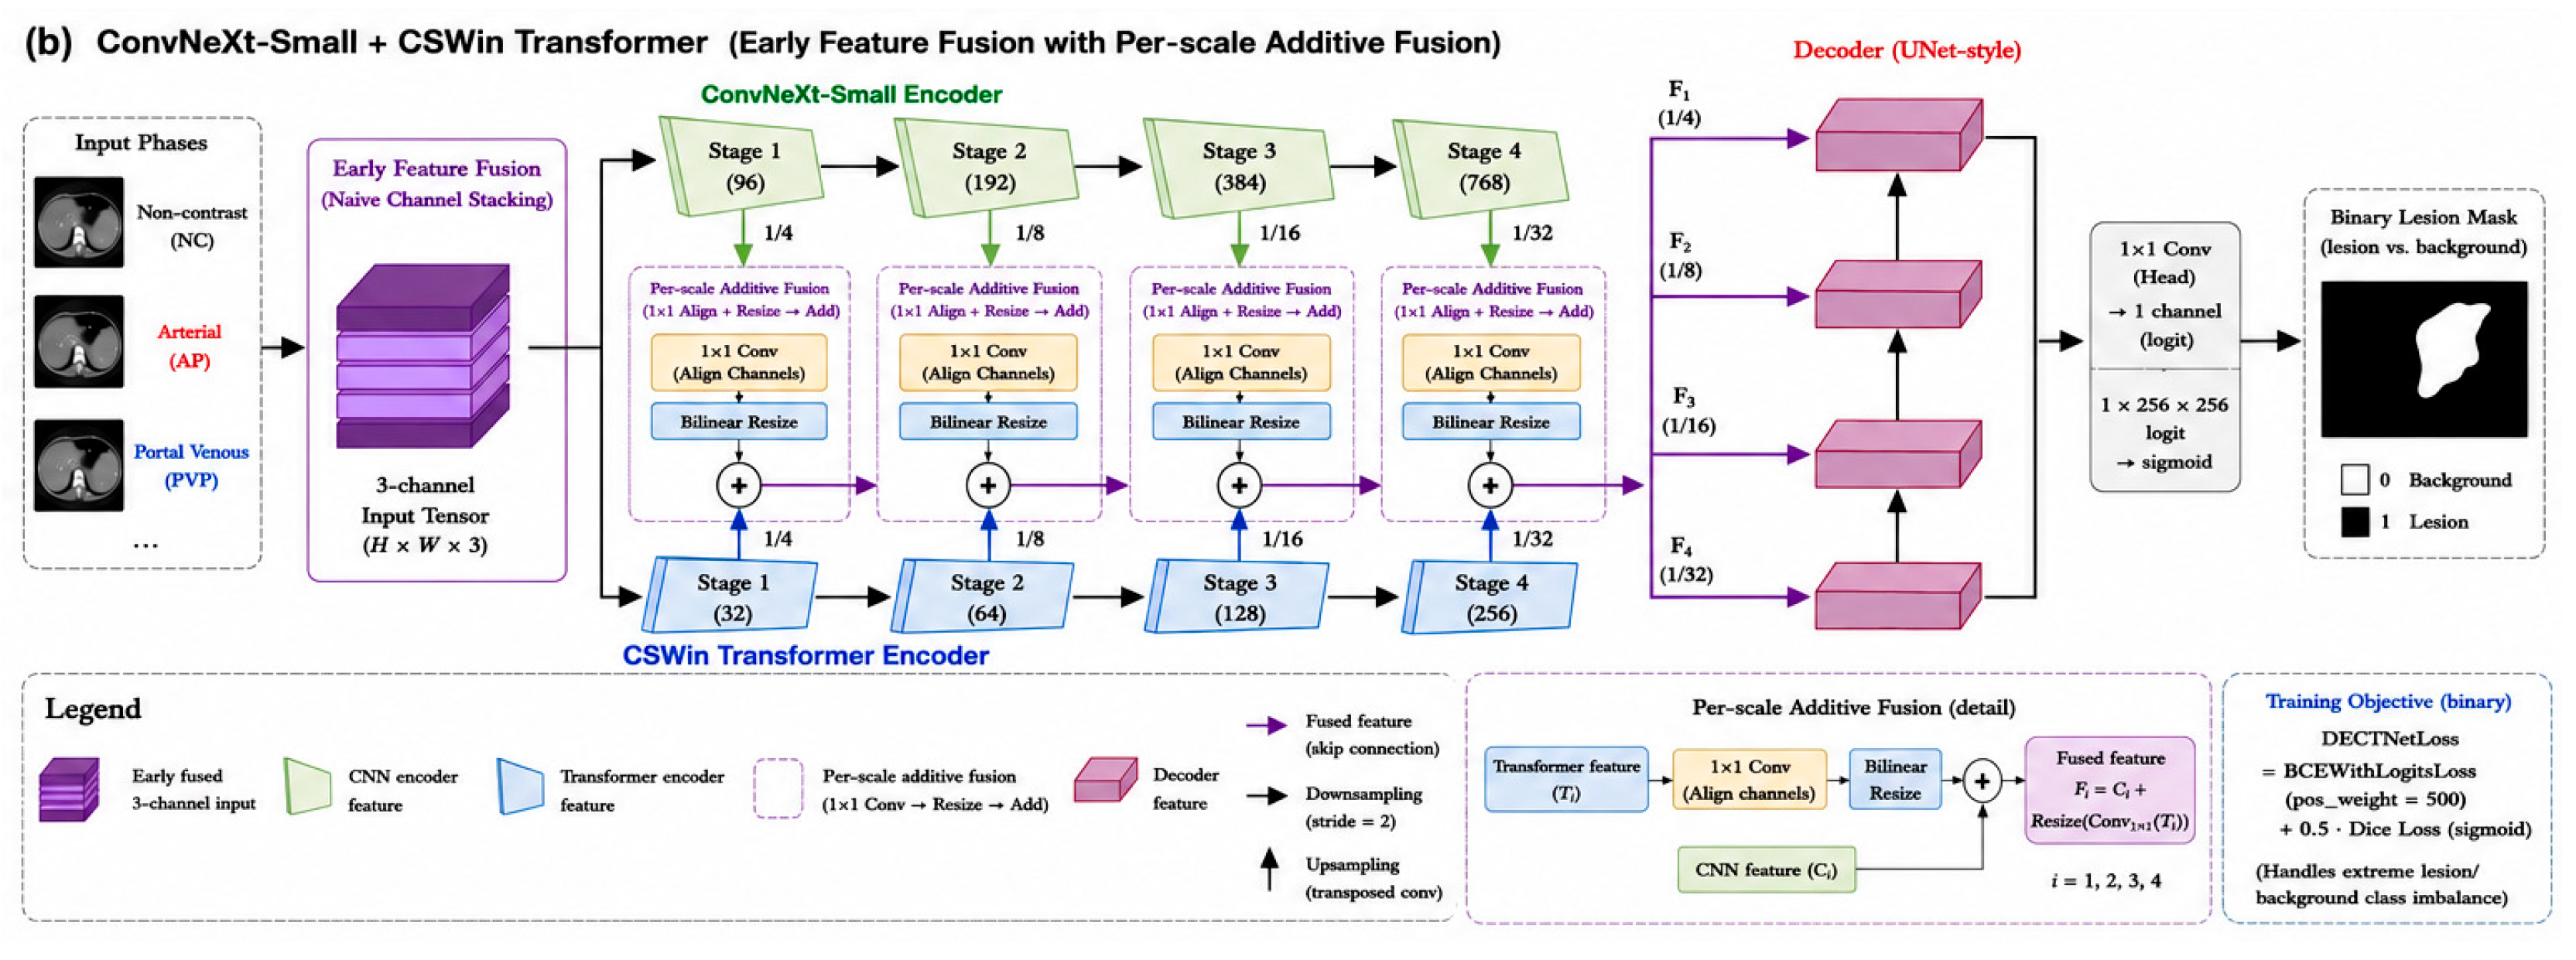
Figure 1 (b) presents the architecture for another proposed implementation for the hybrid dual encoder. This time an ImageNet-pretrained ConvNeXT-Small, a modernized convolutional architecture (depthwise convolutions, larger kernels, layer normalization, and GELU activations) whose four stages provide channel widths of 96, 192, 384, and 768 at reductions of ¼, ⅛, 1/16, and 1/32. The transformer branch is a CSwin Transformer trained from scratch, with channel dimensions of 32, 64, 128, and 256 and stage depths of 1-2-21-1. In place of Swin’s shifted local windows, CSwin employs cross-shaped-window self-attention, in which the attention heads are split between horizontal and vertical stripes to compute attention over full-width and full-height regions in parallel. This is complemented by a locally-enhanced positional encoding. Here both encoders share an identical ¼ - 1/32 schedule, so the branches are scale-aligned at every fusion point and no cross-octave resampling is required. The fused pyramid follows the ConvNeXT scales, with a bottleneck at 1/32 .
3.4. Training Configuration and Optimization
Table 1 shows the setting for training configuration and for optimization of the modified dual encoder network.

Table 1.
Training Settings for the Proposed Models.
| Settings | Value | Settings | Value | |
|---|---|---|---|---|
| Optimizer | AdamW | Dropout/MLP ratio/ Window Size | 0.1/ 0.4/ 8 | |
| Initial learning rate | CNN Branch init | ImageNet-pretrained (time) | ||
| Weight Decay | Transformer Branch init | Trained from scratch | ||
| LR Scheduler | ReduceLROnPlateau (Monitor val loss factor 0.5; Patience 3; min LR ) | Global Seed | 42 (per-fold, seed = 42 + k) | |
| Max Epochs | 100 | Cross-Validation | 3-fold, patient-grouped | |
| Early Stopping | Patience 10 epochs on validation Dice; Best-Dice weights restored | Mixed Precisions | Not used | |
| Batch Size | 3 | |||
| Input Resolution | 256 × 256 |
4. Results
The results of the study show the evaluated models using 3-fold strategy cross-validation against the baseline models using Generalization Metrics: Dice and Intersection over Union, Image Segmentation Metrics: Accuracy, Sensitivity, Specificity, Precision, and F1-Score, Boundary and Shape Metrics: 95th Percentile Hausdorff Distance (HD95) and Normalized Surface Dice (NSD), and Qualitative Results.
4.1. Generalization Metrics
Table 1 shows the Dice Coefficient per Fold and Intersection over Union (IoU) per Fold metrics evaluated across a stratified 3-fold cross-validation for the focal liver lesion segmentation models. The U-Net model demonstrates the weakest performance, with an average Dice of 0.6482 and IoU of 0.6291. In particular, the model suffers from a significant drop in performance at Fold 3 (0.5777). The standard deviation (+0.061) shows it struggles with data variability and generalization in this complex segmentation task. DECTNet and nnU-Net models showed improvements over standard U-Net. DECTNet delivers an average Dice of 0.7498 and highly stable metrics (+0.007), while nnU-Net scores an average Dice of 0.7296, but its IoU drops to 0.6158. VGG-19+Swin is the second-best performer, yielding an average Dice of 0.9010 and an average IoU of 0.8839. A low standard deviation of +0.006 shows robust stability and high reliability across folds. The ConvNeXT + CSwin model is the top performer, achieving the highest overall average Dice score of 0.9091 and a leading average IoU of 0.8924. This network shows outstanding consistency in all validation folds. It is demonstrated by an exceptionally low standard deviation of +0.001 for both metrics. This generalizes incredibly well to unseen data and is not sensitive to a specific split of dataset.
Table 1.
Generalization Metrics Implemented on Stratified 3-Fold Cross-Validation.
| Dice Per Fold | Intersection over Union Per Fold | |||||||
|---|---|---|---|---|---|---|---|---|
| Settings | Fold 1 | Fold 2 | Fold 3 | Average | Fold 1 | Fold 2 | Fold 3 | Average |
| UNet | 0.6769 | 0.6900 | 0.5777 | 0.6482+0.061 | 0.6564 | 0.6710 | 0.5599 | 0.6291+0.06 |
| DECTNet | 0.7520 | 0.7555 | 0.7419 | 0.7498+0.007 | 0.7352 | 0.7399 | 0.7266 | 0.7339+0.007 |
| nn-UNet | 0.7187 | 0.7131 | 0.7570 | 0.7296+0.024 | 0.6065 | 0.6014 | 0.6396 | 0.6158+0.021 |
| VGG-19+Swin | 0.8946 | 0.9028 | 0.9055 | 0.901+0.006 | 0.8766 | 0.8862 | 0.8889 | 0.8839+0.006 |
| ConvNeXT+CSwin | 0.909 | 0.9101 | 0.9083 | 0.9091+0.001 | 0.8928 | 0.8944 | 0.8924 | 0.8924+0.001 |
4.2. Segmentation Performance Metrics
Table 2 shows the Accuracy and Sensitivity metrics evaluated across the stratified 3-fold cross-validation for each model in the focal liver lesion segmentation study. At a glance,all five models exhibit high average accuracy scores, ranging from 0.9937 to 0.9991, with near-zero standard deviations. In medical image segmentation - specifically For a focal liver lesion, the target lesion usually occupies a very small percentage of the total image pixels, while the healthy tissue/background occupies the vast majority. Because the background is overwhelmingly dominant, even a model that misclassifies a portion of the lesion can still achieve an accuracy score above 99%. Therefore, while these high accuracy numbers confirm the models successfully classify the background, they do not perfectly reflect how well the model finds the actual tumor. nn-UNet achieves the highest average accuracy at 0.991 ±0.001. It is closely followed by ConvNeXT+CSwin (0.9988 ± 0) and VGG-19+Swin (0.9986 ± 0). Sensitivity measures the model’s ability to correctly identify actual lesion pixels (true positives). In a clinical setting, high sensitivity is vital because missing a lesion pixel (a false negative) is much more dangerous than a slight over-segmentation. Despite having the highest overall pixel accuracy, nn-UNet scores a dramatically lower average sensitivity of 0.7426 ± 0.008. This means nn-UNet is undersegmenting the tumor and failing to identify roughly 25.7% of the true lesion pixels. VGG-10+Swin (0.958 ± 0.002) and ConvNeXT+CSwin (0.9484 ± 0.004) maintain strong, highly stable sensitivity scores while having much higher pixel-level accuracy and better spatial overlap scores (as seen in the previous Dice/IoU data). UNet achieves the highest average sensitivity at 0.9782 ± 0.005. This indicates that the baseline UNet is highly aggressive at capturing potential lesion pixels, minimizing false negatives.
Table 3 shows the Precision and F1 Score of segmentation performance metrics evaluated across the stratified 3-fold cross-validation per model. Precision measures the model’s ability to avoid false positives, meaning out of all the pixels the model predicted as a tumor, how many actually belonged to a lesion. nn-UNet shows relatively strong precision (0.7726+0.044), showing a major step up from the baseline UNet, which lags at 0.6349+0.063. The standard UNet’s low precision numerically validates the wild over-segmentation and bleeding into healthy liver tissue seen in its visual cuts. VGG-19+Swin Transformer is a runner-up with an average Precision of 0.9163+0.007. ConvNeXT + CSwin Transformer achieved the highest average Precision at 0.9352+ 0.004, confirming that it minimizes false positive pixel markings dramatically and keeps boundaries tightly constrained to actual pathology. The F1 Score captures perfectly why the hybrid models are clinically superior. While a model like standard UNet manages high sensitivity by guessing aggressively, the poor precision pulls it down in overall score. Conversely, nn-UNet manages a strong precision by under-segmenting tightly but sacrifices its sensitivity. The ConvNeXT Small + CSwin Transformer network striked the ultimate balance by achieving the top-tier Precision (0.9352) and a dominant F1 Score (0.9118), demonstrating that dual-encoder networks optimized with modern cross-shaped window transformers offer the safest and most precise border mapping for focal liver lesions.
Table 3.
Segmentation Performance Metrics Implemented on Stratified 3-Fold Cross-Validation.
| Precision Per Fold | F1 Score Per Fold | |||||||
|---|---|---|---|---|---|---|---|---|
| Settings | Fold 1 | Fold 2 | Fold 3 | Average | Fold 1 | Fold 2 | Fold 3 | Average |
| UNet | 0.6637 | 0.6787 | 0.56230 | 0.6349+0.063 | 0.6860 | 0.6978 | 0.5841 | 0.656+0.063 |
| DECTNet | 0.7659 | 0.7625 | 0.7460 | 0.7581+0.011 | 0.7694 | 0.7723 | 0.7612 | 0.7676+0.006 |
| nn-UNet | 0.7655 | 0.7365 | 0.8159 | 0.7726+004 | 0.7187 | 0.7131 | 0.7570 | 0.7296+0.024 |
| VGG-19+Swin | 0.9070 | 0.9188 | 0.9221 | 0.9163+007 | 0.8971 | 0.9066 | 0.9087 | 0.9041+0.006 |
| ConvNeXT+CSwin | 0.9377 | 0.9369 | 0.9311 | 0.9352+004 | 0.9451 | 0.9479 | 0.9523 | 0.9118+0.001 |
4.3. Boundary and Shape Metrics
Figure 2 showed the 95th Percentile Hausdorff Distance (HD95) and the Normalized Surface Dice (NSD) metrics assessed in the stratified e-fold cross-validation per model. HD95 measures the distance with boundaries of ground truth and prediction, focusing on largest alignment errors (outliers). A lower HD95 value is clinically superior since it indicates the predicted boundary is spatially close to the actual lesion. This minimizes dangerous boundary overestimation or underestimation. The underperformers are UNet, DECTNet, and nn-UNet exhibit significantly higher HD95 values, ranging roughly from between 40.0 and 52.0. The proposed hybrid transformer models, ConvNeXT Small + CSwin Transformer and VGG-19 +Swin Transformer demonstrate exceptionally low HD95 averages with under 20.0. They also exhibited very tight error bars. This proves their boundary delineations are stable across-validation runs. The large HD95 values for pure CNNs mean the worst-case boundary predictions are far away from true tumor boundaries. It aligned perfectly with the qualitative results that showed standard UNet is wildly over-segmenting and DECTNet completely missed peripheral nodes like CRLM. Figure 2(b) Normalized Surface Distance, also called Normalized Surface Dice or NSD for the five deep learning models across their cross-validation folds. While traditional Dice and IoU look at total volumetric overlap, HD95 looks at the absolute worst-case boundary mistake, NSD evaluates surface boundary agreement within a specific clinical tolerance threshold (e.g. 1mm or 2mm). It calculates what percentage of the predicted tumor surface is acceptably close to the true tumor surface. The higher NSD the better with a maximum score of 1.00. In clinical practice, like surgical resection or targeted radiation therapy, surface precision is often more critical than volume matching, making NSD a highly vital diagnostic metric. Figure 2(b) shows that the baseline UNet and DECTNet display low NSD averages, hovering around 0.15. nnU-Net captures the highest individual surface agreement, closely followed by the proposed ConvNeXT Small + CSwin Transformer and VGG-19 + Swin Transformer. These architectures achieve high scores ranging around 0.45 to 0.55, meaning their predicted outlines are trace the true geometric contours of the liver lesions tightly. The ConvNeXT Small + CSwin Transformer and VGG-19 + Swin Transformer models establish themselves as the most balanced and clinically viable solutions. They simultaneously minimize worst-case spatial distance deviations (lowest HD95) while maintaining exceptional surface tracing precision (high NSD).
4.4. Computational Efficiency
Table 3(a) shows massive and ineffective baselines are the UNet and DECTNet. UNet features roughly 25M parameters and a moderate FLOP count but delivers a dull Dice score of ~0.65. DECTNet is the worst computational offender, requiring an overwhelming ~143M Parameters and massive FLOP cycles and producing the lowest Dice score of ~0.52. It shows an extremely inflated, unoptimized architecture for triphasic CT processing. The optimized high-performance hybrid is nnU-Net, maintaining a lightweight and memory size of nearly 31.22 million parameters and requiring a minimal GPU VRAM to hold the models' weights. FLOPs measure the raw mathematical complexity, clocking at 412.35 Giga-FLOPs. nnU-Net demands above-average processing power per slice. This processing depth is because of its multi-layered and heavily unrolled 3D/2D convolutional steps that execute dense filter calculations across the medical volumes' resulting a performance efficiency payoff that sits at ~0.73 Dice. VGG-19+Swin Transformer and ConvNeXT Small +CSwin Transformer. VGG-19+Swin Transformer executes an excellent accuracy (~0.90 Dice) burdened by a larger parameter footprint ~45M parameters and higher FLOP overhead expected from the older, denser VGG convolutional blocks. ConvNeXT Small +CSwin Transformer is the architectural innovation of the study. In spite of giving the highest accuracy (~0.91 Dice), it has a highly optimized footprint of just ~29M parameters. Table 3 (b) evaluates the Average Inference Time (in seconds) across all five models evaluated. In a clinical setting, inference time directs how fast a deep learning model processes a patient’s triphasic CT scan and generates segmentation masks for radiologists. A delay of several seconds per slice can seriously block a real-time diagnostic workflows. UNet is the fastest with ~0.052 sec inference time. Because standard UNet uses simple, localized convolutions arranged in a single encoder-decoder stream, it requires very little mathematical overhead. It processes images nearly instantly but suffers from major accuracy and boundary bleeding issues as a trade-off. DECTNet has an ~0.178 seconds inference time. Moving to a traditionally dual-encoder architecture without optimization causes a massive time penalty, nearly tripling the inference delay of UNet. This slowdown is driven by its massive ~143M parameter size and heavy, un-optimized dual feature streams. nnU-Net has a compact memory footprint of ~31M parameters, it takes a relatively long time to generate prediction. Its automated, deeply unrolled convolutional architecture demands heavy pixel-by-pixel mathematical loops (412.35 FLOPs), resulting in a slower processing speed. VGG-19 +Swin Transformer is the slowest in the study with ~0.222 seconds. Standard Vision Transformers like Swin, rely on global self-attention layers that scale quadratically with pixel resolution. When paired with the older, dense convolutional blocks of a VGG-19 backbone, the computational workload multiplies, slowing down inference speed significantly. ConvNeXT + CSwin is highly optimized and clinically viable with ~0.111 seconds. This represents the core engineering breakthrough of the study. Despite utilizing advanced self-attention layers and achieving the highest overall segmentation accuracy (0.91 Dice), it cuts the inference time of the VGG19 + Swin model exactly in half. It is also noticeably faster than both nnU-Net and DECTNet. Table 1 also summarizes the computational efficiency of the five models along with their average dice.
Table 3.
Segmentation Performance Metrics Implemented on Stratified 3-Fold Cross-Validation.
| Model | Parameters (M) | FLOPs (C) | Average Dice | Inference Time (sec) |
|---|---|---|---|---|
| Standard UNet | ~25 M | Scaled | ~0.65 | 0.052 sec |
| DECTNet | ~143 M | High | ~0.52 | 0.178 sec |
| nn-UNet | ~31.22 M | ~412.35 G Extremely High |
~0.73 | 0.165 sec |
| VGG-19+Swin | ~45 M | Scaled | ~0.90 | 0.222 sec |
| ConvNeXT Small+CSwin | ~29 M | Scaled | ~0.91 | 0.111 sec |
4.5. Qualitative Results
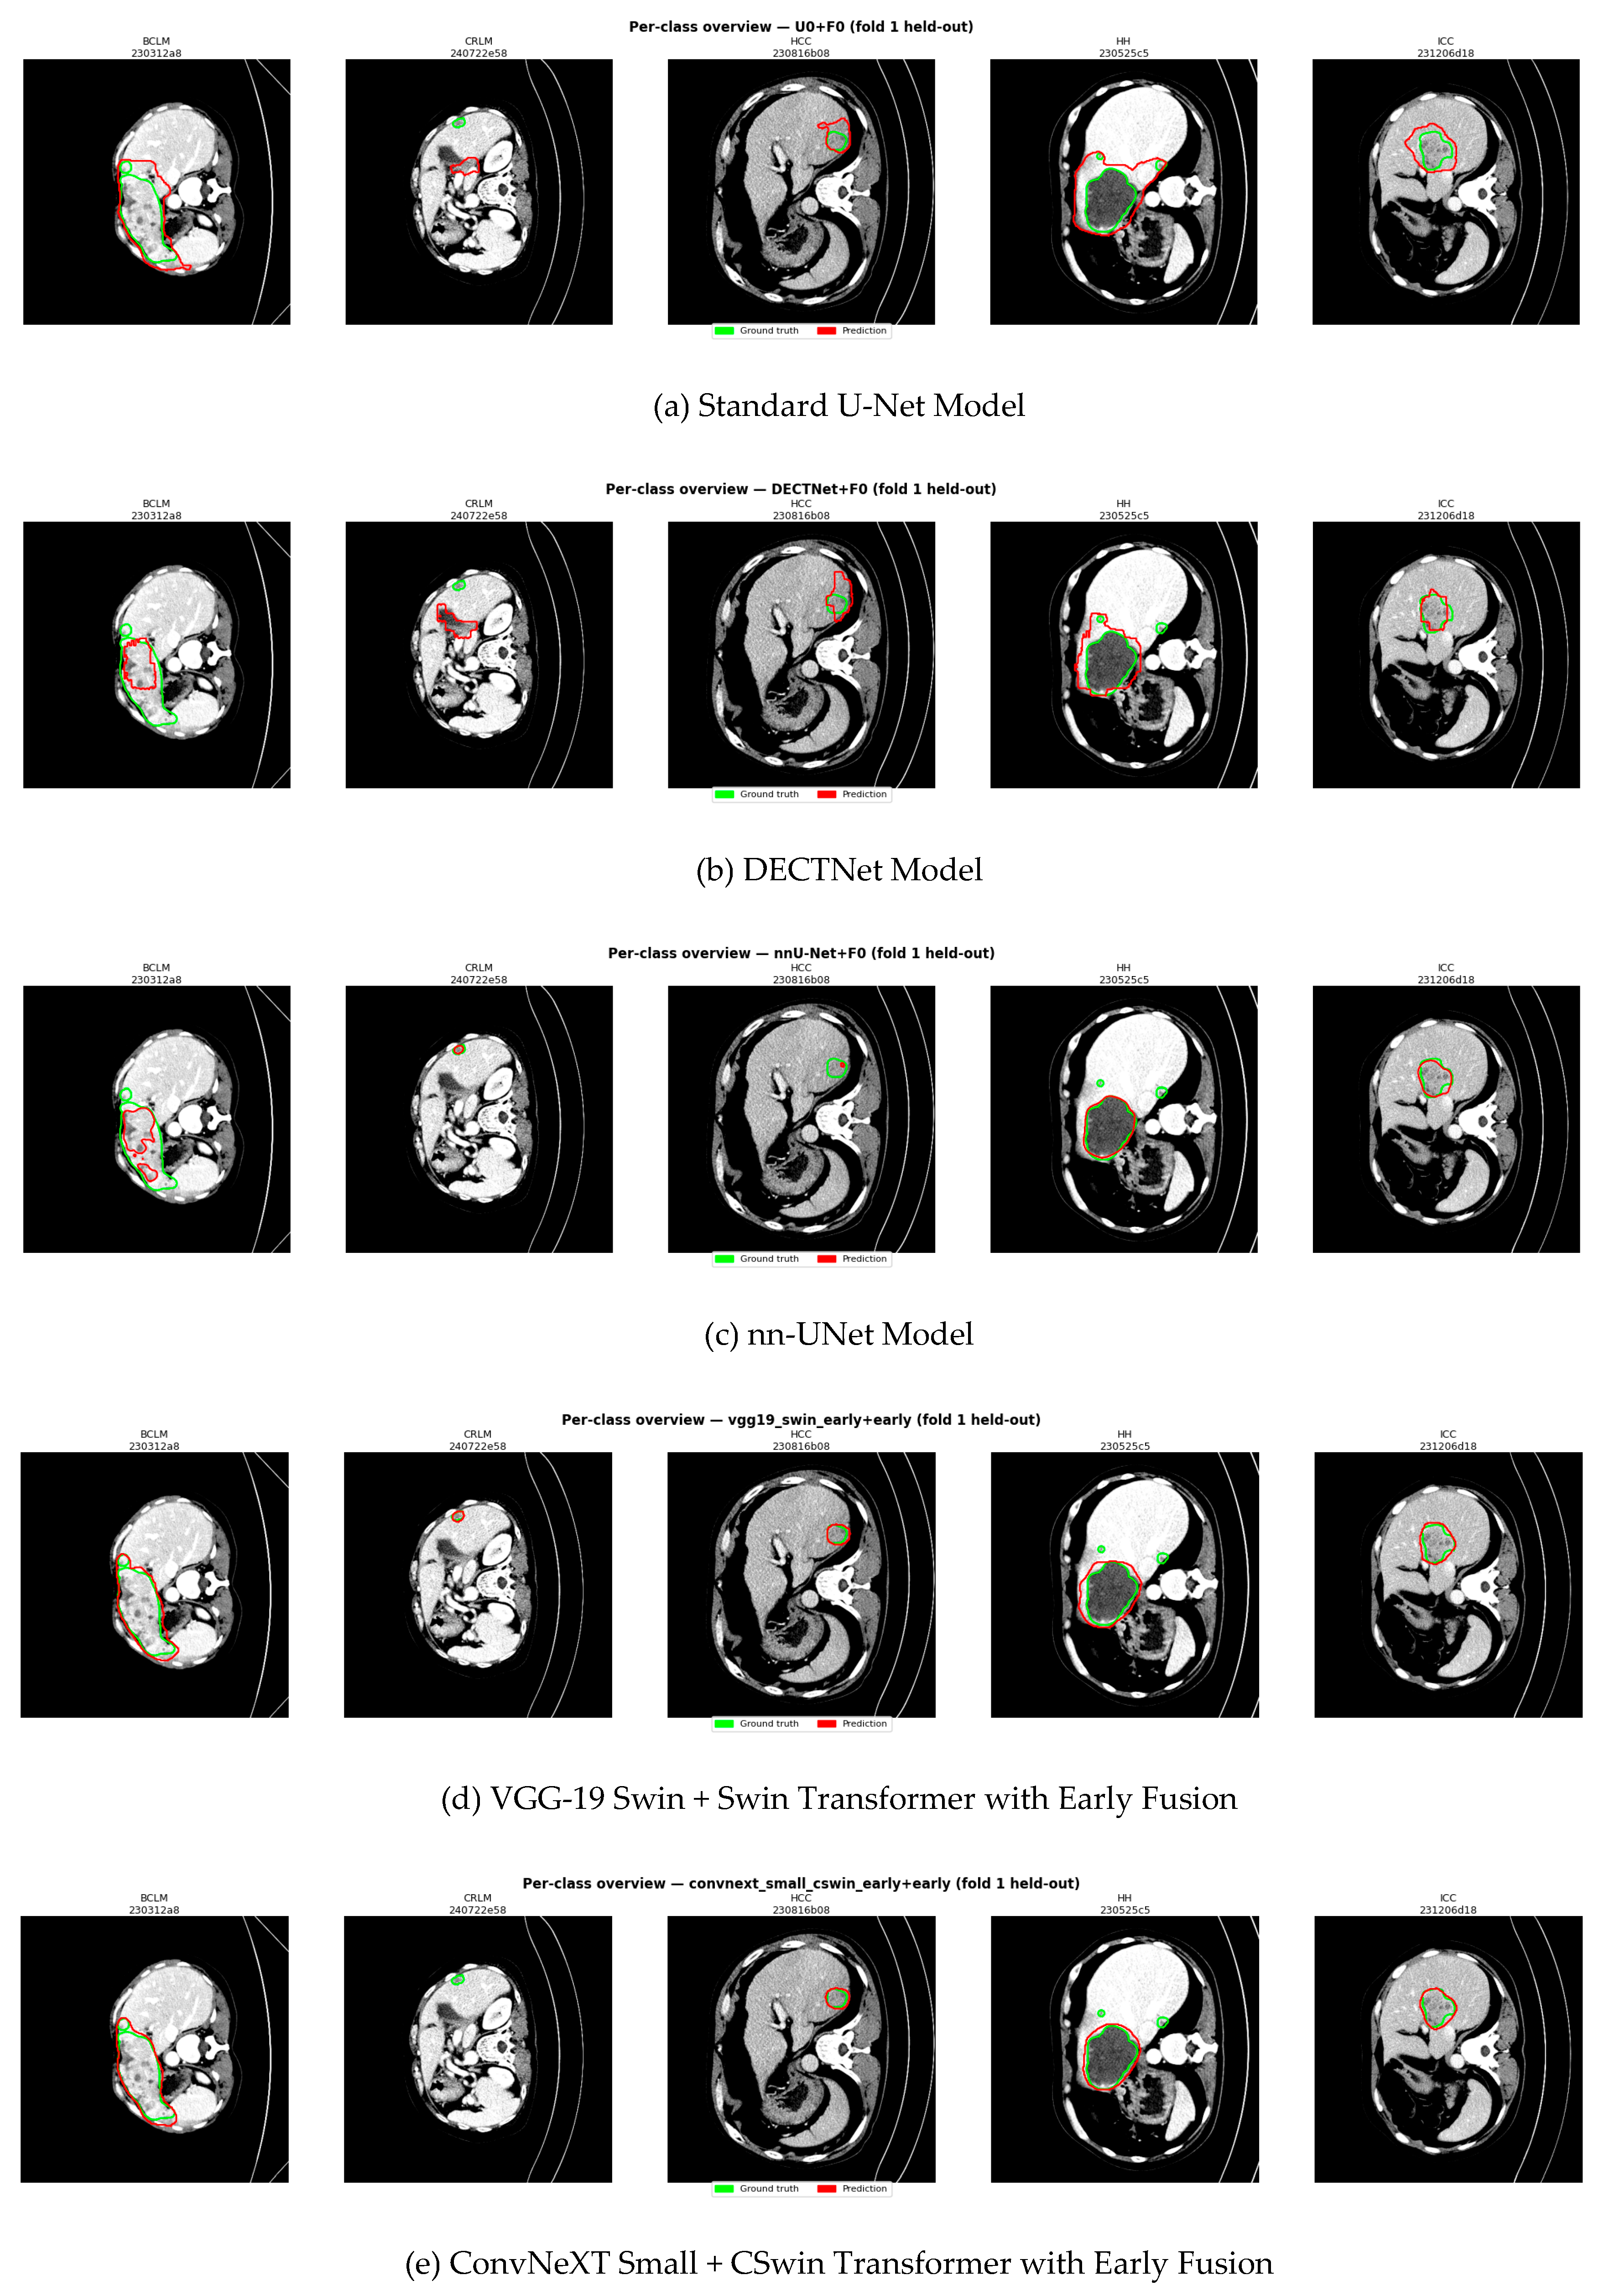
Figure 2 shows the qualitative results of the study. Figure 2(a) shows the qualitative results of the standard U-Net evaluated on the Fold 1 held-out test set. For the binary segmentation performance across the five distinct focal liver lesions. The visual results perfectly validate the quantitative findings, where standard U-Net had a high sensitivity of 0.9782 but a poor Dice score of 0.6482. The U-Net rarely misses the general area of a large tumor. It is highly aggressive at claiming pixels belong to a lesion; ground truth is almost entirely trapped inside the prediction (red). The model constantly overestimates tumor boundaries across almost all lesion types (BCLM, HCC, HH, ICC). It struggles greatly with small, atypical structures, leading to devastating localization errors like in the CRLM slice. Figure 2(b) shows the qualitative results of nn-UNet. nn-UNet segments a boundary tightly and cleanly. It is seen in CRLM, HH (main mass), and ICC, which explains the nearly perfect overall pixel accuracy. It does not over-segment or spill into healthy tissue like the standard U-Net. The major flaw highlighted in nnU-Net is its tendency to under-segment or completely miss entire sections of tumors. Fragmenting the large BCLM lesion and almost entirely overlooking the HCC lesion explains why its sensitivity score dropped significantly (0.7426) compared to other models in the study. Figure 2(c) shows the DECTNet model is evaluated on Fold 1 held-out test set by comparing its binary segmentation of prediction to the expert ground truth. The DECTNet shows an intermediate evolutionary step between the standard U-Net and more advanced hybrid networks. DECTNet swings between under-segmenting large masses (BCLM) and over-segmenting smaller ones (HCC, ICC). It lacks the precise boundary refinement seen in transformer-hybrid architectures. The total misalignment in the CRLM slice reveals that DECTNet struggles with spatial context, mistakenly identifying confounding anatomical features as a tumor while entirely overlooking small, peripheral lesions. Figure 2(d) presents the hybrid VGG-19+Swin model, validating why the model scored a massive jump in Dice performance (0.9010) compared to pure CNN architectures. By using Swin Transformer modules, the network overcomes both the over-segmentation of the baseline U-Net and severe under-segmentation/fragmentation in nn-U-Net. The successful capture of the small CRLM nodule proved the network’s long-range contextual awareness prevented it from getting confused in the complex background liver anatomy. Figure 2(e) displayed the top-performing hybrid architecture of this study, the ConvNeXT Small +CSwin Transformer model. The visual assessment confirmed why the model proved as the supreme model in the quantitative analysis. It scored an elite average Dice of 0.9091 and IoU of 0.8924. The model completely resolved the boundary definition challenges. It does not suffer from the jagged over-segmentation of the basic U-Net or the broken, fragmented under-segmentation of the nnU-Net. By integrating a modern ConvNeXT convolutional backbone for excellent local feature extraction with a Cross-Shaped Window (CSwin) Transformer for long-range self-attention. The network develops an exceptional understanding of liver geometry. This synergy minimizes spatial confusion leading to pristine, highly reliable clinical segmentations.
Figure 3.
Comparison of Qualitative Results for the Baseline Models and the Proposed Models.
4. Discussion
Model performance was compared per metric using two-tailed paired (dependent-samples) model’s t-tests on the fold-wise scores, pairing models on shared cross-validation folds so that between-fold variance common to all models is removed. Because the five models yield ten pairwise comparisons per metric, p-values within each metric were adjusted with the Benjamini–Hochberg procedure to control the false discovery rate; the reported values are BH-adjusted q-values, with boldface entries denoting statistical significance at q < 0.05.
Table 4 (a) shows that the two transformer-based models each significantly outperformed all three convolutional baselines: ConvNeXt-Small + CSwin Transform surpassed UNet (q = 0.029), DECTNet (q = 0.016), and nn-UNet (q = 0.016), and VGG-19 + Swin Transform showed the same pattern (q = 0.031, 0.016, and 0.016, respectively). Among the baselines, only DECTNet versus nn-UNet reached significance (q = 0.029). The two transformer models did not differ significantly from each other (q = 0.152), nor did UNet differ from nn-UNet (q = 0.240) or DECTNet (q = 0.129). The IoU comparisons in Table 4 (b) mirror the Dice results. Both ConvNeXt-Small + CSwin Transform and VGG-19 + Swin Transform significantly exceeded every convolutional baseline (all q ≤ 0.034), while no baseline-versus-baseline comparison was significant (UNet vs DECTNet q = 0.125; UNet vs nn-UNet q = 0.804; DECTNet vs nn-UNet q = 0.060). The two top models were again statistically indistinguishable (q = 0.143).
Accuracy provided almost no discriminative power between models as shown in Table 5 (a). The only significant difference was between VGG-19 + Swin Transform and ConvNeXt-Small + CSwin Transform (q = 0.000). All remaining comparisons were non-significant (q ≥ 0.060). This isolated result should be interpreted with caution—overall accuracy is dominated by the large background class, so the models' values are numerically near-identical (~0.999) and the significant q reflects an extremely small yet highly consistent difference rather than a practically meaningful gap. Table 5 (b) shows that sensitivity yielded the most widespread significance, with nine of ten comparisons significant. Every pairing was significant except the two transformer models against each other (VGG-19 + Swin vs ConvNeXt-Small + CSwin, q = 0.078). The pattern is driven largely by nn-UNet, whose sensitivity is substantially lower than that of all other models, together with the small but consistent fold-wise differences separating the remaining networks.
The precision results, summarized in Table 6(a), follow the same structure as Dice and IoU. Both transformer models significantly outperformed each convolutional baseline (ConvNeXt-Small + CSwin vs UNet, DECTNet, nn-UNet: q = 0.032, 0.020, 0.033; VGG-19 + Swin vs the same: q = 0.033, 0.020, 0.033), and DECTNet differed significantly from nn-UNet (q = 0.028). Neither the two transformer models (q = 0.110) nor UNet against nn-UNet (q = 0.146) or DECTNet (q = 0.111) reached significance. Table 6(b) or the F1 Score results reproduces the overlap-metric pattern seen for Table 11 (Dice Results). ConvNeXt-Small + CSwin Transform and VGG-19 + Swin Transform each significantly exceeded all three baselines (all q ≤ 0.033), and DECTNet significantly exceeded nn-UNet (q = 0.031). The comparisons that did not reach significance were UNet versus nn-UNet (q = 0.278), UNet versus DECTNet (q = 0.123), and the two transformer models against each other (q = 0.184).
Table 7(a) shows the HD95 results where both transformer models achieved significantly smaller boundary errors than DECTNet (q = 0.045 for each) and nn-UNet (q = 0.045 for each). Their advantage over UNet was borderline and did not reach significance (ConvNeXt-Small + CSwin vs UNet, q = 0.072; VGG-19 + Swin vs UNet, q = 0.077). No other comparison was significant, including the two transformer models against each other (q = 0.155). Table 7(b) presents the normalized surface distance (NSD) where the models were separated into a higher-performing group (nn-UNet, VGG-19 + Swin, and ConvNeXt-Small + CSwin) and a lower-performing group (UNet and DECTNet). All three higher-performing models significantly exceeded both UNet and DECTNet (all q ≤ 0.019). Uniquely among the metrics, the two transformer models differed significantly here (VGG-19 + Swin vs ConvNeXt-Small + CSwin, q = 0.049), and nn-UNet significantly exceeded VGG-19 + Swin (q = 0.049) but not ConvNeXt-Small + CSwin (q = 0.326). UNet and DECTNet did not differ significantly (q = 0.147).
5. Conclusions
The study developed, optimized, and evaluated a modified parallel dual-encoder architecture for binary semantic segmentation of focal liver lesion on triphasic CT from MCT-LTDiag dataset. The proposed model includes pretrained convolutional backbone with a from-scratch hierarchical transformer with an early phase fusion and per-scale feature fusion integration. The two models, VGG-19 + Swin and ConvNeXT-Small + CSwin, were examined. They are benchmarked with three established baselines: UNet, DECTNet, and nn-UNet, under identical 3-fold patient-grouped cross-validation across nine-complementary metrics. Both hybrid models significantly and consistently outperformed the baseline models on every overlap and boundary metrics. ConvNeTt-Small + CSWin considered as the champion architecture with a Dice of 0.9091, IoU of 0.8932, F1 of 0.9118, and the lowest boundary error (HD95 13.86), with VGG-19 + Swin a close and stable second. The paired t-tests with BH-FDR correction confirmed that these gains are statistically significant rather than incidental: both transformer-augmented models significantly exceeded all three baselines on Dice, IoU, F1, and precision (q ≤ 0.034), and on HD95 relative to DECTNet and nn-U-Net (q = 0.045). Equally important, the hybrids reduced fold-to-fold variance by roughly an order of magnitude, indicating that their advantage is robust across cross-validation partitions rather than confined to favorable folds.
The results supported the central hypothesis that combining a local convolutional backbone with global transformer context yields more faithful lesion delineation than a paradigm alone. The mechanism is clearest in the sensitivity–precision relationship. The convolutional baselines achieved high sensitivity (0.98 to 0.99) only by over-segmenting. Then collapsing their precision to 0.50 to 0.63, consequently, their Dice fall down as well. Meanwhile, nn-U-Net exhibited the opposite failure, under-segmenting with the lowest sensitivity (0.74). The hybrid models resolved the trade-off by sustaining ~0.95 sensitivity with ~0.92–0.94 precision. This is the reason behind their superior generalization metric results. The saturation of accuracy and specificity near unity for all models (~0.99) reflects the extreme background dominance of the task and underscores why overlap and boundary metrics, not pixel accuracy, must adjudicate performance. The boundary analysis reinforced this, where the hybrid models’ HD95 was more than threefold lower than the baselines' with non-overlapping ranges, and on NSD the champion model achieved high tolerance-band agreement together with low worst-case error.The competitive NSD of nn-UNet is offset by large HD95. The qualitative overlays support the quantitative results. The hybrid models eliminate the bloated false-positive masks and localization failures of the CNN baselines while conforming tightly to irregular lesion margins. A consistent limitation shared by both hybrids was the omission of very small satellite micro-lesions, a direct expression of their conservative, precision-favoring behavior.
Although ConvNeXt-Small + CSWin led on every metric, the two models were statistically indistinguishable on the overlap metrics (Dice q = 0.152; F1 q = 0.184) diverging significantly only on NSD (q = 0.049). The champion's edge is attributable to its higher-capacity modern convolutional backbone and deeper cross-shaped-window transformer with a scale-aligned fusion schedule that avoids the cross-octave resampling required in the VGG-19 + Swin variant. For deployment where surface fidelity is paramount, ConvNeXt-Small + CSWin is the recommended configuration. Where computational economy is preferred, VGG-19 + Swin offers near-equivalent overlap accuracy.
Several limitations temper these conclusions. First, evaluation was confined to a single dataset (MCT-LTDiag). External, multi-center validation is needed to establish cross-scanner generalization. Second, segmentation was performed in 2D on axial slices that discard through-plane context. Extending the framework to 3D is a natural next step. Third, the study fixed the fusion strategy to early channel-stacking with additive integration and did not ablate alternative fusion schemes (late or attention-based cross-phase fusion). Single- versus dual-encoder configurations, or the contribution of individual phases; such ablations would isolate the source of the observed gains. Fourth, the delayed phase was excluded by design, and its incremental value for specific lesion subtypes warrants dedicated study. Finally, the conservative suppression of micro-lesions suggests that lesion-size-aware supervision or a recall-oriented loss variant could further improve small-lesion sensitivity without sacrificing precision.
This work demonstrates a modified dual-encoder network that integrates convolutional and transformer encoders by early fusion and lightweight additive feature integration, delivering high-precision, statistically validated, and stable binary segmentation of focal liver lesions across triphasic CT. It markedly surpassed established convolutional baselines. The ConvNeXt-Small + CSWin configuration is identified as the champion architecture for this task. By pairing architectural detail with rigorous cross-validated and significance-tested evaluation, the study offers a reproducible and clinically motivated foundation for automated focal-liver-lesion segmentation and points toward 3D extension, multi-center validation, and fusion-strategy ablation as the most promising directions for further gains.
Abbreviations
The following abbreviations are used in this manuscript:
| FLLs | Focal Liver Lesions |
| HCC | Hepatocellular Carcinoma |
| ICC | Intrahepatic Cholangiocarcinoma |
| CT | Computed Tomography |
| VGG-19 | Visual Geometry Group—19 layers |
| MCT-LTDiag | Multi-phase CT Dataset for Liver Tumor Diagnosis |
| DECTNet | Dual Encoder Network |
| HD95 | 95th Percentile Hausdorff Distance |
| NSD | Normalized Surface Distance or Normalized Surface Dice |
| BH-FDR | Benjamini-Hochberg False Discovery Rate |
References
- Gul, S.; Khan, M.S.; Hossain, M.S.A.; Chowdhury, M.E.H.; and Sumon, M.S.I. A Comparative Study of Decoders for Liver and Tumor Segmentation Using a Self-ONN-Based Cascaded Framework. Diagnostics. MDPI. 2024. [CrossRef]
- Reyad, M.; Sarhan, A.M.; and Arafa, M. Architecture Optimization for Hybrid Deep Residual Networks in Liver Tumor Segmentation Using GA. International Journal of Computationa Intelligence System, Vol. 17 Art. 209. Springer Nature Link. 2024. [CrossRef]
- Debnath, R.K., Rahman, M.A., Azam, A, Jonkman, M. FSS-ULivR: A Clinically-inspired Few Shot Segmentation Framework for Liver Imaging Using Unified Representations and Attention Mechanism. Journal of Cancer Research and Clinical Oncology, Vol. 15 Issue 7, 215. National Library of Medicine. July 17, 2025.
- Ly, D.V.A.; Pham, T.T.H.; and Le, T.H. Comparative Study of UNet-based Architectures for Liver Tumor Segmentation in Multi-phase Contrast-Enhanced Computed Tomography. Computer Vision and Pattern Recognition. Computer Science. January 20, 2026.
- Gul, S.; Khan, M.S.; Bibi, A.; Khandakar, A.; Ayari, M.A.; and Chowdhury, M.E.H. Deep Learning Techniques for Liver and Liver Tumor Segmentation: A Review. Medicine. Vol. 147, 105620. Elsevier. August 2022. [CrossRef]
- Gao, F.; Hu, Z.; Xian, J.; and Lu, W. Mixed U-Net: Segmentation of Focal Liver Lesions Using a Hybrid 2D and 3D Model. Journal of Applied Clinical Medical Physics. Vol. 27 Issue 1. PubMed Central. December 28, 2025. [CrossRef]
- d’Albienzo, G.; Kamkova, Y.; Naseem, R.; Ullah, M.; Colonnese, S.; Cheik, F.A.; and Kumar, R.P. A Dual Encoder Concatenation Y-Shape Network for Precise Volumetric Liver and Lesion Segmentation. Computers in Biology and Medicine. Vol. 179, 108870. Elsevier. 2024. [CrossRef]
- Bilic, P.; Christ, P.; Li, H.B.; The Liver Tumor Segmentation Benchmark (LiTS) Medical Image Analysis. Vol. 84, 102680. Elsevier. 2023.
- Huang, W.; Liu, W.; Zhang, X.; Yin, X.; Han, X.; Li, C.; Gao, Y.; Shi, Y.; Lu, L.; Zhang, L.; Zhang, L.; and Yan, K. LIDIA: Precise Liver Tumor Diagnosis on Multi-Phase Contrast-Enhanced CT via Iterative Fusion and Asymmetric Contrastive Learning. Lecture Notes in Computer Science. Springer Nature Link. 2024.
- Harini, G. and Karthika, R.; Liver and Liver Tumor Segmentation Using Modified Encoder Decoder Network and Find the Tumor Geometry. 2023 IEEE 4th Annual Flagship India Council International Subsections Conference (INDISCO). IEEE Explore. October 10, 2023.
- Lyu, P.; Liu, W.; Lin, T.; Zhang, J.; Liu, Y.; Wang, C.; and Zhu, J. Semi-Supervised Segmentation of Abdominal Organs and Liver Tumor: Uncertainty Rectified Curriculum Labeling Meets X-Fuse. Machine Learning, Science and Technology. May 23, 2024. [CrossRef]
- Li, B.; Xu, Y.; Wang, Y.; and Li, X. Accurate Semi-Supervised Medical Image Segmentation Using DECTNet Combined with DSST Framework. 2024 5th International Conference on Computer Vision, Image and Deep Learning (CVIDL). IEEE. 2024.
- Gul, S.; Khan, M.S.; Hossain, M.S.A.; Chowdurry, M.E.H.; and Sumon, M.S.I. A Comparative Study of Decoders for Liver and Tumor Segmentation Using a Self-ONN-Based Cascaded Framework. Diagnostics. MDPI. 2024.
- Almotairi, S.; Kareem, G.; Aouf, M.; Almutairi, B.; and Salem, M.A.-M. Liver Tumor Segmentation in CT Scans Using Modified SegNet, Sensors, 2020, 1516, MDPI. [CrossRef]
- Mrugesan, R.; Devaki, K. Liver Lesion Detection Using Semantic Segmentation and Chaotic Cuckoo Search Algorithm. Information Technology and Control Vol. 52 No. 3. ITC KTU. 2023. [CrossRef]
- Hussein, A.-J.; Disha, D.; Azhar, A.S.; Lamya, H.; and Malak, E.-A. A Review of Deep Learning Algorithms and Their Applications in Healthcare. Algorithms. Vol 15 2022.
- Lu, M.; Yaoyu, T.; and Sihang, B. Liver tumor segmentation based on 3D convolutional neural network with dual scale. PubMed 2020.
- Jiang, L.; R, Ou.; Y, Liu.; T, Zuo.; H, Xie, T.; Xiao, H.; and Bai, T. RMAU-Net: Residual Multi-Scale Attention U-Net For Liver and Tumor Segmentation in CT Images. Computers in Biology and Medicine, Elsevier, 2023.
- Xu, Y.; Cai, M.; Lin, L.; Zhang, Y.; Hu, H.; Peng, Z.; Zhang, Q.; Chen, Q.; Mao, X.; Iwamoto Y.; Han, X.-H.; Chen, Y.-W.; and Tong, R. PA-ResSeg: A Phase Attention Residual Network for Liver Tumor Segmentation from Multi-Phase CT Images. Medical Physics Vol. 48 Issue 7 pp. 3572-3766, PubMed. [CrossRef]
- Nabizadeh, N.; Dorodchi, M.; and Sihang, B. Automatic tumor lesion detection and segmentation using modified winnow algorithm. IEEE. 2015.
- Zhu, S.; Zou, M.; Wu, Q.; Go, Z.; Huang, Z.; Zou, Y.; Tan, T.; You, Y.; Dong, X.; and Lou, H. STD-Net: A Spatio-Temporal Decoupling Network for Multiphasic Liver Lesion Segmentation and Characterization. NPJ Digital Medicine Article Number 13 (2026), Nature Careers. [CrossRef]
- Zhang, C.; Wang, L.; Zhang, C.; Zhang, Y.; Li, J.; and Wang, P. Liver Tumor Segmentation Based on Multi-Scale Deformable Feature Fusion and Global Context Awareness. Biomimetics Vol. 10 Issue 9. MDPI. 2025. [CrossRef]
- Yang, Z.; and Li, S. “Dual-Path Network for Liver and Tumor Segmentation in CT Images Using Swin Transformer Encoding Approach,” Current Medical Imaging Vol. 19 Issue 10 pp. 1114-1123 (2023), PubMed. [CrossRef]
- Wang, D.; Sun, Y.; Chen, H.; and Zhao, X. Image Segmentation Network Based on Enhanced Dual Encoder. Scientific Data Article Number 35983. Nature. 2025. [CrossRef]
- Skorupko, G.; Avgoustidis, F.; Martin-Isla, C.; Garrucho, L.; Kessler, D.A.; Pujadas, E.r.; Diaz, O.; Bobowicz, M.; Gwozdziewicz, K.; Bargallo, X.; Jarusevoicius, P.; Osula, R.; Kushibar, K.; and Ledakir, K. Federated nnU-Net for privacy-preserving medical image segmentation. Scientific Reports. Vol 15 (38312). PubMed Central. November 2025. [CrossRef]
- Isensee, F.; Petersen, J.; Klein, A.; Zimmerer, D.; Jaeger, P.F.; Kohl .; Wassertal, J.; Koehler, G.; Narajitra, T.; Wirkert, S.; and Maiser-Hein, K.H. nnU-Net: Self-Adapting Framework for U-Net-Based Medical Image Segmentation. Bildverarbeitung fur die Medizine 2019, February 7, 2019, Springer Nature Link.
- Elbatel, M.; Ghonim, M.; Mao, J.; Lin, Z.; Ecstein, K.; Mora, A.M.; Deissler, J.; and Li, X. TriALS: Triphasic-Aided Liver Lesion Segmentation Benchmark in Non-Contrast CT. TriaALS 2026. May 2026.
- Li, B.; Xu, Y.; Wang, Y.; and Zhang, B. DECTNet: Dual Encoder Network Combined Convolution and Transformer Architecture for Medical Imaging Segmentation. PlosOne. April 4, 2024. [CrossRef]
- Wu, X.; Su, H.; Hua, Y.; Xu, Y.; Wang, L.; Wang, X.; Wang, S.; Jin, B.; Liu, X.; Wan, X.; Sun, Q.; Wang, X.; and Du, S. A Multi-phase CT Dataset for Automated Differential Diagnosis of Liver Tumors. Scientific Data, Data Descriptors. Vol. 13 Article 31. Springer Nature. December, 2025. [CrossRef]
- Li, H.; Hu, D.; Liu, H.; Wang, J.; and Oguz, I. CATS: Complementary CNN and Transformer Encoders for Segmentation. 2022 IEEE 19th InternationalSymposium on Biomendical Imaging (ISBI). IEEE Explore. March 2022.
Figure 2.
Comparison of HD95 Per Fold and Normalized Surface Dice (NSD) for the Baseline Models and the Proposed Models.
Figure 2.
Comparison of HD95 Per Fold and Normalized Surface Dice (NSD) for the Baseline Models and the Proposed Models.
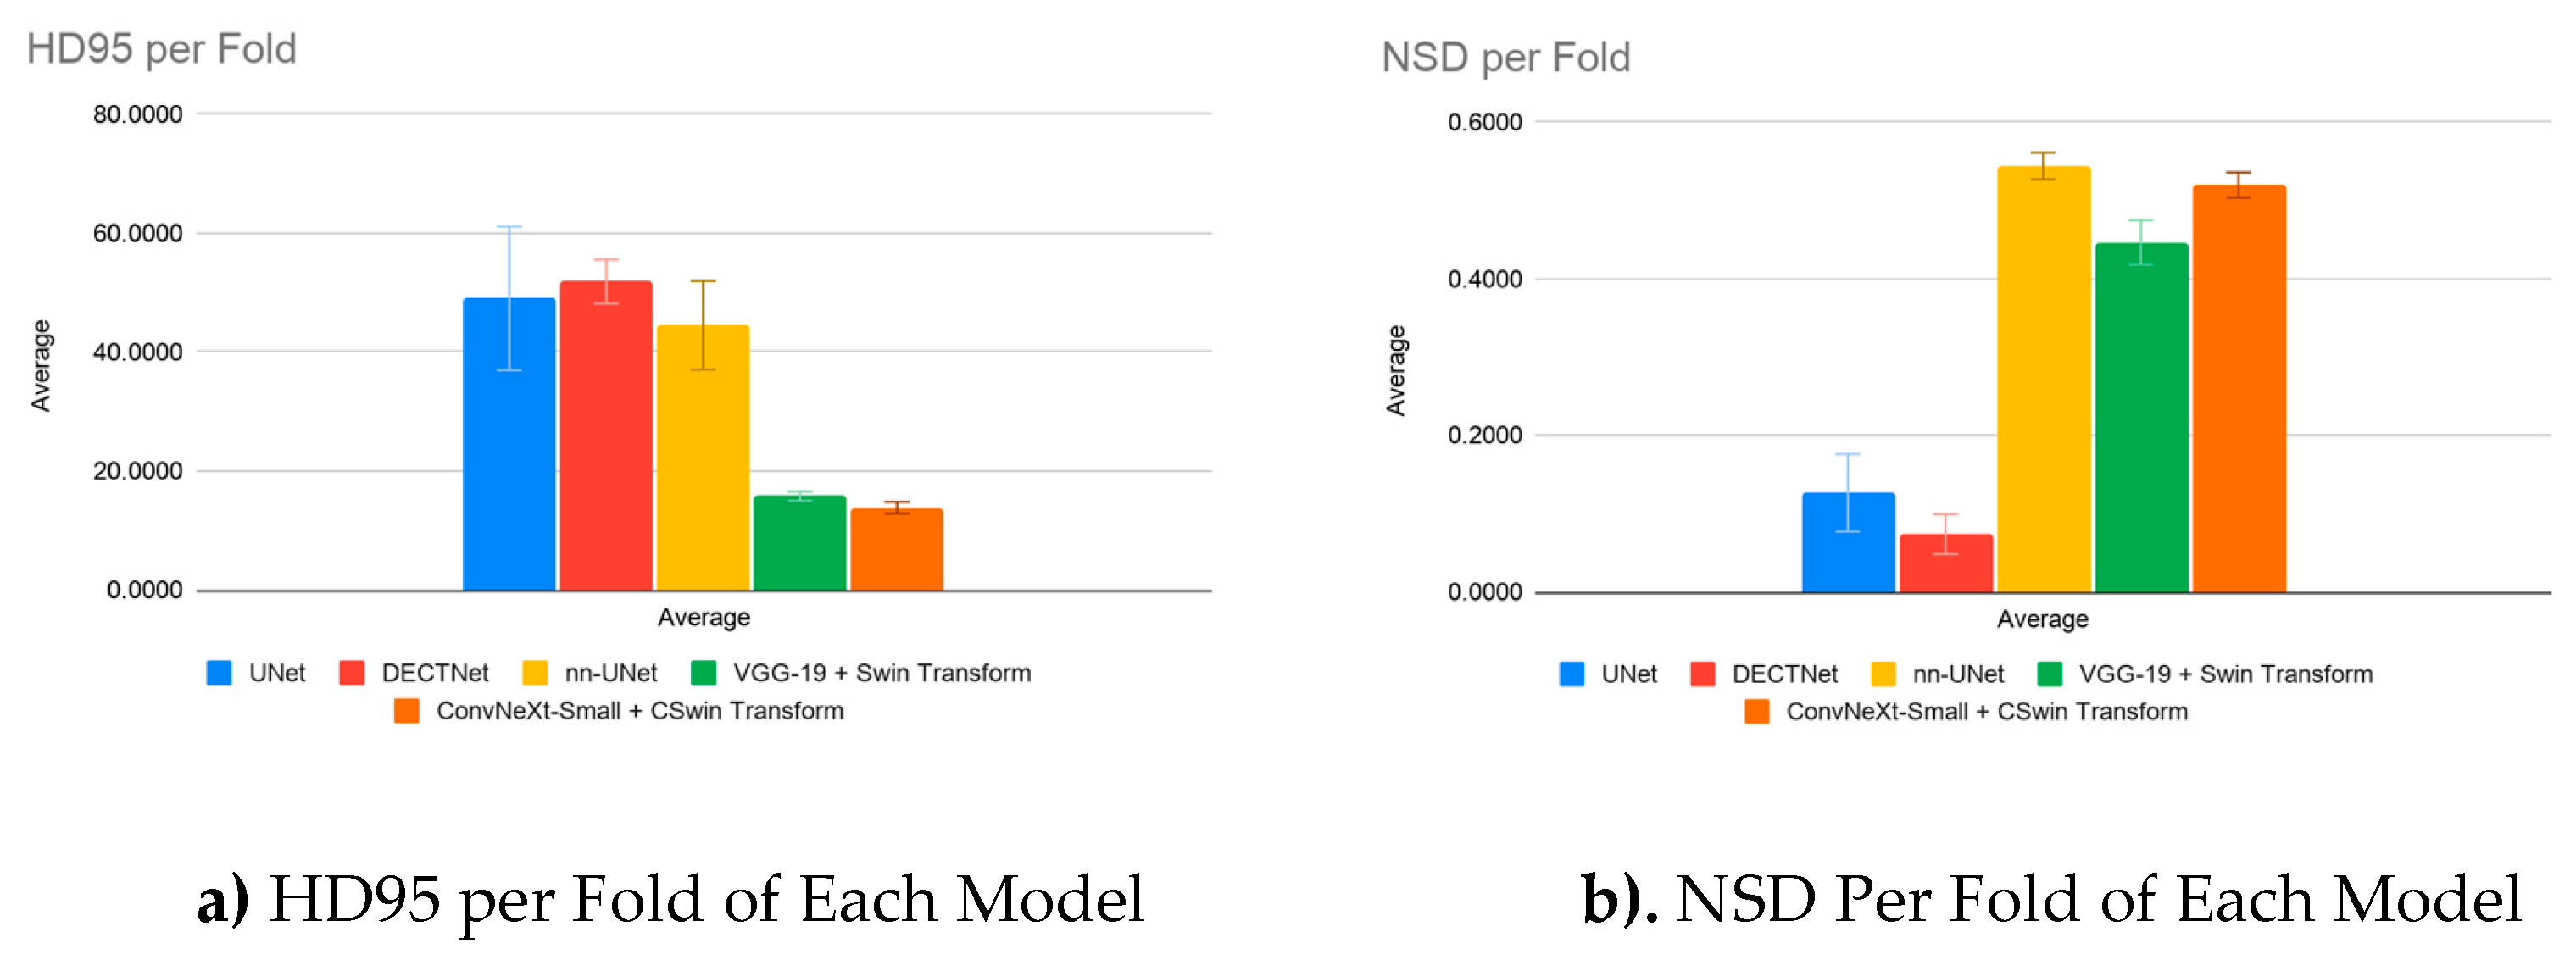
Table 2.
Segmentation Performance Metrics Implemented on Stratified 3-Fold Cross-Validation.
| Accuracy Per Fold | Sensitivity Per Fold | |||||||
|---|---|---|---|---|---|---|---|---|
| Settings | Fold 1 | Fold 2 | Fold 3 | Average | Fold 1 | Fold 2 | Fold 3 | Average |
| UNet | 0.9958 | 0.9954 | 0.9900 | 0.9937+0.003 | 0.9762 | 0.9749 | 0.9836 | 0.9782+0.005 |
| DECTNet | 0.9978 | 0.9967 | 0.9958 | 0.9966+0.001 | 0.9365 | 0.9439 | 0.9406 | 0.9403+0.004 |
| nn-UNet | 0.9991 | 0.9991 | 0.9992 | 0.9991+0 | 0.7352 | 0.7413 | 0.7512 | 0.7426+0.008 |
| VGG-19+Swin | 0.9986 | 0.9985 | 0.9988 | 0.9986+0 | 0.9600 | 0.9563 | 0.9576 | 0.958+0.002 |
| ConvNeXT+CSwin | 0.9988 | 0.9987 | 0.9990 | 0.9988+0 | 0.9451 | 0.9479 | 0.9523 | 0.9484+0.004 |
Table 4.
Paired t-test with BH-FDR Corrections for Dice and IoU Results.
| a) Dice | b) IoU | |||||||
|---|---|---|---|---|---|---|---|---|
| Model | ConvNeXT Small | VGG-19 | nn-UNet | DECTNet | ConvNeXT Small | VGG-19 | nn-UNet | DECTNet |
| UNet | 0.035 | 0.036 | 0.267 | 0.120 | 0.029 | 0.029 | 0.804 | 0.029 |
| DECTNet | 0.005 | 0.009 | 0.375 | 0.004 | 0.005 | 0.029 | ||
| nn-UNet | 0.016 | 0.016 | 0.005 | 0.005 | ||||
| VGG-19+Swin | 0.171 | 0.143 | ||||||
Table 5.
Paired t-test with BH-FDR Corrections for Accuracy and Sensitivity Results.
| a) Accuracy | b) Sensitivity | |||||||
|---|---|---|---|---|---|---|---|---|
| Model | ConvNeXT Small | VGG-19 | nn-UNet | DECTNet | ConvNeXT Small | VGG-19 | nn-UNet | DECTNet |
| UNet | 0.143 | 0.143 | 0.143 | 0.149 | 0.029 | 0.029 | 0.001 | 0.015 |
| DECTNet | 0.143 | 0.143 | 0.143 | 0.076 | 0.040 | 0.002 | ||
| nn-UNet | 0.117 | 0.065 | 0.001 | 0.002 | ||||
| VGG-19+Swin | 0.000 | 0.078 | ||||||
Table 6.
Paired t-test with BH-FDR Corrections for Precision and F1 Score Results.
| a) Precision | b) F1 Score | |||||||
|---|---|---|---|---|---|---|---|---|
| Model | ConvNeXT Small | VGG-19 | nn-UNet | DECTNet | ConvNeXT Small | VGG-19 | nn-UNet | DECTNet |
| UNet | 0.038 | 0.038 | 0.162 | 0.081 | 0.038 | 0.038 | 0.278 | 0.109 |
| DECTNet | 0.005 | 0.019 | 0.663 | 0.004 | 0.009 | 0.184 | ||
| nn-UNet | 0.038 | 0.038 | 0.015 | 0.015 | ||||
| VGG-19+Swin | 0.110 | 0.184 | ||||||
Table 7.
Paired t-test with BH-FDR Corrections for HD95 andNSD Results.
| a) HD95 | b) NSD | |||||||
|---|---|---|---|---|---|---|---|---|
| Model | ConvNeXT Small | VGG-19 | nn-UNet | DECTNet | ConvNeXT Small | VGG-19 | nn-UNet | DECTNet |
| UNet | 0.072 | 0.077 | 0.709 | 0.267 | 0.029 | 0.038 | 0.038 | 0.081 |
| DECTNet | 0.060 | 0.070 | 0.442 | 0.056 | 0.093 | 0.056 | ||
| nn-UNet | 0.060 | 0.060 | 0.326 | 0.056 | ||||
| VGG-19+Swin | 0.155 | 0.056 | ||||||
Disclaimer/Publisher’s Note: The statements, opinions and data contained in all publications are solely those of the individual author(s) and contributor(s) and not of MDPI and/or the editor(s). MDPI and/or the editor(s) disclaim responsibility for any injury to people or property resulting from any ideas, methods, instructions or products referred to in the content. |
© 2026 by the authors. Licensee MDPI, Basel, Switzerland. This article is an open access article distributed under the terms and conditions of the Creative Commons Attribution (CC BY) license (http://creativecommons.org/licenses/by/4.0/).
Copyright: This open access article is published under a Creative Commons CC BY 4.0 license, which permit the free download, distribution, and reuse, provided that the author and preprint are cited in any reuse.


