

Submitted:
08 July 2026
Posted:
13 July 2026
You are already at the latest version
Abstract
The U.S. Medicare GLP-1 Bridge program and existing Part D pathways are expanding access to tirzepatide therapy for older adults, including Zepbound through the Bridge for weight management and Mounjaro through Part D coverage for type 2 diabetes. This necessitates identification of clinical vulnerabilities in geriatric patients that may emerge during pharmacologic weight loss. Here we evaluated incident malnutrition, protein-energy malnutrition (PEM), appetite suppression, dehydration, and sarcopenia in the context of tirzepatide-associated weight loss among adults aged 65 years or older, and we quantified associated mortality, intensive care unit (ICU) admission, and hospitalization relative to comparator cohorts of patients who were prescribed other antidiabetic medications (metformin, DPP4 or SGLT2 inhibitors) or underwent bariatric surgery. Incident frailty-related phenotypes rose with larger achieved weight loss. Specifically, anorexia increased from 2.9% (at ≤5% weight loss) to 10.2% (at 30-40%); dehydration from 1.8% to 4.8%; malnutrition from 0.8% to 3.1%; and PEM from 0.5% to 2.9%. Median tirzepatide treatment duration increased from 1.2 months at ≤5% weight loss to 13.2 months at 30-40%, whereas duration was largely invariant by baseline BMI from <30 to >40. The development of frailty phenotypes after tirzepatide initiation was associated with increased rates of mortality (RR 25, 95% CI 18-35), ICU admission (RR 20, 95% CI 16-25), and hospitalization (RR 11, 95% CI 9.8-12) relative to tirzepatide-treated patients who did not develop malnutrition. Baseline features enriched among patients who developed frailty phenotypes after tirzepatide initiation were older age, advanced diabetes, pre-existing MAFLD/MASH, and cardiorenal comorbidities. Physician-reviewed cause-of-death among decedents with incident frailty phenotypes after tirzepatide initiation showed respiratory failure, septic shock, advanced malignancy, and multiorgan failure as leading causes of death. Overall, in this observational study of Medicare-age-eligible adults, incident frailty phenotyping during tirzepatide-associated weight loss identified vulnerable subgroups with baseline cardiometabolic burden, highlighting the need for comprehensive clinical decision support and multimodal patient monitoring with increasing weight-loss.
Keywords:
tirzepatide
; fraility
; weight loss
Introduction
Potent incretin therapy has changed the clinical landscape of weight loss. Tirzepatide, a dual glucose-dependent insulinotropic polypeptide and glucagon-like peptide-1 receptor agonist, produces body-weight reductions that can surpass 20%, with substantial effects on glycemia and greater weight reduction than semaglutide in head-to-head studies1–4. The therapeutic advantages of these agents are clear even in older adults but the unresolved clinical question is when does large intended weight loss begin to overlap with reduced intake, dehydration, protein energy malnutrition, sarcopenia, and osteoporosis.
This question is especially relevant for adults aged ≥65 years. Malnutrition in older adults is not defined simply by low body mass index; contemporary diagnostic frameworks integrate weight loss, low BMI, reduced muscle mass, reduced intake or assimilation, and inflammation or disease burden5,6. Sarcopenia is similarly recognized as a muscle disease of aging, characterized by impaired muscle strength, muscle quantity or quality, and physical performance7. Geriatric nutrition guidelines emphasize screening for malnutrition and dehydration, and older adults often require higher protein intake to preserve lean mass and function during illness or weight reduction8,9. Dehydration and frailty are common, clinically consequential geriatric syndromes that may amplify vulnerability to adverse outcomes during periods of acute illness and substantial weight loss10–12.
Tirzepatide creates a specific clinical ambiguity. Appetite suppression and gastrointestinal adverse events are expected pharmacologic effects, and U.S. prescribing information describes risks of volume depletion and acute kidney injury in the setting of nausea, vomiting, diarrhea, or reduced intake1. At the same time, intentional weight loss can be beneficial, particularly when accompanied by metabolic improvement, preserved strength, and maintained protein intake. In older adults, however, weight reduction without attention to resistance exercise, protein-energy intake, hydration, and muscle preservation may worsen or unmask sarcopenia and frailty13,14. Body-composition analyses of tirzepatide-associated weight reduction also show that lean mass declines along with fat mass, underscoring that the quality of weight loss matters clinically, not only the magnitude15.
Randomized trials establish efficacy under protocolized conditions, but routine care includes patients with multimorbidity, chronic kidney disease, heart failure, malignancy, frailty, variable nutritional access, and less structured follow-up. Observational electronic health record studies cannot establish that tirzepatide causes malnutrition, dehydration, sarcopenia, or death; however, they can identify post-initiation phenotypes that should function as clinical decision-support triggers16–20. We therefore examined a large federated electronic health record (EHR) cohort to evaluate whether incident malnutrition, protein energy malnutrition (PEM), appetite suppression or anorexia, dehydration, and sarcopenia emerge during high-magnitude tirzepatide-associated weight loss, particularly among adults aged ≥65 years, and whether these phenotypes identify subgroups with increased mortality, ICU admission, and hospitalization (Figure 1).
Methods
Study design, data source, and cohort definition
We conducted a retrospective study using de-identified electronic health record data accessed through the nference Federated network, spanning more than 29 million patients, following new-user (incident-user) pharmacoepidemiologic design principles for observational routinely-collected health data. New-user cohorts were identified from January 1, 2022 forward and were restricted to patients aged ≥65 years at the index date. A -365-day to +18-month washout window around the index date was applied to the drug arms to enforce incident, mutually exclusive cohorts: patients were required to have no prescription of the opposing arm's study medications during this window (the comparator antidiabetics for the tirzepatide arm; tirzepatide or semaglutide for the antidiabetic arm). The case cohort comprised tirzepatide initiators while the comparator cohort comprised initiators of other antidiabetic medications that included either metformin, dipeptidyl peptidase-4 (DPP4) inhibitors (sitagliptin, saxagliptin, linagliptin, alogliptin), or sodium-glucose cotransporter-2 (SGLT2) inhibitors (empagliflozin, dapagliflozin, canagliflozin). Patients with semaglutide use during the washout window were excluded from both arms. Patients meeting eligibility for both the tirzepatide and antidiabetic cohorts were excluded from both arms, yielding non-overlapping cohorts. The bariatric-surgery comparator cohort was defined by the first bariatric-surgery event under the same age ≥65 criterion, and excluded any patient with a GLP-1 receptor agonist prescription at any time (lifetime exclusion). Exclusion rules differed by cohort: GLP-1 exposure was a lifetime exclusion for the bariatric arm but only a washout-window exclusion for the drug arms; prior bariatric surgery was not an exclusion for either drug arm; and prior antidiabetic use excluded patients from the tirzepatide arm (via washout) but was not an exclusion for the bariatric arm. This yielded 352,502 tirzepatide initiators, 651,720 antidiabetic comparator initiators, and 33,785 bariatric-surgery patients.
Propensity matching and weight-loss stratification
Propensity scores were estimated via logistic regression on age, sex, race, baseline body mass index, and baseline type 2 diabetes status, with 1:1 greedy nearest-neighbor matching within an absolute caliper of 0.2 on the propensity-score scale. Baseline was defined as the period on or before the index date: baseline body weight, body mass index, and HbA1c were each taken as the most recent qualifying measurement within the 365 days before index, whereas baseline comorbidities, malignancies, and type 2 diabetes status were defined as any corresponding ICD-9/ICD-10 diagnosis recorded at any time on or before index; observed follow-up was defined as the interval from index to the last recorded clinical event. Achieved weight loss was defined as (baseline weight − nadir weight in the one year post index)/baseline weight × 100, with baseline taken as the closest weight measurement prior to index. Tirzepatide and bariatric-surgery patients were stratified by achieved weight loss into five disjoint bands (≤5%, 5–10%, 10–20%, 20–30%, and 30–40%), and baseline BMI strata (<25, 25–30, 30–35, 35–40, and ≥40 kg/m²) were applied across all arms.
Phenotype ascertainment, incident-event, and exposure-intensity analysis
Phenotypes were ascertained from both structured diagnosis codes and AI-curated clinical notes using a validated large language model extraction pipeline, consistent with prior LLM-based clinical text extraction approaches21–24. For the incident-event analysis, each phenotype was evaluated only among patients with no occurrence of that phenotype on or before index (the at-risk population); within each weight-loss band, at-risk tirzepatide patients were re-matched to at-risk comparator patients (and, separately, to at-risk bariatric-surgery patients), and new-onset events were counted over the window from +7 to +548 days after index (approximately 18 months). For each phenotype and band, the incidence proportion in tirzepatide users was divided by that in matched comparators to yield a rate ratio with an accompanying chi-square test; counts were pooled across sites by summing the corresponding 2×2 tables, and Benjamini-Hochberg false-discovery-rate correction was applied across phenotypes.
To further characterize incident phenotype burden by cumulative tirzepatide exposure, two exposure metrics were derived within the 18-month observation window. Maximum achieved dose was defined as the highest recorded tirzepatide dose during the window and dichotomized as low dose (<10 mg) versus high dose (≥10 mg); the incidence proportion of each incident phenotype was compared between the two dose groups by chi-square test. Prescription intensity was defined as the total number of tirzepatide prescriptions filled within the window, categorized as 1, 2–3, 4–6, or ≥7 prescriptions, and the trend in incidence proportion across ordered categories was evaluated using the Cochran-Armitage test for trend. Both exposure-intensity analyses were restricted to the at-risk population for each phenotype and used the same incident-event definition described above.
Treatment duration and phenotype timing analysis
Treatment duration was defined as the interval from the first to the last recorded tirzepatide prescription, computed as (last − first + 1 month) so that a single recorded prescription is counted as one month of treatment, and was summarized as median (interquartile range, IQR) and compared across baseline BMI strata and achieved weight-loss strata. To assess sensitivity to adherence definition, this duration analysis was repeated under two additional, progressively stricter cohort restrictions applied to the same tirzepatide initiators: patients with ≥2 prescriptions within the 18-month observation window, and patients with ≥3 prescriptions with no gap exceeding 90 days between consecutive fills. For each incident nutrition or depletion phenotype (loss of appetite, dehydration, malnutrition, protein-energy malnutrition, sarcopenia, and cachexia), time to first incident event was defined as the interval from the first prescription date (tirzepatide or comparator antidiabetic) or bariatric-surgery date to the date of first phenotype documentation, restricted to the at-risk population as defined above, and summarized as median (IQR) within each treatment arm (tirzepatide, antidiabetic comparator, bariatric surgery). To evaluate the temporal relationship between phenotype onset and ongoing treatment, time to first incident phenotype was additionally indexed to the date of the last recorded tirzepatide prescription, with negative values indicating documentation prior to the last prescription (i.e., during treatment) and positive values indicating documentation after treatment discontinuation; median and IQR were reported on this re-indexed timescale. Treatment duration was compared between patients who did versus did not develop each incident phenotype using the Welch’s t-test, with duration summarized as median values in each group.
Mortality, hospitalization, and ICU admission analysis
Death was ascertained from recorded death dates and counted as any death on or after index; hospitalization and ICU admission were ascertained from inpatient-admission and intensive-care-admission events, respectively, and counted as any such event on or after index (at one site, intermediate-care units were excluded from the ICU definition). Within each treatment arm (tirzepatide, antidiabetic comparator, and bariatric surgery), the primary analysis compared the proportion of patients experiencing each outcome between those who developed a given incident phenotype (malnutrition, protein-energy malnutrition, loss of appetite, dehydration, sarcopenia, cachexia) and at-risk patients who did not, summarized as a rate ratio with a chi-square test and displayed as forest plots; for the comparator and bariatric arms this was performed within a 1:1 propensity-score-matched cohort relative to tirzepatide. These comparisons were repeated within strata of achieved weight loss and of baseline BMI. Because incident phenotypes were, by design, ascertained after index and outcomes were counted over the entire observed follow-up, these within-arm developer-versus-non-developer comparisons are descriptive and subject to immortal-time and reverse-causation bias, and were interpreted as such rather than as causal effects. A physician review of death-record narratives categorized the proximate causes of death among tirzepatide decedents with incident depletion phenotypes.
Statistical analysis
Categorical outcomes are summarized as rate ratios (relative risks) with 95% confidence intervals derived from the log-rate-ratio (Katz) standard error, together with two-sided chi-square p-values; within-arm event proportions are additionally reported with Wilson 95% confidence intervals. Continuous variables are summarized as mean (SD) and compared using the standardized mean difference (SMD), with |SMD| ≥ 0.1 taken to indicate meaningful between-group imbalance; binary variables are summarized as n (%). Multiplicity was addressed by Benjamini-Hochberg false-discovery-rate correction, with the outcome analyses reported at a stringent FDR-adjusted significance threshold of p<0.001. To comply with data-use privacy requirements, any cell with fewer than 11 patients or events is reported as "<11," and the corresponding estimate should be regarded as exploratory.
Statistical analysis plan for study advancement
The analytic approach followed established pharmacoepidemiologic and biostatistical convention throughout: the incident-user, active-comparator cohort design is the standard real-world-evidence paradigm for drug-effect estimation using routinely-collected EHR data and was reported per the STROBE and RECORD frameworks16–19, with restriction to other antidiabetic initiators serving as the canonical active-comparator control for confounding by indication25. Propensity scores estimated by logistic regression with 1:1 greedy nearest-neighbor matching within a 0.2-logit caliper, and balance assessed by standardized mean differences, follow established causal-inference methodology26–30. Phenotypes and measurements were ascertained from structured codes and from clinical notes using a validated large language model extraction pipeline, consistent with evidence that adapted LLMs extract clinical phenotypes from notes at expert-comparable accuracy31,32. Incident events were counted only among at-risk, phenotype-free patients, and rate ratios with chi-square tests, tests for trend across ordered weight-loss bands, and time-to-event mortality analyses used standard estimators33–35. Immortal-time and reverse-causation concerns were addressed through incident-event restriction, baseline exclusions, and minimum exposure-to-event latency requirements, mirroring recognized corrections for time-related bias36–38, while the age-stratified Medicare-eligible subgroup followed standard stratified comparative-effectiveness practice39. Continuous biochemical change was compared by Welch's unequal-variance t-test, and multiplicity across phenotype and analyte families was controlled by the Benjamini–Hochberg false-discovery-rate procedure40–42.
Institutional Review Board Statement, Informed Consent Statement, De-identification and HIPAA compliance certification
Prior to analysis, all EHR data were de-identified under an expert determination consistent with the Health Insurance Portability and Accountability Act (HIPAA) Privacy Rule (45 CFR §164.514(b)(1)). The de-identification methodology43,44 employed a multi-layered transformation approach to both structured and unstructured data fields. In structured data, direct identifiers including patient names and precise geographic locations were excluded entirely, while indirect identifiers underwent specific transformations: patient identifiers, medical record numbers, and accession numbers were replaced with one-way cryptographic hashes using confidential salts to preserve linkage across patient encounters; all dates were shifted backward by patient-specific random offsets (1 to 31 days) to preserve temporal relationships while obscuring exact event timing; ZIP codes were truncated to two-digit state-level resolution; and continuous variables including age, height, weight, and body mass index were thresholded to prevent identification of extreme values (for example, ages 89 years or older transformed to '89+' and BMI over 40 transformed to '40+'). In clinical text, an ensemble de-identification system that combines attention-based deep learning with rule-based methods achieved an estimated >99% recall for personally identifiable information (PII) detection, with detected identifiers replaced by plausible fictional surrogates. Institutional Review Board Statement and Informed Consent Statement are not applicable.
Data Harmonization
To address heterogeneity in EHR data, we harmonized clinical variables including medications, anthropometric measurements, and diagnoses to standardized concepts. For medications, we first constructed a standardized drug concept database combining the nference knowledge graph with RxNorm hierarchies to capture ingredient, brand, and dose-specific information. Medication records were matched using a hierarchical approach prioritizing RxNorm codes when available, followed by ingredient-level matching, and finally natural language processing and pattern matching on free-text medication orders when structured codes were absent. For anthropometric measurements (height, weight, body mass index), we created a unified vocabulary from SNOMED and LOINC and matched EHR measurement descriptions using standardized text matching algorithms with abbreviation expansion and synonym resolution; ambiguous mappings were resolved using OpenAI GPT-4o with summary statistics as context, followed by manual verification. For diagnoses, we developed a hierarchical disease concept database from the knowledge graph and matched EHR diagnosis records by identifying the most specific common child concept in the hierarchy.
Results
Baseline characterization of Medicare age-eligible tirzepatide and matched antidiabetic comparator cohorts
Among 370,110 patients who initiated tirzepatide during the study period, 18,693 were at least 65 years old at the time of their first prescription and met the other specified inclusion criteria (see Methods). There were 111,871 eligible patients who initiated a non-GLP-1 receptor agonist antidiabetic comparator medication (DPP4 inhibitors, SGLT2 inhibitors, metformin) during the same period. The baseline characteristics of these populations is shown in Table 1. The tirzepatide cohort was significantly younger (mean age 70.9 years vs. 74.3 years, SMD = 0.60), more female (64.7% vs. 45.2%), and less likely to be Black (7.3% vs. 11.9%). Multiple baseline (pre-treatment) measurements and comorbidities also differed significantly between the groups. For example, on average, patients in the tirzepatide cohort had a higher BMI (32.7 vs. 29.1 kg/m2, SMD = 0.746), lower hemoglobin A1c (6.2% vs. 6.7%, SMD = 0.36), higher rates of diagnosed hyperlipidemia (58.5% vs. 49.1%, SMD = 0.19) and metabolic dysfunction-associated steatotic liver disease (MASLD, 5.7% vs. 2.2%, SMD 0.18), and lower rates of diagnosed type 2 diabetes (23.3% vs. 32.5%, SMD = 0.21), heart failure (6.9% vs. 28.0%, SMD = 0.58) and atherosclerotic cardiovascular disease (24.5% vs. 35.7%, SMD = 0.25).
SMD, standardized mean difference; BMI, body mass index; HbA1c, glycated hemoglobin; ASCVD, atherosclerotic cardiovascular disease; NAFLD/MASH, nonalcoholic fatty liver disease / metabolic dysfunction-associated steatohepatitis; GERD, gastroesophageal reflux disease; PCOS, polycystic ovary syndrome.
Given the heightened susceptibility of older adults to malnutrition, dehydration, and sarcopenia, we performed a Medicare-age-eligible subgroup analysis., 18,693 tirzepatide initiators aged 65 years or older were matched 1:1 to 18,693 antidiabetic comparator initiators (Table 1, Figure 1). Matching substantially balanced age, sex, race, ethnicity, baseline BMI, baseline body weight, and type 2 diabetes status; after matching, mean age was 70.9 years in both groups, mean BMI was 32.7 in the tirzepatide group and 32.4 in the comparator group, and type 2 diabetes was present in 23.3% and 27.7%, respectively. Several residual clinical differences remained, including longer follow-up in the comparator group (17.4 vs 11.3 months), higher HbA1c in the comparator group (6.6% vs 6.2%), higher heart failure prevalence in comparators (24.7% vs 6.9%), and higher obesity and obstructive sleep apnea prevalence among tirzepatide users (51.5% vs 30.4%, and 30.7% vs 17.6%, respectively).
Within the tirzepatide-treated cohort, baseline characteristics also varied across achieved weight-loss strata (Table 2). Age was similar across strata, ranging from 70.2 to 71.0 years, whereas female sex increased from 64.3% among patients with ≤5% weight loss to 79.1% among those with 30-40% weight loss. Baseline BMI increased from 32.4 to 35.1 across the same strata, and follow-up duration increased from 11.3 months to 24.6 months, indicating that greater observed weight loss was also associated with longer observable treatment and follow-up time. Several baseline conditions were more frequent in higher weight-loss strata, including type 2 diabetes (22.3% at ≤5% vs 36.0% at 30-40%), chronic kidney disease (13.9% vs 20.3%), depression (12.6% vs 20.3%), and anxiety (15.7% vs 21.5%). Therefore, subsequent weight-loss-stratified phenotype analyses were interpreted as descriptive within-arm gradients rather than as isolated effects of weight loss independent of baseline vulnerability and duration of observation.
SMD, standardized mean difference; BMI, body mass index; HbA1c, glycated hemoglobin; ASCVD, atherosclerotic cardiovascular disease; NAFLD/MASH, nonalcoholic fatty liver disease / metabolic dysfunction-associated steatohepatitis; GERD, gastroesophageal reflux disease; PCOS, polycystic ovary syndrome
Nutritional, hydration, and depletion phenotype incidence proportions rise with increased weight-loss after tirzepatide initiation
We first analyzed the incidence of malnutrition, protein-energy malnutrition (PEM), appetite loss, dehydration, and sarcopenia among 13,385 tirzepatide-treated adults aged ≥65 years with available pre- and post-index weight measurements, stratified by achieved weight loss (≤5%, 5–10%, 10–20%, 20–30%, and 30–40%). These weight-loss strata were not matched to one another and differed in baseline characteristics, as described above (Table 2). To contextualize these incidence gradients, we also examined baseline characteristics among tirzepatide-treated patients who subsequently developed each incident phenotype (Table 3). Across phenotypes, patients who later developed appetite loss, dehydration, malnutrition, PEM, or sarcopenia were generally older and had greater baseline diabetes and cardiorenal burden, including higher HbA1c, more type 2 diabetes, diabetes complications, chronic kidney disease, acute kidney injury, and NAFLD/MASH, particularly among those who later developed malnutrition or PEM (Table 3).
BMI, body mass index; HbA1c, glycated hemoglobin; ASCVD, atherosclerotic cardiovascular disease; NAFLD/MASH, nonalcoholic fatty liver disease / metabolic dysfunction-associated steatohepatitis; GERD, gastroesophageal reflux disease; PCOS, polycystic ovary syndrome.
The incidence proportion of several nutrition, appetite, and hydration phenotypes over the 18-month period following treatment initiation was increased in patients with higher weight loss (Figure 2A). Documentation of appetite loss in clinical notes or diagnosis codes was 3.0% among patients with ≤5% weight loss compared to 7.8% at 20-30% (Chi-Sq P<0.001) and 10.2% at 30-40% (P<0.001) weight loss. Dehydration was also documented more frequently in patients with higher magnitude weight loss, increasing from 1.9% in patients with ≤5% weight loss to 4.8% (P<0.001) and 5.7% (P<0.001) in those with at 20-30% and 30-40% weight loss, respectively. Several malnutrition-related phenotypes also showed similar patterns, including general documentation of malnutrition in clinical notes (0.8% at ≤5% weight loss, 2.7% at 10-20% [P<0.001] and 20-30% weight loss [P<0.001], and 3.4% at 30-40% weight loss [P<0.001]) and specific documentation of PEM (0.5% at ≤5%, 1.9% at 10-20% [P<0.001], 2.8% at 20-30% [P<0.001], and 3.4% at 30-40% weight loss [P<0.001]). Documentation of sarcopenia was sparse in clinical notes or diagnosis codes across all of the weight loss categories but was significantly more common among patients with ≥20% weight loss compared to those with ≤5% weight loss (Figure 2A).
Dose and treatment intensity both appeared to matter, indicating that the weight-loss gradients were not explained solely by achieved weight loss (Figure 2B, 2C). Patients reaching a maximum tirzepatide dose ≥10 mg had significantly higher incidence of anorexia than those remaining at <10 mg (6.7% vs 5.8%; P=0.008), malnutrition (1.7% vs 1.3%; P=0.028), and sarcopenia (0.4% vs 0.2%; P=0.015), whereas dehydration and PEM did not differ significantly by maximum dose (Figure 2B). The number of tirzepatide prescriptions showed a stronger graded association with incident phenotypes: loss of appetite increased from 3.7% after 1 prescription to 12.3% after ≥7 prescriptions, dehydration from 2.3% to 5.6%, malnutrition from 1.1% to 1.9%, and PEM from 0.7% to 1.0%, with significant trend tests for all five phenotypes, including sarcopenia (Cochran-Armitage P≤0.001; Figure 2C). These exposure-intensity gradients should be interpreted alongside baseline differences across weight-loss strata: patients achieving 30% to 40% weight loss had higher baseline prevalence of type 2 diabetes, diabetes complications, chronic kidney disease, acute kidney injury, NAFLD/MASH, depression, anxiety, and hypothyroidism than those achieving ≤5% weight loss (Table 2), indicating that greater achieved weight loss occurred in a subgroup with greater baseline clinical complexity.
Baseline enrichments of patients who develop nutritional and body composition phenotypes after tirzepatide, other antidiabetic medications, or bariatric surgery
We next assessed whether baseline demographic and clinical characteristics were associated with the development of these nutritional and body composition phenotypes after tirzepatide initiation. Patients who developed appetite loss, dehydration, malnutrition, PEM, sarcopenia, or cachexia tended to be older and have moderately higher HbA1c than those who did not develop these phenotypes (Figure 3). Higher baseline rates of type 2 diabetes and associated complications, chronic kidney disease, and acute kidney injury were associated with higher risk of developing malnutrition or PEM (Figure 3). To assess whether these enrichments were specific to tirzepatide, we also performed similar baseline enrichment analyses among the matched cohort of patients taking non-GLP-1RA antidiabetic medications and a separate cohort of patients who underwent bariatric surgery. In the antidiabetic medication comparator cohort, higher age was again associated with increased risk of developing the nutritional and body composition phenotypes, but baseline HbA1c levels were not strongly associated with the incidence of these phenotypes. Instead, baseline cardiovascular conditions (including ASCVD, heart failure, and atrial fibrillation) and renal disease (both CKD and acute kidney injury) were strongly associated (Figure S1). In the bariatric surgery cohort, lower baseline weight and BMI were the most strongly associated features with subsequent phenotype development, particularly for sarcopenia and cachexia (Figure S2). The corresponding patient-level baseline characteristics by incident phenotype in the tirzepatide cohort are provided in Table 3. Among patients who developed these incident phenotypes, those who subsequently died were generally older and had greater baseline diabetes burden, diabetes complications, chronic kidney disease, acute kidney injury, heart failure, and ASCVD than survivors, particularly among patients with malnutrition and protein-energy malnutrition (Table 4).
SMD, standardized mean difference; BMI, body mass index; HbA1c, glycated hemoglobin; ASCVD, atherosclerotic cardiovascular disease; NAFLD/MASH, nonalcoholic fatty liver disease / metabolic dysfunction-associated steatohepatitis; GERD, gastroesophageal reflux disease; PCOS, polycystic ovary syndrome.
Baseline associations with disease severity outcomes (mortality, hospitalization, and ICU admission) also differed between the tirzepatide, matched antidiabetic comparator, and bariatric surgery cohorts. Among tirzepatide users who developed a nutritional or body composition phenotype, mortality was enriched in older patients, patients with lower BMI, and those with diabetes complications, chronic kidney disease, acute kidney injury, ASCVD, and heart failure (Figure 3). In the matched antidiabetic comparator cohort, there were few baseline clinical characteristics associated with mortality across all of these assessed phenotypes (Figure S1). In bariatric-surgery patients, mortality and hospitalization were again linked to lower BMI and weight, particularly for sarcopenia and cachexia, while ICU and hospitalization were more closely associated with baseline cardiovascular risk factors including ASCVD, heart failure, and atrial fibrillation (Figure S2).
Among tirzepatide users who developed incident frailty phenotypes, subsequent ICU admission and hospitalization were associated with older age, higher HbA1c, diabetes complications, chronic kidney disease, acute kidney injury, and heart failure, particularly among patients with loss of appetite, dehydration, malnutrition, and PEM (Tables S1 and S2). By contrast, bariatric-surgery phenotype developers showed a lower-reserve profile, with lower baseline BMI and body weight especially among patients who developed sarcopenia or cachexia (Table S3), whereas antidiabetic-comparator phenotype developers were older and had lower BMI with greater baseline ASCVD, heart failure, atrial fibrillation, chronic kidney disease, acute kidney injury, and selected gastrointestinal or cancer diagnoses (Table S9).
Nutrition and depletion phenotypes often emerge around the end of tirzepatide therapy and are associated with longer treatment duration
Treatment duration increased steeply across achieved weight-loss bands but was comparatively flat across baseline BMI strata (Figure 4A). In the primary tirzepatide cohort (≥1 prescription), median treatment duration rose from 1.2 months among patients with ≤5% weight loss to 13.2 months among those with 30–40% weight loss, whereas across baseline BMI bands it remained constant at 1.2 months—reflecting that the median single-prescription initiator accrued little recorded duration regardless of BMI, and that meaningful duration tracked with achieved weight loss. This weight-loss gradient was robust to progressively stricter adherence definitions: under a ≥2-prescription requirement, median duration rose from 5.0 to 15.3 months across the same weight-loss bands, and under a ≥3-prescription requirement (consecutive prescriptions ≤90 days apart) from 5.6 to 15.7 months. Both stricter definitions also revealed a modest positive BMI gradient (5.8 to 6.7 months and 6.8 to 7.9 months across ascending BMI bands, respectively).
The first recorded malnutrition, appetite-suppression, hydration, sarcopenia, or cachexia phenotype generally occurred within the first year after initiation of tirzepatide or other antidiabetic medications or after bariatric surgery (Figure 4B). Among tirzepatide initiators, the median time from first prescription to first incident phenotype was 4.7 months for loss of appetite (n=1,297), 4.9 months for dehydration (n=805), 5.9 months for PEM (n=255), 6.3 months for malnutrition (n=406), 7.5 months for sarcopenia (n=60), and 10.2 months for cachexia (n=15). In the antidiabetic comparator cohort, corresponding median times were generally shorter: 3.7 months for loss of appetite (n=15,057), 4.8 months for dehydration (n=9,671), 3.3 months for PEM (n=7,210), 3.2 months for malnutrition (n=9,311), 4.3 months for sarcopenia (n=1,159), and 4.3 months for cachexia (n=1,269). Bariatric-surgery comparators showed a similar early-onset pattern, with median times of 3.2 months for loss of appetite (n=2,807), 4.0 months for dehydration (n=2,215), 2.7 months for PEM (n=1,493), 2.1 months for malnutrition (n=2,498), 3.8 months for sarcopenia (n=243), and 4.7 months for cachexia (n=339). Thus, incident phenotypes emerged early in all treatment contexts, but the median onset of malnutrition-related phenotypes was later after tirzepatide initiation than after antidiabetic-drug or bariatric-surgery comparators.
When timing was indexed to the last recorded tirzepatide prescription, the median interval to first phenotype documentation was positive for all phenotypes, ranging from 0.9 months for loss of appetite to 3.9 months for cachexia, indicating that these phenotypes were most often first documented shortly after the last recorded prescription; however, the interquartile ranges consistently crossed zero, indicating that a substantial fraction were documented during the treatment interval rather than only after discontinuation (across-phenotype ANOVA P<0.001) (Figure 4C).
Patients who developed incident nutrition or depletion phenotypes generally had longer tirzepatide treatment duration than those who did not, with a median duration of approximately 1.4 months among non-developers across all phenotypes (Figure 4D). Median treatment duration among developers was 3.4 months for loss of appetite (P<0.001), 3.0 months for dehydration (P<0.001), and 2.1 months for malnutrition (P<0.001); the difference was also significant for protein-energy malnutrition (1.7 months; P=0.047), but not for sarcopenia (2.5 months; P=0.115) or cachexia (2.2 months; P=0.513). Together, these findings suggest that greater achieved weight loss and longer treatment exposure jointly mark the clinical window in which nutrition and depletion phenotypes emerge.
Post-treatment initiation incident nutritional and depletion phenotypes are associated with increased mortality, ICU admission, and hospitalization
Incident nutritional and depletion phenotypes were associated with higher post-initiation mortality within the tirzepatide, other antidiabetic medication, and bariatric surgery cohorts (Figure 5, Table 5). In the tirzepatide cohort, mortality RRs were highest for malnutrition (RR, 25; 95% CI, 18 to 35), PEM (RR, 24; 95% CI, 16 to 34), and sarcopenia (RR, 12; 95% CI, 3.9 to 35), followed by loss of appetite (RR, 7.5; 95% CI, 5.0 to 11) and dehydration (RR, 6.2; 95% CI, 3.9 to 9.8) (all FDR-adjusted P<0.001). The bariatric-surgery and antidiabetic comparator cohorts also showed higher mortality among phenotype developers than among non-developers, although the within-cohort risk ratios were generally smaller than those observed in the tirzepatide cohort (Figure 5).
Denominators. Developed phenotype: n = incident developers, N = at-risk cohort (patients without that phenotype at baseline); the at-risk N varies by phenotype because baseline-prevalent cases are excluded. Hospitalizations / ICU admissions / Deaths among developers: n = developers with the event, N = developers. Percentages are n/N. Events occurring on or after treatment initiation are counted. The bariatric-surgery and antidiabetic arms were each 1:1 propensity-score matched to the tirzepatide cohort; the tirzepatide arm is the full 65+ cohort. Cells with fewer than 11 patients are masked as “n<11” to preserve privacy. Within-arm figures are descriptive and are not direct between-arm comparisons.
ICU and hospital admission showed a similar pattern of increased incidence among phenotype developers compared to non-developers across the three cohorts (Table 5). In the tirzepatide cohort, ICU admission RRs were 23 for malnutrition (95% CI, 18 to 29), 19 for PEM (95% CI, 14 to 25), 13 for sarcopenia (95% CI, 5.3 to 34), 7.8 for loss of appetite (95% CI, 5.9 to 10), and 6.6 for dehydration (95% CI, 4.7 to 9.2) (all FDR-adjusted P<0.001) (Figure 6A). Hospitalization RRs were 10 for malnutrition (95% CI, 9.5 to 11), 9.5 for PEM (95% CI, 8.8 to 10), 4.5 for dehydration (95% CI, 3.9 to 5.1), 4.3 for loss of appetite (95% CI, 3.8 to 4.8), and 4.2 for sarcopenia (95% CI, 2.6 to 6.7) (all FDR-adjusted P<0.001) (Figure 6B). As was the case for mortality, the bariatric surgery and antidiabetic medication comparator cohorts showed directionally consistent trends with low magnitude RRs (Figure 6A-B).
Weight loss and baseline BMI-stratified associations between depletion phenotypes and mortality, ICU and hospitalization in Medicare-age-eligible adults
We next assessed the potential interaction between weight loss magnitude, nutritional/depletion phenotype development, and disease severity outcomes. Across almost all weight loss categories, the development of each depletion phenotype after tirzepatide initiation was associated with significantly increased rates of mortality (Figure 7A), ICU admission (Figure 7B), and hospitalization (Figure 7C). The only non-significant, although directionally concordant, signals were for the 30-40% weight loss group, which may at least partially be related to lack of statistical power due to the small sample size. The risk ratios for mortality, ICU admission, and hospitalization were generally highest for malnutrition and protein energy malnutrition, and there was no significant difference in the risk ratios between weight loss strata within each phenotype (Figure 7).
In a similar analysis, we assessed the risk ratios of mortality (Figure 8), ICU admission (Figure 9), and hospitalization (Figure 10) among developers versus non-developers for each depletion phenotype, stratified by baseline BMI (<25, 25-30, 30-35, 35-40, or ≥40 kg/m²). For the tirzepatide cohort, the risk ratios were generally similar across the BMI categories, with all categories showing significantly higher rates of each outcome among phenotype developers. For mortality and ICU admission, there were no significant differences in risk ratios between the various BMI strata for each phenotype. For hospitalization, the risk ratio comparing patients who did versus did not develop malnutrition after tirzepatide initiation was lower in the BMI ≥40 kg/m² (RR 8.0, 95% CI, 6.9 to 9.2) group compared to other groups (for example, in the BMI 30-35 kg/m² group, RR 12.0, 95% CI, 10.0-13.0). Similar trends were seen for the two comparator cohorts (Figure 8, Figure 9 and Figure 10).
Overall, these substratified analyses suggest that neither the magnitude of achieved weight loss that occurs during the development of these depletion phenotypes nor the baseline BMI at time of treatment initiation is strongly associated with the subsequent experience of hospitalization, ICU admission, or death.
Treatment duration, mortality, and cause-of-death patterns by BMI and weight loss in the Medicare-age-eligible tirzepatide cohort
Among Medicare-eligible tirzepatide initiators aged ≥65 years, treatment duration increased with achieved weight loss across baseline BMI strata (Figure 11A). For example, in the BMI 30–35 stratum, median treatment duration rose from 1.3 months at ≤5% weight loss to 2.4 months at 5–10%, 6.2 months at 10–20%, 10.9 months at 20–30%, and 16.0 months at 30–40% weight loss. A similar gradient was observed in the BMI ≥40 stratum, rising from 1.5 months at ≤5% weight loss to 4.9, 7.7, 12.5, and 15.8 months across increasing weight-loss bands. By contrast, within a given weight-loss band, median treatment duration varied less by baseline BMI than by achieved weight loss.
Crude mortality was low among patients with less than 20% achieved weight loss, ranging from 0.4% in patients with baseline BMI 30-35 kg/m2 and ≤5% weight to 3.3% in patients with BMI < 25 kg/m2 and 5-10% weight loss (Figure 11B). At higher weight-loss strata, mortality was concentrated in lower-BMI bands, including BMI <25 with 20-30% weight loss (40.0%; n<11) and BMI 25-30 with 30-40% weight loss (18.2%; n=11). In the 30-40% weight-loss band, the highest mortality rate was seen among patients with baseline BMI 25-30 kg/m2, and lower values were seen in the BMI 35-40 kg/m2 (5.8%; n=52) and BMI ≥40 kg/m2 (1.6%; n=63) categories.
ICU admission showed a related but distinct pattern (Figure 11C). The highest ICU admission proportion occurred among patients with BMI <25 and 10-20% weight loss (12.2%; n=49), followed by BMI 25-30 with 30-40% weight loss (9.1%; n=11). Among higher BMI strata, ICU admission proportions in the 20-30% and 30-40% weight-loss bands generally ranged from 1.6% to 5.8%. Hospitalization was more frequent than ICU admission or death and increased with greater achieved weight loss across several BMI strata (Figure 11D). For example, in the BMI 30-35 kg/m2 group, hospitalization rates were 8.6% in patients with ≤5% weight loss, 14.0% in those with 10-20% weight loss, and 30.4% in those with 30-40% weight loss.
Among decedents with evaluable treatment intervals, the median interval from last tirzepatide prescription to death was 7.0 months for BMI <30 kg/m2, 6.5 months for BMI 30-35 kg/m2, 4.5 months for BMI 35-40 kg/m2, and 4.9 months for BMI ≥40 kg/m2 (Figure 12A). When stratified by achieved weight loss, the interval was 4.0 months for ≤5% weight loss, 6.4 months for 5-10%, 6.2 months for 10-20%, and 6.5 months for 20-30%. Intervals from last tirzepatide prescription to ICU admission and hospitalization were shorter, with median last-prescription-to-ICU intervals of 1.7 to 2.9 months across BMI strata and 1.9 to 3.5 months across weight-loss strata, and median last-prescription-to-hospitalization intervals of 0.5 to 0.9 months across BMI strata and 0.4 to 0.8 months across weight-loss strata.
In physician-reviewed death-record narratives, incident depletion and frailty-associated phenotypes after tirzepatide initiation were rarely assigned as primary causes of death. The most common attributed causes of death were respiratory failure, septic shock, advanced malignancy, and multiorgan failure (Figure 12B). Among 75 decedents with incident malnutrition after tirzepatide initiation, respiratory failure (32, 42.7%), septic shock (31, 41.3%), multiorgan failure (28, 37.3%), advanced malignancy (25, 33.3%), and renal decompensation (14, 18.7%) were the leading categories contributing to death. Among 48 decedents with incident PEM, the leading proximate categories were advanced malignancy (25, 52.1%), respiratory failure (24, 50.0%), septic shock (23, 47.9%), and multiorgan failure (22, 45.8%). Among decedents with dehydration (N=35), respiratory failure (17, 48.6%), advanced malignancy (16, 45.7%), and multiorgan failure (11, 31.4%) predominated. Among decedents with anorexia (N=33), advanced malignancy (17, 51.5%), respiratory failure (14, 42.4%), septic shock (12, 36.4%), and multiorgan failure (12, 36.4%) were most frequent. These findings provide clinical context for the EHR associations but do not establish causal attribution to tirzepatide.
Discussion
The timing of these findings is consequential. Beginning July 1, 2026, public reporting described a Medicare GLP-1 Bridge Program through which selected anti-obesity incretin therapies, including Zepbound and Wegovy, became available to eligible Medicare Part D beneficiaries for a monthly copay of $50, with estimates that approximately 3 to 4 million older adults may qualify45,46. This expansion may move pharmacologic weight loss from a constrained specialty intervention into routine care for a large older population with heterogeneous morbidities that include frailty, cardiometabolic diseases, liver and kidney disorders , cancer history, and nutritional disorders . The present study does not ask whether tirzepatide produces clinically meaningful weight loss; that question has been answered in randomized trials and large observational studies1,3. Rather, it asks whether routine clinical care can identify—early enough—the subgroup of adults aged 65 years or older for whom tirzepatide treatment may confer a higher risk of death or serious health deterioration.
The principal finding of this study is that, among adults aged 65 years or older receiving tirzepatide in routine care, incident malnutrition, PEM, appetite suppression, dehydration, and sarcopenia identified a small but clinically fragile subgroup with markedly higher mortality, ICU admission, and hospitalization. These associations were not confined to diagnostic codes; they were concordant across structured diagnoses and AI-curated clinical-note phenotypes. The pattern was also thresholded: phenotype incidence rose visibly at 20% or greater achieved body-weight loss and intensified in the 30 to 40% range. This finding is clinically important because a 20% weight reduction is now a therapeutic target for many patients, but in older adults it may also be the point at which intentional adipose-tissue loss begins to overlap with loss of lean mass, reduced oral intake, impaired hydration, frailty, or catabolic illness5,7.
The signal should not be interpreted as evidence that tirzepatide directly causes death. In this study, crude mortality was lower among tirzepatide initiators than among antidiabetic comparator initiators, and tirzepatide has demonstrated substantial metabolic benefit in trial populations1,3. The more relevant interpretation is that incident PEM, malnutrition, dehydration, anorexia, and sarcopenia are clinical warning signs that mark loss of physiologic reserve. This distinction matters: PEM may be downstream of reduced intake, advanced cancer, infection, renal or hepatic decompensation, terminal decline, or severe illness, rather than a direct drug effect. Nevertheless, once such phenotypes emerge during tirzepatide-associated weight loss, they identify patients whose short-term risk is no longer comparable to that of uncomplicated responders.
The age-specific findings are biologically plausible. Older adults have less skeletal-muscle reserve, higher baseline frailty burden, more polypharmacy, more renal vulnerability, and greater susceptibility to dehydration and functional decline than younger adults5,8,9. In this context, appetite suppression is not simply a tolerability event; it may be an upstream clinical signal for reduced protein intake, reduced fluid intake, medication nonadherence, orthostasis, falls, sarcopenia, and hospitalization. Dehydration is similarly important because product labeling for tirzepatide already recognizes gastrointestinal adverse reactions and volume depletion as pathways that may precipitate acute kidney injury47,48. Our data suggest that these risks may need to be operationalized differently in adults aged 65 years or older, especially when weight loss approaches or exceeds 20% of baseline body weight.
The BMI-stratified analyses also refine how risk should be conceptualized. The highest absolute mortality was not concentrated uniformly among patients with the highest BMI. Instead, lower BMI and class II to III obesity appeared to represent different forms of vulnerability. Lean or normal-weight older adults, including those with BMI less than 25, may have limited nutritional and muscle reserve; patients with severe obesity may carry a different burden of immobility, cardiometabolic disease, inflammation, sleep apnea, and frailty. By contrast, BMI 30 to 35 appeared to be a relative mortality nadir for several phenotypes. These observations argue against using BMI alone as a reassurance metric. A patient with BMI 24 and 20% weight loss may be more clinically vulnerable than a patient with BMI 34 and similar weight loss, whereas a patient with BMI 42 may require a different risk framework centered on cardiopulmonary reserve, mobility, and inflammatory burden.
The timing analyses add another practical dimension. Longer treatment duration was associated with greater achieved weight loss, as expected, but the interval from last tirzepatide prescription to death was not uniformly immediate. This argues against a simplistic interpretation in which most deaths occurred during active drug exposure. Instead, the interval patterns are more consistent with a mixture of clinical pathways: some patients may discontinue therapy because of declining health, some may continue losing weight during evolving illness, and others may develop malnutrition or dehydration after treatment has already been interrupted. These timing patterns strengthen the need for longitudinal decision support rather than a one-time eligibility screen.
In the bariatric-surgery comparison with tirzepatide, 1:1 propensity matching reduced but did not eliminate important baseline differences, including longer follow-up and residual differences in BMI, weight, obesity, obstructive sleep apnea, heart failure, atrial fibrillation, acute kidney injury, gastrointestinal disease, and cancer history (Table S4); achieved weight loss after bariatric surgery was also associated with longer follow-up, higher baseline BMI and weight, and greater cardiometabolic complexity (Table S5). Among bariatric-surgery patients who developed incident phenotypes, sarcopenia and cachexia were characterized by substantially lower baseline BMI and body weight, and mortality, ICU admission, and hospitalization were linked to a mixture of low body reserve, shorter follow-up, cardiorenal disease, and procedure-context gastrointestinal comorbidity (Tables S3, Tables S6-S8). By contrast, antidiabetic-comparator patients who developed these phenotypes had a more conventional illness-burden signature, with older age, lower BMI, and higher prevalence of ASCVD, heart failure, atrial fibrillation, chronic kidney disease, acute kidney injury, gastrointestinal disease, and selected cancers; subsequent mortality was dominated by shorter follow-up and cardiorenal illness proximity, whereas ICU admission and hospitalization tracked heart failure, atrial fibrillation, ASCVD, CKD, and AKI (Tables S9-S12). These analyses support the interpretation that incident malnutrition, PEM, dehydration, appetite loss, sarcopenia, and cachexia are not interchangeable across treatment settings: after tirzepatide they identify a metabolically and renally vulnerable older subgroup, after bariatric surgery they often reflect low reserve and procedure-context illness, and after antidiabetic therapy they largely mark advanced cardiovascular multimorbidity.
The sparse documentation of sarcopenia in clinical notes and diagnosis codes across weight-loss categories is itself clinically informative (Figure 2a). Sarcopenia is unlikely to be reliably captured through routine coding alone, particularly when large pharmacologic weight loss is occurring in older adults. These findings support embedding objective body-composition assessment into clinical decision support for adults aged ≥65 years receiving tirzepatide, especially as weight loss approaches or exceeds 20%. Office-based bioelectrical impedance smart scales, while not substitutes for DXA or CT-based muscle assessment, are increasingly available and can provide longitudinal estimates of skeletal muscle mass, fat mass, bone mass, and body water. Serial measurement of these parameters could help distinguish desired fat-mass reduction from clinically concerning lean-mass or hydration loss, prompting earlier protein-intake assessment, resistance-exercise counseling, hydration review, medication adjustment, or referral for nutrition and frailty evaluation.
The cause-of-death review further supports a vulnerability-marker interpretation. Among decedents with incident malnutrition, dehydration, or anorexia, proximate causes were dominated by respiratory failure, septic shock, multiorgan failure, and advanced malignancy. Respiratory failure should not be interpreted as solely downstream of nutritional depletion. GLP-1 receptor agonists like tirzepatide can cause nausea, delayed gastric emptying or reduced gastrointestinal motility, and gastroesophageal reflux; reflux-related microaspiration is a recognized pathway to aspiration pneumonitis or aspiration pneumonia11,12. Thus, in some patients, respiratory failure after tirzepatide initiation could plausibly have reflected aspiration-related lung injury, with or without bacterial infection, independent of malnutrition itself. Conversely, malnutrition, PEM, dehydration, anorexia, and sarcopenia may lower physiologic reserve, impair cough and respiratory muscle function, reduce immune competence, and diminish tolerance of aspiration, sepsis, hemorrhage, renal or hepatic decompensation, or multiorgan failure. These observations argue against attributing death directly to tirzepatide or to PEM alone; rather, they support using incident appetite suppression, reflux symptoms, dehydration, PEM, malnutrition, and sarcopenia as clinical decision-support triggers for earlier assessment of intake, hydration, aspiration risk, frailty, and respiratory vulnerability during large pharmacologic weight loss.
These findings have immediate implications for the Medicare-age population. The expansion of GLP-1 access should be paired with expansion of clinical decision support. At a minimum, older adults beginning tirzepatide should have documented baseline weight, BMI, renal function, hydration risk, appetite status, frailty or functional status, recent cancer history, and evidence of sarcopenia or unintentional weight loss. Once weight loss reaches 20%, routine follow-up should shift to structured assessment of protein intake, oral intake, hydration, orthostasis, renal function, medication burden, muscle strength, and functional trajectory. At 30% or greater weight loss, incident appetite suppression, dehydration, malnutrition, PEM, or sarcopenia should trigger active evaluation for occult illness, excessive intake restriction, inadequate protein intake, cancer, infection, renal or hepatic decompensation, and treatment interruption or dose modification. We suggest that medical practices should consider routine objective methods for identifying and quantifying sarcopenia and nutritional status. Hand grip dynamometers are simple tools that can be used in clinical practice to measure hand and forearm muscle strength and compared to a reference. Triceps calipers can be used to measure skinfold thickness to estimate subcutaneous body fat and to infer nutritional status. Smart scales use bioelectrical impedance analysis to measure volumetric conductivity. These devices infer body fat mass, bone mass, and muscle mass by means of predictive algorithms that rely on combined data including age, height, and biological sex. Although their accuracy is affected by the hydration status and other factors at the time of measurement, long-term trends acquire significance for clinical decisions.
Several limitations are important. This was an observational EHR study, and causal inference is limited by residual confounding, differential follow-up, outcome ascertainment, coding practices, weight documentation patterns, and reverse causation. Patients who lose more weight necessarily have more time and clinical contact to demonstrate that weight loss, and patients who die early may appear to have low treatment exposure or low achieved weight loss because therapy was truncated. Incident phenotypes may also be detected more often in patients with more severe illness or more frequent encounters. These limitations are not incidental; they are central to the interpretation. The study should therefore be read as a real-world risk-identification analysis, not as proof of tirzepatide-attributable outcomes.
In summary, tirzepatide-associated weight loss in older adults should not be viewed as a binary success or adverse event. The clinically relevant question is whether weight loss remains accompanied by preserved strength, hydration, protein intake, function, and physiologic reserve. In adults aged 65 years or older, incident malnutrition, PEM, appetite suppression, dehydration, and sarcopenia during large tirzepatide-associated weight loss identified high-risk subgroups for mortality, ICU admission, and hospitalization. As access expands, the practical response is not to restrict effective therapy broadly, but to embed age-specific clinical decision support at the point where intended weight loss may become physiologic depletion.
Supplementary Materials
The following supporting information can be downloaded at the website of this paper posted on Preprints.org.
Author Contributions
Venky Soundararajan conceived the study, and designed the study with Adhikaar Marwaha and AJ Venkatakrishnan. Adhikaar Marwaha, AJ Venkatakrishnan, Avinash Aman, and Santhosh Shivabasappa contributed to data analysis. Adhikaar Marwaha, Robert Matson, Karthik Murugadoss, AJ Venkatakrishnan and Venky Soundararajan contributed to visualization. Marcelo Montorzi and Clifford J. Rosen contributed clinical insights. Venky Soundararajan supervised the study. All authors contributed to preparing the manuscript, reviewed and approved the final version.
Funding
No external funding was received for this study.
Data Availability
This study involves the analysis of de-identified Electronic Health Record (EHR) data via the
nference Federated System49. Data shown and reported in this manuscript were extracted from this environment
using an established protocol for data extraction, aimed at preserving patient privacy. The data has been deidentified
pursuant to an expert determination in accordance with the HIPAA Privacy Rule. Any data beyond what is reported in the manuscript, including but not limited to the raw EHR data, cannot be shared or released
due to the parameters of the expert determination to maintain the data de-identification.
Code Availability
The analysis code is not publicly available. Please contact the corresponding author for
details.
Acknowledgments
The authors acknowledge the use of the nference federated AI platform. The authors thank Patrick Lenehan for helpful critique.
Competing Interest Statement
Adhikaar Marwaha, AJ Venkatakrishnan, Avinash Aman, Santhosh Shivabasappa, Robert Matson, Karthik Murugadoss, Marcelo Montorzi, and Venky Soundararajan are employees or consultants of nference, Inc., which conducts research collaborations with various biopharmaceutical companies whose therapeutic products are included in this study. None of these companies, nor any other nference collaborator, funded, supported, or had any role in the independent study design, data acquisition, analysis, interpretation, manuscript preparation, or the decision to submit this work for publication. All analyses were conducted by the authors using de-identified electronic health record data. The authors declare no additional competing interests.
References
- Jastreboff, A. M.; et al. Tirzepatide once weekly for the treatment of obesity. N. Engl. J. Med. 2022, 387, 205–216. [Google Scholar] [CrossRef] [PubMed]
- Frías, J. P.; et al. Tirzepatide versus semaglutide once weekly in patients with type 2 diabetes. N. Engl. J. Med. 2021, 385, 503–515. [Google Scholar] [CrossRef] [PubMed]
- Garvey, W. T.; et al. Tirzepatide once weekly for the treatment of obesity in people with type 2 diabetes (SURMOUNT-2): a double-blind, randomised, multicentre, placebo-controlled, phase 3 trial. Lancet 2023, 402, 613–626. [Google Scholar] [CrossRef] [PubMed]
- Aronne, L. J.; et al. Tirzepatide as compared with semaglutide for the treatment of obesity. N. Engl. J. Med. 2025, 393, 26–36. [Google Scholar] [CrossRef] [PubMed]
- Cederholm, T.; et al. GLIM criteria for the diagnosis of malnutrition - A consensus report from the global clinical nutrition community. J. Cachexia Sarcopenia Muscle 2019, 10, 207–217. [Google Scholar] [CrossRef] [PubMed]
- Jensen, G. L.; et al. GLIM criteria for the diagnosis of malnutrition: A consensus report from the global clinical nutrition community. JPEN J. Parenter. Enter. Nutr. 2019, 43, 32–40. [Google Scholar]
- Cruz-Jentoft, A. J.; et al. Sarcopenia: revised European consensus on definition and diagnosis. Age Ageing 2019, 48, 16–31. [Google Scholar] [CrossRef] [PubMed]
- Volkert, D.; et al. ESPEN practical guideline: Clinical nutrition and hydration in geriatrics. Clin. Nutr. 2022, 41, 958–989. [Google Scholar] [CrossRef] [PubMed]
- Bauer, J.; et al. Evidence-based recommendations for optimal dietary protein intake in older people: a position paper from the PROT-AGE Study Group. J. Am. Med. Dir. Assoc. 2013, 14, 542–559. [Google Scholar] [CrossRef] [PubMed]
- Edmonds, C. J.; Foglia, E.; Booth, P.; Fu, C. H. Y.; Gardner, M. Dehydration in older people: A systematic review of the effects of dehydration on health outcomes, healthcare costs and cognitive performance. Arch. Gerontol. Geriatr. 2021, 95, 104380. [Google Scholar] [CrossRef] [PubMed]
- El-Sharkawy, A. M.; et al. Hydration and outcome in older patients admitted to hospital (The HOOP prospective cohort study). Age Ageing 2015, 44, 943–947. [Google Scholar] [CrossRef] [PubMed]
- Fried, L. P.; et al. Frailty in older adults: evidence for a phenotype. J. Gerontol. A Biol. Sci. Med. Sci. 2001, 56, M146–56. [Google Scholar] [CrossRef] [PubMed]
- Villareal, D. T.; et al. Weight loss, exercise, or both and physical function in obese older adults. N. Engl. J. Med. 2011, 364, 1218–1229. [Google Scholar] [CrossRef] [PubMed]
- Villareal, D. T.; et al. Aerobic or resistance exercise, or both, in dieting obese older adults. N. Engl. J. Med. 2017, 376, 1943–1955. [Google Scholar] [CrossRef] [PubMed]
- Look, M.; et al. Body composition changes during weight reduction with tirzepatide in the SURMOUNT-1 study of adults with obesity or overweight. Diabetes Obes. Metab. 2025, 27, 2720–2729. [Google Scholar] [CrossRef] [PubMed]
- Ray, W. A. Evaluating medication effects outside of clinical trials: new-user designs. Am. J. Epidemiol. 2003, 158, 915–920. [Google Scholar] [CrossRef] [PubMed]
- Sherman, R. E.; et al. Real-world evidence - what is it and what can it tell us? N. Engl. J. Med. 2016, 375, 2293–2297. [Google Scholar] [CrossRef] [PubMed]
- von Elm, E.; et al. The Strengthening the Reporting of Observational Studies in Epidemiology (STROBE) statement: guidelines for reporting observational studies. Lancet 2007, 370, 1453–1457. [Google Scholar] [CrossRef] [PubMed]
- Benchimol, E. I.; et al. The REporting of studies Conducted using Observational Routinely-collected health Data (RECORD) statement. PLoS Med. 2015, 12, e1001885. [Google Scholar] [CrossRef] [PubMed]
- Hernán, M. A.; Robins, J. M. Using big data to emulate a target trial when a randomized trial is not available. Am. J. Epidemiol. 2016, 183, 758–764. [Google Scholar] [CrossRef] [PubMed]
- Wagner, T.; et al. Augmented curation of clinical notes from a massive EHR system reveals symptoms of impending COVID-19 diagnosis. Elife 2020, 9, e58227. [Google Scholar] [CrossRef] [PubMed]
- Del Campo, A. O.; et al. Automated abstraction of clinical parameters of multiple myeloma from real-world clinical notes using large language models. BMC Med. Inform. Decis. Mak. 2026, 26. [Google Scholar] [CrossRef] [PubMed]
- Murugadoss, K.; Venkatakrishnan, A. J.; Soundararajan, V. Greater lean-body-mass decline with tirzepatide than semaglutide in routine care, revealed by body-composition digital phenotyping. medRxiv 2026. [Google Scholar] [CrossRef]
- Murugadoss, K.; et al. Functional-vs-cognitive decline heterogeneity in Alzheimer’s disease revealed by LLM-curation of decades of clinical notes has implications for semaglutide trial design. 2026. [Google Scholar] [CrossRef]
- Lund, J. L.; Richardson, D. B.; Stürmer, T. The active comparator, new user study design in pharmacoepidemiology: historical foundations and contemporary application. Curr. Epidemiol. Rep. 2015, 2, 221–228. [Google Scholar] [CrossRef] [PubMed]
- Rosenbaum, P. R.; Rubin, D. B. The central role of the propensity score in observational studies for causal effects. Biometrika 1983, 70, 41–55. [Google Scholar] [CrossRef]
- Austin, P. C. An introduction to propensity score methods for reducing the effects of confounding in observational studies. Multivar. Behav. Res. 2011, 46, 399–424. [Google Scholar] [CrossRef]
- Austin, P. C. Optimal caliper widths for propensity-score matching when estimating differences in means and differences in proportions in observational studies. Pharm. Stat. 2011, 10, 150–161. [Google Scholar] [CrossRef] [PubMed]
- Rosenbaum, P. R.; Rubin, D. B. Constructing a control group using multivariate matched sampling methods that incorporate the propensity score. Am. Stat. 1985, 39, 33–38. [Google Scholar] [CrossRef]
- Austin, P. C. Balance diagnostics for comparing the distribution of baseline covariates between treatment groups in propensity-score matched samples. Stat. Med. 2009, 28, 3083–3107. [Google Scholar] [CrossRef] [PubMed]
- Van Veen, D.; et al. Adapted large language models can outperform medical experts in clinical text summarization. Nat. Med. 2024, 30, 1134–1142. [Google Scholar] [CrossRef] [PubMed]
- Yan, C.; et al. Large language models facilitate the generation of electronic health record phenotyping algorithms. J. Am. Med. Inform. Assoc. 2024, 31, 1994–2001. [Google Scholar] [CrossRef] [PubMed]
- Kaplan, E. L.; Meier, P. Nonparametric estimation from incomplete observations. J. Am. Stat. Assoc. 1958, 53, 457–481. [Google Scholar] [CrossRef]
- Armitage, P. Tests for linear trends in proportions and frequencies. Biometrics 1955, 11, 375. [Google Scholar] [CrossRef]
- Cox, D. R. Regression models and life-tables. J. R. Stat. Soc. Ser. B Stat. Methodol. 1972, 34, 187–202. [Google Scholar] [CrossRef]
- Suissa, S. Immortal time bias in pharmaco-epidemiology. Am. J. Epidemiol. 2008, 167, 492–499. [Google Scholar] [CrossRef] [PubMed]
- Suissa, S.; Dell’Aniello, S. Time-related biases in pharmacoepidemiology. Pharmacoepidemiol. Drug Saf. 2020, 29, 1101–1110. [Google Scholar] [CrossRef] [PubMed]
- Lévesque, L. E.; Hanley, J. A.; Kezouh, A.; Suissa, S. Problem of immortal time bias in cohort studies: example using statins for preventing progression of diabetes. BMJ 2010, 340, b5087. [Google Scholar] [CrossRef] [PubMed]
- Htoo, P. T.; et al. Stratified analysis in comparative effectiveness studies that emulate randomized trials. Pharmacoepidemiol. Drug Saf. 2024, 33, e5716. [Google Scholar] [PubMed]
- Welch, B. L. The generalisation of student’s problems when several different population variances are involved. Biometrika 1947, 34, 28–35. [Google Scholar] [CrossRef] [PubMed]
- Benjamini, Y.; Hochberg, Y. Controlling the false discovery rate: A practical and powerful approach to multiple testing. J. R. Stat. Soc. Ser. B Stat. Methodol. 1995, 57, 289–300. [Google Scholar] [CrossRef]
- Glickman, M. E.; Rao, S. R.; Schultz, M. R. False discovery rate control is a recommended alternative to Bonferroni-type adjustments in health studies. J. Clin. Epidemiol. 2014, 67, 850–857. [Google Scholar] [CrossRef] [PubMed]
- Murugadoss, K.; et al. Building a best-in-class automated de-identification tool for electronic health records through ensemble learning. Patterns (N. Y.) 2021, 2, 100255. [Google Scholar] [CrossRef] [PubMed]
- Murugadoss, K.; et al. Scaling text de-identification using locally augmented ensembles. medRxiv 2024. [Google Scholar] [CrossRef]
- Dunn, C. Medicare GLP-1 Bridge Program Will Pay for Novo, Lilly Drugs. Barrons. 2026. Available online: https://www.barrons.com/articles/medicare-glp-1-bridge-program-novo-lilly-c4c94dfc.
- Contino, G. Millions of Americans can get Medicare to cover GLP-1s for weight loss starting this week. Here’s how much it costs. MarketWatch. 2026. Available online: https://www.marketwatch.com/story/millions-of-americans-can-get-medicare-to-cover-glp-1s-for-weight-loss-starting-this-week-heres-how-much-it-costs-805f86e1.
- Zepbound® (tirzepatide) Injection for Adults with Obesity or OSA. 2023. Available online: https://zepbound.lilly.com/.
- Type 2 Diabetes Treatment to Lower A1C. Available online: https://mounjaro.lilly.com/.
- Lenehan, P.; et al. Clinical nSights: A software platform to accelerate real world oncology analyses. J. Clin. Oncol. 2024, 42, e23316–e23316. [Google Scholar] [CrossRef]
Figure 1.
Study design associated with tirzepatide in adults aged 65 years or older. CONSORT diagram showing cohort construction. From approximately 29 million patients, 29,955 Medicare-age (≥65 years) tirzepatide initiators were identified. Among these, 13,385 patients with baseline and post-initiation weight measurements comprised the measurable weight-loss cohort. Independent comparator cohorts of antidiabetic medication users and GLP-1-naive bariatric surgery patients were assembled and 1:1 propensity-score matched. .
Figure 1.
Study design associated with tirzepatide in adults aged 65 years or older. CONSORT diagram showing cohort construction. From approximately 29 million patients, 29,955 Medicare-age (≥65 years) tirzepatide initiators were identified. Among these, 13,385 patients with baseline and post-initiation weight measurements comprised the measurable weight-loss cohort. Independent comparator cohorts of antidiabetic medication users and GLP-1-naive bariatric surgery patients were assembled and 1:1 propensity-score matched. .
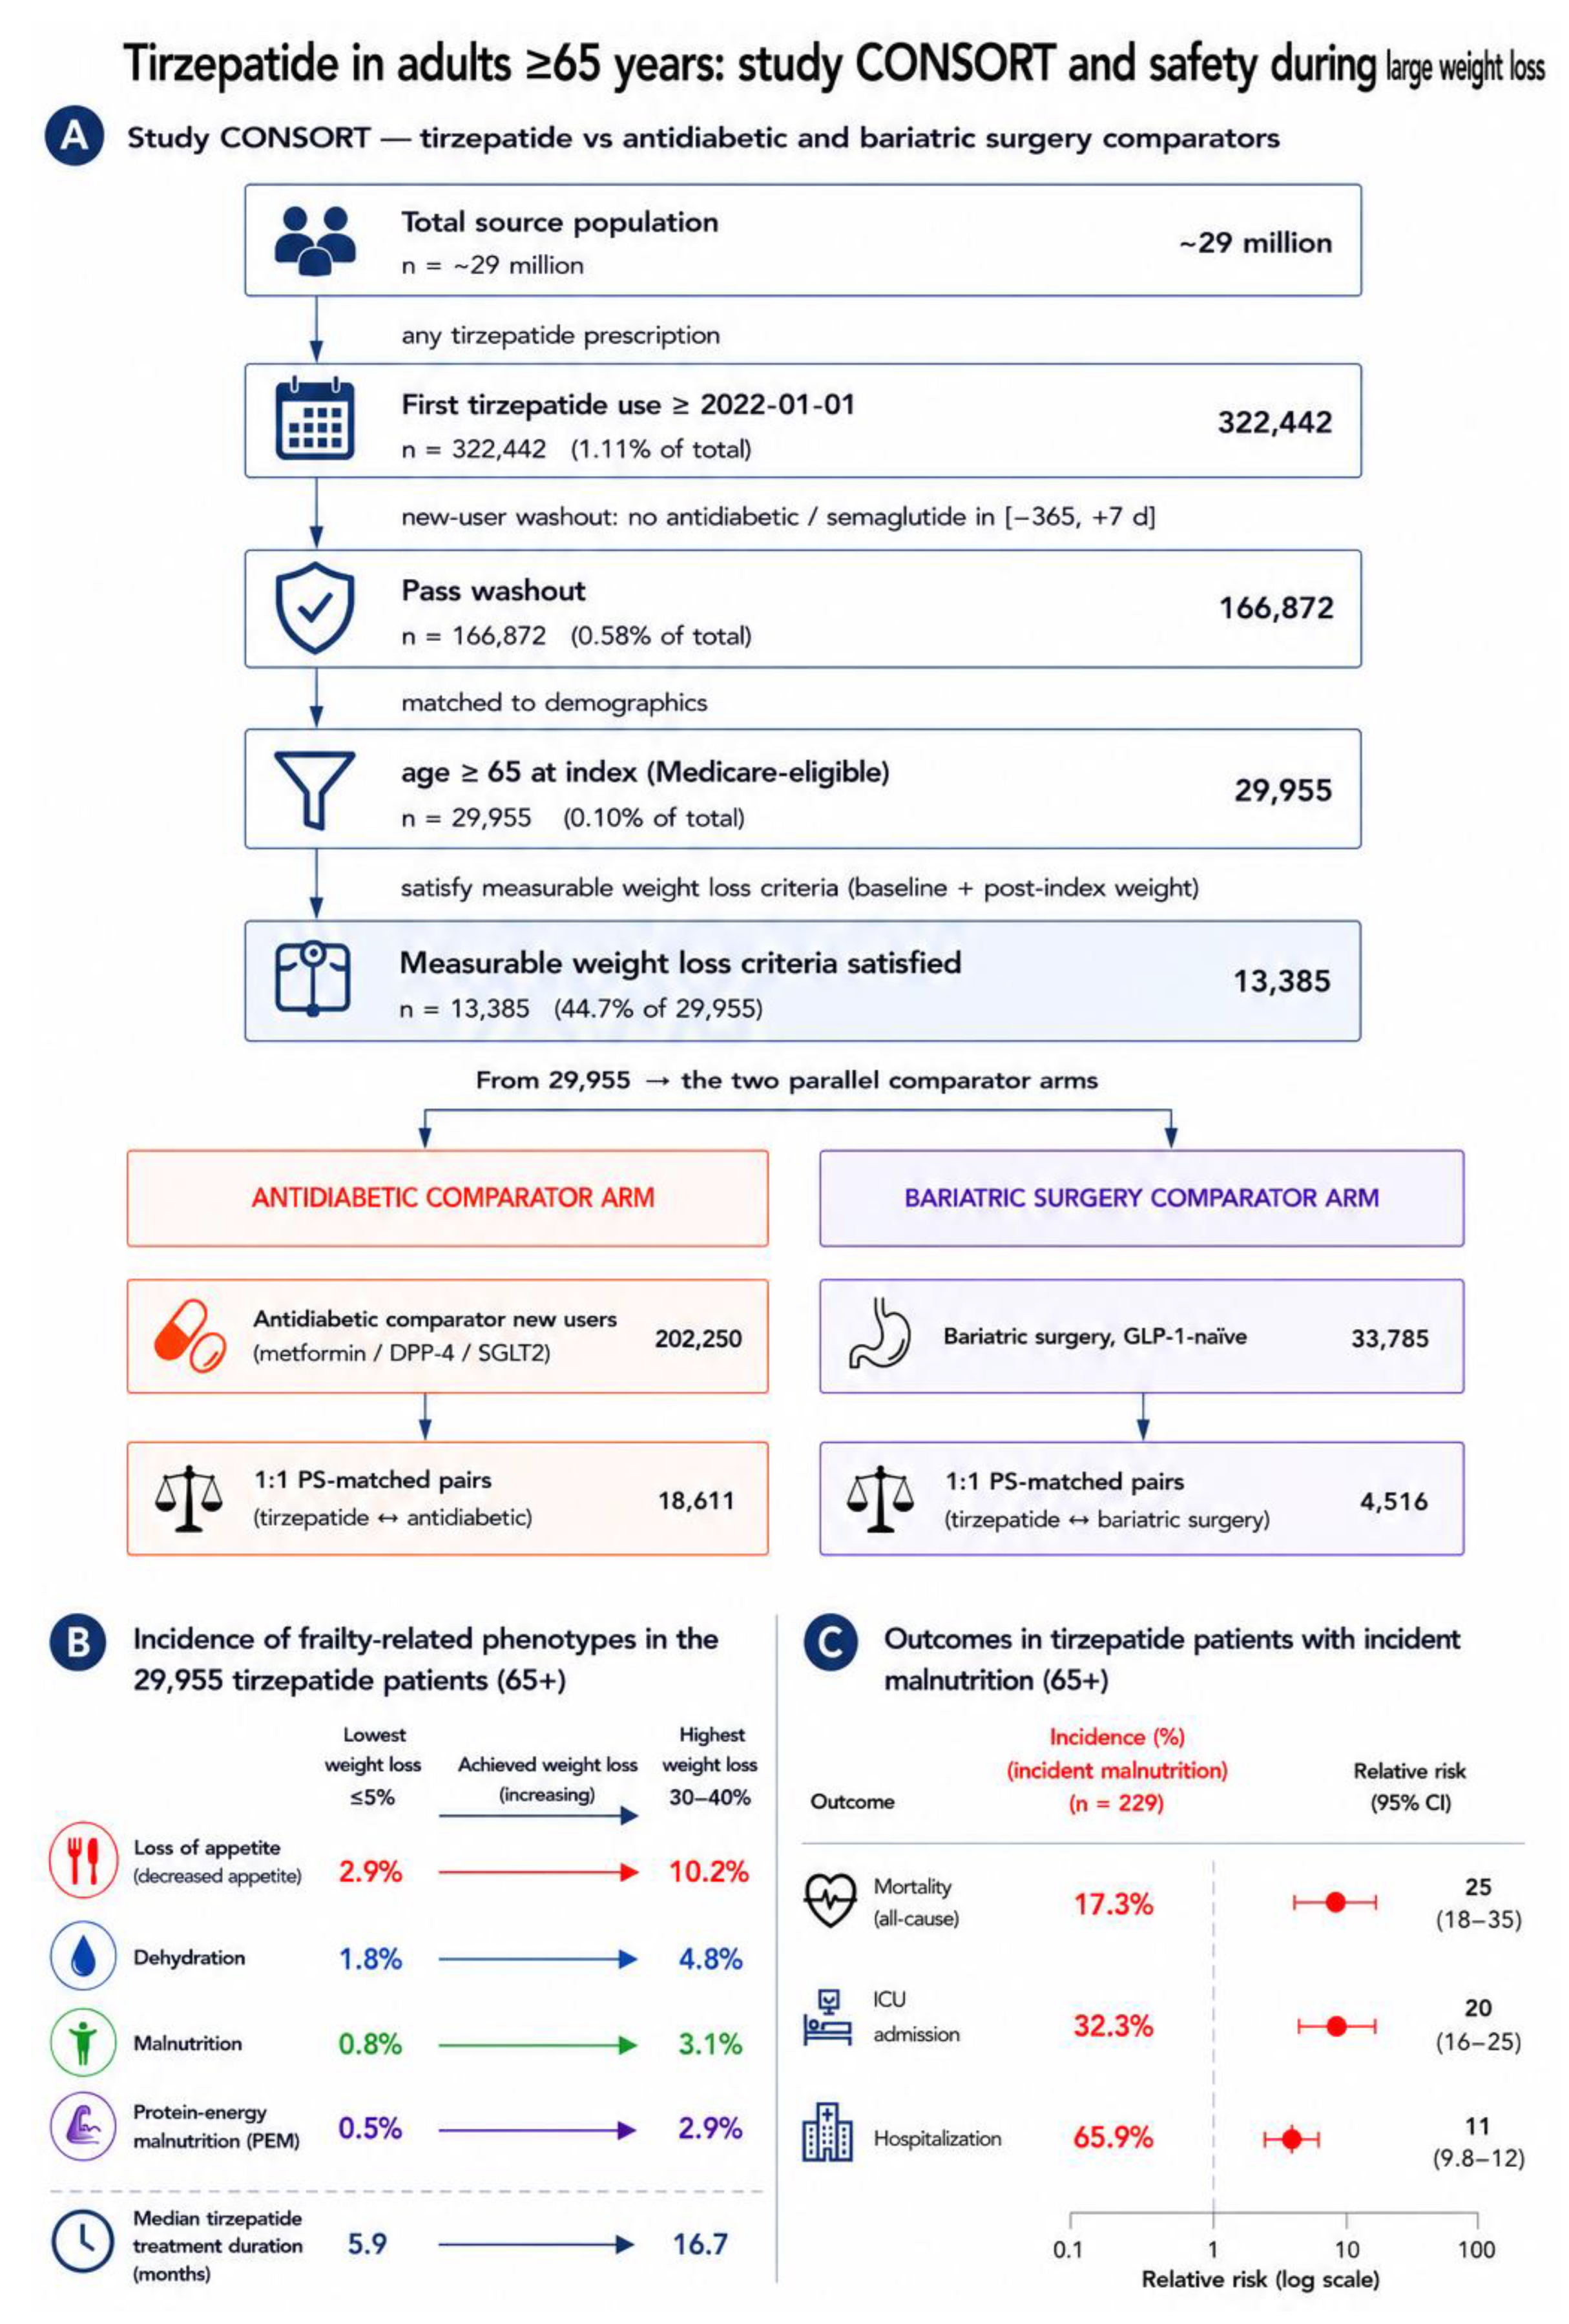
Figure 2.
Incident clinical phenotypes among tirzepatide initiators aged ≥65 years, stratified by achieved weight loss, maximum dose reached, and prescription frequency. A. Unadjusted post-initiation incidence proportions for loss of appetite, dehydration, malnutrition, protein-energy malnutrition (PEM), and sarcopenia among tirzepatide initiators aged ≥65 years, stratified by achieved percent weight loss from baseline (≤5%, 5–10%, 10–20%, 20–30%, 30–40%). The y-axis denotes the percentage of initiators newly developing each phenotype; panel headers report the total number of incident cases and overall cohort incidence for each phenotype. Error bars denote 95% Wilson confidence intervals; per-point labels denote the number of phenotype developers in each weight-loss band, with counts <11 masked to preserve patient privacy. Background shading denotes clinical decision-support weight-loss zones (green, <20%; yellow, 20–30%; red, ≥30%). In-panel statistics compare the ≤5% weight-loss group with the pooled ≥20% and pooled ≥30% weight-loss groups (Cohen's d for incidence as a binary outcome; chi-square P-value; * denotes P<0.05). B. Crude incidence (%) of each phenotype stratified by maximum tirzepatide dose reached within an 18-month exposure window, dichotomized as low dose (<10 mg) versus high dose (≥10 mg). Error bars denote 95% Wilson confidence intervals; point labels show the numerator (incident cases) over the denominator (patients in the dose stratum). In-panel P-values reflect chi-square comparison of the low- versus high-dose groups (* denotes P<0.05). C. Crude incidence (%) of each phenotype stratified by number of tirzepatide prescriptions filled within an 18-month exposure window (1, 2–3, 4–6, or ≥7 prescriptions), used as a proxy for treatment persistence/exposure intensity. Error bars denote 95% Wilson confidence intervals; point labels show the numerator (incident cases) over the denominator (patients in the prescription-count stratum). In-panel P-values reflect the Cochran-Armitage trend test (* denotes P<0.05).
Figure 2.
Incident clinical phenotypes among tirzepatide initiators aged ≥65 years, stratified by achieved weight loss, maximum dose reached, and prescription frequency. A. Unadjusted post-initiation incidence proportions for loss of appetite, dehydration, malnutrition, protein-energy malnutrition (PEM), and sarcopenia among tirzepatide initiators aged ≥65 years, stratified by achieved percent weight loss from baseline (≤5%, 5–10%, 10–20%, 20–30%, 30–40%). The y-axis denotes the percentage of initiators newly developing each phenotype; panel headers report the total number of incident cases and overall cohort incidence for each phenotype. Error bars denote 95% Wilson confidence intervals; per-point labels denote the number of phenotype developers in each weight-loss band, with counts <11 masked to preserve patient privacy. Background shading denotes clinical decision-support weight-loss zones (green, <20%; yellow, 20–30%; red, ≥30%). In-panel statistics compare the ≤5% weight-loss group with the pooled ≥20% and pooled ≥30% weight-loss groups (Cohen's d for incidence as a binary outcome; chi-square P-value; * denotes P<0.05). B. Crude incidence (%) of each phenotype stratified by maximum tirzepatide dose reached within an 18-month exposure window, dichotomized as low dose (<10 mg) versus high dose (≥10 mg). Error bars denote 95% Wilson confidence intervals; point labels show the numerator (incident cases) over the denominator (patients in the dose stratum). In-panel P-values reflect chi-square comparison of the low- versus high-dose groups (* denotes P<0.05). C. Crude incidence (%) of each phenotype stratified by number of tirzepatide prescriptions filled within an 18-month exposure window (1, 2–3, 4–6, or ≥7 prescriptions), used as a proxy for treatment persistence/exposure intensity. Error bars denote 95% Wilson confidence intervals; point labels show the numerator (incident cases) over the denominator (patients in the prescription-count stratum). In-panel P-values reflect the Cochran-Armitage trend test (* denotes P<0.05).
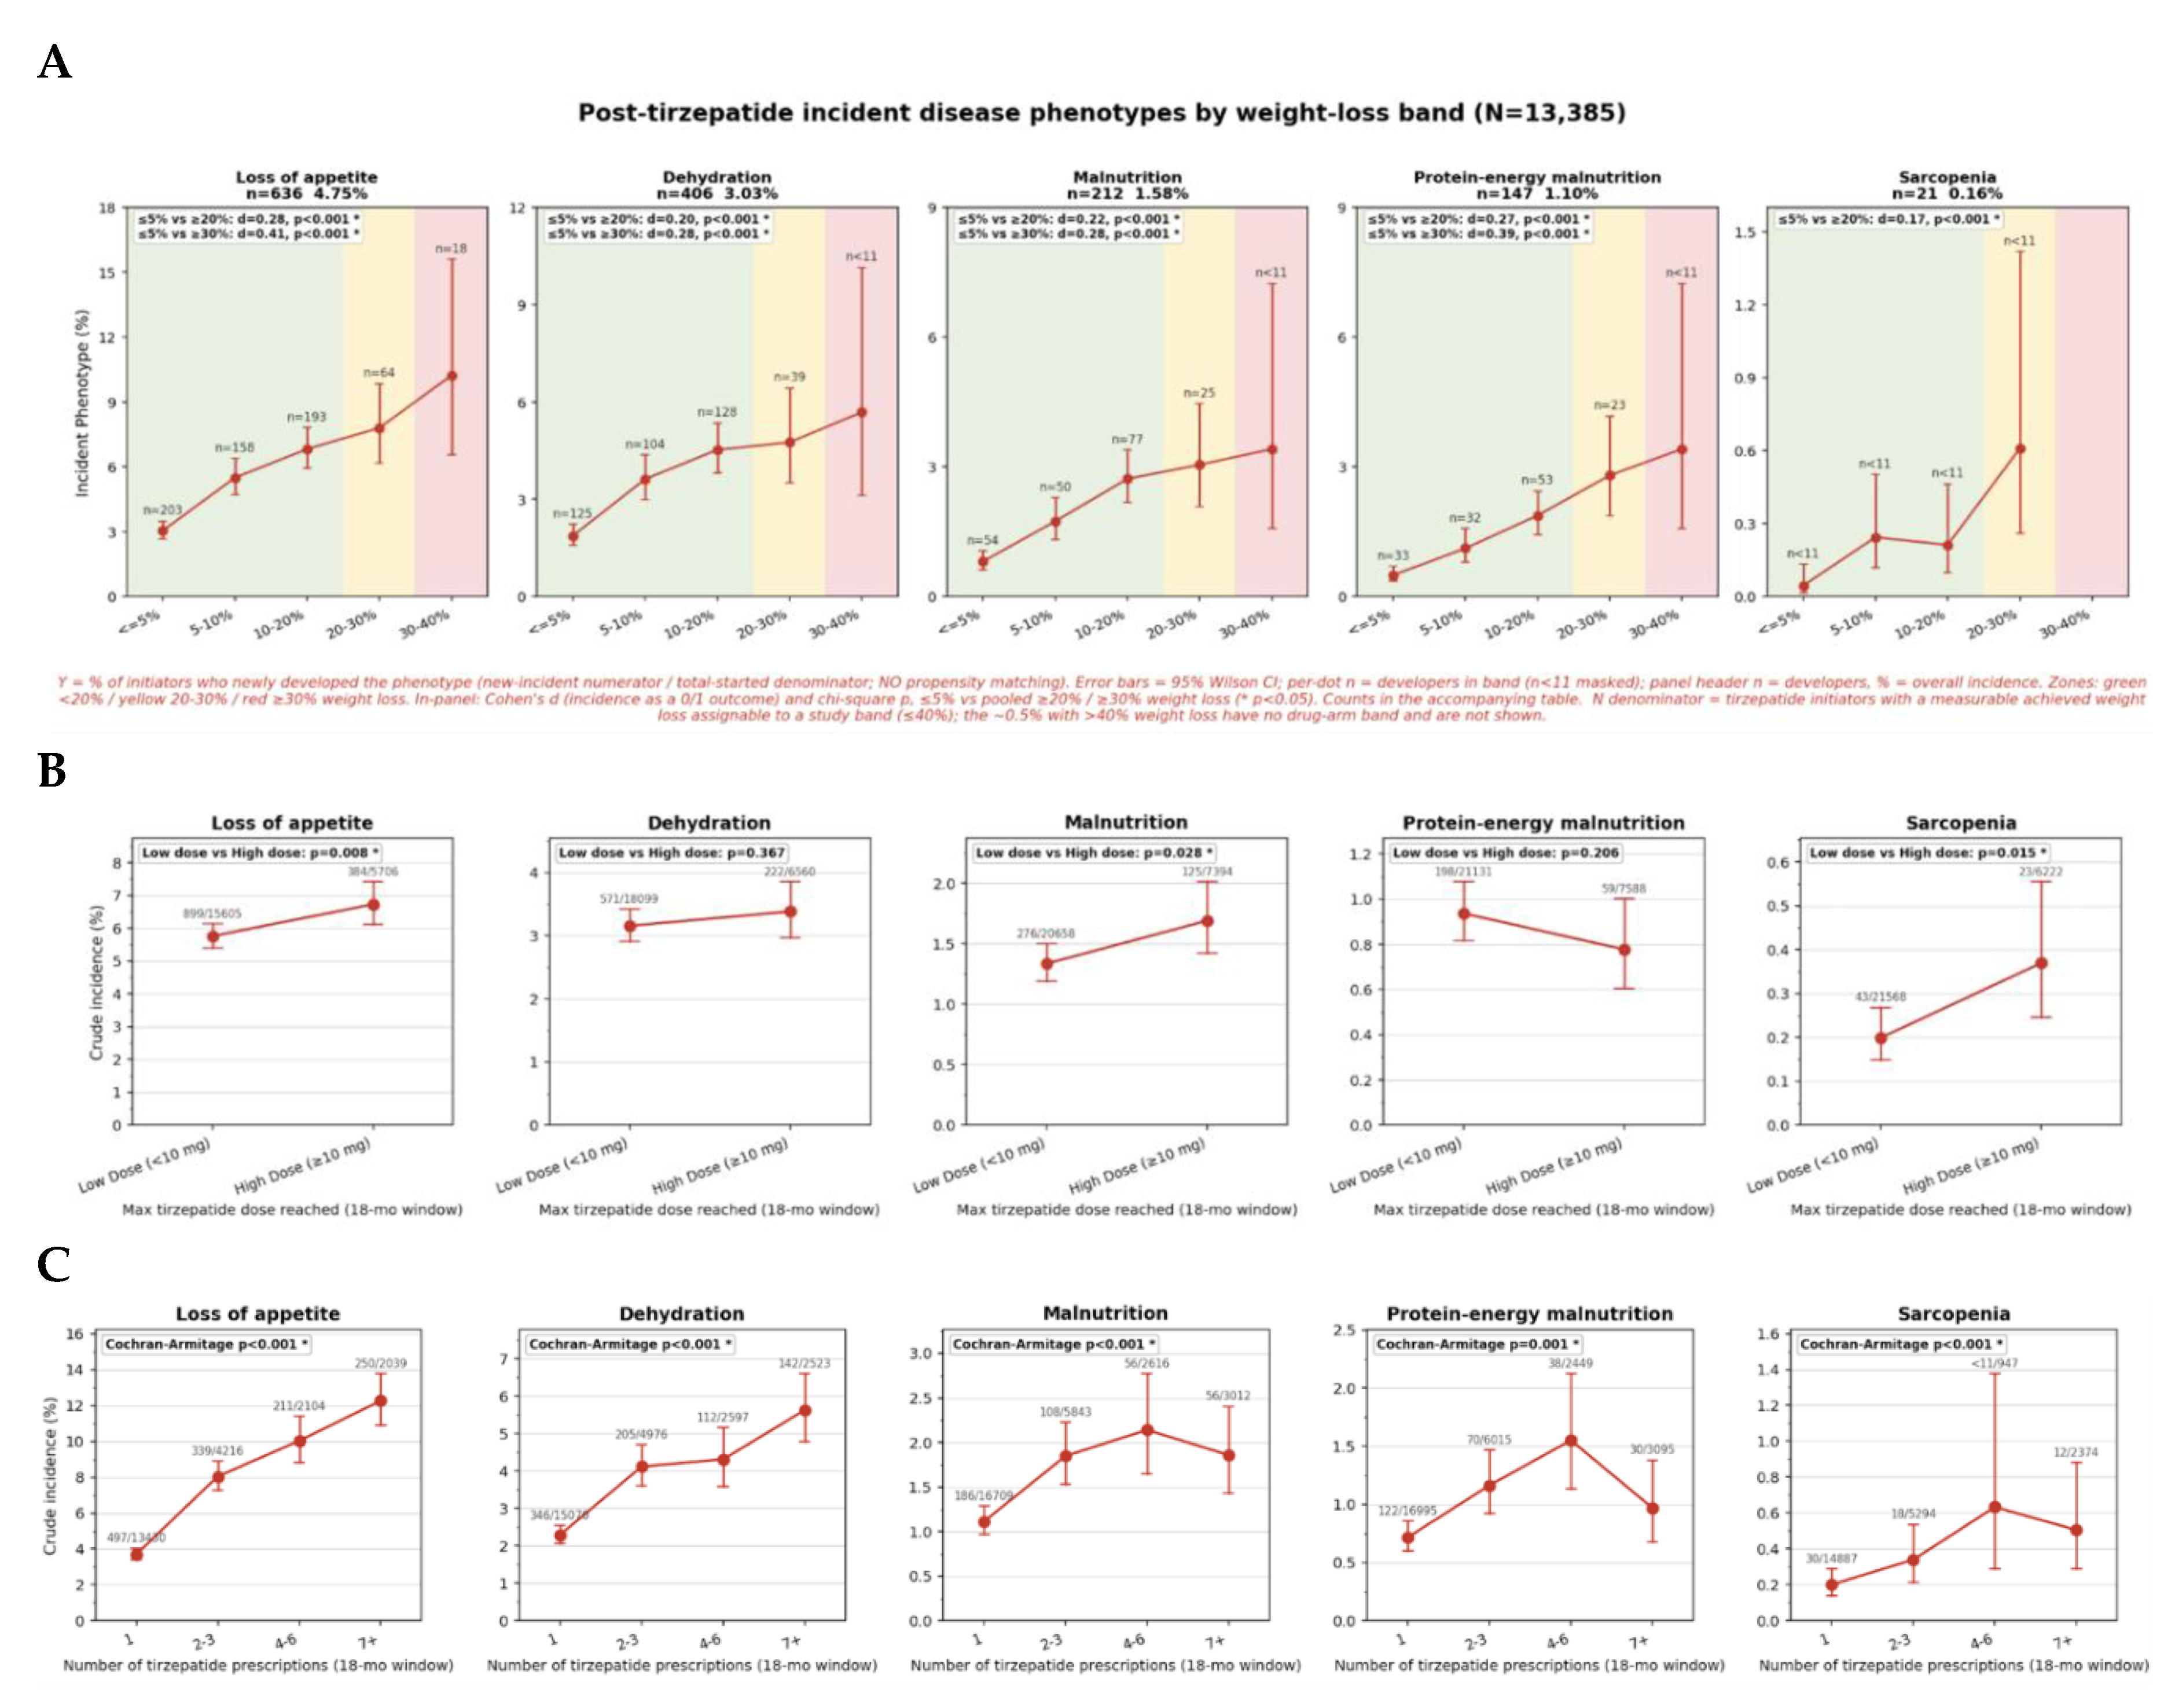
Figure 3.
Baseline Enrichments Before Tirzepatide-Associated Incident Phenotypes and Subsequent Mortality, ICU Admission, and Hospitalization Patterns. Heatmaps show standardized mean differences (SMDs) for baseline demographic, laboratory, clinical, and cancer characteristics among tirzepatide initiators aged 65 years or older. Panel A compares patients who developed each incident phenotype during follow-up with the overall tirzepatide-treated cohort. Panel B compares patients who died with those who remained alive within each incident-phenotype subgroup. Panel C compares patients with ICU admission with those without ICU admission within each incident-phenotype subgroup. Panel D compares patients with hospitalization with those without hospitalization within each incident-phenotype subgroup. Column headers show the number of patients with each incident phenotype in Panel A; in Panels B through D, column headers show the number of outcome events within each phenotype subgroup, with ‘d’ denoting deaths in Panel B. Red cells indicate characteristics enriched among phenotype developers or outcome-event patients; blue cells indicate characteristics less frequent or lower in those groups. Black outlines denote absolute SMD ≥0.30. Phenotypes include anorexia, decreased appetite, dehydration, malnutrition, PEM, and sarcopenia. SMDs are descriptive measures of imbalance and should not be interpreted as causal effects.
Figure 3.
Baseline Enrichments Before Tirzepatide-Associated Incident Phenotypes and Subsequent Mortality, ICU Admission, and Hospitalization Patterns. Heatmaps show standardized mean differences (SMDs) for baseline demographic, laboratory, clinical, and cancer characteristics among tirzepatide initiators aged 65 years or older. Panel A compares patients who developed each incident phenotype during follow-up with the overall tirzepatide-treated cohort. Panel B compares patients who died with those who remained alive within each incident-phenotype subgroup. Panel C compares patients with ICU admission with those without ICU admission within each incident-phenotype subgroup. Panel D compares patients with hospitalization with those without hospitalization within each incident-phenotype subgroup. Column headers show the number of patients with each incident phenotype in Panel A; in Panels B through D, column headers show the number of outcome events within each phenotype subgroup, with ‘d’ denoting deaths in Panel B. Red cells indicate characteristics enriched among phenotype developers or outcome-event patients; blue cells indicate characteristics less frequent or lower in those groups. Black outlines denote absolute SMD ≥0.30. Phenotypes include anorexia, decreased appetite, dehydration, malnutrition, PEM, and sarcopenia. SMDs are descriptive measures of imbalance and should not be interpreted as causal effects.
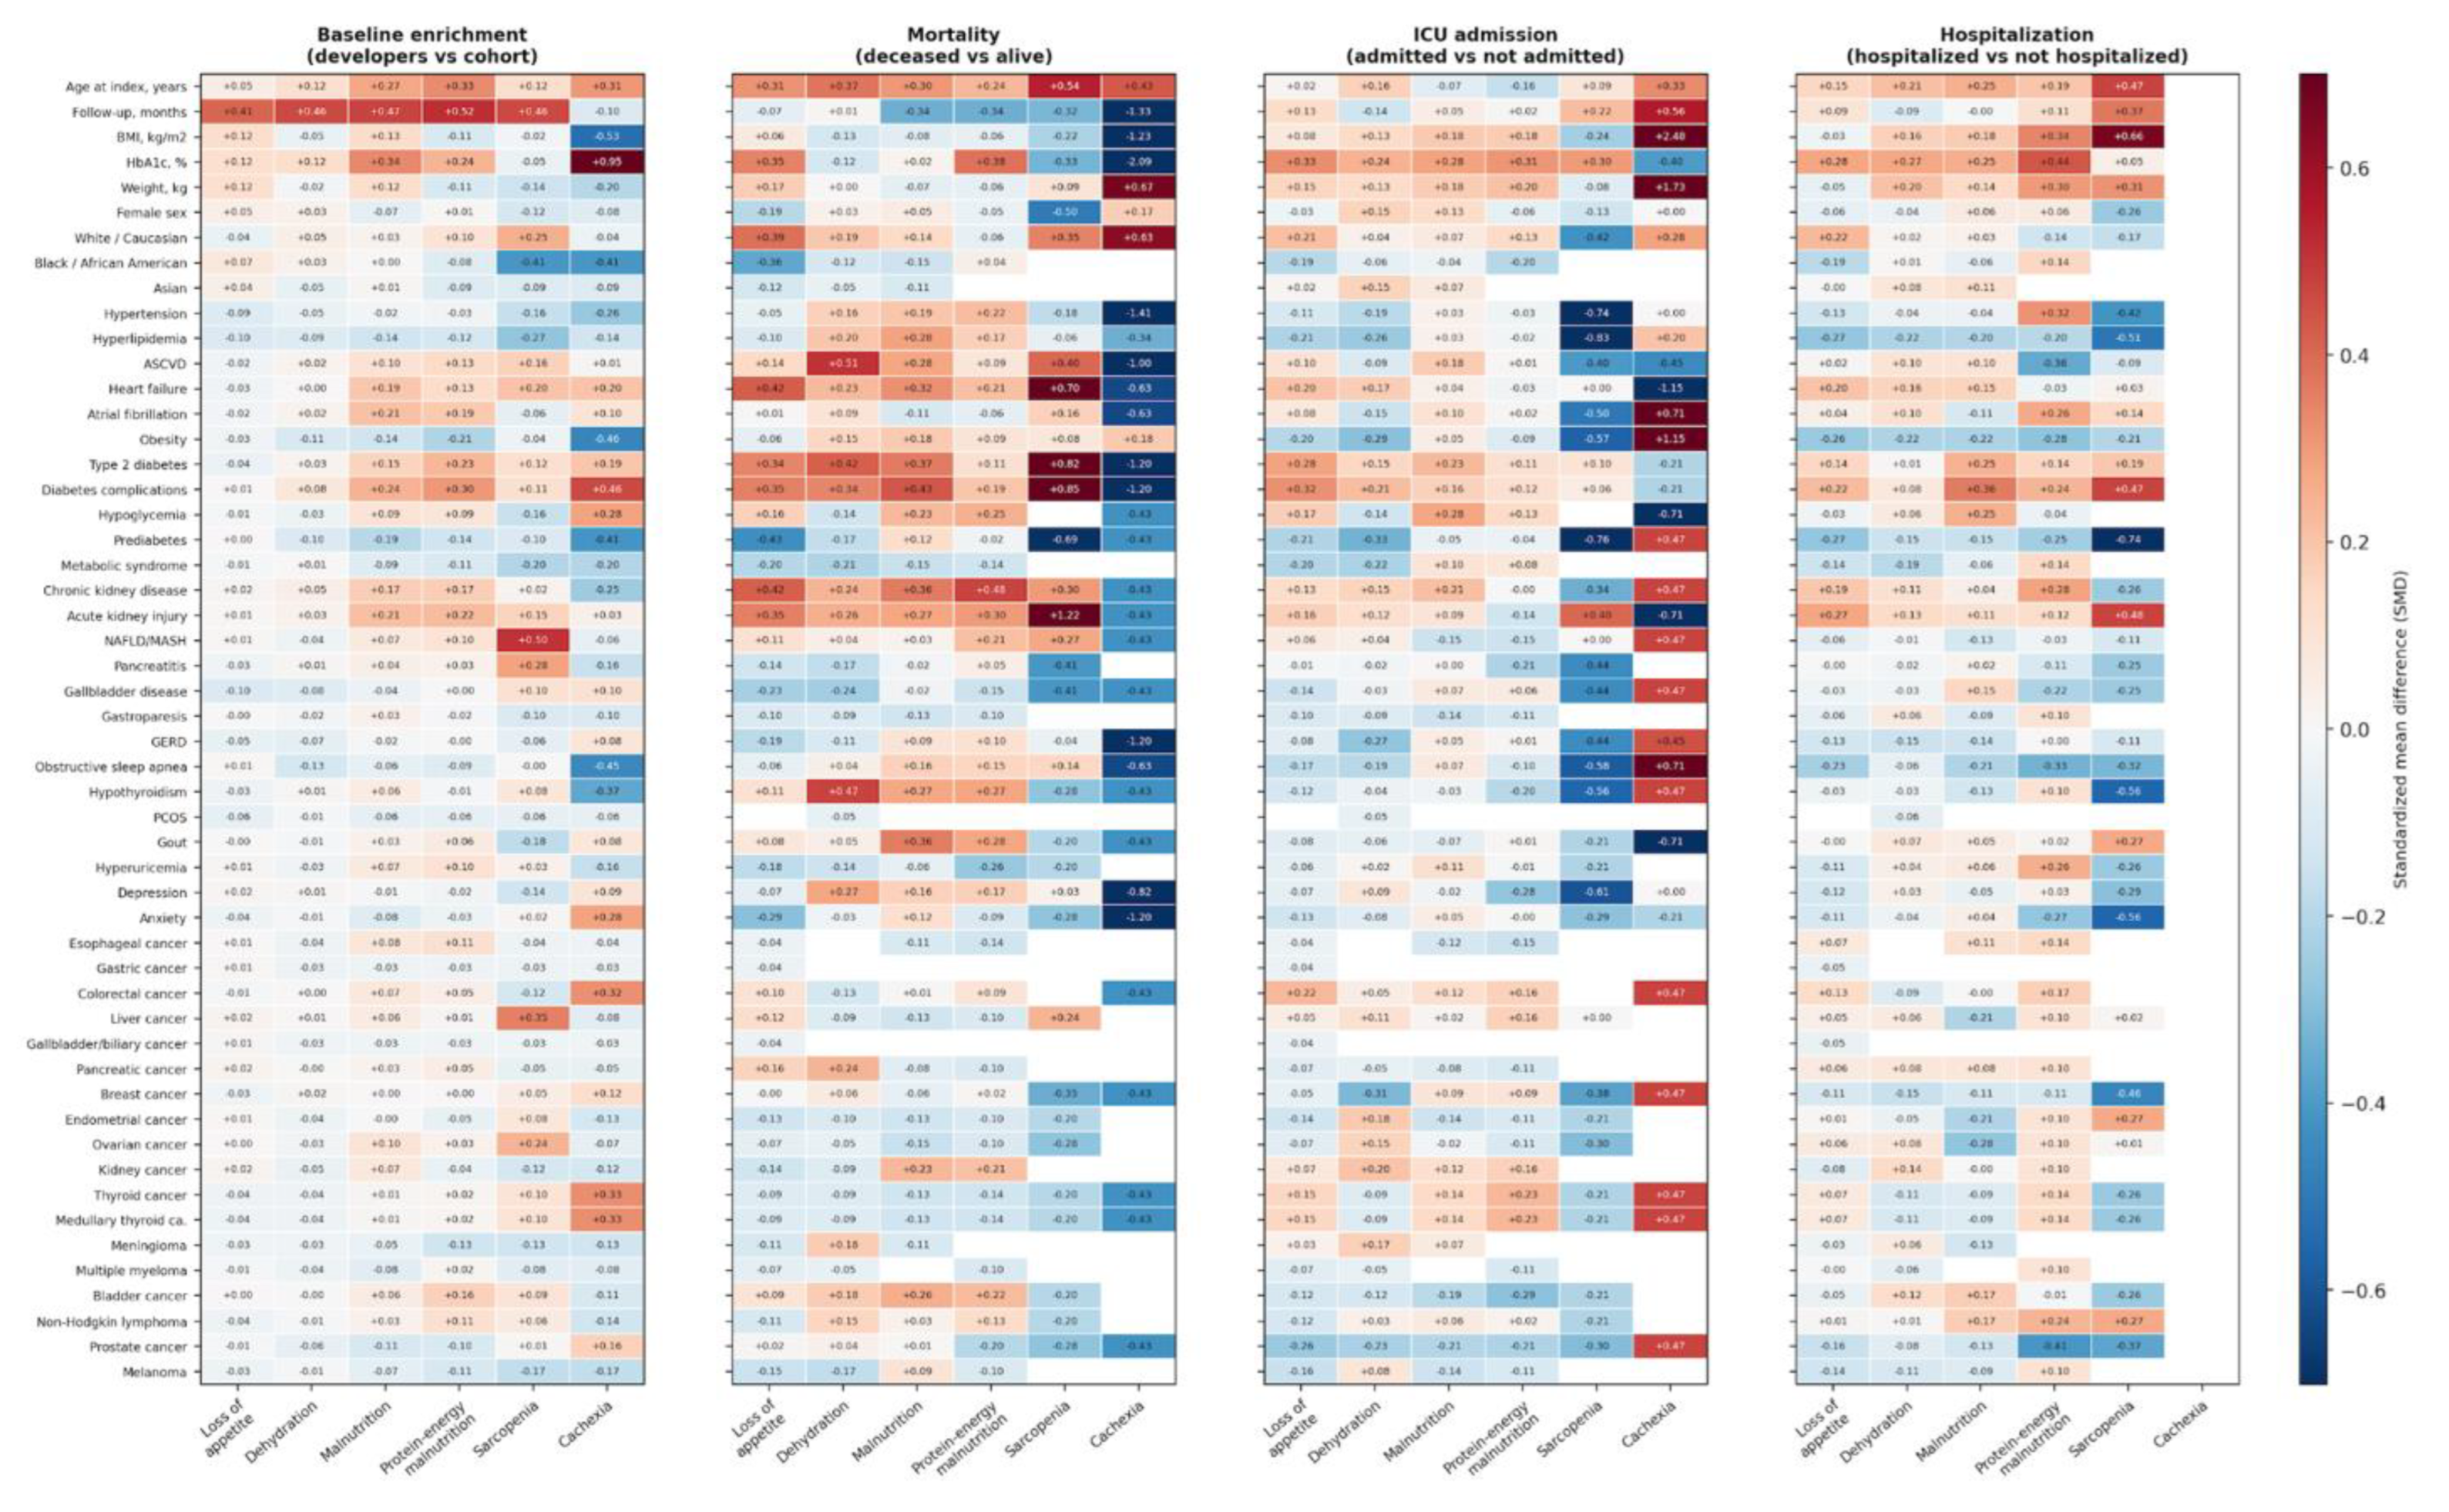
Figure 4.
Treatment duration and timing of incident malnutrition, appetite-suppression, dehydration, sarcopenia, and cachexia phenotypes after treatment initiation. A. Median tirzepatide treatment duration, defined as months from first to last recorded prescription, among initiators aged ≥65 years, stratified by baseline BMI (left) and by achieved weight-loss band (right). Within each stratification, three nested cohort definitions of increasing adherence stringency are overlaid, all applied to the same tirzepatide initiators: ≥1 prescription, ≥2 prescriptions within the 18-month observation window, and ≥3 prescriptions with no gap exceeding 90 days between consecutive fills. B. Median time from treatment index to first incident phenotype diagnosis for the tirzepatide, antidiabetic-drug comparator, and bariatric-surgery comparator cohorts. C. Interval from the last recorded tirzepatide prescription to first incident phenotype diagnosis by phenotype; values below 0 indicate that the phenotype was first recorded before the last prescription, consistent with onset during treatment (across-phenotype ANOVA P<0.001). D. Comparison of tirzepatide treatment duration among users who did versus did not develop each incident phenotype, with per-phenotype P-values from Wilcoxon rank-sum testing. Throughout, points represent medians and bars represent interquartile ranges; per-point sample sizes are shown where applicable.
Figure 4.
Treatment duration and timing of incident malnutrition, appetite-suppression, dehydration, sarcopenia, and cachexia phenotypes after treatment initiation. A. Median tirzepatide treatment duration, defined as months from first to last recorded prescription, among initiators aged ≥65 years, stratified by baseline BMI (left) and by achieved weight-loss band (right). Within each stratification, three nested cohort definitions of increasing adherence stringency are overlaid, all applied to the same tirzepatide initiators: ≥1 prescription, ≥2 prescriptions within the 18-month observation window, and ≥3 prescriptions with no gap exceeding 90 days between consecutive fills. B. Median time from treatment index to first incident phenotype diagnosis for the tirzepatide, antidiabetic-drug comparator, and bariatric-surgery comparator cohorts. C. Interval from the last recorded tirzepatide prescription to first incident phenotype diagnosis by phenotype; values below 0 indicate that the phenotype was first recorded before the last prescription, consistent with onset during treatment (across-phenotype ANOVA P<0.001). D. Comparison of tirzepatide treatment duration among users who did versus did not develop each incident phenotype, with per-phenotype P-values from Wilcoxon rank-sum testing. Throughout, points represent medians and bars represent interquartile ranges; per-point sample sizes are shown where applicable.
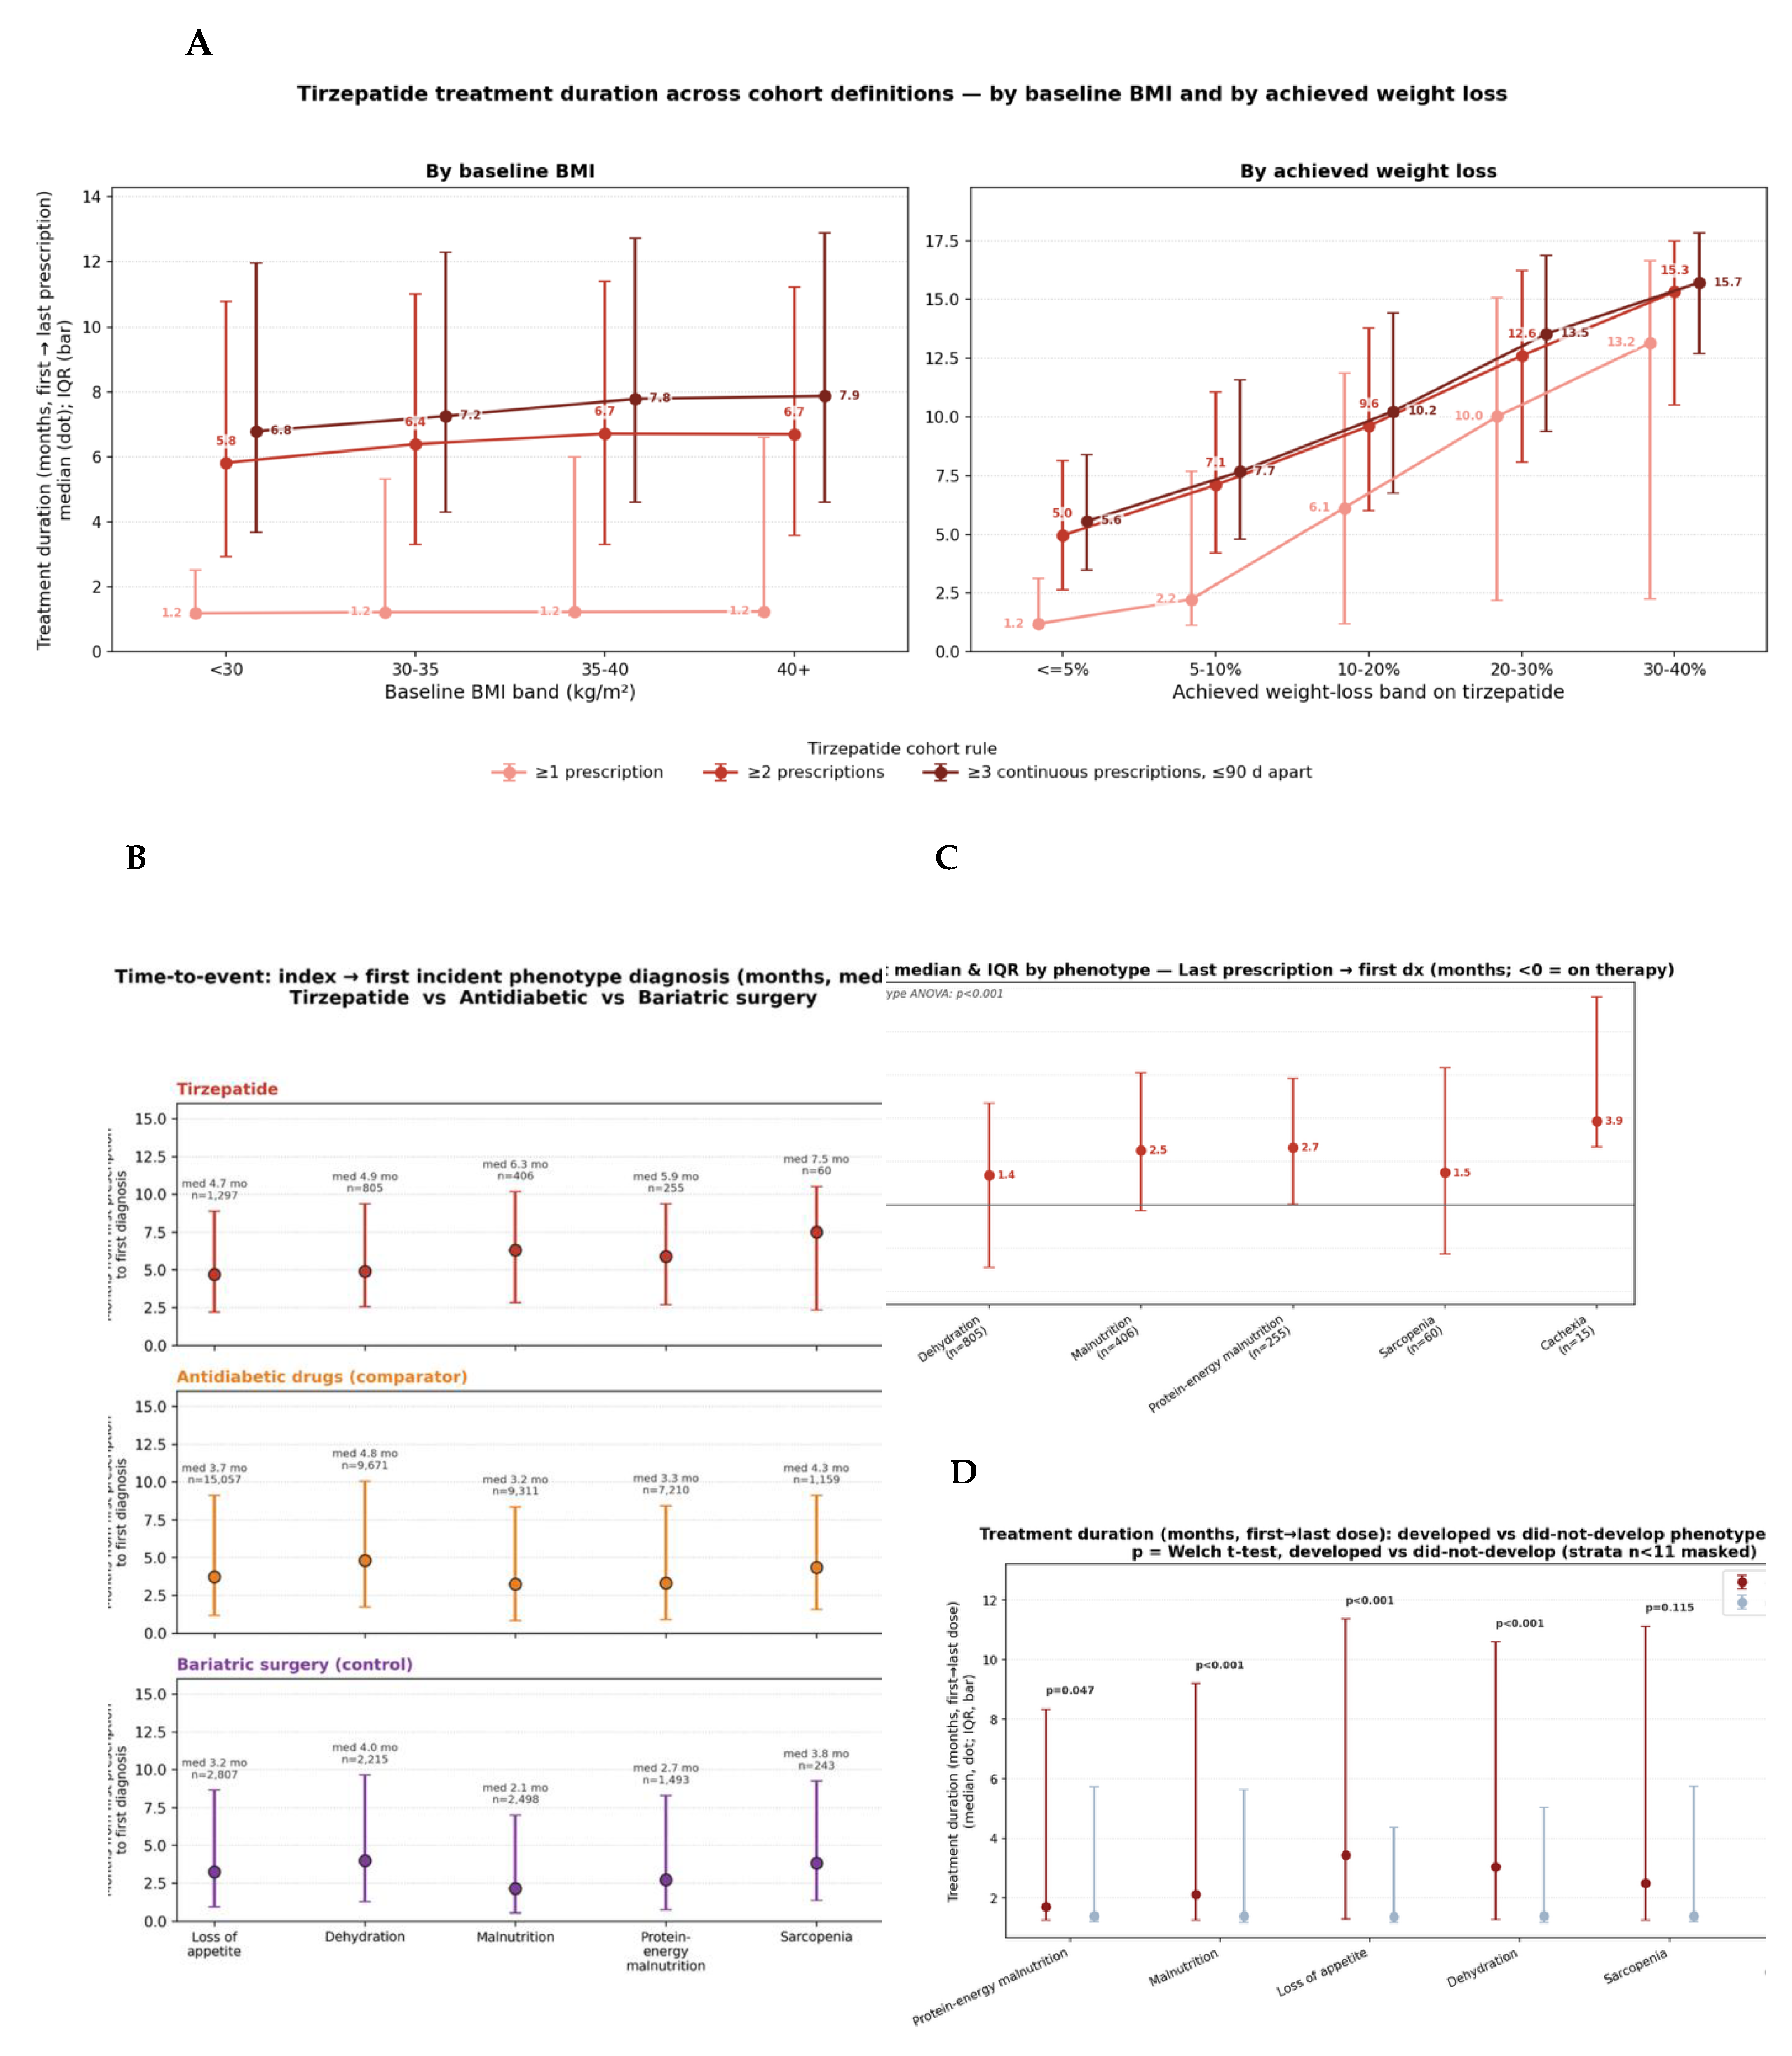
Figure 5.
Post-initiation mortality risk associated with incident frailty phenotypes among adults aged ≥65 years across three treatment cohorts. Forest plots show within-cohort mortality risk ratios (RRs) comparing patients who developed each incident phenotype with patients who did not develop that phenotype within the same treatment cohort. Shown are tirzepatide initiators (red), propensity score-matched bariatric surgery controls (purple), and propensity score-matched antidiabetic comparator users (orange). Adjacent columns report incident phenotype prevalence, mortality RRs with 95% confidence intervals, nominal P values, and false-discovery-rate (FDR) adjusted P values. Points indicate RRs, horizontal bars indicate 95% confidence intervals, and the x-axis is displayed on a logarithmic scale. RR is defined as mortality among phenotype developers divided by mortality among non-developers within the same treatment cohort. RR values greater than 1 indicate higher mortality among phenotype developers than among non-developers within the same treatment cohort and should not be interpreted as direct comparisons between treatment cohorts. Each comparator cohort was propensity score matched 1:1 to the tirzepatide cohort. Counts <11 were suppressed to preserve patient privacy. NE denotes not estimable. Counts <11 were suppressed to preserve patient privacy. NE denotes not estimable.
Figure 5.
Post-initiation mortality risk associated with incident frailty phenotypes among adults aged ≥65 years across three treatment cohorts. Forest plots show within-cohort mortality risk ratios (RRs) comparing patients who developed each incident phenotype with patients who did not develop that phenotype within the same treatment cohort. Shown are tirzepatide initiators (red), propensity score-matched bariatric surgery controls (purple), and propensity score-matched antidiabetic comparator users (orange). Adjacent columns report incident phenotype prevalence, mortality RRs with 95% confidence intervals, nominal P values, and false-discovery-rate (FDR) adjusted P values. Points indicate RRs, horizontal bars indicate 95% confidence intervals, and the x-axis is displayed on a logarithmic scale. RR is defined as mortality among phenotype developers divided by mortality among non-developers within the same treatment cohort. RR values greater than 1 indicate higher mortality among phenotype developers than among non-developers within the same treatment cohort and should not be interpreted as direct comparisons between treatment cohorts. Each comparator cohort was propensity score matched 1:1 to the tirzepatide cohort. Counts <11 were suppressed to preserve patient privacy. NE denotes not estimable. Counts <11 were suppressed to preserve patient privacy. NE denotes not estimable.
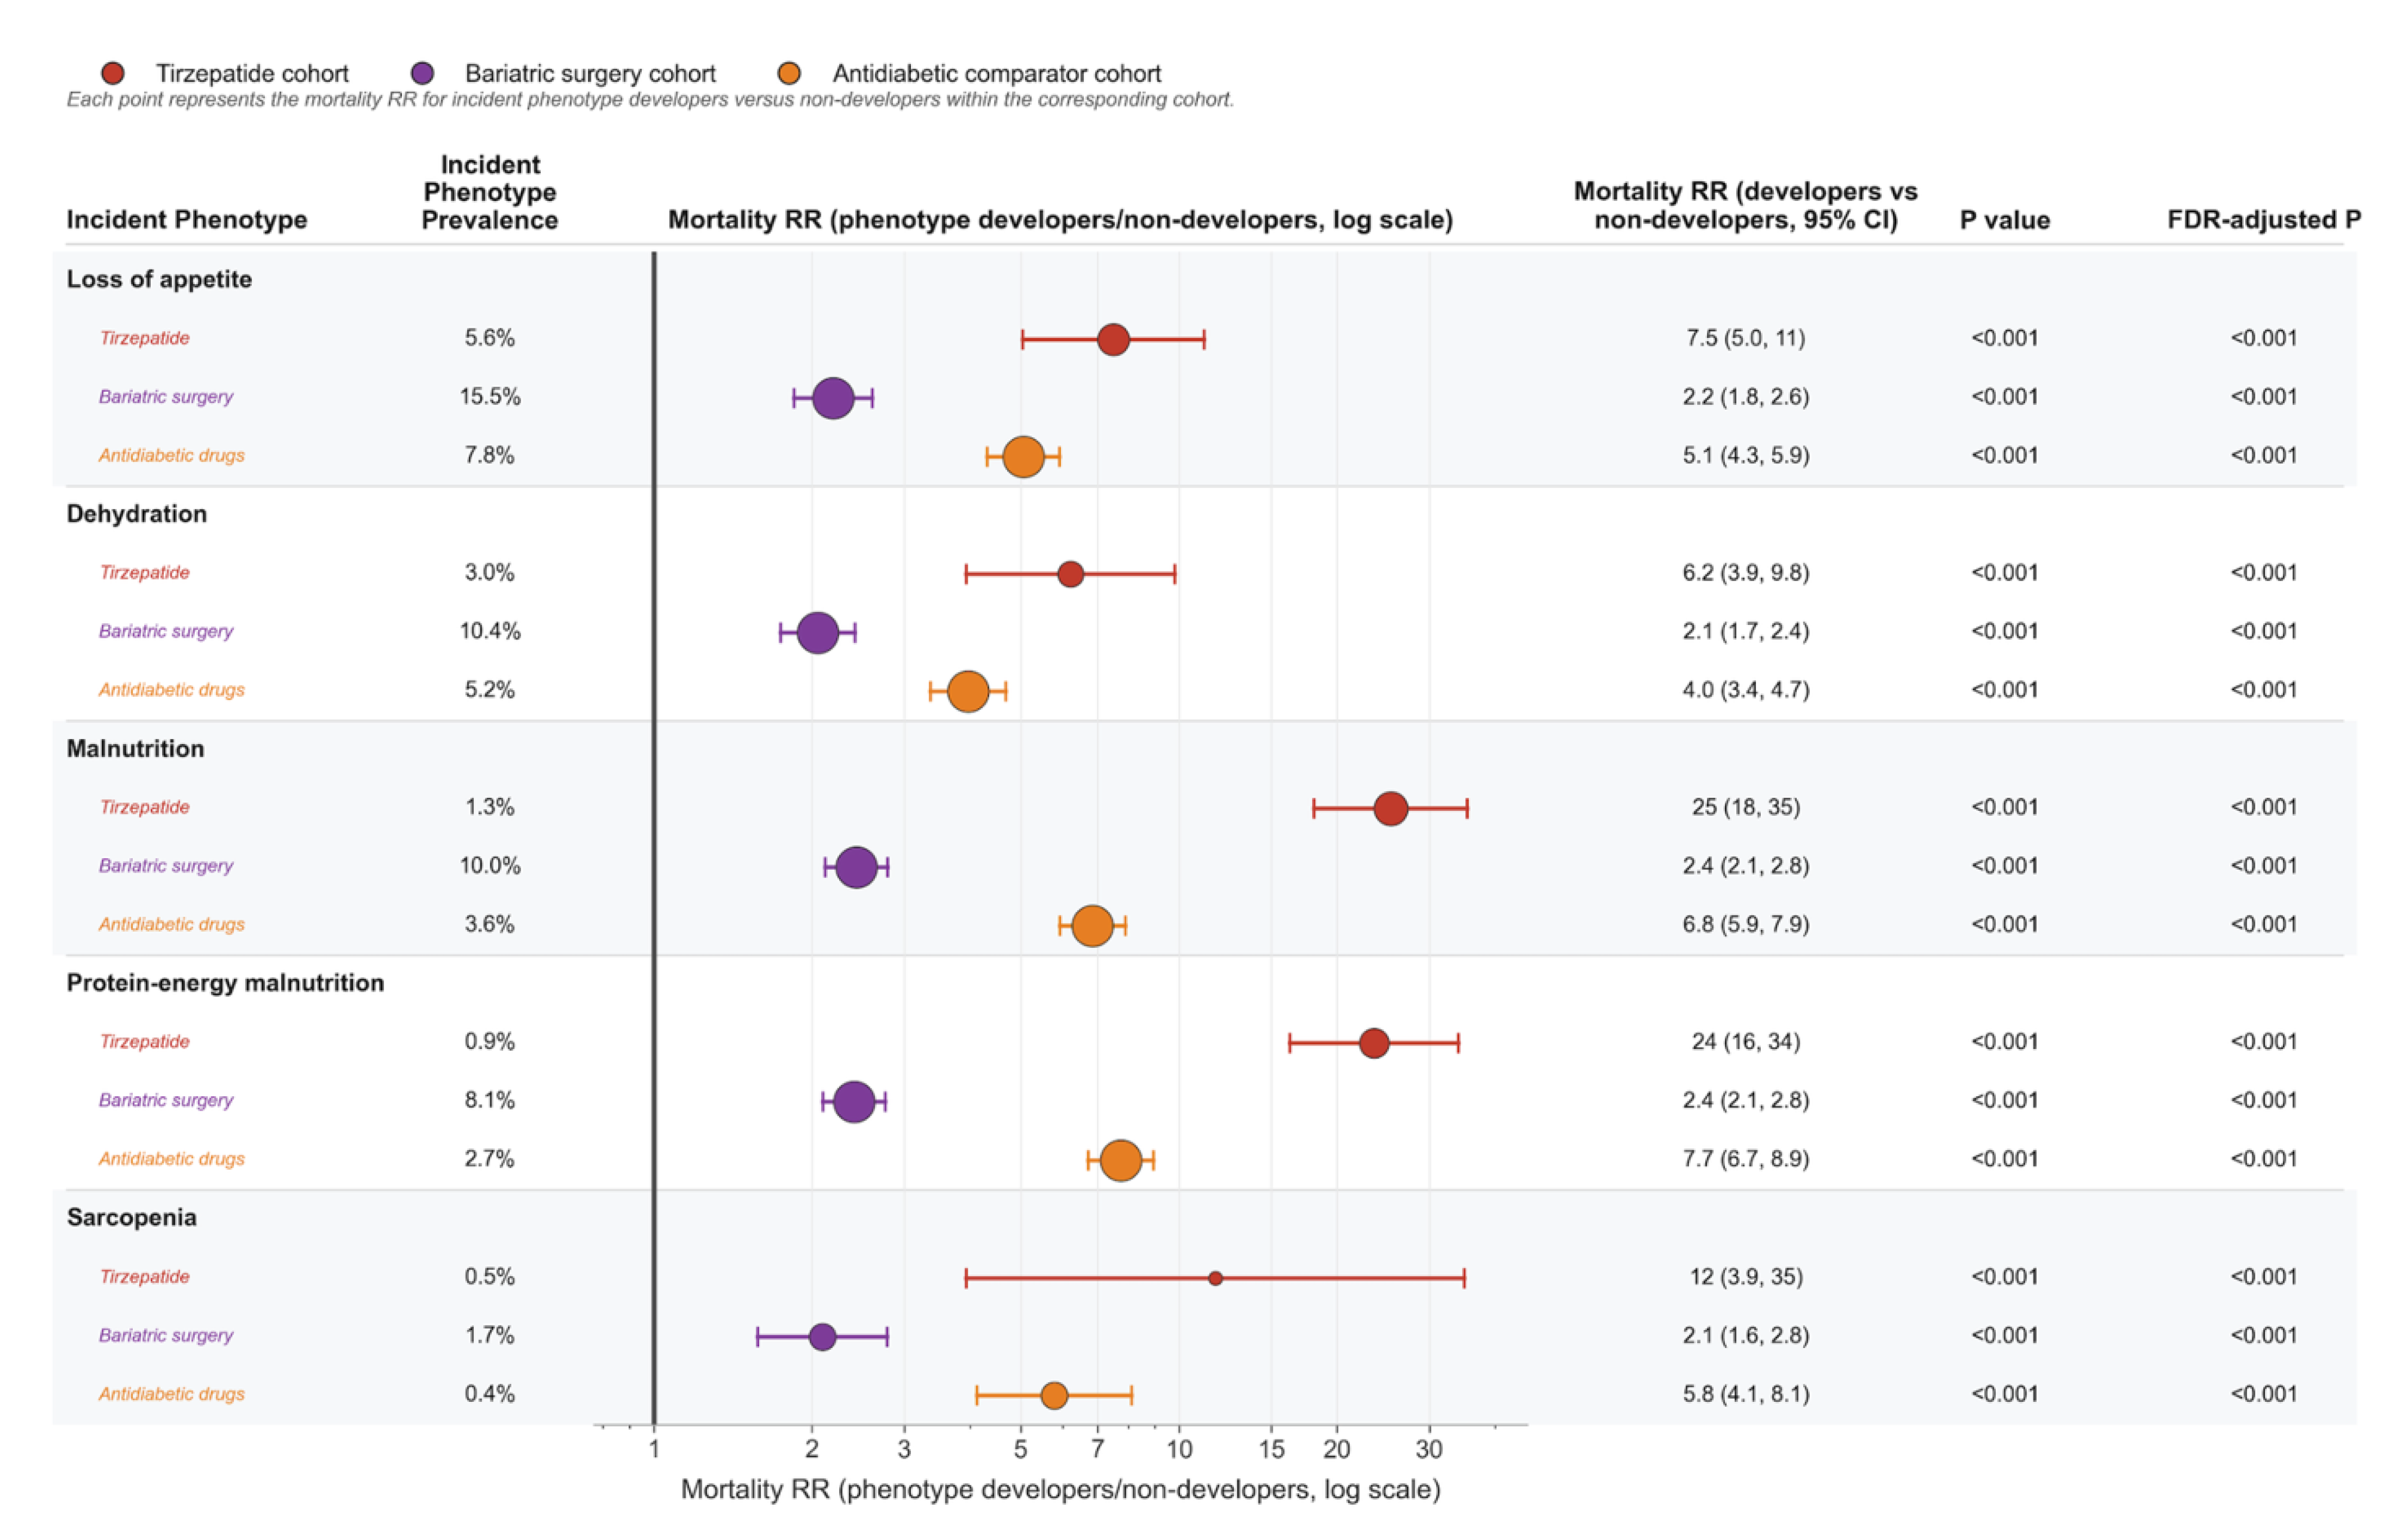
Figure 6.
Post-initiation ICU admission and hospitalization risk associated with incident nutrition/depletion phenotypes among adults aged ≥65 years across three treatment cohorts. (A) ICU admission. RR is defined as ICU admission among phenotype developers divided by ICU admission among non-developers within the same treatment cohort. (B) Hospitalization. RR is defined as hospitalization among phenotype developers divided by hospitalization among non-developers within the same treatment cohort. For both panels, forest plots show within-cohort risk ratios (RRs) comparing patients who developed each incident phenotype with patients who did not develop that phenotype within the same treatment cohort. Shown are tirzepatide initiators (red), propensity score-matched bariatric surgery controls (purple), and propensity score-matched antidiabetic comparator users (orange). Adjacent columns report incident phenotype prevalence, RRs with 95% confidence intervals, nominal P values, and false-discovery-rate (FDR) adjusted P values. Points indicate RRs, horizontal bars indicate 95% confidence intervals, and the x-axis is displayed on a logarithmic scale. RR values greater than 1 indicate higher ICU admission or hospitalization (as applicable) among phenotype developers than among non-developers within the same treatment cohort. Each comparator cohort was propensity matched 1:1 to the tirzepatide cohort. Counts <11 were suppressed to preserve patient privacy. NE denotes not estimable.
Figure 6.
Post-initiation ICU admission and hospitalization risk associated with incident nutrition/depletion phenotypes among adults aged ≥65 years across three treatment cohorts. (A) ICU admission. RR is defined as ICU admission among phenotype developers divided by ICU admission among non-developers within the same treatment cohort. (B) Hospitalization. RR is defined as hospitalization among phenotype developers divided by hospitalization among non-developers within the same treatment cohort. For both panels, forest plots show within-cohort risk ratios (RRs) comparing patients who developed each incident phenotype with patients who did not develop that phenotype within the same treatment cohort. Shown are tirzepatide initiators (red), propensity score-matched bariatric surgery controls (purple), and propensity score-matched antidiabetic comparator users (orange). Adjacent columns report incident phenotype prevalence, RRs with 95% confidence intervals, nominal P values, and false-discovery-rate (FDR) adjusted P values. Points indicate RRs, horizontal bars indicate 95% confidence intervals, and the x-axis is displayed on a logarithmic scale. RR values greater than 1 indicate higher ICU admission or hospitalization (as applicable) among phenotype developers than among non-developers within the same treatment cohort. Each comparator cohort was propensity matched 1:1 to the tirzepatide cohort. Counts <11 were suppressed to preserve patient privacy. NE denotes not estimable.
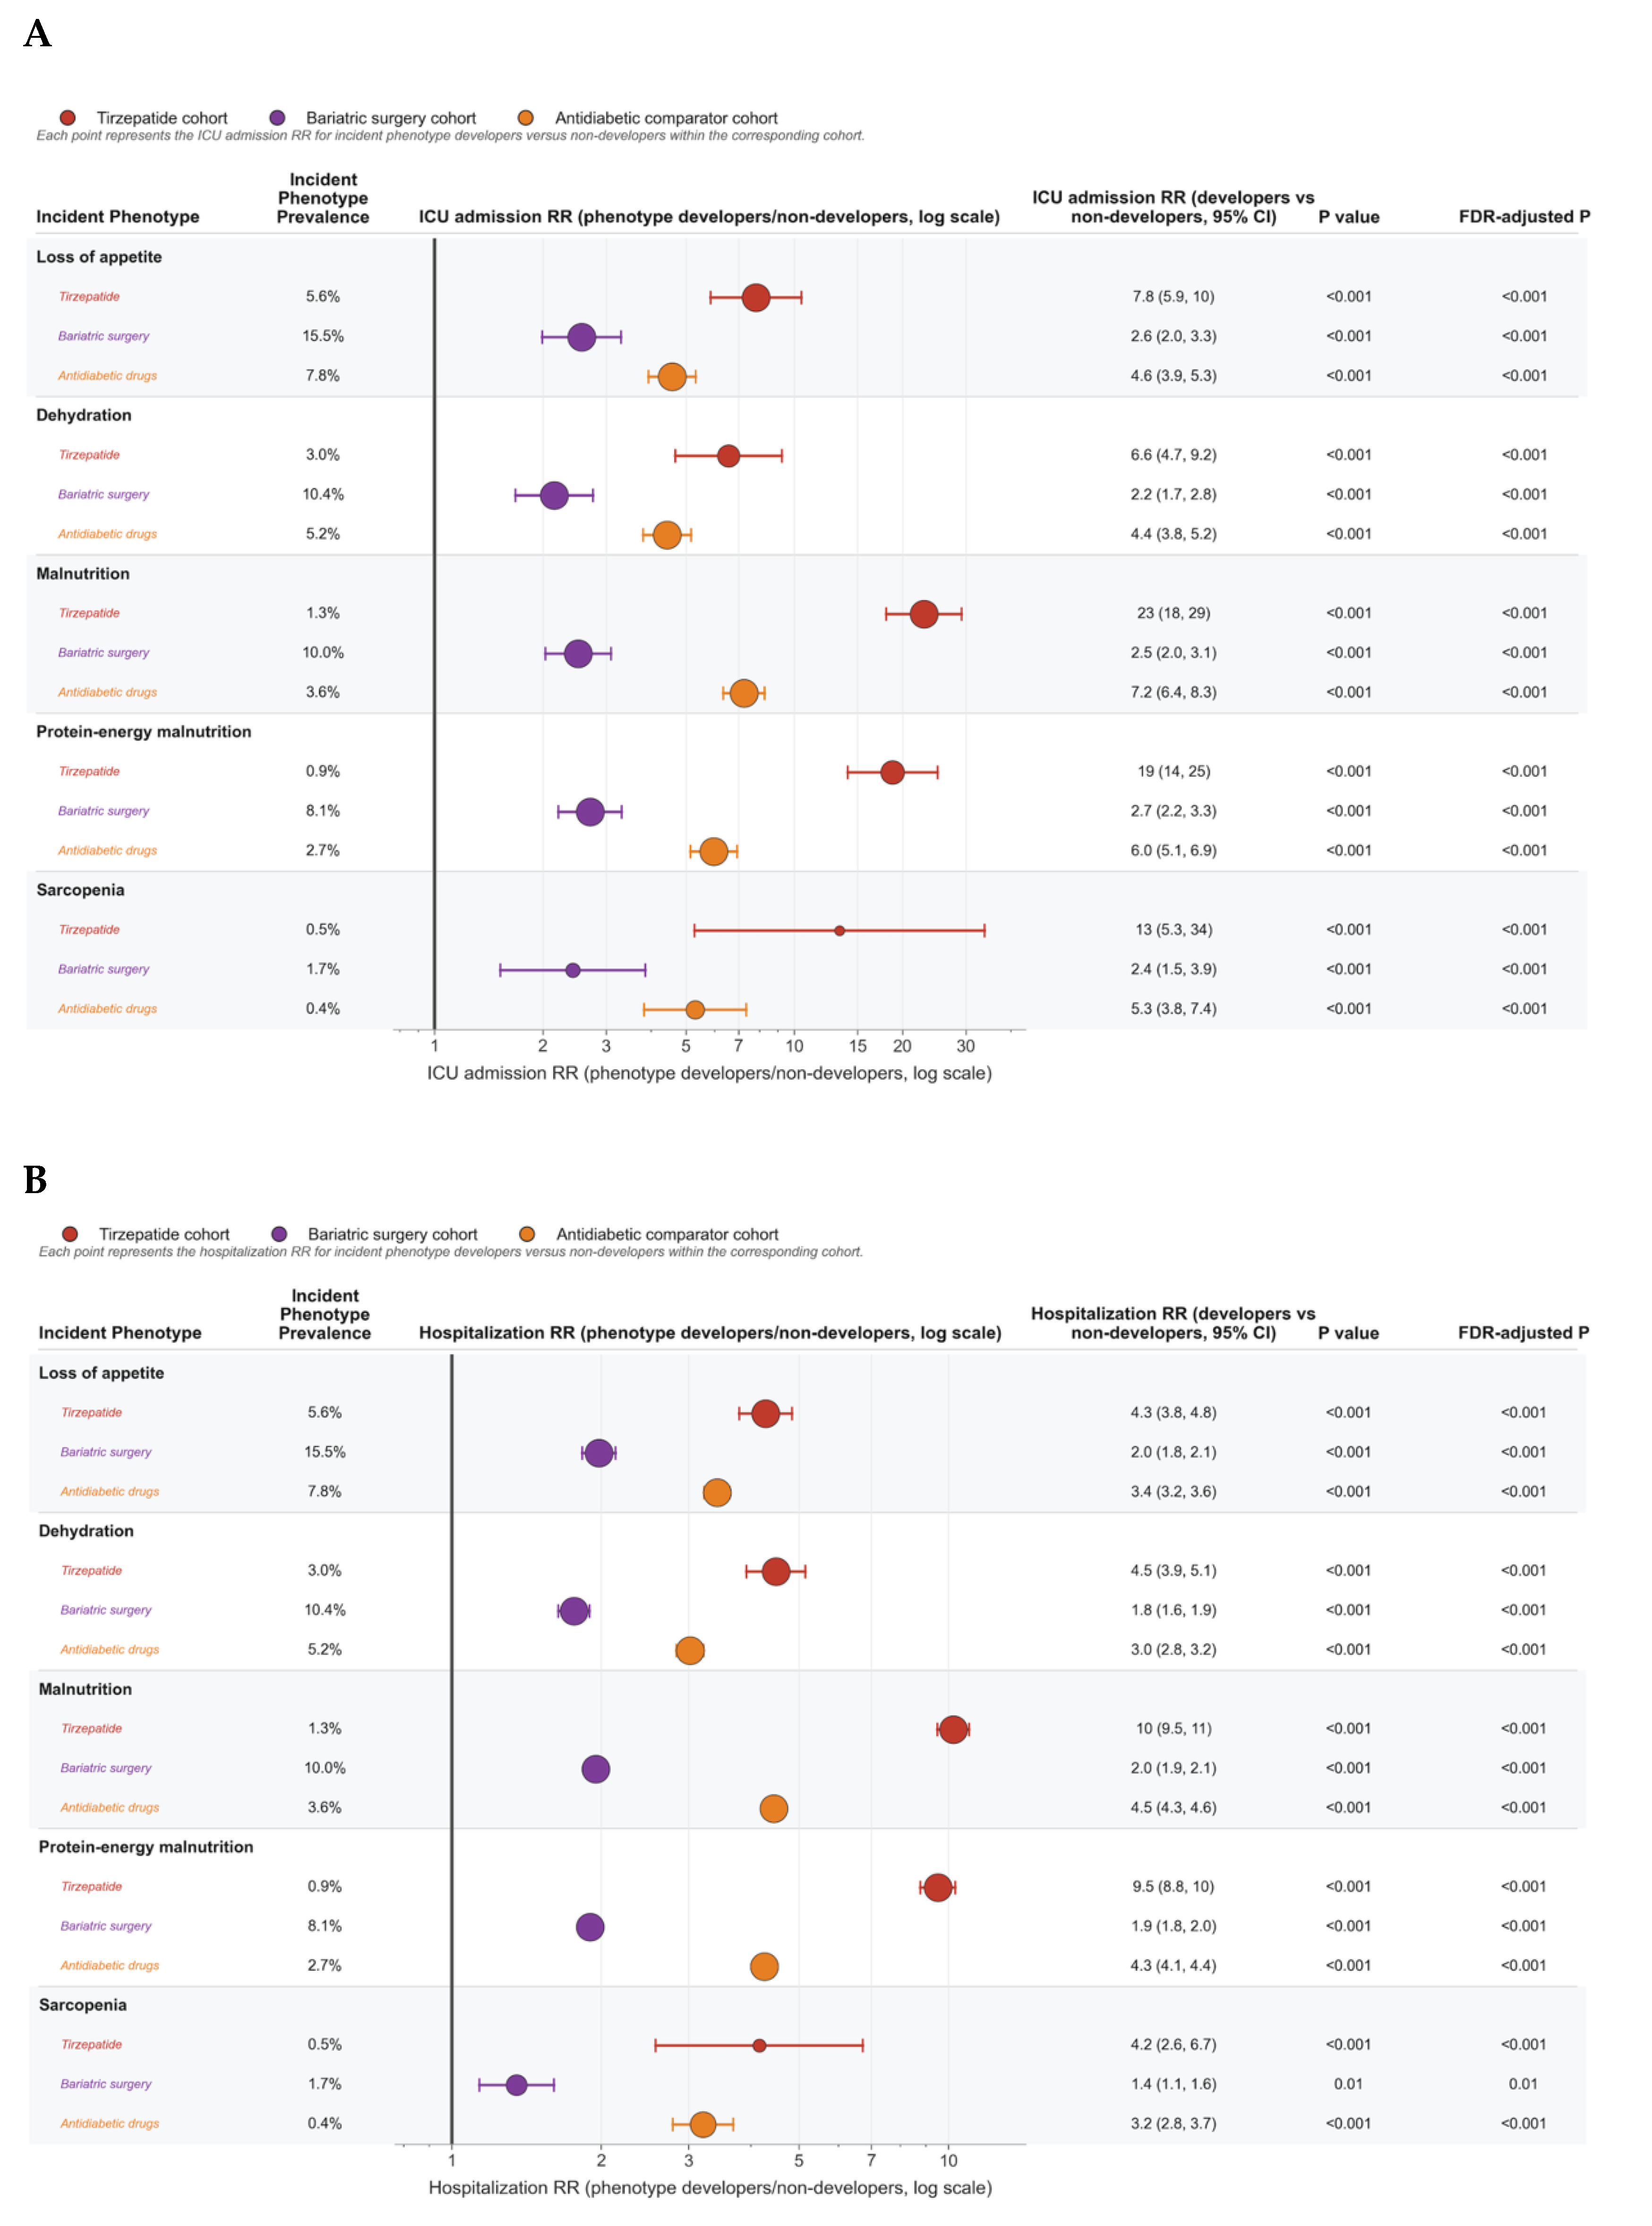
Figure 7.
Mortality, ICU admission, and hospitalization risk associated with incident nutrition/depletion phenotypes among tirzepatide initiators aged ≥65 years, stratified by achieved tirzepatide-associated weight loss (≤5%, 5–10%, 10–20%, 20–30%, 30–40%). (A) Mortality. RR is defined as mortality among phenotype developers divided by mortality among non-developers within the same weight-loss band. (B) ICU admission. RR is defined as ICU admission among phenotype developers divided by ICU admission among non-developers within the same weight-loss band. (C) Hospitalization. RR is defined as hospitalization among phenotype developers divided by hospitalization among non-developers within the same weight-loss band. For all panels, forest plots show within-band risk ratios (RRs) comparing tirzepatide-treated patients who developed each incident phenotype with those who did not develop that phenotype, within the same weight-loss band. RR values greater than 1 indicate higher mortality, ICU admission, or hospitalization (as applicable) among phenotype developers than among non-developers within the same weight-loss band.
Figure 7.
Mortality, ICU admission, and hospitalization risk associated with incident nutrition/depletion phenotypes among tirzepatide initiators aged ≥65 years, stratified by achieved tirzepatide-associated weight loss (≤5%, 5–10%, 10–20%, 20–30%, 30–40%). (A) Mortality. RR is defined as mortality among phenotype developers divided by mortality among non-developers within the same weight-loss band. (B) ICU admission. RR is defined as ICU admission among phenotype developers divided by ICU admission among non-developers within the same weight-loss band. (C) Hospitalization. RR is defined as hospitalization among phenotype developers divided by hospitalization among non-developers within the same weight-loss band. For all panels, forest plots show within-band risk ratios (RRs) comparing tirzepatide-treated patients who developed each incident phenotype with those who did not develop that phenotype, within the same weight-loss band. RR values greater than 1 indicate higher mortality, ICU admission, or hospitalization (as applicable) among phenotype developers than among non-developers within the same weight-loss band.
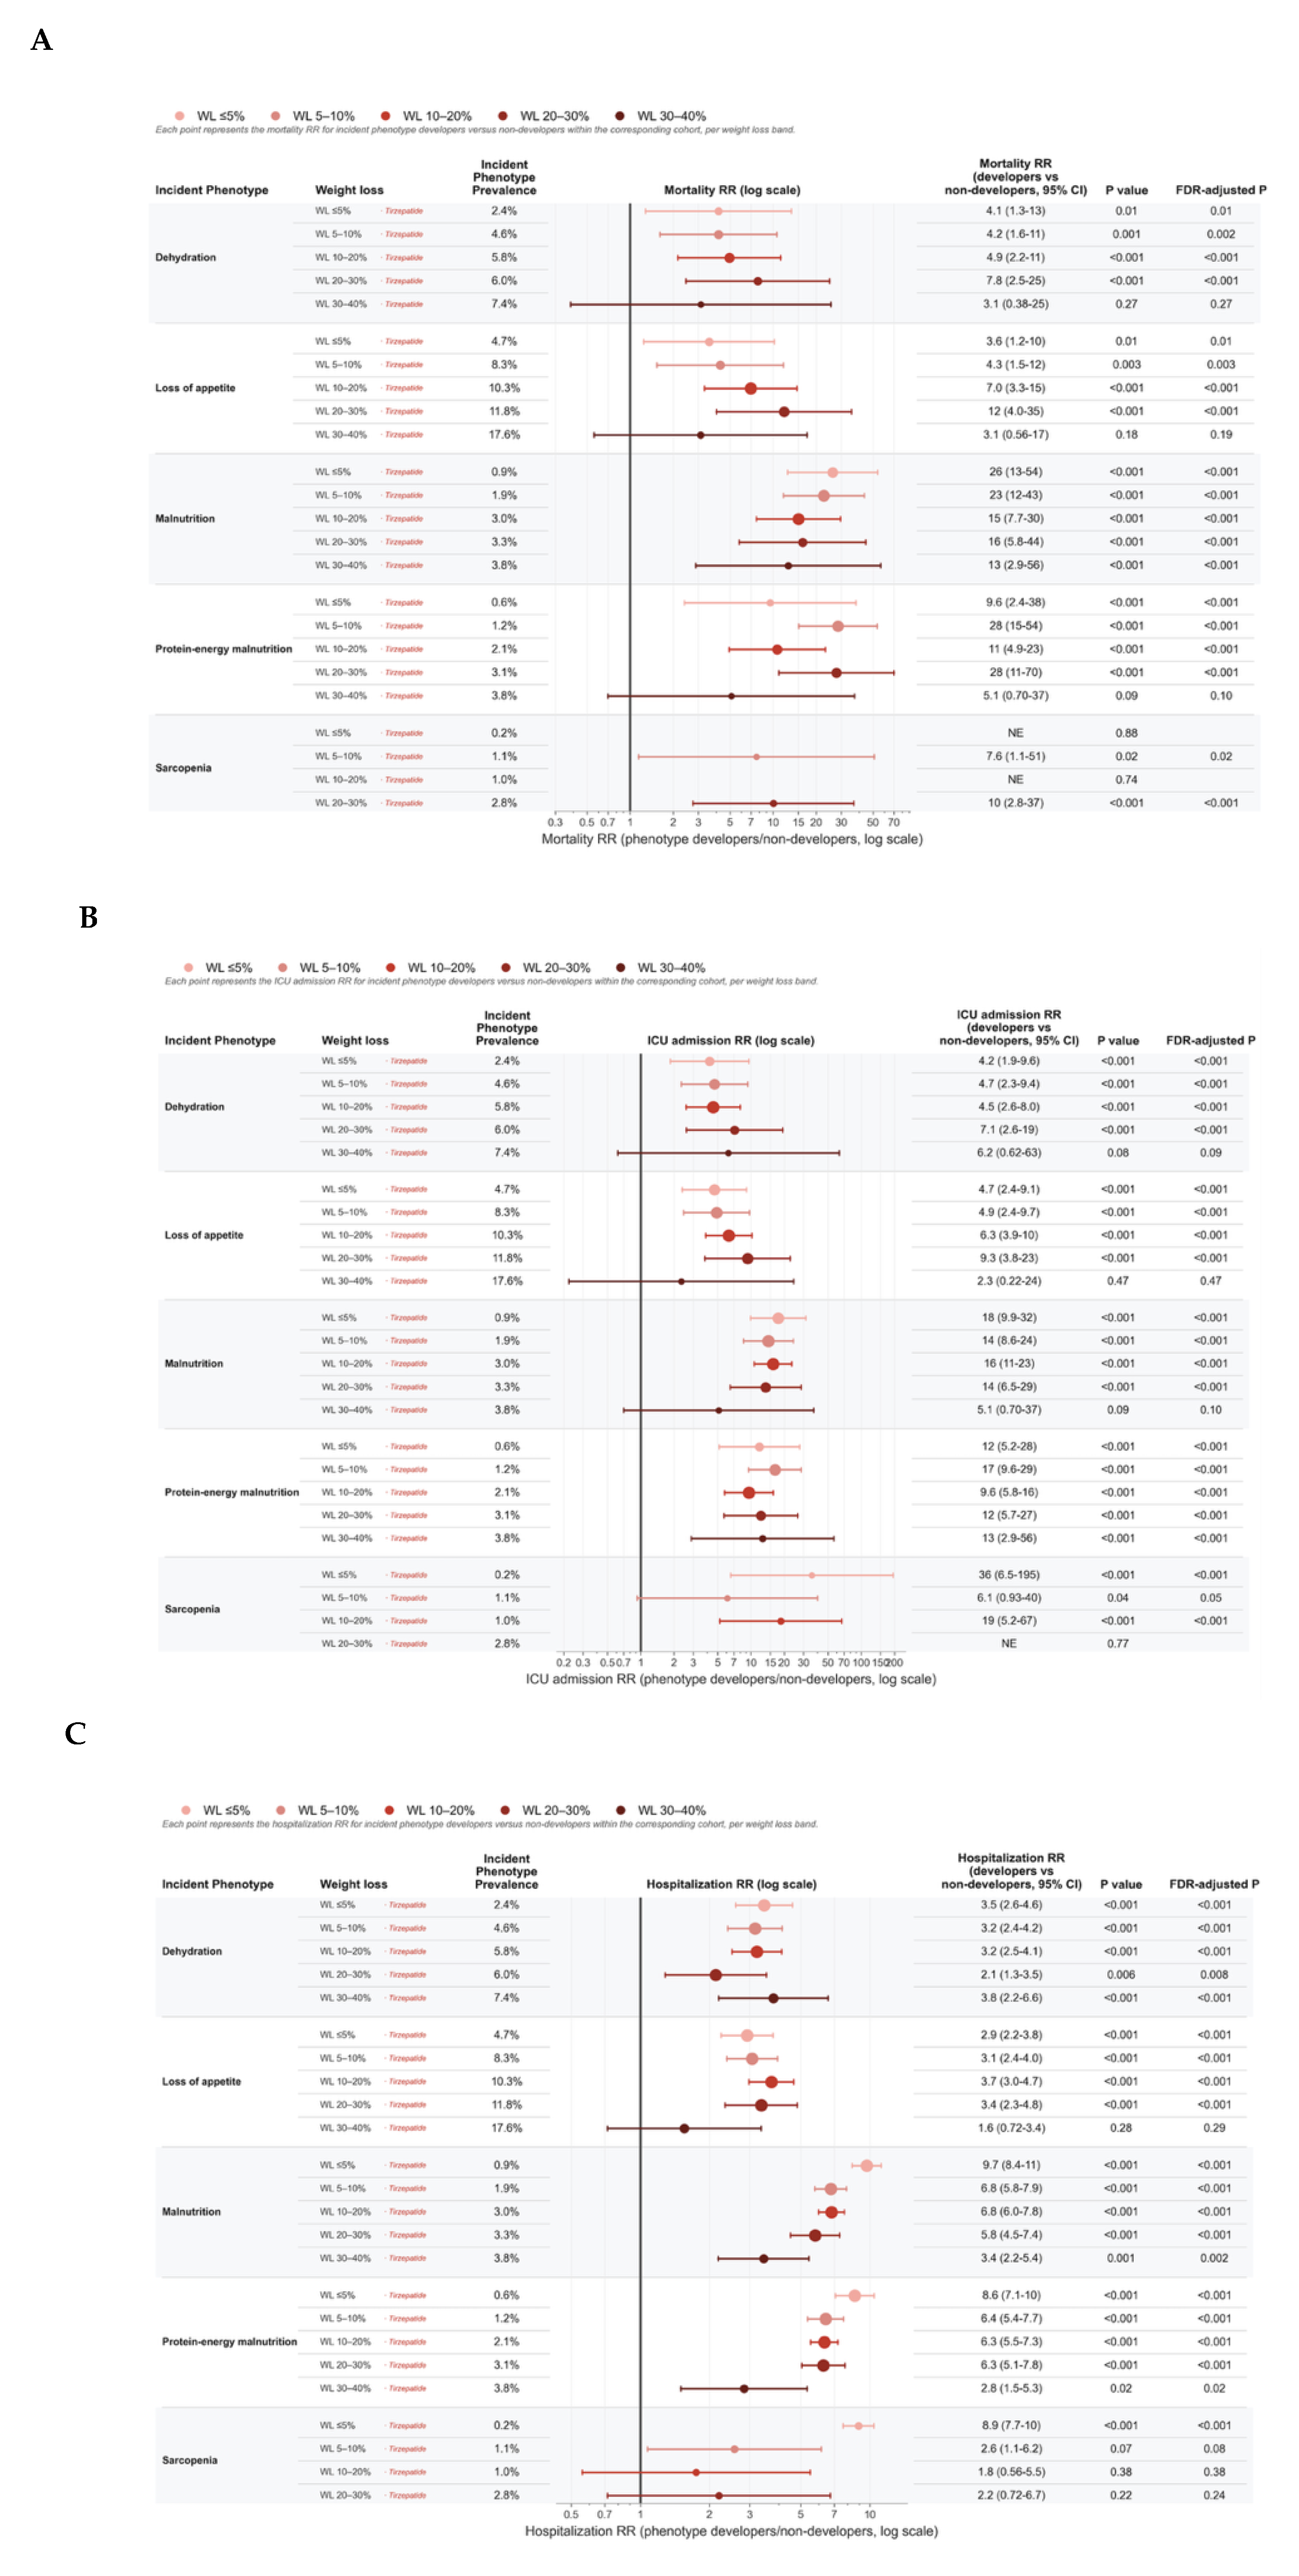
Figure 8.
Post-initiation mortality by incident nutrition/depletion phenotype among tirzepatide initiators aged ≥65 years, stratified by baseline BMI. RR is defined as mortality among phenotype developers divided by mortality among non-developers within the same BMI stratum. Forest plot shows post-initiation mortality risk ratios (RRs) within tirzepatide initiators, comparing patients who developed each incident phenotype with those who did not develop that phenotype within the same BMI stratum. Phenotypes are grouped by source, diagnosis codes or AI-curated notes, and repeated across BMI strata: <30, 30–35, 35–40, and 40+. Points denote mortality RR on a log scale, horizontal bars show 95% confidence intervals, and point color indicates BMI stratum. Right-side columns show phenotype-positive deaths/N, phenotype-positive mortality percentage, RR with 95% CI, and raw P value for the within-stratum comparison against non-developers. RR values greater than 1 indicate higher mortality among phenotype developers than among non-developers within the same BMI stratum; within-stratum RRs are descriptive and should not be interpreted as direct comparisons across BMI strata. Exact death counts <11 are masked to preserve patient privacy. "NE" indicates estimates that were not estimable because of zero or insufficient events.
Figure 8.
Post-initiation mortality by incident nutrition/depletion phenotype among tirzepatide initiators aged ≥65 years, stratified by baseline BMI. RR is defined as mortality among phenotype developers divided by mortality among non-developers within the same BMI stratum. Forest plot shows post-initiation mortality risk ratios (RRs) within tirzepatide initiators, comparing patients who developed each incident phenotype with those who did not develop that phenotype within the same BMI stratum. Phenotypes are grouped by source, diagnosis codes or AI-curated notes, and repeated across BMI strata: <30, 30–35, 35–40, and 40+. Points denote mortality RR on a log scale, horizontal bars show 95% confidence intervals, and point color indicates BMI stratum. Right-side columns show phenotype-positive deaths/N, phenotype-positive mortality percentage, RR with 95% CI, and raw P value for the within-stratum comparison against non-developers. RR values greater than 1 indicate higher mortality among phenotype developers than among non-developers within the same BMI stratum; within-stratum RRs are descriptive and should not be interpreted as direct comparisons across BMI strata. Exact death counts <11 are masked to preserve patient privacy. "NE" indicates estimates that were not estimable because of zero or insufficient events.
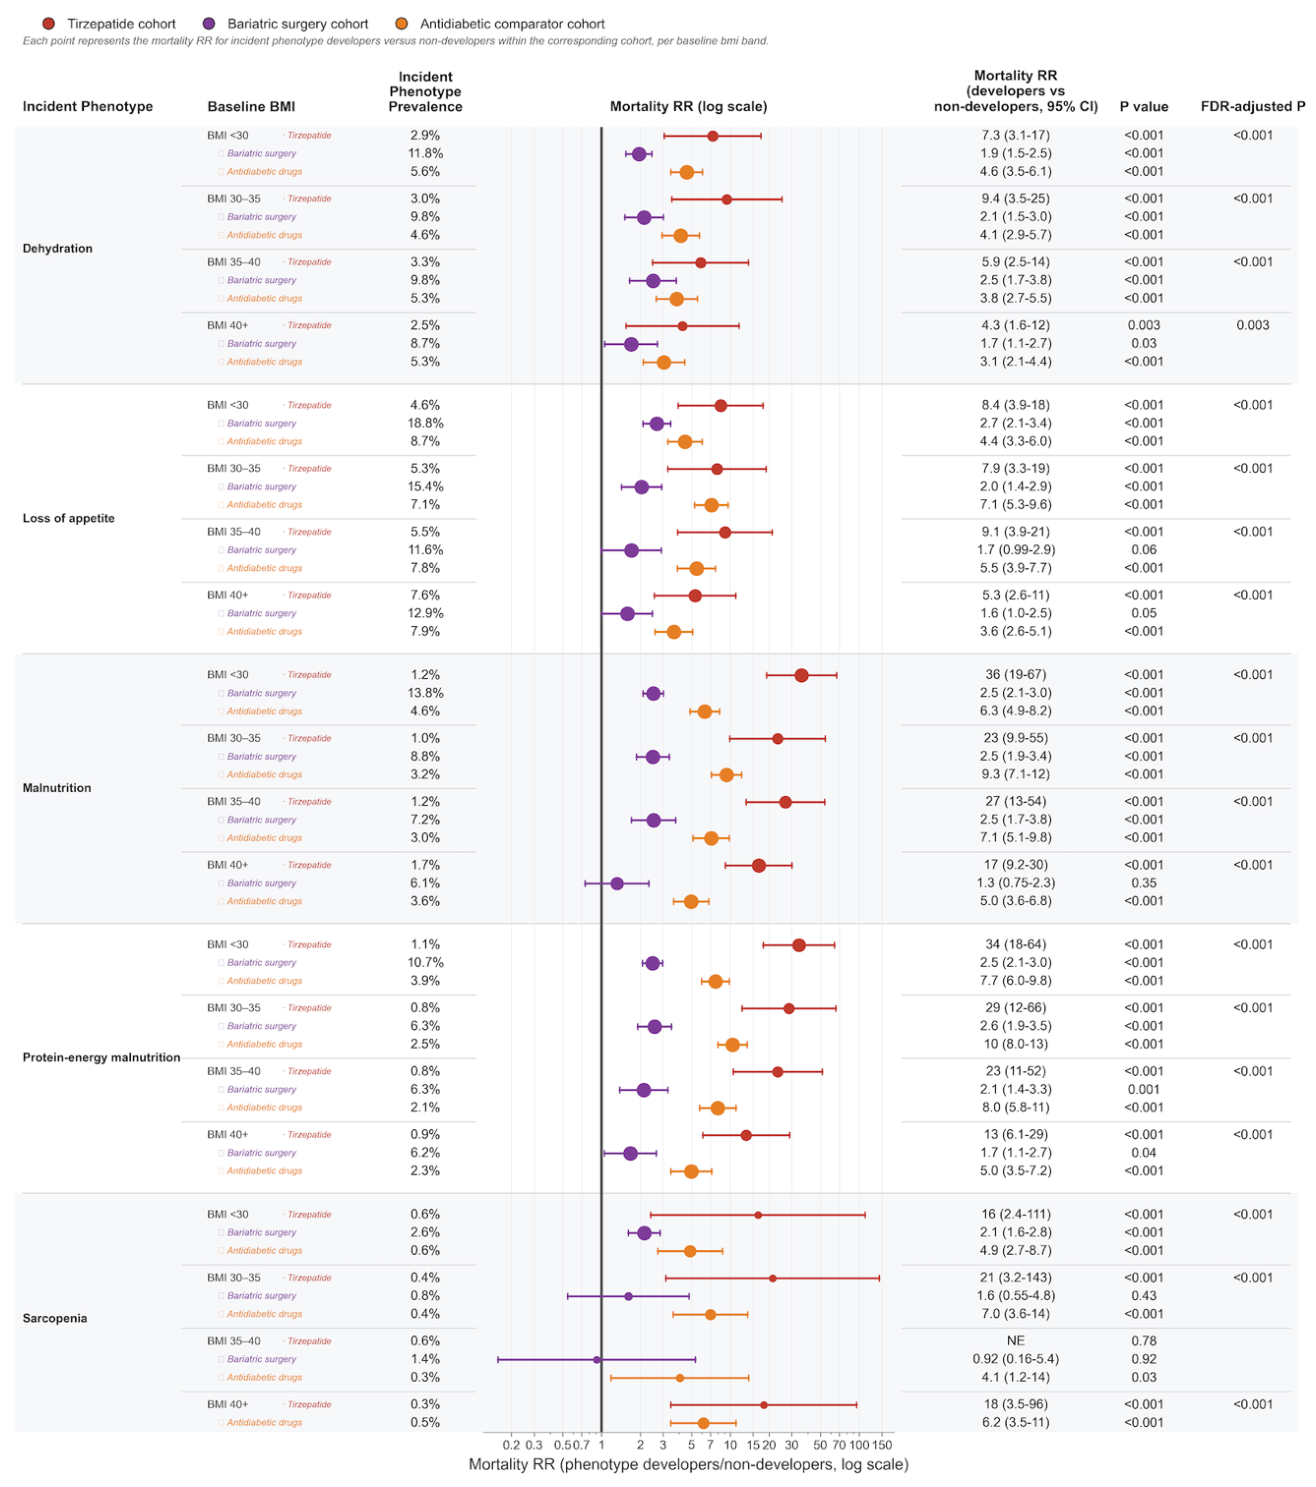
Figure 9.
Post-initiation ICU admissions by incident nutrition/depletion phenotype among tirzepatide initiators aged ≥65 years, stratified by baseline BMI. RR is defined as ICU admission among phenotype developers divided by ICU admission among non-developers within the same BMI stratum. Forest plot shows post-initiation ICU admission risk ratios (RRs) within tirzepatide initiators, comparing patients who developed each incident phenotype with those who did not develop that phenotype within the same BMI stratum. Phenotypes are grouped by source, diagnosis codes or AI-curated notes, and repeated across BMI strata: <30, 30–35, 35–40, and 40+. Points denote ICU admission RR on a log scale, horizontal bars show 95% confidence intervals, and point color indicates BMI stratum. Right-side columns show phenotype-positive ICU admissions/N, phenotype-positive ICU admission percentage, RR with 95% CI, and raw P value for the within-stratum comparison against non-developers. RR values greater than 1 indicate higher ICU admission among phenotype developers than among non-developers within the same BMI stratum; within-stratum RRs are descriptive and should not be interpreted as direct comparisons across BMI strata. Exact ICU admission counts <11 are masked to preserve patient privacy. "NE" indicates estimates that were not estimable because of zero or insufficient events.
Figure 9.
Post-initiation ICU admissions by incident nutrition/depletion phenotype among tirzepatide initiators aged ≥65 years, stratified by baseline BMI. RR is defined as ICU admission among phenotype developers divided by ICU admission among non-developers within the same BMI stratum. Forest plot shows post-initiation ICU admission risk ratios (RRs) within tirzepatide initiators, comparing patients who developed each incident phenotype with those who did not develop that phenotype within the same BMI stratum. Phenotypes are grouped by source, diagnosis codes or AI-curated notes, and repeated across BMI strata: <30, 30–35, 35–40, and 40+. Points denote ICU admission RR on a log scale, horizontal bars show 95% confidence intervals, and point color indicates BMI stratum. Right-side columns show phenotype-positive ICU admissions/N, phenotype-positive ICU admission percentage, RR with 95% CI, and raw P value for the within-stratum comparison against non-developers. RR values greater than 1 indicate higher ICU admission among phenotype developers than among non-developers within the same BMI stratum; within-stratum RRs are descriptive and should not be interpreted as direct comparisons across BMI strata. Exact ICU admission counts <11 are masked to preserve patient privacy. "NE" indicates estimates that were not estimable because of zero or insufficient events.
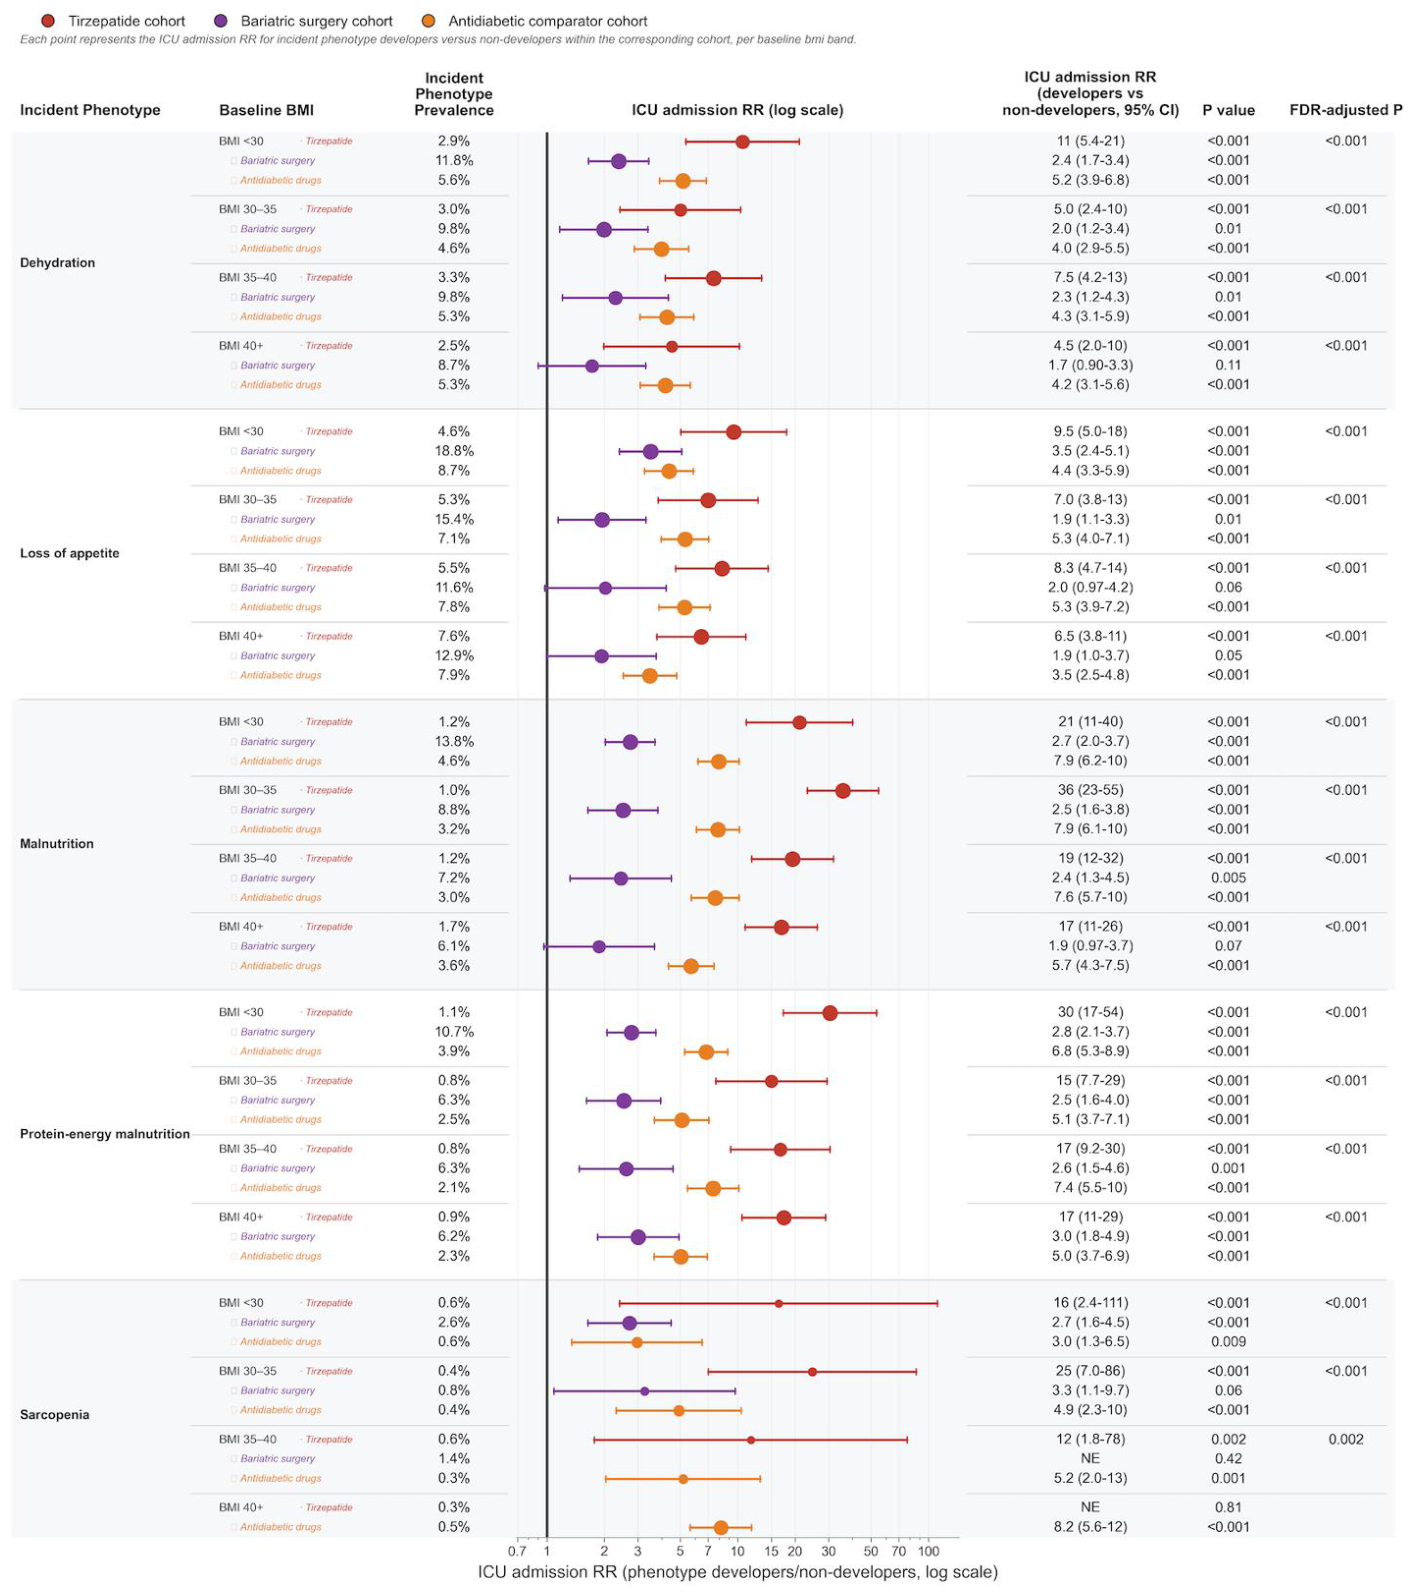
Figure 10.
Post-initiation hospitalization admissions by incident nutrition/depletion phenotype among tirzepatide initiators aged ≥65 years, stratified by baseline BMI. RR is defined as hospitalization among phenotype developers divided by hospitalization among non-developers within the same BMI stratum. Forest plot shows post-initiation hospitalization risk ratios (RRs) within tirzepatide initiators, comparing patients who developed each incident phenotype with those who did not develop that phenotype within the same BMI stratum. Phenotypes are grouped by source, diagnosis codes or AI-curated notes, and repeated across BMI strata: <30, 30–35, 35–40, and 40+. Points denote hospitalization RR on a log scale, horizontal bars show 95% confidence intervals, and point color indicates BMI stratum. Right-side columns show phenotype-positive hospitalizations/N, phenotype-positive hospitalization percentage, RR with 95% CI, and raw P value for the within-stratum comparison against non-developers. RR values greater than 1 indicate higher hospitalization among phenotype developers than among non-developers within the same BMI stratum; within-stratum RRs are descriptive and should not be interpreted as direct comparisons across BMI strata. Exact hospitalization counts <11 are masked to preserve patient privacy. "NE" indicates estimates that were not estimable because of zero or insufficient events.
Figure 10.
Post-initiation hospitalization admissions by incident nutrition/depletion phenotype among tirzepatide initiators aged ≥65 years, stratified by baseline BMI. RR is defined as hospitalization among phenotype developers divided by hospitalization among non-developers within the same BMI stratum. Forest plot shows post-initiation hospitalization risk ratios (RRs) within tirzepatide initiators, comparing patients who developed each incident phenotype with those who did not develop that phenotype within the same BMI stratum. Phenotypes are grouped by source, diagnosis codes or AI-curated notes, and repeated across BMI strata: <30, 30–35, 35–40, and 40+. Points denote hospitalization RR on a log scale, horizontal bars show 95% confidence intervals, and point color indicates BMI stratum. Right-side columns show phenotype-positive hospitalizations/N, phenotype-positive hospitalization percentage, RR with 95% CI, and raw P value for the within-stratum comparison against non-developers. RR values greater than 1 indicate higher hospitalization among phenotype developers than among non-developers within the same BMI stratum; within-stratum RRs are descriptive and should not be interpreted as direct comparisons across BMI strata. Exact hospitalization counts <11 are masked to preserve patient privacy. "NE" indicates estimates that were not estimable because of zero or insufficient events.
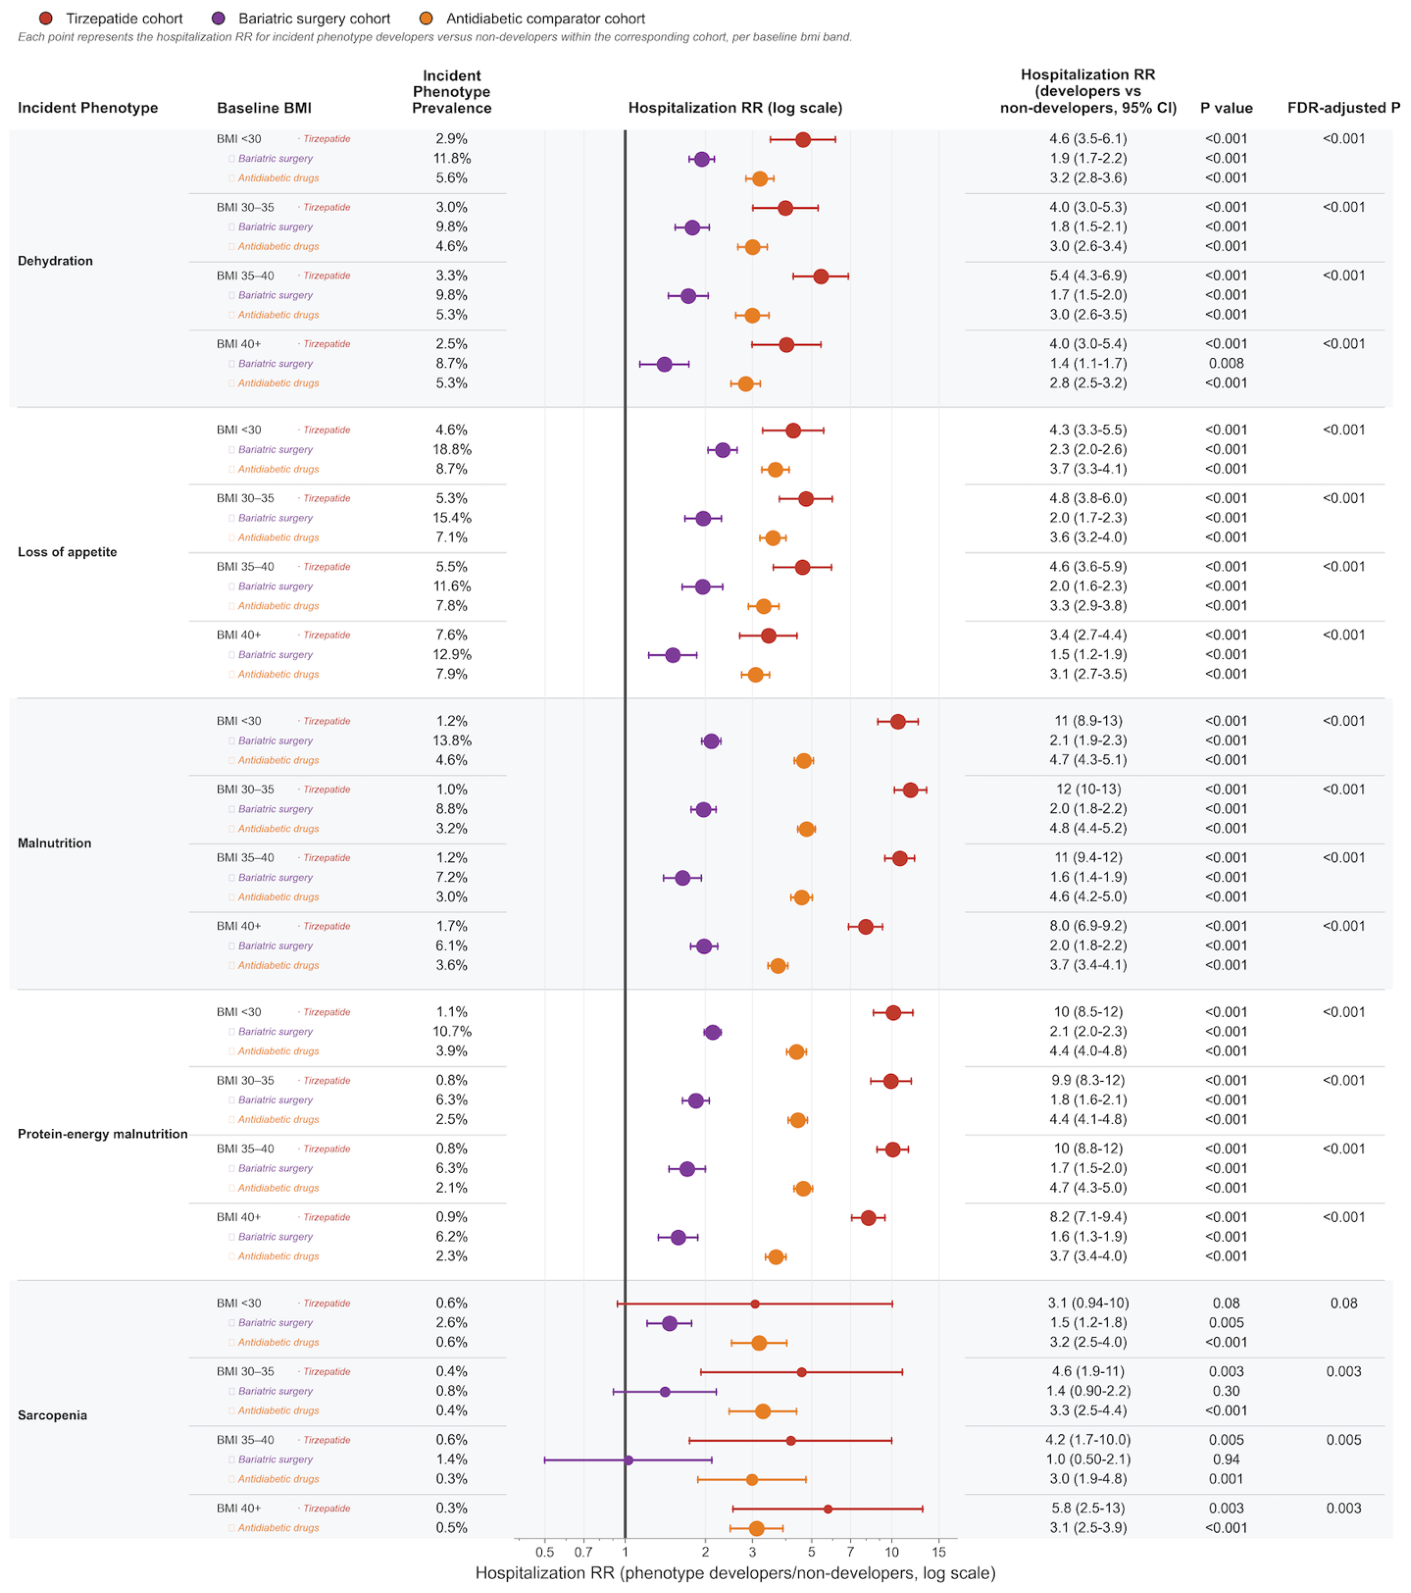
Figure 11.
Treatment duration and clinical outcomes by baseline BMI and achieved weight loss among tirzepatide initiators aged ≥65 years. Panel A shows median treatment duration, defined as months from first to last recorded tirzepatide prescription, across baseline BMI and achieved weight-loss strata. Panels B, C, and D show crude mortality, ICU admission, and hospitalization percentages, respectively, within the same BMI-by-weight-loss strata; cell labels show the outcome percentage and the number of patients in that stratum. Blank cells indicate sparse or unavailable strata. The red outline denotes the Frailty Surveillance Zone, defined as lower baseline BMI (<30 kg/m²) with ≥10% achieved weight loss, a subgroup characterized by substantial weight loss despite lower baseline body mass and warranting closer nutrition, hydration, and frailty assessment. The green outline denotes the Medicare GLP-1 Bridge Population as operationalized by age ≥65 years and BMI ≥30 kg/m² in this analysis; formal Bridge eligibility also depends on coverage and clinical criteria.
Figure 11.
Treatment duration and clinical outcomes by baseline BMI and achieved weight loss among tirzepatide initiators aged ≥65 years. Panel A shows median treatment duration, defined as months from first to last recorded tirzepatide prescription, across baseline BMI and achieved weight-loss strata. Panels B, C, and D show crude mortality, ICU admission, and hospitalization percentages, respectively, within the same BMI-by-weight-loss strata; cell labels show the outcome percentage and the number of patients in that stratum. Blank cells indicate sparse or unavailable strata. The red outline denotes the Frailty Surveillance Zone, defined as lower baseline BMI (<30 kg/m²) with ≥10% achieved weight loss, a subgroup characterized by substantial weight loss despite lower baseline body mass and warranting closer nutrition, hydration, and frailty assessment. The green outline denotes the Medicare GLP-1 Bridge Population as operationalized by age ≥65 years and BMI ≥30 kg/m² in this analysis; formal Bridge eligibility also depends on coverage and clinical criteria.

Figure 12.
Treatment interval from last tirzepatide prescription to clinical outcomes and cause-of-death patterns among adults aged ≥65 years. Panel A shows the interval from the last recorded tirzepatide prescription to death, ICU admission, and hospitalization, stratified by baseline BMI (top row) and by achieved weight-loss category (bottom row). Points indicate median months, and vertical bars indicate the interquartile range (IQR). Sample sizes are shown below each category. Overall comparisons across strata were performed by analysis of variance (ANOVA), and selected pairwise comparisons are annotated. Panel B summarizes physician-reviewed cause-of-death categories among decedents with incident malnutrition (N=75), protein-energy malnutrition (PEM; N=48), dehydration (N=35), and anorexia (N=33) after tirzepatide initiation. Cell labels show the number and within-phenotype percentage of decedents with each cause-of-death category; shading reflects within-phenotype prevalence. Cause-of-death categories are not mutually exclusive. Counts <11 are masked to preserve patient privacy.
Figure 12.
Treatment interval from last tirzepatide prescription to clinical outcomes and cause-of-death patterns among adults aged ≥65 years. Panel A shows the interval from the last recorded tirzepatide prescription to death, ICU admission, and hospitalization, stratified by baseline BMI (top row) and by achieved weight-loss category (bottom row). Points indicate median months, and vertical bars indicate the interquartile range (IQR). Sample sizes are shown below each category. Overall comparisons across strata were performed by analysis of variance (ANOVA), and selected pairwise comparisons are annotated. Panel B summarizes physician-reviewed cause-of-death categories among decedents with incident malnutrition (N=75), protein-energy malnutrition (PEM; N=48), dehydration (N=35), and anorexia (N=33) after tirzepatide initiation. Cell labels show the number and within-phenotype percentage of decedents with each cause-of-death category; shading reflects within-phenotype prevalence. Cause-of-death categories are not mutually exclusive. Counts <11 are masked to preserve patient privacy.
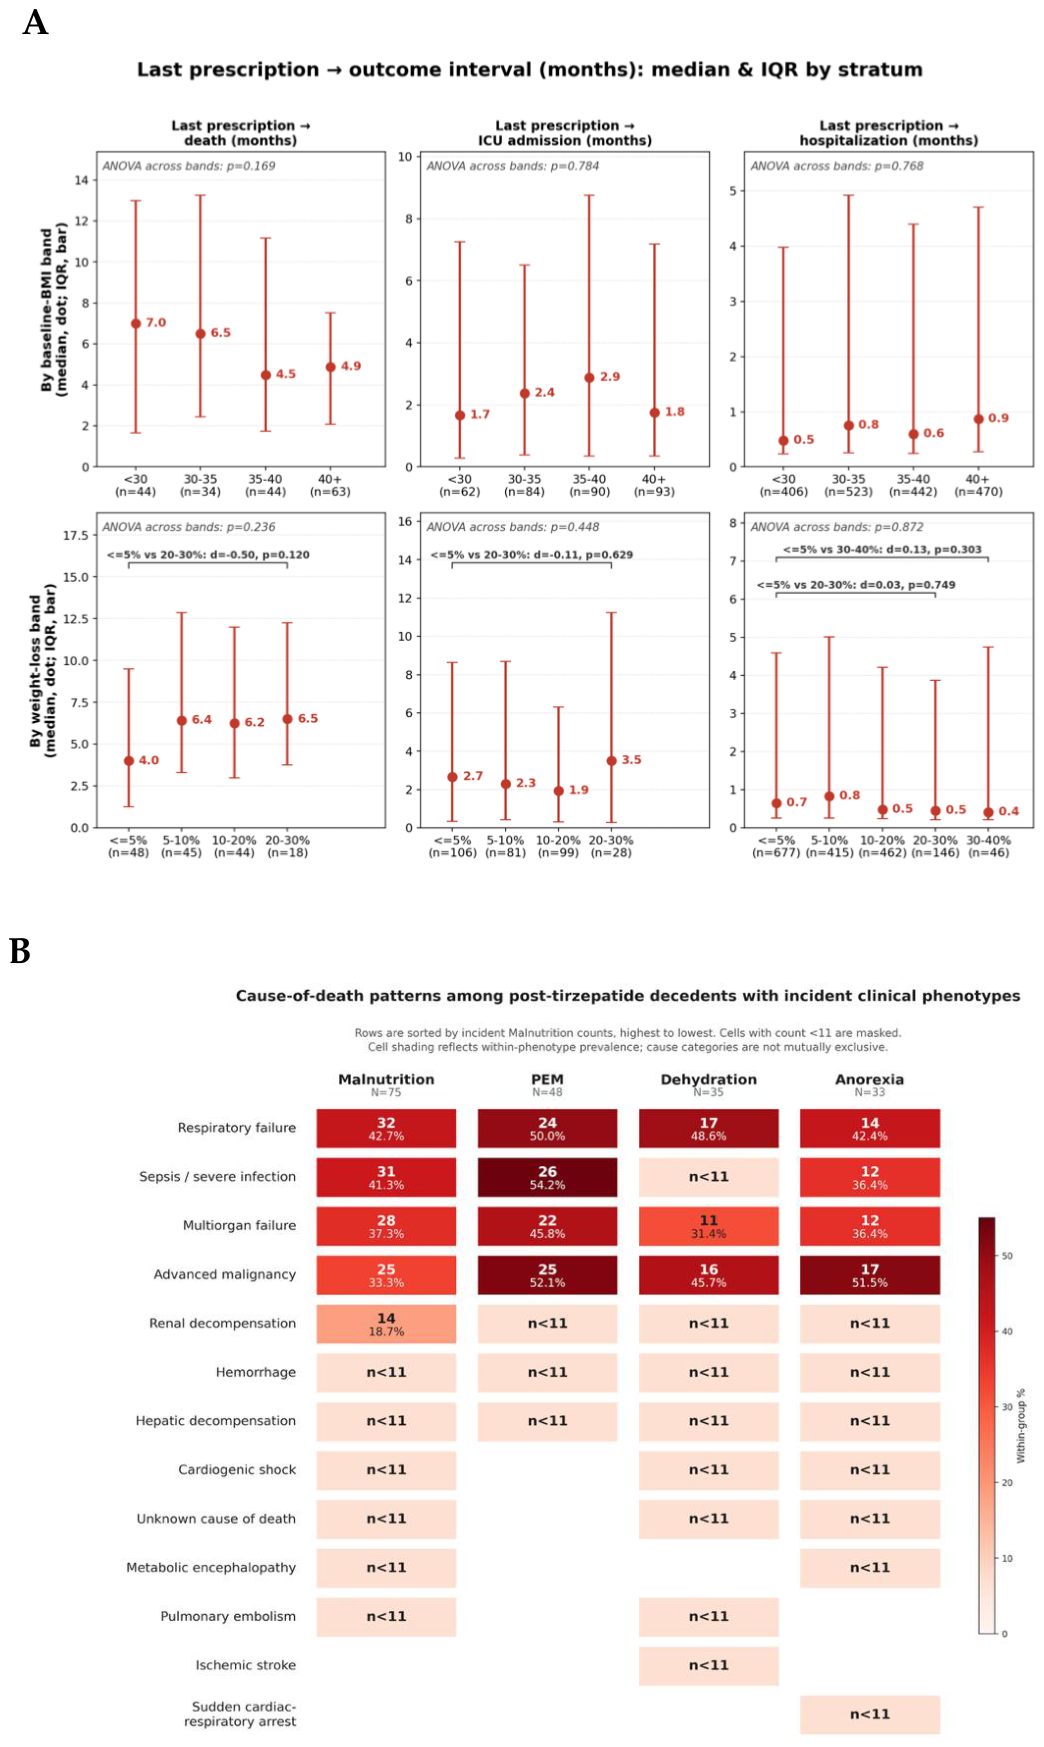

Table 1.
Baseline demographic and clinical characteristics of tirzepatide vs. antidiabetic comparator, before and after 1:1 propensity-score matching for 65+ Medicare-eligible patients. Differences of |SMD|>0.1 after matching are bolded to denote covariates that are not well balanced. .
Table 1.
Baseline demographic and clinical characteristics of tirzepatide vs. antidiabetic comparator, before and after 1:1 propensity-score matching for 65+ Medicare-eligible patients. Differences of |SMD|>0.1 after matching are bolded to denote covariates that are not well balanced. .
| Characteristic | Before matching | After matching | ||||
|---|---|---|---|---|---|---|
| Antidiabetic (comparator) | Tirzepatide | SMD | Antidiabetic (comparator) | Tirzepatide | SMD | |
| N patients | 111,871 | 18,693 | 18,611 | 18,611 | ||
| Age at index, years | 74.3 (6.4) | 70.9 (4.8) | 0.602 | 71.2 (4.9) | 70.9 (4.8) | 0.046 |
| Follow-up, months | 12.7 (12.1) | 8.0 (8.0) | 0.454 | 12.7 (12.4) | 8.0 (8.0) | 0.455 |
| BMI, kg/m2 | 29.9 (6.0) | 34.5 (5.9) | -0.771 | 30.0 (8.6) | 34.5 (5.9) | -0.604 |
| HbA1c, % | 6.6 (1.4) | 6.2 (1.1) | 0.339 | 6.8 (1.5) | 6.2 (1.1) | 0.396 |
| Weight, kg | 86.9 (20.5) | 99.2 (22.0) | -0.577 | 86.6 (24.1) | 99.1 (22.0) | -0.544 |
| Female sex | 45.2% | 64.7% | -0.400 | 42.7% | 64.5% | -0.449 |
| White / Caucasian | 79.2% | 89.3% | -0.281 | 58.4% | 89.3% | -0.752 |
| Black / African American | 11.9% | 7.3% | 0.157 | 17.1% | 7.3% | 0.304 |
| Asian | 2.1% | 0.4% | 0.156 | 8.3% | 0.4% | 0.397 |
| Hypertension | 65.0% | 71.8% | -0.147 | 62.1% | 71.8% | -0.208 |
| Hyperlipidemia | 59.0% | 73.4% | -0.308 | 55.2% | 73.4% | -0.387 |
| ASCVD | 42.5% | 36.1% | 0.133 | 37.5% | 36.1% | 0.028 |
| Heart failure | 30.3% | 10.1% | 0.520 | 27.0% | 10.1% | 0.443 |
| Atrial fibrillation | 22.7% | 14.0% | 0.226 | 17.3% | 14.0% | 0.091 |
| Obesity | 26.2% | 67.4% | -0.907 | 26.0% | 67.3% | -0.908 |
| Type 2 diabetes | 36.8% | 31.5% | 0.113 | 41.9% | 31.6% | 0.214 |
| Diabetes complications | 20.1% | 18.9% | 0.029 | 22.5% | 19.0% | 0.086 |
| Hypoglycemia | 1.1% | 1.7% | -0.051 | 1.3% | 1.8% | -0.036 |
| Prediabetes | 21.2% | 29.8% | -0.199 | 20.5% | 29.8% | -0.215 |
| Metabolic syndrome | 0.9% | 2.9% | -0.141 | 1.0% | 2.9% | -0.133 |
| Chronic kidney disease | 23.8% | 19.6% | 0.101 | 20.9% | 19.7% | 0.030 |
| Acute kidney injury | 13.7% | 8.3% | 0.173 | 13.4% | 8.3% | 0.164 |
| NAFLD/MASH | 4.7% | 11.2% | -0.245 | 5.0% | 11.2% | -0.228 |
| Pancreatitis | 1.9% | 1.7% | 0.010 | 2.2% | 1.7% | 0.030 |
| Gallbladder disease | 4.2% | 5.9% | -0.078 | 4.5% | 5.9% | -0.062 |
| Gastroparesis | 0.5% | 0.7% | -0.028 | 0.5% | 0.7% | -0.023 |
| GERD | 27.6% | 41.1% | -0.288 | 24.8% | 41.1% | -0.352 |
| Obstructive sleep apnea | 19.2% | 43.6% | -0.546 | 18.0% | 43.5% | -0.577 |
| Hypothyroidism | 15.7% | 25.8% | -0.251 | 14.0% | 25.8% | -0.299 |
| PCOS | 0.0% | 0.2% | -0.057 | 0.1% | 0.2% | -0.048 |
| Gout | 6.3% | 6.8% | -0.020 | 5.1% | 6.8% | -0.071 |
| Hyperuricemia | 1.4% | 1.9% | -0.039 | 1.2% | 2.0% | -0.056 |
| Depression | 11.9% | 23.7% | -0.312 | 11.0% | 23.7% | -0.340 |
| Anxiety | 16.3% | 29.4% | -0.316 | 15.1% | 29.4% | -0.349 |
| Esophageal cancer | 0.2% | 0.1% | 0.035 | 0.3% | 0.1% | 0.042 |
| Gastric cancer | 0.2% | 0.1% | 0.029 | 0.2% | 0.1% | 0.043 |
| Colorectal cancer | 1.3% | 1.0% | 0.031 | 1.2% | 1.0% | 0.017 |
| Liver cancer | 0.5% | 0.4% | 0.014 | 0.6% | 0.4% | 0.026 |
| Gallbladder/biliary cancer | 0.1% | 0.1% | 0.022 | 0.2% | 0.1% | 0.034 |
| Pancreatic cancer | 0.6% | 0.2% | 0.075 | 0.9% | 0.2% | 0.102 |
| Breast cancer | 3.3% | 5.3% | -0.100 | 2.7% | 5.3% | -0.135 |
| Endometrial cancer | 0.5% | 1.0% | -0.054 | 0.9% | 1.0% | -0.016 |
| Ovarian cancer | 0.2% | 0.3% | -0.009 | 0.2% | 0.3% | -0.025 |
| Kidney cancer | 0.7% | 0.9% | -0.020 | 0.7% | 0.9% | -0.029 |
| Thyroid cancer | 0.5% | 0.9% | -0.049 | 0.5% | 0.9% | -0.044 |
| Medullary thyroid ca. | 0.5% | 0.9% | -0.049 | 0.5% | 0.9% | -0.044 |
| Meningioma | 0.7% | 1.1% | -0.044 | 0.6% | 1.1% | -0.062 |
| Multiple myeloma | 0.7% | 0.4% | 0.044 | 0.8% | 0.4% | 0.056 |
| Bladder cancer | 1.0% | 0.9% | 0.015 | 0.7% | 0.9% | -0.018 |
| Non-Hodgkin lymphoma | 1.2% | 1.3% | -0.002 | 1.1% | 1.3% | -0.013 |
| Prostate cancer | 4.5% | 3.9% | 0.031 | 3.9% | 3.9% | 0.000 |
| Melanoma | 1.2% | 2.0% | -0.062 | 0.8% | 2.0% | -0.103 |
Table 2.
Baseline characteristics of tirzepatide-treated patients, stratified by percent weight loss from baseline. Differences of |SMD|>0.1 between high (30-40%) and low (≤5%) weight loss groups are bolded to denote covariates that are not well balanced. .
Table 2.
Baseline characteristics of tirzepatide-treated patients, stratified by percent weight loss from baseline. Differences of |SMD|>0.1 between high (30-40%) and low (≤5%) weight loss groups are bolded to denote covariates that are not well balanced. .
| Characteristic | ≤5% | 5-10% | 10-20% | 20-30% | 30-40% | SMD (hi vs lo) |
|---|---|---|---|---|---|---|
| N patients | 6,681 | 2,876 | 2,831 | 821 | 173 | |
| Age at index, years | 70.9 (4.8) | 71.0 (4.8) | 70.8 (4.8) | 70.4 (4.3) | 70.2 (4.2) | -0.160 |
| Follow-up, months | 7.4 (6.6) | 11.0 (7.5) | 13.7 (8.0) | 17.6 (8.1) | 21.3 (8.5) | 1.833 |
| BMI, kg/m2 | 34.4 (6.2) | 34.8 (6.0) | 34.9 (5.8) | 35.8 (5.0) | 37.6 (5.1) | 0.562 |
| HbA1c, % | 6.3 (1.3) | 6.3 (1.2) | 6.3 (1.1) | 6.2 (1.0) | 6.4 (1.1) | 0.082 |
| Weight, kg | 98.9 (22.7) | 100.0 (21.7) | 99.7 (21.4) | 101.3 (20.4) | 105.5 (20.0) | 0.304 |
| Female sex | 64.2% | 64.0% | 68.4% | 74.9% | 78.0% | 0.309 |
| White / Caucasian | 88.9% | 90.9% | 91.0% | 92.6% | 90.8% | 0.060 |
| Black / African American | 7.4% | 6.4% | 6.1% | 4.5% | 6.4% | -0.043 |
| Asian | 0.4% | 0.4% | 0.2% | 0.4% | 0.0% | -0.087 |
| Hypertension | 71.9% | 73.1% | 73.9% | 78.8% | 75.1% | 0.074 |
| Hyperlipidemia | 71.0% | 76.1% | 78.0% | 79.9% | 79.8% | 0.205 |
| ASCVD | 35.8% | 38.9% | 35.3% | 37.9% | 37.6% | 0.036 |
| Heart failure | 10.7% | 9.9% | 9.1% | 10.8% | 14.5% | 0.115 |
| Atrial fibrillation | 13.7% | 14.0% | 13.4% | 13.4% | 11.6% | -0.065 |
| Obesity | 64.8% | 69.2% | 72.8% | 78.0% | 79.8% | 0.339 |
| Type 2 diabetes | 31.5% | 34.0% | 34.8% | 39.1% | 42.2% | 0.224 |
| Diabetes complications | 18.9% | 21.6% | 21.3% | 22.4% | 23.7% | 0.117 |
| Hypoglycemia | 1.5% | 2.2% | 2.2% | 1.9% | 2.9% | 0.099 |
| Prediabetes | 28.6% | 31.0% | 33.3% | 33.1% | 39.9% | 0.240 |
| Metabolic syndrome | 2.9% | 2.9% | 2.9% | 3.7% | 1.7% | -0.076 |
| Chronic kidney disease | 18.4% | 21.7% | 21.5% | 24.5% | 24.3% | 0.144 |
| Acute kidney injury | 7.8% | 8.2% | 9.3% | 11.3% | 12.1% | 0.145 |
| NAFLD/MASH | 10.9% | 11.6% | 11.6% | 13.2% | 16.8% | 0.172 |
| Pancreatitis | 1.6% | 2.3% | 1.6% | 1.5% | 1.2% | -0.038 |
| Gallbladder disease | 5.6% | 6.4% | 5.4% | 6.6% | 3.5% | -0.103 |
| Gastroparesis | 0.7% | 0.6% | 1.0% | 0.7% | 1.2% | 0.045 |
| GERD | 40.1% | 44.3% | 43.3% | 45.8% | 49.7% | 0.193 |
| Obstructive sleep apnea | 42.5% | 44.9% | 43.4% | 45.6% | 45.7% | 0.063 |
| Hypothyroidism | 25.2% | 26.6% | 28.9% | 34.3% | 32.9% | 0.170 |
| PCOS | 0.3% | 0.2% | 0.2% | 0.5% | 0.6% | 0.048 |
| Gout | 6.6% | 7.4% | 6.6% | 7.4% | 10.4% | 0.138 |
| Hyperuricemia | 1.9% | 2.1% | 1.9% | 1.8% | 1.2% | -0.062 |
| Depression | 22.9% | 24.4% | 26.2% | 31.4% | 32.4% | 0.213 |
| Anxiety | 28.4% | 30.5% | 32.9% | 33.9% | 37.6% | 0.196 |
| Esophageal cancer | 0.1% | 0.1% | 0.1% | 0.1% | 0.0% | -0.039 |
| Gastric cancer | 0.0% | 0.1% | 0.1% | 0.1% | 0.0% | -0.030 |
| Colorectal cancer | 1.1% | 1.2% | 0.8% | 1.0% | 1.2% | 0.007 |
| Liver cancer | 0.4% | 0.4% | 0.4% | 0.2% | 0.0% | -0.093 |
| Gallbladder/biliary cancer | 0.1% | 0.1% | 0.1% | 0.0% | 0.0% | -0.039 |
| Pancreatic cancer | 0.2% | 0.0% | 0.4% | 0.1% | 0.0% | -0.057 |
| Breast cancer | 5.1% | 6.3% | 5.8% | 7.4% | 4.6% | -0.022 |
| Endometrial cancer | 0.9% | 1.4% | 1.1% | 1.1% | 1.2% | 0.027 |
| Ovarian cancer | 0.2% | 0.4% | 0.2% | 0.7% | 0.0% | -0.062 |
| Kidney cancer | 0.7% | 1.2% | 0.9% | 1.2% | 1.2% | 0.045 |
| Thyroid cancer | 0.9% | 1.0% | 0.7% | 1.3% | 1.2% | 0.027 |
| Medullary thyroid ca. | 0.9% | 1.0% | 0.7% | 1.3% | 1.2% | 0.027 |
| Meningioma | 1.0% | 1.0% | 1.1% | 1.7% | 0.6% | -0.044 |
| Multiple myeloma | 0.4% | 0.6% | 0.5% | 0.1% | 0.0% | -0.087 |
| Bladder cancer | 0.7% | 1.1% | 0.9% | 0.4% | 1.7% | 0.091 |
| Non-Hodgkin lymphoma | 1.2% | 1.5% | 1.0% | 1.7% | 1.7% | 0.047 |
| Prostate cancer | 4.0% | 4.5% | 3.5% | 2.1% | 4.6% | 0.032 |
| Melanoma | 1.8% | 1.9% | 2.2% | 2.1% | 5.2% | 0.186 |
Table 3.
Baseline characteristics of tirzepatide-treated patients by incident phenotype during follow-up.
Table 3.
Baseline characteristics of tirzepatide-treated patients by incident phenotype during follow-up.
| Characteristic | Loss of appetite | Dehydration | Malnutrition | Protein-energy malnutrition | Sarcopenia | Cachexia |
|---|---|---|---|---|---|---|
| N patients | 1,297 | 805 | 406 | 255 | 60 | 15 |
| Age at index, years | 71.2 (4.9) | 71.5 (5.0) | 72.3 (5.3) | 72.6 (5.4) | 71.5 (5.2) | 72.3 (4.4) |
| Follow-up, months | 10.4 (7.8) | 10.9 (8.3) | 10.9 (7.9) | 11.3 (8.1) | 10.9 (7.9) | 6.6 (3.7) |
| BMI, kg/m2 | 35.2 (6.0) | 34.2 (5.7) | 35.3 (6.9) | 33.8 (7.0) | 34.4 (5.5) | 30.7 (8.1) |
| HbA1c, % | 6.6 (1.4) | 6.6 (1.4) | 6.9 (1.6) | 6.7 (1.6) | 6.3 (1.2) | 7.7 (1.5) |
| Weight, kg | 101.8 (23.4) | 98.6 (23.3) | 102.0 (24.7) | 96.6 (23.5) | 96.0 (21.4) | 93.6 (31.4) |
| Female sex | 66.3% | 65.3% | 60.8% | 64.3% | 58.3% | 60.0% |
| White / Caucasian | 86.6% | 89.6% | 88.9% | 91.0% | 95.0% | 86.7% |
| Black / African American | 9.6% | 8.4% | 7.6% | 5.5% | 0.0% | 0.0% |
| Asian | 0.7% | 0.1% | 0.5% | 0.0% | 0.0% | 0.0% |
| Hypertension | 48.5% | 50.7% | 52.0% | 51.8% | 45.0% | 40.0% |
| Hyperlipidemia | 48.8% | 49.1% | 46.8% | 47.5% | 40.0% | 46.7% |
| ASCVD | 25.1% | 27.2% | 30.5% | 32.2% | 33.3% | 26.7% |
| Heart failure | 6.6% | 7.3% | 13.1% | 11.0% | 13.3% | 13.3% |
| Atrial fibrillation | 9.6% | 10.9% | 17.2% | 16.5% | 8.3% | 13.3% |
| Obesity | 47.2% | 43.1% | 41.6% | 38.0% | 46.7% | 26.7% |
| Type 2 diabetes | 22.9% | 25.8% | 31.5% | 35.3% | 30.0% | 33.3% |
| Diabetes complications | 14.4% | 17.0% | 23.6% | 26.3% | 18.3% | 33.3% |
| Hypoglycemia | 1.1% | 0.9% | 2.5% | 2.4% | 0.0% | 6.7% |
| Prediabetes | 20.5% | 16.8% | 13.3% | 15.3% | 16.7% | 6.7% |
| Metabolic syndrome | 1.9% | 2.1% | 1.0% | 0.8% | 0.0% | 0.0% |
| Chronic kidney disease | 14.9% | 15.9% | 20.7% | 20.8% | 15.0% | 6.7% |
| Acute kidney injury | 6.0% | 6.6% | 11.8% | 12.2% | 10.0% | 6.7% |
| NAFLD/MASH | 8.4% | 7.2% | 10.1% | 11.0% | 26.7% | 6.7% |
| Pancreatitis | 0.9% | 1.4% | 1.7% | 1.6% | 6.7% | 0.0% |
| Gallbladder disease | 2.5% | 2.7% | 3.4% | 4.3% | 6.7% | 6.7% |
| Gastroparesis | 0.5% | 0.4% | 0.7% | 0.4% | 0.0% | 0.0% |
| GERD | 27.2% | 26.6% | 28.8% | 29.4% | 26.7% | 33.3% |
| Obstructive sleep apnea | 32.1% | 26.1% | 29.1% | 27.8% | 31.7% | 13.3% |
| Hypothyroidism | 17.3% | 19.1% | 20.9% | 18.0% | 21.7% | 6.7% |
| PCOS | 0.0% | 0.1% | 0.0% | 0.0% | 0.0% | 0.0% |
| Gout | 4.8% | 4.6% | 5.4% | 6.3% | 1.7% | 6.7% |
| Hyperuricemia | 1.5% | 1.0% | 2.2% | 2.7% | 1.7% | 0.0% |
| Depression | 17.2% | 17.0% | 16.3% | 15.7% | 11.7% | 20.0% |
| Anxiety | 19.6% | 20.5% | 17.7% | 19.6% | 21.7% | 33.3% |
| Esophageal cancer | 0.1% | 0.0% | 0.5% | 0.8% | 0.0% | 0.0% |
| Gastric cancer | 0.1% | 0.0% | 0.0% | 0.0% | 0.0% | 0.0% |
| Colorectal cancer | 0.6% | 0.7% | 1.5% | 1.2% | 0.0% | 6.7% |
| Liver cancer | 0.5% | 0.4% | 0.7% | 0.4% | 6.7% | 0.0% |
| Gallbladder/biliary cancer | 0.1% | 0.0% | 0.0% | 0.0% | 0.0% | 0.0% |
| Pancreatic cancer | 0.2% | 0.1% | 0.2% | 0.4% | 0.0% | 0.0% |
| Breast cancer | 3.3% | 4.2% | 3.9% | 3.9% | 5.0% | 6.7% |
| Endometrial cancer | 0.8% | 0.5% | 0.7% | 0.4% | 1.7% | 0.0% |
| Ovarian cancer | 0.2% | 0.1% | 1.0% | 0.4% | 3.3% | 0.0% |
| Kidney cancer | 0.9% | 0.4% | 1.5% | 0.4% | 0.0% | 0.0% |
| Thyroid cancer | 0.4% | 0.4% | 0.7% | 0.8% | 1.7% | 6.7% |
| Medullary thyroid ca. | 0.4% | 0.4% | 0.7% | 0.8% | 1.7% | 6.7% |
| Meningioma | 0.6% | 0.6% | 0.5% | 0.0% | 0.0% | 0.0% |
| Multiple myeloma | 0.2% | 0.1% | 0.0% | 0.4% | 0.0% | 0.0% |
| Bladder cancer | 0.7% | 0.6% | 1.2% | 2.7% | 1.7% | 0.0% |
| Non-Hodgkin lymphoma | 0.6% | 0.9% | 1.2% | 2.4% | 1.7% | 0.0% |
| Prostate cancer | 3.0% | 2.2% | 1.5% | 1.6% | 3.3% | 6.7% |
| Melanoma | 1.1% | 1.4% | 0.7% | 0.4% | 0.0% | 0.0% |
Table 4.
Baseline characteristics of tirzepatide-treated patients by incident phenotype, stratified by incident mortality during follow-up (alive vs. died). Differences of |SMD|>0.1 within each phenotype (alive vs died) are bolded to denote covariates that are not well balanced.
Table 4.
Baseline characteristics of tirzepatide-treated patients by incident phenotype, stratified by incident mortality during follow-up (alive vs. died). Differences of |SMD|>0.1 within each phenotype (alive vs died) are bolded to denote covariates that are not well balanced.
| Characteristic | Loss of appetite | Dehydration | Malnutrition | Protein-energy malnutrition | Sarcopenia | Cachexia | ||||||||||||
|---|---|---|---|---|---|---|---|---|---|---|---|---|---|---|---|---|---|---|
| Alive | Died | SMD | Alive | Died | SMD | Alive | Died | SMD | Alive | Died | SMD | Alive | Died | SMD | Alive | Died | SMD | |
| N patients | 1,236 | 61 | 769 | 36 | 341 | 65 | 207 | 48 | 52 | 8 | 12 | 3 | ||||||
| Age at index, years | 71.1 (4.8) | 72.7 (5.2) | 0.315 | 71.4 (4.9) | 73.3 (5.3) | 0.374 | 72.0 (5.3) | 73.6 (5.4) | 0.303 | 72.4 (5.4) | 73.6 (5.3) | 0.235 | 71.2 (5.2) | 73.9 (4.6) | 0.544 | 71.9 (3.9) | 74.0 (5.7) | 0.430 |
| Follow-up, months | 10.5 (7.9) | 9.9 (7.4) | -0.071 | 10.9 (8.4) | 11.0 (7.2) | 0.012 | 11.4 (8.1) | 8.9 (6.4) | -0.343 | 11.9 (8.4) | 9.3 (6.3) | -0.341 | 11.2 (8.1) | 8.8 (7.0) | -0.320 | 7.5 (3.6) | 3.6 (2.0) | -1.334 |
| BMI, kg/m2 | 35.2 (6.0) | 35.6 (6.8) | 0.065 | 34.3 (5.6) | 33.5 (6.8) | -0.126 | 35.4 (6.9) | 34.9 (6.9) | -0.075 | 33.9 (6.9) | 33.5 (7.3) | -0.058 | 34.6 (5.5) | 33.4 (5.2) | -0.222 | 31.8 (8.3) | 24.5 (0.0) | -1.234 |
| HbA1c, % | 6.5 (1.4) | 7.1 (1.8) | 0.347 | 6.6 (1.4) | 6.4 (1.3) | -0.116 | 6.9 (1.6) | 6.9 (1.5) | 0.024 | 6.6 (1.6) | 7.3 (1.6) | 0.382 | 6.4 (1.3) | 6.1 (0.6) | -0.327 | 8.0 (1.4) | 5.9 (0.0) | -2.091 |
| Weight, kg | 101.6 (23.4) | 105.6 (23.1) | 0.174 | 98.6 (23.3) | 98.7 (23.6) | 0.002 | 102.3 (24.6) | 100.6 (25.3) | -0.068 | 96.9 (23.3) | 95.6 (24.4) | -0.055 | 95.6 (21.1) | 97.6 (22.5) | 0.091 | 87.9 (19.4) | 113.7 (51.0) | 0.669 |
| Female sex | 66.7% | 57.4% | -0.194 | 65.3% | 66.7% | 0.029 | 60.4% | 63.1% | 0.055 | 64.7% | 62.5% | -0.046 | 61.5% | 37.5% | -0.495 | 58.3% | 66.7% | 0.173 |
| White / Caucasian | 86.1% | 96.7% | 0.386 | 89.3% | 94.4% | 0.188 | 88.3% | 92.3% | 0.137 | 91.3% | 89.6% | -0.059 | 94.2% | 100.0% | 0.350 | 83.3% | 100.0% | 0.632 |
| Black / African American | 10.0% | 1.6% | -0.364 | 8.6% | 5.6% | -0.118 | 8.2% | 4.6% | -0.147 | 5.3% | 6.2% | 0.040 | 0.0% | 0.0% | 0.0% | 0.0% | ||
| Asian | 0.7% | 0.0% | -0.121 | 0.1% | 0.0% | -0.051 | 0.6% | 0.0% | -0.109 | 0.0% | 0.0% | 0.0% | 0.0% | 0.0% | 0.0% | |||
| Hypertension | 48.6% | 45.9% | -0.055 | 50.3% | 58.3% | 0.161 | 50.4% | 60.0% | 0.193 | 49.8% | 60.4% | 0.216 | 46.2% | 37.5% | -0.176 | 50.0% | 0.0% | -1.414 |
| Hyperlipidemia | 49.0% | 44.3% | -0.096 | 48.6% | 58.3% | 0.195 | 44.6% | 58.5% | 0.281 | 45.9% | 54.2% | 0.166 | 40.4% | 37.5% | -0.059 | 50.0% | 33.3% | -0.343 |
| ASCVD | 24.8% | 31.1% | 0.141 | 26.1% | 50.0% | 0.507 | 28.4% | 41.5% | 0.277 | 31.4% | 35.4% | 0.085 | 30.8% | 50.0% | 0.400 | 33.3% | 0.0% | -1.000 |
| Heart failure | 5.9% | 19.7% | 0.421 | 7.0% | 13.9% | 0.226 | 11.1% | 23.1% | 0.321 | 9.7% | 16.7% | 0.208 | 9.6% | 37.5% | 0.696 | 16.7% | 0.0% | -0.632 |
| Atrial fibrillation | 9.5% | 9.8% | 0.010 | 10.8% | 13.9% | 0.094 | 17.9% | 13.8% | -0.111 | 16.9% | 14.6% | -0.064 | 7.7% | 12.5% | 0.160 | 16.7% | 0.0% | -0.632 |
| Obesity | 47.3% | 44.3% | -0.062 | 42.8% | 50.0% | 0.145 | 40.2% | 49.2% | 0.183 | 37.2% | 41.7% | 0.092 | 46.2% | 50.0% | 0.077 | 25.0% | 33.3% | 0.184 |
| Type 2 diabetes | 22.2% | 37.7% | 0.344 | 25.0% | 44.4% | 0.418 | 28.7% | 46.2% | 0.366 | 34.3% | 39.6% | 0.110 | 25.0% | 62.5% | 0.816 | 41.7% | 0.0% | -1.195 |
| Diabetes complications | 13.8% | 27.9% | 0.353 | 16.4% | 30.6% | 0.339 | 20.5% | 40.0% | 0.434 | 24.6% | 33.3% | 0.193 | 13.5% | 50.0% | 0.854 | 41.7% | 0.0% | -1.195 |
| Hypoglycemia | 1.0% | 3.3% | 0.161 | 0.9% | 0.0% | -0.136 | 1.8% | 6.2% | 0.227 | 1.4% | 6.2% | 0.251 | 0.0% | 0.0% | 8.3% | 0.0% | -0.426 | |
| Prediabetes | 21.2% | 6.6% | -0.433 | 17.0% | 11.1% | -0.171 | 12.6% | 16.9% | 0.122 | 15.5% | 14.6% | -0.025 | 19.2% | 0.0% | -0.690 | 8.3% | 0.0% | -0.426 |
| Metabolic syndrome | 1.9% | 0.0% | -0.199 | 2.2% | 0.0% | -0.213 | 1.2% | 0.0% | -0.154 | 1.0% | 0.0% | -0.140 | 0.0% | 0.0% | 0.0% | 0.0% | ||
| Chronic kidney disease | 14.1% | 31.1% | 0.417 | 15.5% | 25.0% | 0.239 | 18.2% | 33.8% | 0.363 | 16.9% | 37.5% | 0.476 | 13.5% | 25.0% | 0.296 | 8.3% | 0.0% | -0.426 |
| Acute kidney injury | 5.5% | 16.4% | 0.354 | 6.2% | 13.9% | 0.256 | 10.3% | 20.0% | 0.274 | 10.1% | 20.8% | 0.299 | 3.8% | 50.0% | 1.218 | 8.3% | 0.0% | -0.426 |
| NAFLD/MASH | 8.3% | 11.5% | 0.108 | 7.2% | 8.3% | 0.044 | 10.0% | 10.8% | 0.026 | 9.7% | 16.7% | 0.208 | 25.0% | 37.5% | 0.272 | 8.3% | 0.0% | -0.426 |
| Pancreatitis | 1.0% | 0.0% | -0.140 | 1.4% | 0.0% | -0.170 | 1.8% | 1.5% | -0.017 | 1.4% | 2.1% | 0.048 | 7.7% | 0.0% | -0.408 | 0.0% | 0.0% | |
| Gallbladder disease | 2.7% | 0.0% | -0.234 | 2.9% | 0.0% | -0.243 | 3.5% | 3.1% | -0.025 | 4.8% | 2.1% | -0.151 | 7.7% | 0.0% | -0.408 | 8.3% | 0.0% | -0.426 |
| Gastroparesis | 0.5% | 0.0% | -0.099 | 0.4% | 0.0% | -0.089 | 0.9% | 0.0% | -0.133 | 0.5% | 0.0% | -0.099 | 0.0% | 0.0% | 0.0% | 0.0% | ||
| GERD | 27.6% | 19.7% | -0.187 | 26.8% | 22.2% | -0.106 | 28.2% | 32.3% | 0.091 | 28.5% | 33.3% | 0.105 | 26.9% | 25.0% | -0.044 | 41.7% | 0.0% | -1.195 |
| Obstructive sleep apnea | 32.2% | 29.5% | -0.058 | 26.0% | 27.8% | 0.040 | 27.9% | 35.4% | 0.162 | 26.6% | 33.3% | 0.148 | 30.8% | 37.5% | 0.142 | 16.7% | 0.0% | -0.632 |
| Hypothyroidism | 17.1% | 21.3% | 0.108 | 18.2% | 38.9% | 0.470 | 19.1% | 30.8% | 0.273 | 15.9% | 27.1% | 0.274 | 23.1% | 12.5% | -0.279 | 8.3% | 0.0% | -0.426 |
| PCOS | 0.0% | 0.0% | 0.1% | 0.0% | -0.051 | 0.0% | 0.0% | 0.0% | 0.0% | 0.0% | 0.0% | 0.0% | 0.0% | |||||
| Gout | 4.7% | 6.6% | 0.081 | 4.6% | 5.6% | 0.046 | 3.8% | 13.8% | 0.359 | 4.8% | 12.5% | 0.275 | 1.9% | 0.0% | -0.198 | 8.3% | 0.0% | -0.426 |
| Hyperuricemia | 1.5% | 0.0% | -0.177 | 1.0% | 0.0% | -0.145 | 2.3% | 1.5% | -0.059 | 3.4% | 0.0% | -0.265 | 1.9% | 0.0% | -0.198 | 0.0% | 0.0% | |
| Depression | 17.3% | 14.8% | -0.070 | 16.5% | 27.8% | 0.274 | 15.2% | 21.5% | 0.163 | 14.5% | 20.8% | 0.167 | 11.5% | 12.5% | 0.030 | 25.0% | 0.0% | -0.816 |
| Anxiety | 20.1% | 9.8% | -0.290 | 20.5% | 19.4% | -0.028 | 17.0% | 21.5% | 0.115 | 20.3% | 16.7% | -0.093 | 23.1% | 12.5% | -0.279 | 41.7% | 0.0% | -1.195 |
| Esophageal cancer | 0.1% | 0.0% | -0.040 | 0.0% | 0.0% | 0.6% | 0.0% | -0.109 | 1.0% | 0.0% | -0.140 | 0.0% | 0.0% | 0.0% | 0.0% | |||
| Gastric cancer | 0.1% | 0.0% | -0.040 | 0.0% | 0.0% | 0.0% | 0.0% | 0.0% | 0.0% | 0.0% | 0.0% | 0.0% | 0.0% | |||||
| Colorectal cancer | 0.6% | 1.6% | 0.103 | 0.8% | 0.0% | -0.125 | 1.5% | 1.5% | 0.006 | 1.0% | 2.1% | 0.091 | 0.0% | 0.0% | 8.3% | 0.0% | -0.426 | |
| Liver cancer | 0.4% | 1.6% | 0.123 | 0.4% | 0.0% | -0.089 | 0.9% | 0.0% | -0.133 | 0.5% | 0.0% | -0.099 | 5.8% | 12.5% | 0.235 | 0.0% | 0.0% | |
| Gallbladder/biliary cancer | 0.1% | 0.0% | -0.040 | 0.0% | 0.0% | 0.0% | 0.0% | 0.0% | 0.0% | 0.0% | 0.0% | 0.0% | 0.0% | |||||
| Pancreatic cancer | 0.2% | 1.6% | 0.157 | 0.0% | 2.8% | 0.239 | 0.3% | 0.0% | -0.077 | 0.5% | 0.0% | -0.099 | 0.0% | 0.0% | 0.0% | 0.0% | ||
| Breast cancer | 3.3% | 3.3% | -0.002 | 4.2% | 5.6% | 0.065 | 4.1% | 3.1% | -0.055 | 3.9% | 4.2% | 0.015 | 5.8% | 0.0% | -0.350 | 8.3% | 0.0% | -0.426 |
| Endometrial cancer | 0.9% | 0.0% | -0.134 | 0.5% | 0.0% | -0.102 | 0.9% | 0.0% | -0.133 | 0.5% | 0.0% | -0.099 | 1.9% | 0.0% | -0.198 | 0.0% | 0.0% | |
| Ovarian cancer | 0.2% | 0.0% | -0.070 | 0.1% | 0.0% | -0.051 | 1.2% | 0.0% | -0.154 | 0.5% | 0.0% | -0.099 | 3.8% | 0.0% | -0.283 | 0.0% | 0.0% | |
| Kidney cancer | 1.0% | 0.0% | -0.140 | 0.4% | 0.0% | -0.089 | 0.9% | 4.6% | 0.230 | 0.0% | 2.1% | 0.206 | 0.0% | 0.0% | 0.0% | 0.0% | ||
| Thyroid cancer | 0.4% | 0.0% | -0.090 | 0.4% | 0.0% | -0.089 | 0.9% | 0.0% | -0.133 | 1.0% | 0.0% | -0.140 | 1.9% | 0.0% | -0.198 | 8.3% | 0.0% | -0.426 |
| Medullary thyroid ca. | 0.4% | 0.0% | -0.090 | 0.4% | 0.0% | -0.089 | 0.9% | 0.0% | -0.133 | 1.0% | 0.0% | -0.140 | 1.9% | 0.0% | -0.198 | 8.3% | 0.0% | -0.426 |
| Meningioma | 0.6% | 0.0% | -0.114 | 0.5% | 2.8% | 0.178 | 0.6% | 0.0% | -0.109 | 0.0% | 0.0% | 0.0% | 0.0% | 0.0% | 0.0% | |||
| Multiple myeloma | 0.2% | 0.0% | -0.070 | 0.1% | 0.0% | -0.051 | 0.0% | 0.0% | 0.5% | 0.0% | -0.099 | 0.0% | 0.0% | 0.0% | 0.0% | |||
| Bladder cancer | 0.6% | 1.6% | 0.093 | 0.5% | 2.8% | 0.178 | 0.6% | 4.6% | 0.255 | 1.9% | 6.2% | 0.219 | 1.9% | 0.0% | -0.198 | 0.0% | 0.0% | |
| Non-Hodgkin lymphoma | 0.6% | 0.0% | -0.114 | 0.8% | 2.8% | 0.152 | 1.2% | 1.5% | 0.032 | 1.9% | 4.2% | 0.130 | 1.9% | 0.0% | -0.198 | 0.0% | 0.0% | |
| Prostate cancer | 3.0% | 3.3% | 0.016 | 2.2% | 2.8% | 0.036 | 1.5% | 1.5% | 0.006 | 1.9% | 0.0% | -0.199 | 3.8% | 0.0% | -0.283 | 8.3% | 0.0% | -0.426 |
| Melanoma | 1.1% | 0.0% | -0.151 | 1.4% | 0.0% | -0.170 | 0.6% | 1.5% | 0.093 | 0.5% | 0.0% | -0.099 | 0.0% | 0.0% | 0.0% | 0.0% | ||
Table 5.
Prevalence incident frailty phenotypes in 65+ years age adults with the associated deaths, ICU admissions and hospitalization among phenotype-developers within the Tirzepatide therapy cohort (29,955 patients), Bariatric surgery cohort (5,815 patients), and the Antidiabetic therapy cohort (18,693 patients).
Table 5.
Prevalence incident frailty phenotypes in 65+ years age adults with the associated deaths, ICU admissions and hospitalization among phenotype-developers within the Tirzepatide therapy cohort (29,955 patients), Bariatric surgery cohort (5,815 patients), and the Antidiabetic therapy cohort (18,693 patients).
| Incident phenotype |
Treatment cohort | Developed phenotype, n/N (%) |
Hospitalizations among developers, n/N (%) |
ICU admissions among developers, n/N (%) |
Deaths among developers, n/N (%) |
|---|---|---|---|---|---|
| Loss of appetite | Tirzepatide | 747/13,279 (5.6%) | 234/747 (31.3%) | 63/747 (8.4%) | 34/747 (4.6%) |
| Bariatric surgery | 429/2,776 (15.5%) | 316/429 (73.7%) | 76/429 (17.7%) | 134/429 (31.2%) | |
| Antidiabetic drugs | 1,127/14,407 (7.8%) | 681/1,127 (60.4%) | 202/1,127 (17.9%) | 191/1,127 (16.9%) | |
| Dehydration | Tirzepatide | 459/15,541 (3.0%) | 161/459 (35.1%) | 37/459 (8.1%) | 21/459 (4.6%) |
| Bariatric surgery | 358/3,452 (10.4%) | 269/358 (75.1%) | 65/358 (18.2%) | 123/358 (34.4%) | |
| Antidiabetic drugs | 843/16,360 (5.2%) | 502/843 (59.5%) | 169/843 (20.0%) | 145/843 (17.2%) | |
| Malnutrition | Tirzepatide | 226/17,819 (1.3%) | 192/226 (85.0%) | 66/226 (29.2%) | 39/226 (17.3%) |
| Bariatric surgery | 387/3,867 (10.0%) | 337/387 (87.1%) | 89/387 (23.0%) | 163/387 (42.1%) | |
| Antidiabetic drugs | 637/17,712 (3.6%) | 563/637 (88.4%) | 206/637 (32.3%) | 179/637 (28.1%) | |
| Protein-energy malnutrition | Tirzepatide | 156/17,240 (0.9%) | 133/156 (85.3%) | 42/156 (26.9%) | 29/156 (18.6%) |
| Bariatric surgery | 331/4,108 (8.1%) | 292/331 (88.2%) | 88/331 (26.6%) | 148/331 (44.7%) | |
| Antidiabetic drugs | 490/18,072 (2.7%) | 436/490 (89.0%) | 148/490 (30.2%) | 165/490 (33.7%) | |
| Sarcopenia | Tirzepatide | 24/4,996 (0.5%) | <11 / 24 | <11 / 24 | <11 / 24 |
| Bariatric surgery | 42/2,509 (1.7%) | 32/42 (76.2%) | 13/42 (31.0%) | 23/42 (54.8%) | |
| Antidiabetic drugs | 68/15,713 (0.4%) | 51/68 (75.0%) | 24/68 (35.3%) | 23/68 (33.8%) |
Disclaimer/Publisher’s Note: The statements, opinions and data contained in all publications are solely those of the individual author(s) and contributor(s) and not of MDPI and/or the editor(s). MDPI and/or the editor(s) disclaim responsibility for any injury to people or property resulting from any ideas, methods, instructions or products referred to in the content. |
© 2026 by the authors. Licensee MDPI, Basel, Switzerland. This article is an open access article distributed under the terms and conditions of the Creative Commons Attribution (CC BY) license (http://creativecommons.org/licenses/by/4.0/).
Copyright: This open access article is published under a Creative Commons CC BY 4.0 license, which permit the free download, distribution, and reuse, provided that the author and preprint are cited in any reuse.


