
Submitted:
10 July 2026
Posted:
10 July 2026
You are already at the latest version
Abstract
Air pollution is a public health threat that requires urgent action. This study conducted a bibliometric analysis of air pollution and human health in Indian cities to examine trends and the geography of the scientific literature, the evolution of research, and co-occurrence patterns of pollution sources, types, and health impacts. Furthermore, a narrative review of air pollution mitigation strategies was conducted using scholarly articles, policy documents, and reports. Relevant publications from the Web of Science (WoS) and Scopus databases were downloaded. The search identified 3307 articles published between 1987 and 2024, of which 172 met the inclusion criteria. The bibliometric analysis was conducted using VOSviewer and R software. The results indicate a steady rise in studies on air pollution and health issues in India. Initially, research concentrated on various sources and types of pollution, subsequently transitioning to the evaluation of exposure risks, risk assessment, and health implications, ultimately narrowing its focus to risk assessment concerning human health. Over the course of forty years, there has been a growing emphasis on the influence of indoor air quality, including ‘PM2.5’, ‘PM10’, dust, chemical pollutants, heavy metals, and exhaust dust, on human health. Research on pollution-related health effects has moved from examining general impacts to focusing on long-term, chronic consequences of pollutant exposure. Notably, most studies are centred in large metropolitan areas, whereas medium and small towns are underrepresented. Urban areas face severe air-quality challenges, requiring strategies such as monitoring pollution, promoting renewable energy, reusing materials, installing green walls or buffers in pollution zones, improving transport infrastructure, and reducing dust with grass covers. This study underscores the importance of implementing effective air pollution control measures across various geographic regions and integrating air pollution mitigation strategies into comprehensive urban development and planning frameworks.
Keywords:
air pollution
; health
; bibliometric analysis
; mitigation strategies
; Indian cities
1. Introduction
1.1. A Brief Overview of Air Pollution Sources and Pollutant Types in Indian Cities
Air pollution significantly affects the environment and human health. According to the United Nations Environment Programme, 1.1 billion people worldwide breathe in poor air [1]. In Indian cities, air pollution has been dangerously increasing and threatening human health [2]. It is the second leading risk factor for disease after malnutrition [3]. The negative health effects of air pollution include morbidity, mortality, heart disease, diabetes, lung cancer, and respiratory infections. Particulate matter (PM) exposure caused over 1.67 million premature deaths in India [4]. Air pollution causes approximately 8.1 million deaths worldwide annually [5,6]. The United Nations’ Sustainable Development Goals (SDGs) call for reducing disease and mortality (SDG target 3.9.1) from air pollution and improving air quality in cities (SDG target 11.6.2) [7].
Air pollution is broadly classified as indoor and outdoor, and the respective sources prevalent in Indian cities are summarized in Figure 1. Developmental activities in the industrial, roadworks and construction, transportation, and household sectors consume energy. These activities significantly contribute to air pollution, particularly in megacities [8,9]. Particulate matter, a major air pollutant in Indian cities, occurs in various sizes (ranging from>10 μm (PM10) to <1.0 μm (PM1.0)) and exhibits physical and chemical properties. PM is composed primarily of carbonaceous materials [10].These are borne from the incomplete combustion of organic matter, such as diesel and petroleum, other fossil fuels, wood, biodiesel, elemental carbon, polycyclic aromatic hydrocarbons, brake and tire wear, rubber wear, and metallic dust from machining [11]. Other sources include iron and sulfur dust from steel factories, mining sites, and brick kilns; cement dust from manufacturing factories; and construction-site dust. PMs also originate from natural sources, which include desert dust, ash from volcanic eruptions, forest fires, dried oceanic salts, river sands, aerosolized soil, pollen grains from plants and trees, grass and weeds, spores from fungi, and dead microbes (bacteria and viruses) [12,13,14]. In northern India, influxes of desert dust from western arid regions cause significant air pollution [15]. Similarly, household activities, such as cooking, use of spray products to eliminate pests and insects, cleaning surfaces, and freshening indoor air; conventional stoves using wood chips for cooking and heating; smoking; fungal spores from stale food waste; sweeping, dusting, and other cleaning activities, cause pollution[16,17,18,19]. PMs travel from one location to another via air and wind, and their concentrations vary over hours, months, seasons, and years [20,21,22]. Approximately 40% of PM10 is composed of inorganic matter. The organic part is carbonaceous, borne from dioxins, alkanes, polycyclic aromatic hydrocarbons, etc., and contributes ~20% to the PM composition. Soil dust and sea salt constitute ~14% and ~8%, respectively, of the PM composition, whereas ~4% of the composition is elemental carbon borne from shoots caused by the burning of fossil fuels [23,24].
The 2019 Council on Energy, Environment and Water (CEEW) compilation report indicates that, in Indian cities, the transport sector is the leading source of PM2.5 emissions, accounting for 17.9%-39.2%. Industrial contributions vary from 2.3% to 28.9%. Additional sources of PM2.5 include waste burning, dust, domestic cooking and heating, and diesel generators. Notably, road dust is the primary contributor to PM10 levels, accounting for 35.6%-65.9% of the pollutant load. Additional sources of PM10 include waste burning, transport, industries, domestic cooking, and heating [24].
The sources of pollution vary in Indian cities. Dust from construction and roads is the primary source of pollution in Delhi, Mumbai, Pune, and Bengaluru (formerly Bangalore), while transportation is a major source in Chennai. In Kanpur, industries and transport are the main sources of pollution [25]. Transportation is reported to be the second most important source of pollution in most cities. The contributions of sources vary across cities. The average percentages of major sources of pollution, as per the CPCB inventory, in major metropolitan cities, are shown in Figure 2.
The effects of air pollution can range from minor effects to long-term health issues, including eye irritation, coughing, hair and skin damage, and even cancer. The three major pathways that have been identified to cause severe damage to human health are (a) oxidative stress and inflammation, which cause biological “wear and tear” inside the human body, (b) autonomic imbalance, which disrupts the person’s nervous system and consequently the involuntary functions, and (c) direct translocations of the PMs into the blood stream and deposition into the soft tissues. These adversely affect the cardiovascular and respiratory functions and result in serious consequences in terms of diseases, such as ischemic heart disease (IHD) and stroke, cerebrovascular diseases, type-2 diabetes, chronic obstructive pulmonary disease, lower respiratory infection, tracheal bronchus and lung cancer, infertility, and premature birth [26,27]. A summary of the adverse effects of air pollution on human health is displayed in Figure 3.
PM10 and PM2.5 have become major concerns in Indian cities, particularly during the winter season, when concentrations are higher, and health effects are more pronounced. In the Delhi-NCR region, PM2.5 concentrations during winter (296 ± 45 μg/m3) were found to be higher than summer (114 ± 48 μg/m3) [28]. The major sources of these pollutants were vehicular emissions, road dust, coal combustion, open burning, and industrial activities. The adverse effects on health are lung and heart diseases, and cancer [16]. In Ghaziabad city, the annual mean PM10 concentrations were 260 ± 150 μg/m3 while the PM2.5 concentrations were 140 ± 90 μg/m3 in the year 2018-2019 [29]. In the holy city of Varanasi, the seasonal mean concentration of PM2.5 was observed to be 244 μg/m3 (Winter: November-February) and 65 and 55 μg/m3 (Monsoon: August-September) [30]. This is causing premature death, acute lower respiratory infection, and even COPD (Chronic Obstructive Pulmonary Disease). SI-Table S2 presents the PM concentrations across various cities and highlights their health effects.
1.2. Existing Research and Knowledge Gaps
Numerous reviews on air pollution and health impacts in India have been published, making it important to examine them to understand research progress and identify knowledge gaps. Previous literature reviews have focused on air pollution trends [31], the effect of household solid fuel combustion on human health [32], the impact of transportation projects on health [33], the exposure to particulate matter (PM) in India and its health implications [34,35] and the economic burden of air pollution in India [36]. Nevertheless, bibliometric analyses of air pollution and human health in Indian cities, as well as complementary narrative reviews on mitigation strategies, remain scarce.
1.3. Specific Objectives and Research Questions
To fill this knowledge gap, the present study is structured to address three primary research questions (RQ):
- RQ1: What is the current state of research on the impact of air pollution on human health in India, including the evolution of research topics, research trends, research clusters, pollution sources, and health impacts?
- RQ2: How does the study on air pollution and health vary across spatial scales (at the city level)?
- RQ3: What mitigation strategies can be implemented to address the problem of air pollution?
The study is organized around a review and analysis of 172 scientific studies from the past four decades (refer to SI-Table S1), covering geographic distribution and trends in studies of air pollution sources, types, and health impacts, using bibliometric methods to address RQ 1 and 2. Because there are few articles on mitigation strategies (only 34 studies have contributed to the discourse on air pollution mitigation out of the 172 studies), it was necessary to consult additional sources. Additional research articles, reports, and policy documents were reviewed to address RQ 3, leading to a complementary narrative review of air pollution mitigation strategies.
2. Data Acquisition and Analytical Methods
2.1. Data Acquisition and Processing
For this review on Air Pollution and health in India, a detailed literature search was performed in the Web of Science (WoS) and Scopus databases. With no time restriction on publication, the initial search was conducted on May 25, 2023, and the revised search on March 20, 2024. To identify the relevant literature, the search fields were narrowed to include ‘Title, Abstract, and Keywords’ in the Scopus database and ‘Topic Search’ (includes Title, Abstract, and Keywords) in the WoS database. As the work aims to investigate the relationship between air pollution and particulate matter and human health in India, journal articles were identified using multiple keywords, relevant Boolean operators (“AND”, “OR”), and Truncation (*) to obtain more focused results (Table 1). This entire process resulted in the retrieval of 3307 articles.
Additionally, a complementary literature search was conducted to identify articles on air pollution mitigation strategies.
2.2. Screening and Extraction of Relevant Literature
Duplicate articles from the initial search were removed from the retrieved data prior to screening using the exclusion criteria (Table 2), resulting in 2770 articles. Additionally, 509 studies with irrelevant titles, abstracts, and keywords were removed, yielding 2261 articles.
This was followed by a full paper screening process, during which 1361 articles on air pollution that did not address health and 261 articles addressing only health, not air pollution, were excluded. Furthermore, 410 articles that did not cover India or Indian cities were excluded, reducing the sample to 239 relevant articles. Finally, 67 additional articles were removed due to unavailability. Therefore, a total of 172 studies were selected following the exclusion criteria. The detailed workflow of the literature review process is shown in Figure 4.
2.3. Bibliometric Analysis
The scientific literature was examined through bibliometric analysis. ‘VOS viewer’, ‘Biblioshiny’ (‘R’ package) [37,38], and Microsoft Excel were used for data analysis and visualisation via performance analysis (research contribution), scientific mapping (for relationship assessment), and network analysis (enrichment of bibliometric analysis). This was done to identify the primary trends and geographic distribution of the scientific literature, research focus, temporal trends, clustering, and influential research in the field [39]. The bibliometric indicators examined in this work include annual scientific publications, most relevant sources, most-cited articles, thematic evolution, trending topics, keyword analysis, and co-occurrence networks (through clustering). A brief description of each is provided in Table 3:
2.4. Mapping and Schematics
Mapping and schematics are valuable tools for visualising the patterns and processes of a phenomenon. ‘QGIS’ and ‘Canva’ were used for mapping and graphic representations, respectively.
3. Results
3.1. Trends of Scientific Literature
Pollution-health-related publications have experienced rapid and sustained growth over the past four decades. Figure 5a-d show the number of studies on air pollution and health in Indian cities (before and after the screening process). From 1987 to 2000, only 6 articles were published; from 2001 to 2010, 21 articles were published. Between 2011 and 2020, there was a marked increase in the number of publications (89 studies), reflecting the importance of the theme. The number of papers published between 2021 and 2024 (up to the search date) was 56 (Figure 5c-d).
3.2. Geographic Distribution of Publications: A Regional Gap
Air pollution-health-related research in India exhibits high spatial variation in study site selection, as observed among the 172 records. A city-name search across all identified literature was conducted to determine which Indian cities were most frequently studied. New Delhi (has been the focus of study since 1997), with the highest number of studies, leads with 52, followed by Kolkata with 15, Mumbai and Lucknow with 12 each, Agra with 8, and Chennai with 6. This map on geographic locations was created using data from 156 publications that reported investigations focused on a single city (Figure 6).
An overview of the state-wise and regional distribution of investigations shows a primary focus on cities in Northern India, particularly the NCR and Uttar Pradesh. The remaining studies, although distributed across India (in Punjab, Maharashtra, Gujarat, Rajasthan, West Bengal, Odisha, Assam, Bihar, Jharkhand, Chhattisgarh, Karnataka, Tamil Nadu, etc.), are most densely concentrated in Western and Eastern India. Reports are not available for cities in the Northern and North-Eastern Himalayan regions (with the exception of Guwahati) and Central India. Similarly, in Southern India, reports are available for only a few cities, namely Bengaluru and Mysore in Karnataka, and Chennai and Coimbatore in Tamil Nadu.
These locational disparities suggest geographic disparities in the country-wide distribution of air pollution-health studies, with medium- and small-sized cities often underrepresented in data collection and pollution-health research. There are several reasons for regional variations and the overrepresentation of megacities in studies. Megacities face rising air pollution from heavy traffic operations, industrial activities, and high energy generation and consumption. The availability of data on air pollution and health impacts, improved institutional capacity, better funding, and research have facilitated research in these cities. Consequently, these cities can develop more effective strategies to address air pollution and reduce health costs. On the other hand, medium- and small-sized cities have received limited attention in scholarly articles due to data scarcity and institutional gaps. This “metro-centricity” results in a notable knowledge gap, since the health risks in small cities can be just as serious but often go unnoticed. Thus, further studies on these cities are needed.
3.3. Most Relevant Sources and Cited Articles
A journal plays a very important role in disseminating knowledge and serves as a platform for knowledge sharing. The top 25 most relevant sources of 172 articles on air pollution and health in Indian cities from 1987 to 2024 are listed in SI-Figure S1. The most prominent sources are ‘Environmental Monitoring and Assessment’ and ‘Air Quality, Atmosphere and Health.’ Other significant sources include ‘Environmental Science and Pollution Research’, ‘Science of the Total Environment’, ‘Atmospheric Environment’, and ‘Human and Ecological Risk Assessment’. These journals reflect their significant role in air pollution and health research. These journals have published more articles because they have consistently maintained a focus on the atmospheric impacts of human activities and their implications for human health. Furthermore, in addition to advancing knowledge, these journals promote methodological innovations in health risk assessment.
Citation counts indicate an article’s influence and recognition in academia. Data on articles within a journal offers a metric for assessing the journal’s overall impact. The top eight most-cited articles on air pollution and health impacts in urban India are presented in SI-Figure S2. Agarwal et al.(2002) [40] is the most-cited article, with 237 citations, followed by Guttikunda et al. (2013) [41] with 171 citations, while Pandey et al. (2005) [42], received 125 citations. The citations for the remaining articles range from 66 to 94. Other articles with a good number of citations have focused on metropolitan and large cities. These top-cited articles contribute to a journal’s impact in disseminating scholarly work.
3.4. Research Focus
A Sankey diagram visualizes changes in research focus and shows how thematic areas intersect over time. The flow of the diagram, shown as grey lines, indicates the evolving focus of research topics, with line thickness proportional to each theme’s significance over the years, and the nodes represent the key themes.
The diagram illustrating the thematic evolution in this field from 1987 to 2024 shows how the research focus shifted from broader themes to more targeted and specific topics (Figure 7). In the first period, 1987-2001, the research communities mainly focused on ‘air pollution’, ‘air pollutants’, and ‘adolescent’. From 2002 to 2010, researchers began to investigate ‘atmospheric pollution’, ‘health assessment and ‘risk assessment’ in India. During the years 2011 to 2020, the research expanded by investigating ‘health risks’, ‘environmental health’, ‘seasonal variations’, particularly in ‘urban areas’. From 2021 to 2024, ‘environmental monitoring’, ‘health impact’, ‘air quality’, and ‘mortality’ in ‘India’. This emphasizes that health risk assessment of air pollution has attracted increasing attention.
3.5. Research Trends
Trend topics reflect the use of different keywords across time frames in the literature and indicate the temporal evolution of core keywords. SI-Figure S3 shows that ‘indoor air quality’, ‘lung function’, ‘morbidity’, and ‘children’ were trending topics in research published between 2004 and 2012. During 2012 – 2019, air pollution, ‘PM10’, ‘PM2.5’, ‘mortality’, ‘source apportionment’, ‘health risk’, and ‘Delhi’ were the trending topics. After 2020, the trending topics were ‘health risk assessment’, ‘PM2.5’, ‘particulate matter’, and ‘COVID-19’. ‘PM2.5’, and ‘health risk’, which appeared twice, are important trending topics in the research field. A notable observation is the limited number of publications on COVID-19, attributable to the 2020 outbreak. This scarcity may have stemmed from the difficulty in establishing a clear link between COVID-19, air pollution, and health outcomes. The nationwide lockdown limited health data collection and clinical investigations. Nevertheless, the COVID-19 outbreak in 2020 created valuable opportunities to examine air pollution in India, particularly through satellite observations, as traffic and industrial activities decreased during the nationwide lockdown. Studies reported a significant decline in PM exposure during the COVID-19 lockdown. However, one study also found that poor air quality in Delhi was associated with excess mortality during the COVID-19 period [43].
3.6. Keyword Analysis Through Word Cloud
The purpose of using a word cloud is to identify the most common terms, indicating that the main analysis focuses on those areas. The frequency of the keywords indicates their relevance in the literature database, and their relative importance is shown by their size in the diagram. From the total database, the top 50 keywords were selected and plotted through word cloud maps. The word cloud (shown in SI-Figure S4) generated from the databases demonstrates the content of the keywords and helps visualise the dominance of certain keywords (e.g., air pollution, particulate matter, PM2.5, health risk, PM10, health risk assessment, and Delhi) in the literature. Keywords such as cost of illness, cancer risk, black carbon, and aerosols are less common.
3.7. Co-Occurrence Analysis Through Clustering
Co-occurrence analysis is a technique for identifying the structure of a field by tracking how frequently two keywords or concepts co-occur in the same document or appear together in one article. Each circle in the diagram represents a keyword extracted from the article’s title and abstract and indicates the number of occurrences in the publications. The size of the node indicates the frequency of the keywords in the article; the edge represents the co-occurrence between the keywords. In this process, four thematic clusters were identified and are shown in Figure 8a. In the co-occurrence map, the most dominant keywords are “India”, “human”, “particulate matter”, “health risk”, and “environmental monitoring”, indicating that these have been central topics in the field. The blue cluster comprises “air pollution”, “particulate matter”, “India”, “atmospheric pollution”, “air quality”, “mortality”, and “city”, which are more widely studied. The red cluster represents “human”, “environmental exposure”, “urban health”, and different population groups such as “adult”, “male”, “female”, and “child”, along with “indoor air quality”, indicating the health impact of air pollution on these groups, with “lung function” and “asthma” as major health issues. The green cluster comprises “environmental monitoring”, “health risks”, “PM2.5”, “dust”, and various pollutant types. A small yellow cluster comprises “Asia”, the region. The time-period overlay (Figure 8b) indicates that “cancer risk”, “cities”, “health risks”, “ozone”, “aerosol”, “winter”, and “particulate matter” have been more widely studied in recent years.
3.8. Co-Occurrence Analysis of Source and Types of Air Pollution
The co-occurrence network link (1987–2024) for sources of air pollution is shown in Figure 9a. The five clusters of air pollution sources are identified as follows: The green cluster comprises “exhaust gases”, “vehicle emissions”, “automobiles”, “traffic”, and “smoking”. The red cluster centres around the main “industrial” area node, which is associated with “road dust”, “metallurgy”, and “construction activities”. The yellow cluster emphasizes indoor sources such as “cooking”, “combustion”, and “coal combustion”. The purple cluster encompasses “traffic emissions” and “industrial emissions”. The blue cluster includes “electric power”, “coal”, “fuel”, and “car”. Additionally, a small pink cluster is linked to “human activities”, “industries”, “power plants”, and “exhaust emissions”. Time period overlay indicates that “road dust”, “industrial emissions”, “fungal spores”, “hazardous waste”, “agricultural land”, and “cremation” have caught attention in recent times (Figure 9b and Figure 9c). Overall, the findings suggest that the main sources identified by the research articles are “industrial emissions”, “vehicular emissions”, “road dust”, and “indoor activities”.
Figure 10 shows the co-occurrence network for air pollutant types (studied between 1987 and 2024). Keywords such as “particulate matter”, “PM2.5”, and “dust” are the dominant themes and received sustained interest (Figure 10a). In recent times, some other types of pollutants have received more attention, such as “carbon”, “surface ozone”, “trace metals”, “heavy metals”, “anthracene”, “Polycyclic Aromatic Hydrocarbons (PAHs)”, and “acenaphthene” (Figure 10b). The surge in interest since 2020 in ‘greenhouse gases’, ‘nitrogen oxides’, ‘aerosols,’ and ‘ozone’ highlights that air pollution is studied not only for its health risks but also for its role in driving global warming and climate change. The findings indicate that addressing air pollution is closely linked to mitigating health and climate change challenges. The co-occurrence networks reveal a shifting research focus on the sources and types of air pollution, transitioning from traditional to modern pollution in urban India. Cities that emit diverse chemical and particulate matter pose exposure risks to urban populations.
Road and construction dust have become a nuisance in cities. Growing vehicular and development activities also expose urban residents to BTEX (benzene, toluene, ethylbenzene, and xylene) pollution. Biomass burning severely affects air quality and public health. Indoor air quality studies in urban homes are also affected by the presence of heavy metals in indoor PM, which is primarily generated by combustion processes, dust, and cooking.
3.9. Co-Occurrence Analysis of Impacts of Air Pollution on Human Health
Figure 11 depicts co-occurrence links regarding the health impacts of air pollution studied from 1987 to 2024. The red cluster signifies the association of air pollution with “metabolic disorders”, “abortion”, “neoplasms”, and “dermatitis”. The blue cluster indicates “respiratory diseases”. The green cluster represents “cardiovascular and respiratory diseases” as well as “mortality”. The yellow cluster connects air pollution with “malnutrition” and “headaches”, while the pink cluster highlights “Covid-19”. Time overlay highlights that recent research has focused on malnutrition, chronic obstructive pulmonary disease, ischemic heart disease, insulin resistance, and Covid-19. Respiratory diseases, cardiovascular diseases, and cancer (as the dominant node) have been consistently associated with air pollution.
The following section discusses how, over the past four decades, numerous illnesses linked to air pollution have been documented. The most affected health conditions, in terms of case numbers, include asthma, bronchitis, and respiratory diseases [44,45,46,47]; cardiovascular diseases, and cancer [48]; pulmonary/lung diseases [48], blood abnormalities, and altered immune profiles [49,50,51]; nervous system and metabolic disorders [52]; high blood pressure, diabetes, and tuberculosis [53,54]. Seasonal variations in (PM) raised further concerns. PM2.5 levels were higher in winter than in summer, and consequently, respiratory deposition was also higher in winter [28,55,56]. The risk of cancer induced by air pollution was estimated to increase markedly during the winter season [57]. Health effects of fungal spores [58,59] are a major cause of allergic reactions that can trigger asthma attacks [60].
Respiratory and cardiovascular mortality are on the increase because of air pollution [61,62], especially in transport corridors [8,63]. Children are seriously affected because of prolonged exposure to high [PMs] [64,65], leading to mortality, neonatal mortality, preterm birth, acute respiratory infection (ARI) symptoms, and low birth weight [3,42,66,67]. Studies have shown that the low-income group faces significantly greater health risks than the upper-income group [47,68] and that women face relatively greater exposure to indoor air pollution and related health vulnerabilities than men [69]. Additionally, both young and adult populations are experiencing issues such as bone and skin damage, hair fall problems, and skin cancer [70,71]. Burning mosquito coils indoors has also been linked to respiratory and heart diseases [72]. Metal concentrations, such as Nickel in the air [73] and presence of PAHs and benzo(a)pyrene in PMs also causes health risks [74]. Investigation into the role of bacterial endotoxin in PMs and associated inflammatory responses has also been conducted [75].
A visual illustration of the apparent adverse effects of air pollution on human health is shown in Figure 12. Ultrafine dust or PMs cause eye irritation and trigger ocular hypertension [76]. Pollens and dust particles (1.0–100 μm) passing through the nasal passage cause allergic rhinitis [77]. PM2.5 or particles of this size can easily enter the lungs and alveolar tissues. These particles can then enter the bloodstream and reach various organs in the body. It has been discovered that PMs can cause liver diseases and increase the risk of non-Hodgkin lymphoma. According to the Multiple Path Particle Dosimetry (MPPD) model, fine particles accumulate more in the lungs, while coarse particles accumulate more in the head [78].
Accumulation of PMs in the brain can cause Alzheimer’s disease, dementia, and strokes among all age groups [79,80,81,82,83,84,85]. In addition to PMs, gaseous-phase pollutants, such as O3, SOx, and NOx, can cause short- and long-term adverse effects on human health. These gaseous species possess oxidative properties and may induce oxidative stress (OS) and inflammation in the body [86,87,88]. An interplay of inflammation and oxidative stress contributes to initiating pathophysiological effects in multiple organs and aggravates other mechanisms, which can cause cardiovascular dysfunction [89].
PMs and NOx have been reported to be responsible for premature aging of blood vessels and excessive calcium accumulation in the coronary arteries. This causes endothelial dysfunction and restricted blood flow to the heart and other major blood vessels, resulting in cardiovascular abnormalities, heart attacks, and strokes. Potential pathophysiological mechanisms induced by air pollution in humans include autonomic nervous system disorders, leading to overactivity of the sympathetic nervous system and the adrenal glands. The effect is generally observed as anxiety and hypertension. At this stage, the release of pro-inflammatory mediators and modified lipids, including phospholipids, occurs, leading to leukocyte and platelet activation and hypercoagulability. The interplay of inflammation and oxidative stress leads to dysfunction of endothelial tissues, ultimately activating prothrombotic pathways, altering cardiac function and rhythm, and causing myocardial ischemia [90]. Oxidative stress also contributes to neurodegenerative diseases and is characterized by excessive neuronal loss. This results in dementia, cognitive impairment, disrupted motor control, and eventually death. Cigarette smoke has been established as a risk factor for neurodegenerative diseases and prominent neurological disorders, such as stroke, Alzheimer’s disease, and multiple sclerosis (MS) [91]. Microglia, a type of glial cell located throughout the brain and spinal cord, are macrophages that participate in immune defence in the central nervous system (CNS) by acting as complex, dynamic mediators of neuroinflammation. They are often referred to as “brain-resident macrophages.” These cells form a structured, heterogeneous network that maintains brain homeostasis, responds to damage or pathogen-generated stimuli, and mediates both protective and deleterious responses. Activation of microglia induces overproduction of cytokines, creating a pro-inflammatory environment in the nervous system. The latter contributes to neuronal cell damage [92,93,94,95,96]. Prolonged exposure to PM2.5 causes metabolic disorders, including modulation of hepatic pathways and glucose homeostasis, and induces systemic and pulmonary inflammation that promotes a series of maladaptive signalling pathways, ultimately leading to insulin resistance [97]. Polymorphonuclear cells (PMCs) in the lungs produce excessive ROS during exposure to particulate matter (PM2.5), causing oxidative damage to alveolar tissue and inflammation-induced IL-8. Reactive PMCs and damaged alveolar cells induce cytokine production, leading to the release of immature PMCs from the bone marrow and thereby worsening health conditions. Air pollutants can impact brain tissue directly via the nose, reaching the olfactory bulb. Indirectly, they enter the lungs, pass into the bloodstream, cross the Blood-Brain Barrier (BBB), and circulate throughout the blood.
This process impacts cells by generating excessive ROS and oxidative stress (OS), producing toxins that harm microglia. This leads to microglial activation and cytokine release, causing neuroinflammation and damage to proteins, lipids, and DNA. Consequently, there is a reduction in astrogliosis (the formation of new astrocytes) and an increase in alpha-synuclein and amyloid beta aggregation in brain tissue. These changes may contribute to neurodegenerative diseases (NDD) such as Parkinson’s, Alzheimer’s, and Multiple Sclerosis.
3.10. Mitigation Strategies
This section provides a narrative review of the mitigation strategies proposed by the included studies. Of the 172 works collected for review, only 34 contributed to the discourse on air pollution mitigation strategies, and of these, only 14 articles were published in recent years (2020 onward). A limited number of studies addressing mitigation strategies constrained the bibliometric analysis in this section. However, the growing concern about air pollution requires a thorough analysis of the country’s current mitigation strategies to inform a recommendation. Therefore, an additional literature search on air pollution mitigation strategies was conducted via Google to identify implementable strategies.
The literature highlights the effectiveness of remedial measures, such as urban zoning, in managing air pollution in Indian cities [98,99]. Action-oriented strategies such as urban land zoning, eco-design, dust control, and city expansion in accordance with land-use plans are particularly effective [42,47,100,101,102,103,104]. Additionally, the effectiveness of stricter monitoring and regulatory standards during the pandemic reestablished their significance as mitigation measures [42,47,100,101,102,103,104]. To address indoor air pollution, ventilation and the use of cleaner fuels have emerged as the primary mitigation measures [67,105,106]. However, monitoring strategies remain unevenly used due to limited data availability and slow adoption of monitoring technologies. The direct and indirect monetary burden of health on low-income households (via self-medication, loss of wages, health care deprivation, out-of-pocket expenditures, and increased vulnerability to future poor health episodes) remains underrepresented despite its relative significance for urban policy frameworks [107,108,109,110,111,112,113]. Given the susceptibility of low-income households to pollution-induced health impacts, this warrants more focused research [111,112,113,114].
The following sections discuss various air pollution mitigation strategies based on the included studies, including structural, technological, and behavioural interventions [3]. These strategies are broadly categorized as action-oriented, monitoring-oriented, and policy-oriented [41].
3.10.1. Monitoring-Oriented Strategies
These strategies aim to improve the coverage and scope of air quality measurement systems. The literature highlights the significance of monitoring secondary pollutants, their precursor emissions, and fine toxic particulates, in addition to primary pollutants [72,104,115]. To assess the spatial and temporal variability of air pollution, vertical and seasonal monitoring of particulate matter has also been suggested [116]. Some studies also recommend adherence to CPCB guidelines to maintain a minimum number of monitoring stations for SPCBs. For example, A million-plus city must have at least 25 air pollution monitoring stations according to CPCB guidelines [117]. Furthermore, the use of emerging technologies, such as biomagnetic monitoring (used to assess PM mineral composition), may facilitate effective emission assessment and, therefore, provide relevant data for developing targeted action plans [118].
The Air (Prevention and Control of Pollution) Act of 1981, as amended in 1987, established a framework for controlling and reducing air pollution. To assess air quality, the GoI introduced the National Air Quality Monitoring Programme (NAMP) across 419 cities and towns, emphasizing the reduction of fossil fuel dependence, the promotion of clean energy, and the adoption of electric vehicles. Key initiatives include the National Electric Mobility Mission Plan 2020 (launched in 2013) and the Faster Adoption and Manufacturing of Hybrid and Electric Vehicles India scheme (with Phase 1 in 2015 and Phase 2 in 2019). The National Clean Air Programme (NCAP) 2019 was introduced with an initial target of a 20-30% reduction in PM by 2024 across 122 non-attainment cities. This target was later revised to a 40% reduction in PM10 concentrations by 2025-26. Since the programme’s launch, PM10 concentrations in Mumbai have decreased by 34% [119].
3.10.2. Policy and Plan-Oriented Strategies
This aims to regulate and plan for structural and technological change through plans and policies. Several studies have called for stricter air quality standards and their effective enforcement, including the imposition of fines for violations of the National Ambient Air Quality Standards (NAAQS) [51,115,120,121]. Improvements to public transportation systems (buses, metro, canal networks), the creation of dedicated bus corridors, and subsidies for non-motorized vehicles have been proposed as key policy provisions [63,67,109,122]. To address industrial pollution, mandatory pre-establishment Environmental Impact Assessment (EIA) and periodic post-establishment environmental audits of industries are also recommended [123]. Measures to reduce suspended dust, such as using vacuum-equipped vehicles for road cleaning instead of sweeping, mandating covers for construction sites, increasing urban tree cover, and creating greenbelts, have been reaffirmed [65,67,114,123,124,125,126,127]. Additionally, periodic interventions based on need—such as penalties for firecracker burning, vehicle restrictions, or the limitation of industrial activities on certain days—are recommended to address seasonal spikes in pollution [61,114,128]. Governments are also advised to leverage social and mass media to raise awareness and to incorporate courses, summer schools, and training programmes on air pollution into school curricula [1,3].
Urban planning strategies should include establishing pedestrian walkways and bicycle lanes, minimizing parking zones, and raising parking fees to help reduce pollution [41,122,129]. Ultimately, implementing a holistic policy that combines direct pollution-control measures with improvements in energy and transport efficiency is essential, with higher-income groups—who tend to consume the most energy-intensive goods—shouldering most of the costs [68].
Indian cities are developing comprehensive clean air action plans (CAAPs) and Climate Action Plans (CAPs) [130]. Reducing indoor and outdoor air pollution is now a national priority for ‘Swasthya Nagrik Abhiyan’ under the National Health Policy [131]. Effectively tackling air pollution necessitates a comprehensive approach. This approach should combine structural reforms, advanced pollution-control technologies, climate-focused policies, improved urban planning, and energy-efficiency projects to support sustainable growth [115].
Given the transboundary nature of air pollution, several studies emphasize interstate and interagency cooperation, including active collaboration between governments and NGOs [115,132,133]. Stakeholder consultation is also essential for eco-designing cities and for developing effective action plans that account for the local context [67,128].
3.10.3. Action-Oriented Strategies
This focuses on reducing emissions at the source and across various scales [123]. At the household level, studies recommend a complete phasing out of solid fuels and kerosene, replacing them with cleaner fuels such as LPG [114]. To reduce indoor air pollution, changes in housing design, such as ensuring adequate ventilation in homes and kitchens, are recommended [105,106]. At the city level, some authors recommend strict control and planned reduction of anthropogenic activities that cause outdoor pollution, such as vehicular and industrial emissions [103,134]. These actions should be supported by the use of non-motorised vehicles, renewable energy sources, alternative fuels, and the adoption of green technologies [41,65,67,104,115,122,135]. Additionally, the use of fly ash in brick kilns and the recycling of industrial and domestic waste can be effective in controlling air pollution [114].
India’s transition to BS-VI emission standards in 2019 was a significant step toward reducing vehicular emissions. The GoI’s concerted efforts to incentivize electric vehicles in Indian cities complement these measures. With these policies in place, India aims to achieve a 30% share of electric vehicles in total vehicle sales by 2030 [136]. Indian cities are witnessing a significant shift in motorized transportation. Auto-rickshaws, which account for 5-25% of motorized trips, are rapidly transitioning to emission-free electric alternatives (e-autos) [137,138].
Strategies to control air pollution in India also include upgrading (a) the health care sector, (b) policies, (c) the transportation sector, and (d) urban design. Outdoor air pollution can be controlled by checking industrial and vehicle emissions [42,120,139,140]; expansion of public transport networks, increasing green cover, and implementation of strategic long-term air quality management strategies [67]. The use of cleaner fuels and efficient kitchen ventilation can reduce indoor pollution [66,105,141]. Advancement in public transportation [142], integration of road-rail-metro services, promoting non-motorized mobility systems (cycling and walking), separating transportation corridors (motorized and non-motorized, signal-free roads), enforcing strict parking controls and parking charges with taxes, introducing cleaner and low-fuel-consuming vehicular technologies, establishing waste-to-energy plants, implementation of PAT scheme, carbon sequestration, etc., are suggested strategies. Public policies focusing on better cities (e.g. zonation, eco-designing, urban greening, etc.) and housing designs (e.g., ventilation, cooking stoves, etc.), increased greenery in the surroundings [125], and the formulation of effective air quality management plans are suggested. Sustainable pyre burning practices [43], adoption of the Clean Air Action Plan is suggested to achieve the UN SDG target of reducing air pollution-borne health burden by 2030 [52]. Furthermore, climate change mitigation policies are recommended to cause substantial health benefits to the poor [143]. Scholars suggest adopting robust policies through technical, institutional, and behavioral interventions across all sectors to meet air quality targets and reduce the future health burden from air pollution [41]. Figure 13 highlights the need for integrated actions at different levels.
4. Discussion
This work contributes to the discourse on urban environment in India by synthesising four decades of research on air pollution and human health. 172 papers from the years 1987 to 2024 were retrieved from WoS and Scopus databases using PRISMA guidelines. The evaluation of research themes indicates that PM10 and PM2.5 are the most significant pollutants with respect to health risks in India. Additionally, it explores trends in this subject area, sources and types of air pollution, and emerging health concerns in India. It thoroughly discusses strategies to reduce air pollution, providing valuable insights for policymakers and urban planners.
4.1. Key Findings of This Study
The findings of this study indicate substantial progress in research on air pollution and health in urban India. Over the last forty years, studies have greatly improved our understanding of pollution sources, types, pathways, and health effects. These developments have provided essential insights into the development of effective air pollution mitigation strategies. The number of research articles on the chosen themes has been increasing, with a marked rise since 2010, indicating greater interest in the research area. This may be attributed to higher air pollution levels, particularly in India’s megacities, improved monitoring mechanisms, and increased multidisciplinary efforts on the topic. The National Air Quality Monitoring Programme of the Government of India, which expanded air pollution monitoring capabilities in Indian cities, has been instrumental in providing data for research on urban air pollution. The results of the bibliometric analysis indicate that PM2.5 and PM10 are the primary drivers of the rise in air pollution and the resulting health impacts. Additionally, a bias in the spatial focus of the research, particularly in favour of megacities like Delhi, Mumbai, Kolkata, and Chennai, has been observed.
4.2. Evolution of Research Focus
These developments indicate not only an increase in the quantity of research but also a narrowing of its focus. The co-occurrence analysis results indicate that air pollution has consistently been considered a potential cause of worsening health conditions in Indian cities, from the earliest studies to the most recent. The scope of research has broadened to include studies of indoor and outdoor environments related to air pollution and its health effects. The initial focus on air pollution components broadened to include their impacts based on occupational status, health economics, transboundary flows, temperature-pollution interactions, hotspots, and ultimately, the pandemic. These shifts can be further detailed, ranging from an initial focus on air pollution in general to the impacts of specific pollutants such as PM2.5, PM10, PM1.0, and heavy metals. The methods and tools used in these works have also evolved from monitoring-station-based data to include detailed bloodwork-based exposure analysis, PCA, GIS-based interpolation, and modelling [144,145]. Additionally, the studies focused on epidemiological investigations of various diseases attributable to air pollution. The health risks have also expanded to include diseases such as cancer, cardiovascular disease, immunological disease, and renal disease, as well as long-term genetic modifications [48,50,106,146]. The study of linkages between the COVID-19 lockdown and air quality has also emerged as a key focus of air pollution research in recent years [103,124,147]. At the same time, understanding different vulnerabilities based on age, gender, socio-economic status (children, women, slum residents), occupation (traffic policemen, roadside vendors), and seasonality of air pollution (annual, seasonal, daily mean) has become a part of these works for gaining additional insights and comparisons [42,49,99,106,124,148,149]. Such studies consistently emphasize the need for structural, policy, and action-oriented strategies to mitigate air pollution. Ongoing research on air pollution and its health effects increasingly focuses on genetic and molecular studies of how particulate matter contributes to various diseases in humans. This research employs a bibliographic analysis to assess the health impacts of air pollution in Indian cities, complemented by a narrative review of mitigation strategies. Consequently, our work enhances understanding of both environmental geography and the field of environment and health.
4.3. Spatial Bias
The study reveals that megacities are overrepresented at both regional and city levels, while medium- and small-sized cities are underrepresented. This highlights the concern about the lack of data at smaller scales and its role in exacerbating spatial bias in reporting [150]. Small and medium-sized cities are undergoing the highest degree of urban transformation in India and face pollution pressures comparable to those of mega-cities [106,142,150,151,152]. This imbalance could result in insufficient evidence and fewer interventions targeting small cities in India. This study suggests focusing on medium- and small-sized cities, where monitoring stations remain scarce. The lack of available information is a major concern that amplifies health risks, making it imperative to monitor and plan for air pollution in advance.
4.4. Implementing Mitigation Strategies
4.4.1. Abolishing the Burning of Waste; Remediation of Solid Waste
The exhaust gases produced during the production of clay bricks give rise to greenhouse gases [153]. The study indicated that using agroforestry and construction and demolition waste-derived fly ash to produce bricks can potentially cut CO2 emissions by 0.5-1.5 metric tons when replacing 1-2% of traditional burnt clay bricks. Large-scale brick manufacturing can effectively lower overall carbon footprints [154,155,156]. Furthermore, studies have shown that plastic waste can be used in constructing roads, lightweight bricks for flooring, and panels for external wall insulation [157,158].
Since 2006, India has built over 60,000 miles (~half the width of the US) of plastic roads. These roads outperform traditional roads in durability, high-temperature tolerance, water resistance, and crack resistance. Overall, they require less maintenance and repairs [157]. Using discarded plastic water bottles as an insulating material in buildings can help reduce landfill waste and minimize heat loss during winter, which in turn decreases wood usage [159,160,161]. Delhi and the National Capital Region (NCR) have been experiencing severely polluted air due to stubble burning during the previous winter. This can be addressed by utilising the entire stubble/straw in diverse applications.
4.4.2. Blending Ethanol with Petroleum and Promotion of Electrical and Hydrogen Fuel-Powered Vehicles
The ethanol molecule contains an oxygen atom that facilitates complete combustion, reducing emissions and environmental pollution. As a result, pollution can be significantly decreased. Ethanol, a renewable biofuel made from sugarcane molasses, is also a relatively inexpensive alternative to petroleum. As of August 31st, 2024, ethanol blending in petroleum fuel rose from 38 crore litres in the Ethanol Supply Year (ESY) 2013-2014 to 545 crore litres in the ESY 2023-2024. India achieved 15% ethanol blending in petroleum fuel for vehicles in 2024 and aims to reach 20% blending by 2025. A surge in ethanol blending in petrol from 1.54% in 2014 to 15% in 2024 is commendable progress in view of the commitment to curbing pollution. This not only saves foreign exchange on petroleum imports but also substitutes crude oil, and ultimately reduces CO2 emissions by 544 lakh metric tons.
Blending of 20% ethanol in petrol fuel is estimated to reduce the fuel import bill by 4 billion USD (INR 30,000 crores) annually[162,163]. A study on petrol fuelled motorbikes using 10% ethanol blend saw a reduction in total hydrocarbon (THC) and CO by 26%-45% and 63%-73% respectively, while observing an increase in NOx emissions by 36%-54% compared to emissions from motorbikes using pure gasoline [164]. This is attributed to the increased oxygen content in the ethanol-blended petroleum. Another study on compression ignition (CI) engine using a blend of 10% ethanol in petrol with 1.5% of emulsified hydrogen peroxide (H2O2) resulted in a reduction in all emissions, viz., CO by 80%, HC by 43%, and NOx by 17% compared to unblended regular gasoline [165].
The National Green Hydrogen Mission, approved on January 4, 2023, with an allocation of INR 19,744 crores, aims to position the nation as a global hub for the production, use, and export of green hydrogen and its derivatives, and to contribute to achieving clean energy targets. The mission targets the installation of electrolysers with 60-100 GW capacity to support production. It aims to achieve a cumulative carbon abatement of 50 million metric tons and to reduce road traffic load [166]. Indian Railways has reportedly achieved 97% electrification of the broad-gauge network and is aiming for a 100% green rail network [147,167]. The electrification of railways relies heavily on thermal power stations that generate electricity from coke and coal. However, the resulting carbon emissions remain localised rather than being dispersed over a large area as trains pass by. This approach to fully electrified railways continues to offer significant benefits in pursuing emission-free transportation.
4.4.3. Restructuring Roads, Housing Infrastructures, and Implementing Solar-Power-Based Energy Systems
Restructuring roads by constructing pedestrian pavements and separate routes for two-wheelers and cyclists can help create a clean and secure city. In India, a large population commutes by two-wheelers, and this innovation will improve traffic management, prevent road congestion, improve fuel efficiency and electric power savings in both two- and four-wheelers, and, most importantly, provide commuter safety by preventing road accidents while reducing PM emissions (Figure 14). Harnessing solar power was recognized several decades ago as a way to reduce pollution. Electricity generated by solar panels to meet household energy needs significantly reduces dependence on fossil-fuel-powered thermal power stations (Figure 15). Although eliminating PMs from the atmosphere remains challenging, minimising PM concentrations is always possible. For instance, Pradhan Mantri Ujjwala Yojana (PMUY), 2016, has benefited 10 million people with liquefied petroleum gas (LPG) connections by the year 2024, replacing conventional cooking methods and significantly reducing indoor air pollution (PIB, 2024) [162]. In all Indian cities, the construction of buildings and roads is a major source of atmospheric PMs. Covering these sites and construction materials can prevent dust, asbestos, and cement particles from being carried by moving winds by ~90-99% (Figure 16). Rain acts as a natural cleaning agent, washing away atmospheric dust and gaseous components and leaving the atmosphere clean. As shown in Figure 17, modern cities face additional problems from waterlogging on roads and in residential areas. After the water level drops to normal and the roads become dry again, only a thick cover of dust remains on the surface of vehicles and the roads themselves. The winds lift dried mud and carry it everywhere, increasing PM levels in the atmosphere. Installing proper drainage systems along roads, parks, and residential areas helps prevent mud dust. Figure 18 and Figure 19 highlight the importance of covering soil with grass and planting shady trees and bushes to prevent ground moisture from evaporating. Residential towers and high-rise buildings house a large population within a compact area, and this dense population breathes the air in that limited space. Figure 20 shows the proposed layout of the premises surrounding the residential zones. High walls separating busy roads from residential buildings and towers, along with a green canopy of trees and bushes in between, help prevent PMs and dust from entering residential houses carried by wind. The tree canopy traps dust. Rain washes dust deposited on trees and bushes into the soil. Thus, residential areas remain free of PMs for most of the year, and the population residing in these areas is protected from inhaling polluted air.
5. Limitations of the Current Study
This study acknowledges several limitations. The bibliometric analysis relies solely on two databases, Web of Science and Scopus, which may have resulted in the omission of important studies on the topic. Additionally, the inclusion criteria were limited to research articles and review papers, excluding other publication types. The unavailability of some research papers led to their exclusion (inherent risk of the PRISMA guideline in the inclusion process), potentially reducing the depth of insights into the research theme. This study reported state- and region-wise gaps in the literature. While ensuring methodological rigour, the inclusion criteria likely excluded grey literature and local reports that could have provided greater insight into state- and city-level perspectives. Similarly, the search results depended on the keywords used in this study, and the outcome may change if the keywords are different. Including additional databases and articles, along with adjusting the Boolean search string, could yield deeper insights in this field. Future research may utilise other databases for literature searches and analyses. In recent years, Artificial Intelligence (AI) has been increasingly incorporated into bibliometric analysis to enhance data retrieval and visualisation. Future studies may adopt advanced AI-based methods. Most studies were conducted in large Indian cities, where the population is large, the problem is severe, and adequate resources are available for research; limited information is available at the pan-India level due to insufficient funding to support investigations in smaller administrative units.
6. Conclusions
This research employs bibliographic analysis to assess the health impacts of air pollution in Indian cities, complemented by a narrative review of mitigation strategies. It explores trends in this subject area, sources and types of air pollution, and emerging health concerns in India. The research highlights the alarming levels of air pollution in Indian cities, particularly in the megacities. The evaluation of research themes indicates that PM10 and PM2.5 are the most significant pollutants with respect to health risks in India. Air pollution-health studies published between 1987 and 2024 strongly indicate that long-term exposure to particulate matter causes serious health issues.
The study shows that megacities are overrepresented both regionally and at the city level, whereas medium- and small-sized cities are underrepresented. This imbalance may lead to limited data and fewer targeted interventions for small cities in India. The study recommends paying attention to these smaller cities as well, which also lack sufficient monitoring stations. As these cities undergo transformation, proactive planning can improve residents’ health outcomes.
Some prior work on mitigation has suggested broader policies rather than actionable changes. The assessment of existing policies, therefore, needs more evaluation. Therefore, future research should aim to transform knowledge into actionable interventions. The study advocates for enhanced interdisciplinary and multidisciplinary research collaborations to address air pollution and associated health impacts. The mitigation strategies suggested can help shape effective measures. Nonetheless, the study recommends implementing city-specific strategies and targeted interventions to improve outcomes. It also recommends incorporating air-pollution mitigation measures into comprehensive urban development and planning frameworks.
The study suggests that initiatives to reduce pollution will not only improve public health but also strengthen climate mitigation efforts. By implementing multi-factor control policies and targeting air pollution, the total disease burden attributable to air pollution can be reduced by 25%. Although policy implementation was initiated systematically, the overall rollout has faced several hurdles for multiple reasons, viz., (a) only 25% of the proposed clean air action plans could be implemented by the year 2020; (b) challenges because of COVID-19, which rendered the spread of microbial levels high in the atmosphere; (c) the WHO gap attributed to the cities failing to meet national standards despite implementing mitigation strategies (indicated by exceeding the WHO guideline limits of 5 µg m-3).
SGD 3.4 has been adopted by the Indian administration to reduce deaths from non-communicable diseases (NCDs) by 33% by 2030 (using 2015 levels as the baseline) [27,168,169]. Achieving clean air will help the government of India to achieve the targets of Sustainable Development Goals (SDGs), specifically SDG 3-Good Health and Well-being and SDG 11-Sustainable Cities and Communities, which depend on addressing air pollution in India.
Supplementary Materials
The following supporting information can be downloaded at the website of this paper posted on Preprints.org.
Author Contributions
Akash Kumar: Keyword search, Creation of database, Methodology, Compilation of supplementary table. Garima Jasrotia: Data cleaning, Methodology, Bibliometric analysis, Formal analysis, Visualisation, review & editing (initial and final draft), validation. Zahra Sebghatollahi: Visualisation (Canva tool), Validation, formal analysis. Neelima Mahato: Conceptualization, Methodology, Visualisation (Canva tool), Validation, Writing – review & editing (initial and final draft), formal analysis. Bharghav Ghosh: Writing – review, validation. Nasir Salam: Visualisation, Validation, Writing – original draft. Binod Kumar Singh: Validation-original draft. Umesh Kumar Singh: Methodology, Validation, editing. Kiran Kumari Singh: Conceptualization, Methodology, Writing – original draft, Writing – review & editing (final draft), Visualisation, formal analysis.
Funding
The study has received no funding or grants.
Institutional Review Board Statement
Not applicable.
Informed Consent Statement
Not applicable.
Data Availability Statement
The original contributions presented in this study are included in the article and supplementary material. Further inquiries can be directed to the corresponding authors.
Acknowledgments
We sincerely appreciate the valuable feedback and comments provided by the reviewers, which helped improve this work. We are grateful to the University of Allahabad for infrastructural support.
Conflicts of Interest
The authors declare that they have no known competing financial interests or personal relationships that could have appeared to influence the work reported in this paper.
Use of Artificial Intelligence
Grammarly has been used for the English Language correction in this manuscript. Canva.com has been used for generating images.
References
- M.S. Haque, R.B. Singh, Air pollution and human health in Kolkata, India: A case study, Climate. 2017, 5, 1–16. [CrossRef]
- R. Ndugwa, UN-Habitat for a better urban future, World Heal. Organ. 2018, 1–12.
- B. Mahapatra, M. Walia, W.R. Avis, N. Saggurti, Effect of exposure to PM 10 on child health: Evidence based on a large-scale survey from 184 cities in India, BMJ Glob. Heal. (2020), 5, 13–15. [CrossRef]
- K. Balakrishnan, S. Dey, T. Gupta, R.S. Dhaliwal, M. Brauer, A.J. Cohen, J.D. Stanaway, G. Beig, T.K. Joshi, A.N. Aggarwal, Y. Sabde, H. Sadhu, J. Frostad, K. Causey, W. Godwin, D.K. Shukla, G.A. Kumar, C.M. Varghese, P. Muraleedharan, A. Agrawal, R.M. Anjana, A. Bhansali, D. Bhardwaj, K. Burkart, K. Cercy, J.K. Chakma, S. Chowdhury, D.J. Christopher, E. Dutta, M. Furtado, S. Ghosh, A.G. Ghoshal, S.D. Glenn, R. Guleria, R. Gupta, P. Jeemon, R. Kant, S. Kant, T. Kaur, P.A. Koul, V. Krish, B. Krishna, S.L. Larson, K. Madhipatla, P.A. Mahesh, V. Mohan, S. Mukhopadhyay, P. Mutreja, N. Naik, S. Nair, G. Nguyen, C.M. Odell, J.D. Pandian, D. Prabhakaran, P. Prabhakaran, A. Roy, S. Salvi, S. Sambandam, D. Saraf, M. Sharma, A. Shrivastava, V. Singh, N. Tandon, N.J. Thomas, A. Torre, D. Xavier, G. Yadav, S. Singh, C. Shekhar, T. Vos, R. Dandona, K.S. Reddy, S.S. Lim, C.J.L. Murray, S. Venkatesh, L. Dandona, The impact of air pollution on deaths, disease burden, and life expectancy across the states of India: the Global Burden of Disease Study 2017, Lancet Planet. Heal. 2019, 3, e26–e39. [CrossRef]
- Pallavi Pant, New Report Shows Nearly 9 of 10 Global Air Pollution Deaths are From Noncommunicable Diseases | Institute for Health Metrics and Evaluation, Inst. Heal. Metrics Eval. 6th Edition. 2025, 1–10. https://www.healthdata.org/news-events/newsroom/news-releases/new-report-shows-nearly-9-10-global-air-pollution-deaths-are?utm_source=chatgpt.com.
- State of Global Air, State of Global Air Report 2024, State Glob. Air Report, Boston, Massachusetts, Oct. 23, 2025. 2024, 1–35. https://www.stateofglobalair.org/sites/default/files/documents/2024-06/soga-2024-report_0.pdf.
- O.W. in D. Team, Ensure healthy lives and promote well-being for all at all ages, Sustain. Dev. Goals. 2023, 153–181. [CrossRef]
- A. Kumar, R.K. Mishra, Human health risk assessment of major air pollutants at transport corridors of Delhi, India, J. Transp. Heal. 2018, 10, 132–143. [CrossRef]
- H.S. Rumana, R.C. Sharma, V. Beniwal, A.K. Sharma, A retrospective approach to assess human health risks associated with growing air pollution in urbanized area of Thar Desert, western Rajasthan, India, J. Environ. Heal. Sci. Eng. 2014, 12, 23. [CrossRef]
- X. Jiang, A conversation on air pollution in India, Nat. Geosci. 2023, 16, 937–938. [CrossRef]
- R.M. Harrison, R.M. Harrison, Airborne particulate matter: Philos. Trans. R. Soc. A. 378, 2020.
- Y.I. Al-Neaimi, J. Gomes, O.L. Lloyd, Respiratory illnesses and ventilatory function among workers at a cement factory in a rapidly developing country, Occup. Med. (Lond). 2001, 51, 367–373. [CrossRef]
- P. Hyde, A. Mahalov, Contribution of bioaerosols to airborne particulate matter, J. Air Waste Manag. Assoc. 2020, 70, 71–77. [CrossRef]
- C. Perrino, S. Canepari, M. Catrambone, S. Dalla Torre, E. Rantica, T. Sargolini, Influence of natural events on the concentration and composition of atmospheric particulate matter, Atmos. Environ. 2009, 43, 4766–4779. [CrossRef]
- R. Kaur, P. Pandey, Air Pollution, Climate Change, and Human Health in Indian Cities: A Brief Review, Front. Sustain. Cities. 2021, 3,705131. [CrossRef]
- S. Fatima, A. Ahlawat, S.K. Mishra, V.K. Soni, R. Guleria, Respiratory Deposition Dose of PM2.5 and PM10 Before, During and After COVID-19 Lockdown Phases in Megacity-Delhi, India, MAPAN., 2022, 37, 891–900. [CrossRef]
- V. Prabhu, P. Singh, P. Kulkarni, V. Sreekanth, Characteristics and health risk assessment of fine particulate matter and surface ozone: results from Bengaluru, India, Environ. Monit. Assess. 2022, 194, 211. [CrossRef]
- S. Sridharan, M. Kumar, L. Singh, N.S. Bolan, M. Saha, Microplastics as an emerging source of particulate air pollution: A critical review., J. Hazard. Mater. 2021, 418, 126245. [CrossRef]
- L. Zhang, C. Ou, D. Magana-Arachchi, M. Vithanage, K.S. Vanka, T. Palanisami, K. Masakorala, H. Wijesekara, Y. Yan, N. Bolan, M.B. Kirkham, Indoor Particulate Matter in Urban Households: Sources, Pathways, Characteristics, Health Effects, and Exposure Mitigation., Int. J. Environ. Res. Public Health. 2021, 18 (21) 11055. [CrossRef]
- S. Bathmanabhan, S.N. Saragur Madanayak, Analysis and interpretation of particulate matter - PM10, PM2.5 and PM1 emissions from the heterogeneous traffic near an urban roadway, Atmos. Pollut. Res. 2010, 1, 184–194. [CrossRef]
- A.L. Clements, M.P. Fraser, N. Upadhyay, P. Herckes, M. Sundblom, J. Lantz, P.A. Solomon, Chemical characterization of coarse particulate matter in the Desert Southwest - Pinal County Arizona, USA, Atmos. Pollut. Res. 2014, 5, 52–61. [CrossRef]
- S. Munir, Analysing temporal trends in the ratios of PM2.5/PM10 in the UK, Aerosol Air Qual. Res. 2017, 17, 34–48. [CrossRef]
- AQEG, What is particulate matter?, Part. Matter United Kingdom. 2005 10–11. https://uk-air.defra.gov.uk/assets/documents/reports/aqeg/ch2.pdf.
- Emission Inventories, What is Polluting Delhi ’ s Air ? Understanding Emissions Inventories, 2019, 1–39.
- ISTI, Air pollution in India: Status and Challenges , India Sci. Technol. Innov. 3, 2019, 1–9.
- C. for E. India, Public Health Foundation of Health, Air pollution and health in India: A review of the current evidence and opportunities for the future, Fac. Digit. Arch. NYU Libr. 2017. www.ceh.org.in.
- D. Sarkar, F. Imam, A. Kumar, A. Mukherjee, P. Purohit, G. Kiesewetter, Z. Klimont, S. Ghosh, K. Balakrishnan, S. Chowdhury, S. Dey, Pathways for India to Reduce Ambient Air Pollution Health Burden and Achieve the Sustainable Development Goal (SDG-3.4), Environ. Sci. Technol. 2025, 59, 4765–4777. [CrossRef]
- V. Kumar, M. Yadav, S.N. Behera, Characterization of PM2.5-bound trace elements, source apportionment, and assessment of associated human health risks during summer and winter in Greater Noida, the National Capital Region of India, Front. Environ. Sci. 2022, 10, 1–20. [CrossRef]
- L. Gupta, R. Dev, K. Zaidi, R. Sunder Raman, G. Habib, B. Ghosh, Assessment of PM10 and PM2.5 over Ghaziabad, an industrial city in the Indo-Gangetic Plain: spatio-temporal variability and associated health effects, Environ. Monit. Assess. 2021, 193, 735. [CrossRef]
- V. Jain, S. Dey, S. Chowdhury, Ambient PM2.5 exposure and premature mortality burden in the holy city Varanasi, India, Environ. Pollut. 2017, 226, 182–189. [CrossRef]
- B.R. Gurjar, K. Ravindra, A.S. Nagpure, Air pollution trends over Indian megacities and their local-to-global implications, Atmos. Environ. 2016, 142, 475–495. [CrossRef]
- K. Balakrishnan, P. Ramaswamy, S. Sambandam, G. Thangavel, S. Ghosh, P. Johnson, K. Mukhopadhyay, V. Venugopal, V. Thanasekaraan, Air pollution from household solid fuel combustion in India: an overview of exposure and health-related information to inform health research priorities., Glob. Health Action. 2011, 4, 5638. [CrossRef]
- V. Conti, A. Mahendra, Assessments of Health Impacts of Transportation Projects in an Urban Indian Context, Transp. Res. Rec. 2014, 2452, 81–89. [CrossRef]
- P. Pant, S.K. Guttikunda, R.E. Peltier, Exposure to particulate matter in India: A synthesis of findings and future directions, Environ. Res. 2016, 147, 480–496. [CrossRef]
- R. Mohanraj, P.A. Azeez, Health effects of airborne particulate matter and the Indian scenario, Curr. Sci. 2004, 87, 741–748. http://www.jstor.org/stable/24109350.
- A. Pandey, M. Brauer, M.L. Cropper, K. Balakrishnan, P. Mathur, S. Dey, B. Turkgulu, G.A. Kumar, M. Khare, G. Beig, T. Gupta, R.P. Krishnankutty, K. Causey, A.J. Cohen, S. Bhargava, A.N. Aggarwal, A. Agrawal, S. Awasthi, F. Bennitt, S. Bhagwat, P. Bhanumati, K. Burkart, J.K. Chakma, T.C. Chiles, S. Chowdhury, D.J. Christopher, S. Dey, S. Fisher, B. Fraumeni, R. Fuller, A.G. Ghoshal, M.J. Golechha, P.C. Gupta, R. Gupta, R. Gupta, S. Gupta, S. Guttikunda, D. Hanrahan, S. Harikrishnan, P. Jeemon, T.K. Joshi, R. Kant, S. Kant, T. Kaur, P.A. Koul, P. Kumar, R. Kumar, S.L. Larson, R. Lodha, K.K. Madhipatla, P.A. Mahesh, R. Malhotra, S. Managi, K. Martin, M. Mathai, J.L. Mathew, R. Mehrotra, B.V.M. Mohan, V. Mohan, S. Mukhopadhyay, P. Mutreja, N. Naik, S. Nair, J.D. Pandian, P. Pant, A. Perianayagam, D. Prabhakaran, P. Prabhakaran, G.K. Rath, S. Ravi, A. Roy, Y.D. Sabde, S. Salvi, S. Sambandam, B. Sharma, M. Sharma, S. Sharma, R.S. Sharma, A. Shrivastava, S. Singh, V. Singh, R. Smith, J.D. Stanaway, G. Taghian, N. Tandon, J.S. Thakur, N.J. Thomas, G.S. Toteja, C.M. Varghese, C. Venkataraman, K.N. Venugopal, K.D. Walker, A.Y. Watson, S. Wozniak, D. Xavier, G.N. Yadama, G. Yadav, D.K. Shukla, H.J. Bekedam, K.S. Reddy, R. Guleria, T. Vos, S.S. Lim, R. Dandona, S. Kumar, P. Kumar, P.J. Landrigan, L. Dandona, Health and economic impact of air pollution in the states of India: the Global Burden of Disease Study 2019, Lancet Planet. Heal. 2021, 5, e25–e38. [CrossRef]
- M. Aria, C. Cuccurullo, bibliometrix: An R-tool for comprehensive science mapping analysis, J. Informetr. 2017, 11, 959–975. [CrossRef]
- N.J. van Eck, L. Waltman, Software survey: VOSviewer, a computer program for bibliometric mapping., Scientometrics. 2010, 84, 523–538. [CrossRef]
- N. Donthu, S. Kumar, D. Mukherjee, N. Pandey, W.M. Lim, How to conduct a bibliometric analysis: An overview and guidelines, J. Bus. Res. 2021, 133, 285–296. [CrossRef]
- K.S. Agarwal, M.Z. Mughal, P. Upadhyay, J.L. Berry, E.B. Mawer, J.M. Puliyel, The impact of atmospheric pollution on vitamin D status of infants and toddlers in Delhi, India, Arch. Dis. Child. 2002, 87, 111–113. [CrossRef]
- S.K. Guttikunda, R. Goel, Health impacts of particulate pollution in a megacity—Delhi, India, Environ. Dev. 2013, 6, 8–20. [CrossRef]
- J.S. Pandey, R. Kumar, S. Devotta, Health risks of NO2, SPM and SO2 in Delhi (India), Atmos. Environ. 2005, 39, 6868–6874. [CrossRef]
- M.G. Manoj, M.K. Satheesh Kumar, K.T. Valsaraj, S.K. Vijayan, T. Nishanth, Exacerbation of Fatality Rates Induced by Poor Air Quality Due to Open-Air Mass Funeral Pyre Cremation during the Second Wave of COVID-19, Toxics. 2022, 10(6), 306. [CrossRef]
- Y. Suresh, M.M. Sailaja Devi, V. Manjari, U.N. Das, Oxidant stress, antioxidants and nitric oxide in traffic police of Hyderabad, India, Environ. Pollut. 2000, 109, 321–325. [CrossRef]
- T. Lahiri, S. Roy, C. Basu, S. Ganguly, M.R. Ray, P. Lahiri, Air pollution in Calcutta elicits adverse pulmonary reaction in children., Indian J. Med. Res. 2000, 112, 21–26.
- A. Srivastava, R. Kumar, Economic Valuation of Health Impacts of Air Pollution in Mumbai, Environ. Monit. Assess. 2002, 75, 135–143. [CrossRef]
- A. Foster, N. Kumar, Health effects of air quality regulations in Delhi, India, Atmos. Environ. 2011, 45, 1675–1683. [CrossRef]
- I. Khanna, M. Khare, P. Gargava, Health risks associated with heavy metals in fine particulate matter: A case study in Delhi city, India, Int. Conf. Environ. Pollut. Public Heal. EPPH 2015. 2015, 72–77. [CrossRef]
- P. Chatterjee, P. Das, Association of ambient air quality with male’s pulmonary function in Kolkata city, India, Kathmandu Univ. Med. J. 2015, 13, 24–28. [CrossRef]
- M. Banerjee, S. Siddique, S. Mukherjee, S. Roychoudhury, P. Das, M.R. Ray, T. Lahiri, Hematological, immunological, and cardiovascular changes in individuals residing in a polluted city of India: A study in Delhi, Int. J. Hyg. Environ. Health. 2012, 215, 306–311. [CrossRef]
- M. Mukherjee, J. Basu, S. Datta, Air quality analysis and indexing of Kolkata city with respect to vertical floor heights and seasonal variation, Toxicol. Environ. Chem. 2012, 94, 1864–1885. [CrossRef]
- D. Sah, P.K. Verma, K.M. Kumari, A. Lakhani, Characterisation, Sources and Health Risk of Heavy Metals in PM2.5 in Agra, India, Expo. Heal. 2023, 15, 585–596. [CrossRef]
- A. Barudgar, J. Singh, B. Tyagi, Variability of Fine Particulate Matter (PM2.5) and its Association with Health and Vehicular Emissions Over an Urban Tropical Coastal Station, Mumbai, India, Thalass. An Int. J. Mar. Sci. 2022, 38, 1067–1080. [CrossRef]
- S. Mandal, S. Jaganathan, D. Kondal, J.D. Schwartz, N. Tandon, V. Mohan, D. Prabhakaran, K.M.V. Narayan, PM 2.5 exposure, glycemic markers and incidence of type 2 diabetes in two large Indian cities, BMJ Open Diabetes Res. Care. 2023, 11, 1–10. [CrossRef]
- A. Das, N.A. Baig, M. Yawar, A. Kumar, G. Habib, V. Perumal, Size fraction of hazardous particulate matter governing the respiratory deposition and inhalation risk in the highly polluted city of Delhi, Environ. Sci. Pollut. Res. 2023, 30, 11600–11616. [CrossRef]
- M. Pathan, B. Tandel, Seasonal analysis of particulate matter and its exposure on urban bikers in Nashik city, India, J. Air Pollut. Heal. 2024, 9, 59–74. [CrossRef]
- P. Kumar, A.B. Singh, R. Singh, Seasonal variation and size distribution in the airborne indoor microbial concentration of residential houses in Delhi and its impact on health, Aerobiologia (Bologna). 2021, 37, 719–732. [CrossRef]
- C. Humbal, S. Gautam, S.K. Joshi, M.S. Rajput, Spatial Variation of Airborne Allergenic Fungal Spores in the Ambient PM2.5—A Study in Rajkot City, Western Part of India, in: T. Gupta, S.P. Singh, P. Rajput, A.K. Agarwal (Eds.), Meas. Anal. Remediat. Environ. Pollut., Springer Singapore, Singapore, 2020: pp. 199–209. [CrossRef]
- S. Roy, S. Gupta Bhattacharya, Airborne fungal spore concentration in an industrial township: distribution and relation with meteorological parameters, Aerobiologia (Bologna). 2020, 36, 575–587. [CrossRef]
- R. Garaga, C.K.R. Avinash, S.H. Kota, Seasonal variation of airborne allergenic fungal spores in ambient PM10—a study in Guwahati, the largest city of north-east India, Air Qual. Atmos. Heal. 2019, 12, 11–20. [CrossRef]
- S. Maji, S. Ghosh, S. Ahmed, Association of air quality with respiratory and cardiovascular morbidity rate in Delhi, India, Int. J. Environ. Health Res. 2018, 28, 471–490. [CrossRef]
- K.J. Maji, A.K. Dikshit, A. Deshpande, Human health risk assessment due to air pollution in 10 urban cities in Maharashtra, India, Cogent Environ. Sci. 2016, 2, 1193110. [CrossRef]
- A. Kumar, R.K. Mishra, K. Sarma, Mapping spatial distribution of traffic-induced criteria pollutants and associated health risks using kriging interpolation tool in Delhi, J. Transp. Heal. 2020, 18, 100879. [CrossRef]
- N. Manojkumar, B. Srimuruganandam, S.M. Shiva Nagendra, Application of multiple-path particle dosimetry model for quantifying age specified deposition of particulate matter in human airway, Ecotoxicol. Environ. Saf. 2019, 168, 241–248. [CrossRef]
- M. Arif, R. Kumar, R. Kumar, Z. Eric, P. Gourav, Ambient black carbon, PM2.5 and PM10 at Patna: Influence of anthropogenic emissions and brick kilns, Sci. Total Environ. 2018, 624, 1387–1400. [CrossRef]
- R. Kumar, J.K. Nagar, H. Kumar, A.S. Kushwah, M. Meena, P. Kumar, N. Raj, M.K. Singhal, S.N. Gaur, Indoor air pollution and respiratory function of children in Ashok Vihar, Delhi: an exposure-response study. Asia-Pacific J. Public Heal. 2008, 20, 36–48. [CrossRef]
- M.K. Ghose, R. Paul, R.K. Banerjee, Assessment of the Status of Urban Air Pollution and Its Impact on Human Health in the City of Kolkata, Environ. Monit. Assess. 2005, 108, 151–167. [CrossRef]
- A. Garg, Pro-equity Effects of Ancillary Benefits of Climate Change Policies: A Case Study of Human Health Impacts of Outdoor Air Pollution in New Delhi, World Dev. 2011, 39, 1002–1025. [CrossRef]
- S. Dutta, S. Banerjee, Exposure to indoor air pollution & women’s health: The situation in urban India, Environ. Urban. ASIA. 2014, 5, 131–145. [CrossRef]
- L.C. Jenner, J.M. Rotchell, R.T. Bennett, M. Cowen, V. Tentzeris, L.R. Sadofsky, Detection of microplastics in human lung tissue using μFTIR spectroscopy, Sci. Total Environ. 2022, 831, 154907. [CrossRef]
- Z.K. Zeleke, B.E. Moen, M. Bråtveit, Cement dust exposure and acute lung function: a cross shift study., BMC Pulm. Med. 2010, 10, 19. [CrossRef]
- A. Anand, H.C. Phuleria, Assessment of indoor air quality and housing, household and health characteristics in densely populated urban slums, Environ. Dev. Sustain. 2022, 24, 11929–11952. [CrossRef]
- A.R. Oller, G. Oberdörster, S.K. Seilkop, Derivation of PM10 size-selected human equivalent concentrations of inhaled nickel based on cancer and non-cancer effects on the respiratory tract, Inhal. Toxicol. 2014, 26, 559–578. [CrossRef]
- D.S. Jyethi, P.S. Khillare, S. Sarkar, Particulate phase polycyclic aromatic hydrocarbons in the ambient atmosphere of a protected and ecologically sensitive area in a tropical megacity, Urban For. Urban Green. 2014, 13, 854–860. [CrossRef]
- S. Gangamma, Characteristics of airborne bacteria in Mumbai urban environment, Sci. Total Environ. 2014, 488–489, 70–74. [CrossRef]
- L. Li, C. Xing, J. Zhou, L. Niu, B. Luo, M. Song, J. Niu, Y. Ruan, X. Sun, Y. Lei, Airborne particulate matter (PM(2.5)) triggers ocular hypertension and glaucoma through pyroptosis., Part. Fibre Toxicol. 2021, 18, 10. [CrossRef]
- World Allergy Organization, White Book on Allergy: Update 2013, Executive Summary, World Allergy Organ. 2013 20.
- K. Rajouriya, A. Taneja, Age-specific lobar and regional deposition of size-segregated particulate in a glass city of India and their health impact, Air Qual. Atmos. Heal. 2023, 16, 2163–2176. [CrossRef]
- C.-R. Jung, Y.-T. Lin, B.-F. Hwang, Ozone, particulate matter, and newly diagnosed Alzheimer’s disease: a population-based cohort study in Taiwan., J. Alzheimers. Dis. 2015, 44, 573–584. [CrossRef]
- H. Lin, Y. Guo, Q. Di, Y. Zheng, P. Kowal, J. Xiao, T. Liu, X. Li, W. Zeng, S.W. Howard, E.J. Nelson, Z. Qian, W. Ma, F. Wu, Ambient PM(2.5) and Stroke: Effect Modifiers and Population Attributable Risk in Six Low- and Middle-Income Countries, Stroke. 2017, 48, 1191–1197. [CrossRef]
- B.A. Maher, I.A.M. Ahmed, V. Karloukovski, D.A. MacLaren, P.G. Foulds, D. Allsop, D.M.A. Mann, R. Torres-Jardón, L. Calderon-Garciduenas, Magnetite pollution nanoparticles in the human brain., Proc. Natl. Acad. Sci. U. S. A. 2016, 113, 10797–10801. [CrossRef]
- A. Oudin, D. Segersson, R. Adolfsson, B. Forsberg, Association between air pollution from residential wood burning and dementia incidence in a longitudinal study in Northern Sweden, PLOS ONE. 2018, 13, e0198283. [CrossRef]
- T. Taj, A.H. Poulsen, M. Ketzel, C. Geels, J. Brandt, J.H. Christensen, R. Puett, U.A. Hvidtfeldt, M. Sørensen, O. Raaschou-Nielsen, Long-term exposure to PM2.5 and its constituents and risk of Non-Hodgkin lymphoma in Denmark: A population-based case–control study, Environ. Res. 2020, 188, 109762. [CrossRef]
- T. VoPham, N.J. Kim, K. Berry, J.A. Mendoza, J.D. Kaufman, G.N. Ioannou, PM(2.5) air pollution exposure and nonalcoholic fatty liver disease in the Nationwide Inpatient Sample., Environ. Res. 2022, 213, 113611. [CrossRef]
- H.E. Volk, F. Lurmann, B. Penfold, I. Hertz-Picciotto, R. McConnell, Traffic-related air pollution, particulate matter, and autism. JAMA Psychiatry. 2013, 70, 71–77. [CrossRef]
- A. Auerbach, M.L. Hernandez, The effect of environmental oxidative stress on airway inflammation., Curr. Opin. Allergy Clin. Immunol. 2012, 12, 133–139. [CrossRef]
- C. Liu, Y. Zhang, C.J. Weschler, The impact of mass transfer limitations on size distributions of particle-associated SVOCs in outdoor and indoor environments, Sci. Total Environ. 2014, 497–498, 401–411. [CrossRef]
- R.D. Brook, S. Rajagopalan, C.A. Pope III, J.R. Brook, A. Bhatnagar, A. V Diez-Roux, F. Holguin, Y. Hong, R. V Luepker, M.A. Mittleman, Particulate matter air pollution and cardiovascular disease: an update to the scientific statement from the American Heart Association, Circulation. 2010, 121, 2331–2378.
- M.R. Miller, Oxidative stress and the cardiovascular effects of air pollution, Free Radic. Biol. Med. 2020, 151, 69–87. [CrossRef]
- R. Riziq, Y. Abumuaileq, Air Pollution Is a Major Risk for Cardiovascular Disease Worldwide, Community Pract. 2020, 93, 12. https://ahs.idm.oclc.org/login?url=https://search.ebscohost.com/login.aspx?direct=true&db=ccm&AN=144475574&site=ehost-live&scope=site.
- N. Hamadi, S. Beegam, N.E. Zaaba, O. Elzaki, M.A. Altamimi, A. Nemmar, Neuroinflammation, Oxidative Stress, Apoptosis, Microgliosis and Astrogliosis in the Cerebellum of Mice Chronically Exposed to Waterpipe Smoke, Biomedicines. 2023, 11 (4), 1104. [CrossRef]
- K. Aoshiba, A. Nagai, Oxidative Stress, Cell Death, and Other Damage to Alveolar Epithelial Cells Induced by Cigarette Smoke, Tob. Induc. Dis. 2003, 1, 219. [CrossRef]
- J.A. Denburg, S.F. van Eeden, Bone marrow progenitors in inflammation and repair: New vistas in respiratory biology and pathophysiology, Eur. Respir. J. 2006, 27, 441–445. [CrossRef]
- X. Song, T.M. AW, F. Ma, D. Leung, K. Herrup, DNA damage induced neuroinflammation in neurodegenerative disease, Alzheimer’s Dement. 2020, 16, 47445. [CrossRef]
- D.S.A. Simpson, P.L. Oliver, ROS generation in microglia: Understanding oxidative stress and inflammation in neurodegenerative disease, Antioxidants. 2020, 9, 1–27. [CrossRef]
- F.S. Bezerra, M. Lanzetti, R.T. Nesi, A.C. Nagato, C.P. e. Silva, E. Kennedy-Feitosa, A.C. Melo, I. Cattani-Cavalieri, L.C. Porto, S.S. Valenca, Oxidative Stress and Inflammation in Acute and Chronic Lung Injuries, Antioxidants. 2023, 12, 1–46. [CrossRef]
- Z. Zheng, X. Xu, X. Zhang, A. Wang, C. Zhang, M. Hüttemann, L.I. Grossman, L.C. Chen, S. Rajagopalan, Q. Sun, K. Zhang, Exposure to ambient particulate matter induces a NASH-like phenotype and impairs hepatic glucose metabolism in an animal model, J. Hepatol. 2013, 58, 148–154. [CrossRef]
- Nidhi, G. Jayaraman, Air quality and respiratory health in Delhi, Environ. Monit. Assess. 2007, 135, 313–325. [CrossRef]
- D. Prasad, S. Sanyal, Air quality and its effect on health: A geographical perspective of Lucknow city, Sp. Cult. India. 2016, 4, 51–64. [CrossRef]
- S. Siddique, M.R. Ray, T. Lahiri, Effects of air pollution on the respiratory health of children: a study in the capital city of India, Air Qual. Atmos. Heal. 2011, 4, 95–102. [CrossRef]
- K. Balakrishnan, B. Ganguli, S. Ghosh, S. Sambandam, S. Sen Roy, A. Chatterjee, A spatially disaggregated time-series analysis of the short-term effects of particulate matter exposure on mortality in Chennai, India, Air Qual. Atmos. Heal. 2013, 6, 111–121. [CrossRef]
- C. Kesavachandran, B.S. Pangtey, V. Bihari, M. Fareed, M.K. Pathak, A.K. Srivastava, N. Mathur, Particulate matter concentration in ambient air and its effects on lung functions among residents in the National Capital Region, India, Environ. Monit. Assess. 2013, 185, 1265–1272. [CrossRef]
- S.Y. Ali, P. Mukherjee, S. Sunar, S. Saha, P. Saha, S. Dutta, S. Goswami, Significant effect of COVID-19 induced lockdown on air quality of the Indian Metropolitan City Kolkata using Air Quality Index and Health Air Quality Index, Hum. Ecol. Risk Assess. An Int. J. 2022, 28, 762–782. [CrossRef]
- S. Ambika, U. Basappa, A. Singh, V. Gonugade, R. Tholiya, Impact of social lockdown due to COVID-19 on environmental and health risk indices in India, Environ. Res. 2021, 196, 110932. [CrossRef]
- P. Kulshreshtha, M. Khare, A Comparative Study Of Indoor Air Pollution And Its Respiratory Impacts In Delhi, India, WIT Trans. Ecol. Environ. 2010, 136, 287–296.
- A. Singh, R. Kamal, M.K.R. Mudiam, M.K. Gupta, G.N.V. Satyanarayana, V. Bihari, N. Shukla, A.H. Khan, C.N. Kesavachandran, Heat and PAHs emissions in indoor kitchen air and their impact on kidney dysfunctions among kitchen workers in Lucknow, North India, PLOS ONE. 2016, 11, 1–16. [CrossRef]
- K.J. Maji, A.K. Dikshit, A. Deshpande, Human health risk as a basis for prioritizing air quality monitoring stations in a megacity: a case study, Arab. J. Geosci. 2017, 10, 394. [CrossRef]
- K.J. Maji, A.K. Dikshit, A. Deshpande, Disability-adjusted life years and economic cost assessment of the health effects related to PM2.5 and PM10 pollution in Mumbai and Delhi, in India from 1991 to 2015, Environ. Sci. Pollut. Res. 2017, 24, 4709–4730. [CrossRef]
- K.J. Maji, A.K. Dikshit, A. Deshpande, Assessment of City Level Human Health Impact and Corresponding Monetary Cost Burden due to Air Pollution in India Taking Agra as a Model City, Aerosol Air Qual. Res. 2017, 17, 831–842. [CrossRef]
- K. Rumchev, Y. Zhao, J. Spickett, Health risk assessment of indoor air quality, socioeconomic and house characteristics on respiratory health among women and children of Tirupur, South India, Int. J. Environ. Res. Public Health. 2017, 14(4), 429. [CrossRef]
- S. Mor, P. Parihar, K. Ravindra, Community perception about air pollution, willingness to pay and awareness about health risks in Chandigarh, India, Environ. Challenges. 2022, 9, 100656. [CrossRef]
- N. Manojkumar, M. Manish Kumar, S.K. Somwanshi, M. Monish Raj, B. Srimuruganandam, Estimation of PM2.5-Related Hospital Admissions and Its Monetary Burden in Hyderabad, India BT - Advances in Geotechnical and Transportation Engineering, in: S. Saride, B. Umashankar, D. Avirneni (Eds.), Adv. Geotech. Transp. Eng., Springer Singapore, Singapore, 2020: pp. 1–10.
- M. Nair, H. Bherwani, S. Mirza, S. Anjum, R. Kumar, Valuing burden of premature mortality attributable to air pollution in major million-plus non-attainment cities of India, Sci. Rep. 2021, 11, 1–15. [CrossRef]
- T.O. Etchie, S. Sivanesan, G.O. Adewuyi, K. Krishnamurthi, P.S. Rao, A.T. Etchie, A. Pillarisetti, N.K. Arora, K.R. Smith, The health burden and economic costs averted by ambient PM2.5 pollution reductions in Nagpur, India, Environ. Int. 2017, 102, 145–156. [CrossRef]
- H.H. Dholakia, D. Bhadra, A. Garg, Short-term association between ambient air pollution and mortality and modification by temperature in five Indian cities, Atmos. Environ. 2014, 99, 168–174. [CrossRef]
- M.R. Ezhilkumar, S. Karthikeyan, Vertical Measurement of PM2.5 and PM10 in Street Canyons and Cohort Health Risk Estimation at Chennai, South India, Environ. Eng. Sci. 2020, 37, 535–547. [CrossRef]
- A. Dutta, W. Jinsart, Assessing short-term effects of ambient air pollution on respiratory diseases in Guwahati, India with the application of the generalized additive model, Hum. Ecol. Risk Assess. An Int. J. 2021, 27, 1786–1807. [CrossRef]
- B. Singh, A. Kaushik, Application of biomagnetic analysis technique using roadside trees for monitoring and identification of possible sources of atmospheric particulates in selected air pollution hotspots in Delhi, India, Atmos. Pollut. Res. 2021,12, 101113. [CrossRef]
- PIB- India, Press Information Bureau, Government of India, Ministry of Environment, Forest and Climate Change, PIB Delhi. 2019, 1–5.
- A.B. Chelani, D.G. Gajghate, M.Z. Hasan, Airborne toxic metals in the air of Mumbai City, India, Bull. Environ. Contam. Toxicol. 2001, 66, 196–205. [CrossRef]
- G. Yadav, R.B. Singh, S. Anand, B.W. Pandey, A. Mohanty, S.S. Dash, Ecological model analysis of respiratory health risk factors by ambient air pollution in Lucknow, the capital City of Uttar Pradesh, India, GeoJournal. 2022, 87, 469–483. [CrossRef]
- A. Bhardawaj, G. Habib, A. Padhi, A. Anand, N. Mahala, B.K. Singh, Deteriorating air quality and increased health risks in Delhi: The decisions being delayed, IIOAB J. 2016, 7, 10–15.
- S. Basant, A. Balram, Review on composition, emission sources of RSPM, TSPM, heavy metals and ions with effect on environment and health, Res. J. Chem. Environ. 2016, 20, 31–43.
- Markandeya, P.K. Verma, V. Mishra, N.K. Singh, S.P. Shukla, D. Mohan, Spatio-temporal assessment of ambient air quality, their health effects and improvement during COVID-19 lockdown in one of the most polluted cities of India, Environ. Sci. Pollut. Res. 2021, 28, 10536–10551. [CrossRef]
- A. Taushiba, S. Dwivedi, F. Zehra, P.N. Shukla, A.J. Lawrence, Assessment of indoor air quality and its inter-association in hospitals of northern India—a cross-sectional study, Air Qual. Atmos. Heal. 2023, 16, 1023–1036. [CrossRef]
- V. Prabhu, S.K. Gupta, S. Madhwal, V. Shridhar, Exposure to Atmospheric Particulates and Associated Respirable Deposition Dose to Street Vendors at the Residential and Commercial Sites in Dehradun City, Saf. Health Work. 2019, 10, 237–244. [CrossRef]
- R. Kushwaha, H. Lal, A. Srivastava, V.K. Jain, Human Exposure to Particulate Matter and Their Risk Assessment over Delhi, India, Natl. Acad. Sci. Lett. 2012, 35, 497–504. [CrossRef]
- V.S. Limaye, K. Knowlton, S. Sarkar, P.S. Ganguly, S. Pingle, P. Dutta, L.M. Sathish, A. Tiwari, B. Solanki, C. Shah, G. Raval, K. Kakkad, G. Beig, N. Parkhi, A. Jaiswal, D. Mavalankar, Development of Ahmedabad’s Air Information and Response (Air) plan to protect public health, Int. J. Environ. Res. Public Health. 2018, 15(7), 1460. [CrossRef]
- R. Prasannavenkatesh, R. Andimuthu, P. Kandasamy, G. Rajadurai, D. Subash Kumar, P. Radhapriya, M. Ponnusamy, Assessment of Population Exposure to Coarse and Fine Particulate Matter in the Urban Areas of Chennai, India, Sci. World J. 2015, 2015, 1–28. [CrossRef]
- GoWB, Clean Air Action Plan - Haldia, (2020).
- G. Mitchell, R. Dole, J.R. Sasser, W.C. Ferguson, J.T. Lynn, M.D. Bromberg, A National Health Policy?, Rev. Fed. Am. Health Syst. 1990, 23, 22–35, 38, 42. [CrossRef]
- S. Tiwari, A. Kumar, S. Mantri, S. Dey, Modelling ambient PM2.5 exposure at an ultra-high resolution and associated health burden in megacity Delhi: exposure reduction target for 2030, Environ. Res. Lett. 2023, 18, 044010. [CrossRef]
- A. Garg, N.C. Gupta, A. Kumar, Relative Risks of Cardiopulmonary and Lung Cancer Mortality by PM2.5 Exposure in Ambient Air of Delhi, Particularly During Smog Episode, Environ. Claims J. 2023, 35, 205–222. [CrossRef]
- R. Gadi, Shivani, S.K. Sharma, T.K. Mandal, Source apportionment and health risk assessment of organic constituents in fine ambient aerosols (PM2.5): A complete year study over the National Capital Region of India, Chemosphere. 2019, 221, 583–596. [CrossRef]
- B. Ghosh, P.K. Padhy, S. Niyogi, P.K. Patra, M. Hecker, A Comparative Study of Heavy Metal Pollution in Ambient Air and the Health Risks Assessment in Industrial, Urban and Semi-Urban Areas of West Bengal, India: An Evaluation of Carcinogenic, Non-Carcinogenic, and Additional Lifetime Cancer Cases, Environ. 2023, 10(11), 190. [CrossRef]
- G. of I. Ministry of Power, India EV Digest 2023, (2024) 1–181.
- I. Cities, Enabling the Shift To Electric Auto-Rickshaws, (2023).
- P. Thakur, S. Pal, Estimating vehicular emissions from auto rickshaws plying in Bengaluru, Int. J. Sci. Eng. Res. 2018, 9, 2241–2245. [CrossRef]
- A. Joseph, A. Sawant, A. Srivastava, PM10 and its impacts on health - a case study in Mumbai, Int. J. Environ. Health Res. 2003, 13, 207–214. [CrossRef]
- R. Mohanraj, P.A. Azeez, T. Priscilla, Heavy metals in airborne particulate matter of urban Coimbatore, Arch. Environ. Contam. Toxicol. 2004, 47, 162–167. [CrossRef]
- S. Saksena, P.B. Singh, R.K. Prasad, R. Prasad, P. Malhotra, V. Joshi, R.S. Patil, Exposure of infants to outdoor and indoor air pollution in low-income urban areas — a case study of Delhi, J. Expo. Sci. Environ. Epidemiol. 2003, 13, 219–230. [CrossRef]
- G.C. Kisku, S. Pradhan, A.H. Khan, S.K. Bhargava, Pollution in Lucknow City and its health implication on exposed vendors, drivers and traffic policemen, Air Qual. Atmos. Heal. 2013, 6, 509–515. [CrossRef]
- H.H. Dholakia, P. Purohit, S. Rao, A. Garg, Impact of current policies on future air quality and health outcomes in Delhi, India, Atmos. Environ. 2013, 75, 241–248. [CrossRef]
- S. Sengupta, R.S. Patil, P. Venkatachalam, Assessment of population exposure and risk zones due to air pollution using the Geographical Information System, Comput. Environ. Urban Syst. 1996, 20, 191–199. [CrossRef]
- A. Kumar, I. Gupta, J. Brandt, R. Kumar, A.K. Dikshit, R.S. Patil, Air quality mapping using GIS and economic evaluation of health impact for Mumbai City, India, J. Air Waste Manage. Assoc. 2016, 66, 470–481. [CrossRef]
- A. Kumar, B. Ambade, T.K. Sankar, S.S. Sethi, S. Kurwadkar, Source identification and health risk assessment of atmospheric PM2.5-bound polycyclic aromatic hydrocarbons in Jamshedpur, India, Sustain. Cities Soc. 2020, 52, 101801. [CrossRef]
- A. Kumar, P. Saxena, A.A. Siddiqui, S. Bojjagani, A.H. Khan, G.C. Kisku, Impact of lockdown (COVID-19) and unlocking period on ambient air quality and human health in Lucknow city, India, J. Atmos. Chem. 2023, 80, 271–289. [CrossRef]
- S. Sharma, G.R. Sethi, A. Rohtagi, A. Chaudhary, R. Shankar, J.S. Bapna, V. Joshi, D.G. Sapir, Indoor air quality and acute lower respiratory infection in Indian urban slums, Environ. Health Perspect. 1998, 106, 291–297. [CrossRef]
- C.T. Kamala, V. Balaram, M. Satyanarayanan, A. Kiran Kumar, K.S. V Subramanyam, Biomonitoring of Airborne Platinum Group Elements in Urban Traffic Police Officers, Arch. Environ. Contam. Toxicol. 2015, 68, 421–431. [CrossRef]
- A. Dutta, W. Jinsart, Risks to health from ambient particulate matter (PM2.5) to the residents of Guwahati city, India: An analysis of prediction model, Hum. Ecol. Risk Assess. An Int. J. 2021, 27, 1094–1111. [CrossRef]
- V. Singh, B.B. Sharma, R. Yadav, P. Meena, Respiratory Morbidity Attributed to Auto-exhaust Pollution in Traffic Policemen of Jaipur, India, J. Asthma. 2009, 46, 118–121. [CrossRef]
- M. Thakur, M. Kanti Deb, S. Imai, Y. Suzuki, K. Ueki, A. Hasegawa, Load of heavy metals in the airborne dust particulates of an urban city of Central India, Environ. Monit. Assess. 2004, 95, 257–268. [CrossRef]
- S.H. Singh, N. Gas, Petroleum Minister Hardeep S Puri Highlights India’s Bioenergy Progress at India Bio-Energy & Tech Expo 2024 Ethanol Blending Percentage Surges from 1 . 53% in 2014 to 15% in 2024 : Hardeep S Puri E100 Fuel Launched at Over 400 Retail Outlets Nationwi, 2024 (2024) 4–7.
- G.S. dos Reis, B.G. Cazacliu, A. Cothenet, P. Poullain, M. Wilhelm, C.H. Sampaio, E.C. Lima, W. Ambros, J.M. Torrenti, Fabrication, microstructure, and properties of fired clay bricks using construction and demolition waste sludge as the main additive, J. Clean. Prod. 2020, 258, 120733. [CrossRef]
- A.I. Osman, M. Farghali, Y. Dong, J. Kong, M. Yousry, A.K. Rashwan, Z. Chen, A. Al-Fatesh, D.W. Rooney, P.S. Yap, Reducing the carbon footprint of buildings using biochar-based bricks and insulating materials: a review, Springer International Publishing, 2024. [CrossRef]
- J. Sun, H. Zhou, H. Jiang, W. Zhang, L. Mao, Recycling municipal solid waste incineration fly ash in fired bricks: An evaluation of physical-mechanical and environmental properties, Constr. Build. Mater. 2021, 294, 123476. [CrossRef]
- A. Parson, How Paving With Plastic Could Make a Dent in the Global Waste Problem, Yale E360. (2021).
- P. Patil, N. Stankevich, N.T. June, ‘ Plastic roads ’ made from waste : A path worth paving for South Asia ?, 2023, 1–7.
- H. Advies, Improving Thermal Insulation Through the Use of Plastic Waste, 2018, 3–4.
- R. Mahrous, E. Giancola, A. Osman, T. Asawa, H. Mahmoud, Alternative to PCM: Recycling Plastic Waste for Affordable Thermal Insulation in Building Envelopes: An Experimental Analysis, Futur. Cities Environ. 2024, 10, 1–15. [CrossRef]
- E. Mousakhani, A. Simons, D. Harris, M. Yavarkhani, A. Anvari, The reuse of discarded plastic water bottles as an insulating material for external walls in buildings, IOP Conf. Ser. Mater. Sci. Eng. 2022, 1218, 012051. [CrossRef]
- P.I. Bureau, Press Information Bureau Government of India India’s Ethanol Push : A Path to Energy Security, Press Inf. Bur. Gov. India. 2025, 1–7.
- Ministry of Petroleum and Natural Gas, Ethanol Blended Petrol (EBP) Programme, Gov. India. 2023, 1–11. https://mopng.gov.in/en/refining/ethanol-blended-petrol.
- L. Li, Y. Ge, M. Wang, Z. Peng, Y. Song, L. Zhang, W. Yuan, Exhaust and evaporative emissions from motorcycles fueled with ethanol gasoline blends, Sci. Total Environ. 2015, 502, 627–631. [CrossRef]
- A.B. V Barboza, S. Mohan, P. Dinesha, On reducing the emissions of CO, HC, and NOx from gasoline blended with hydrogen peroxide and ethanol: Optimization study aided with ANN-PSO, Environ. Pollut. 2022, 310, 119866. [CrossRef]
- MNRE, Ministry of New and Renewable Energy, Natl. Green Hydrog. Mission. 2024. http://mnre.gov.in/.
- H. Latest, Govt approves Rs 10 , 900 cr PM E-DRIVE scheme to push electric mobility The Union Cabinet chaired by Prime Minister Narendra Electric Drive Revolution in Innovative Vehicle, Bus. Times 50. 2024, 10–13.
- P. Rafaj, G. Kiesewetter, T. Gül, W. Schöpp, J. Cofala, Z. Klimont, P. Purohit, C. Heyes, M. Amann, J. Borken-Kleefeld, L. Cozzi, Outlook for clean air in the context of sustainable development goals, Glob. Environ. Chang. 2018, 53, 1–11. [CrossRef]
- U. Ram, P. Jha, P. Gerland, R.J. Hum, P. Rodriguez, W. Suraweera, K. Kumar, R. Kumar, R. Dikshit, D. Xavier, R. Gupta, P.C. Gupta, F. Ram, Age-specific and sex-specific adult mortality risk in India in 2014: analysis of 0·27 million nationally surveyed deaths and demographic estimates from 597 districts. Lancet. Glob. Heal. 2015, 3, e767-75. [CrossRef]
Figure 1.
Sources of indoor and outdoor air pollution in major Indian cities; Image created by the author using Canva.com tools.
Figure 1.
Sources of indoor and outdoor air pollution in major Indian cities; Image created by the author using Canva.com tools.
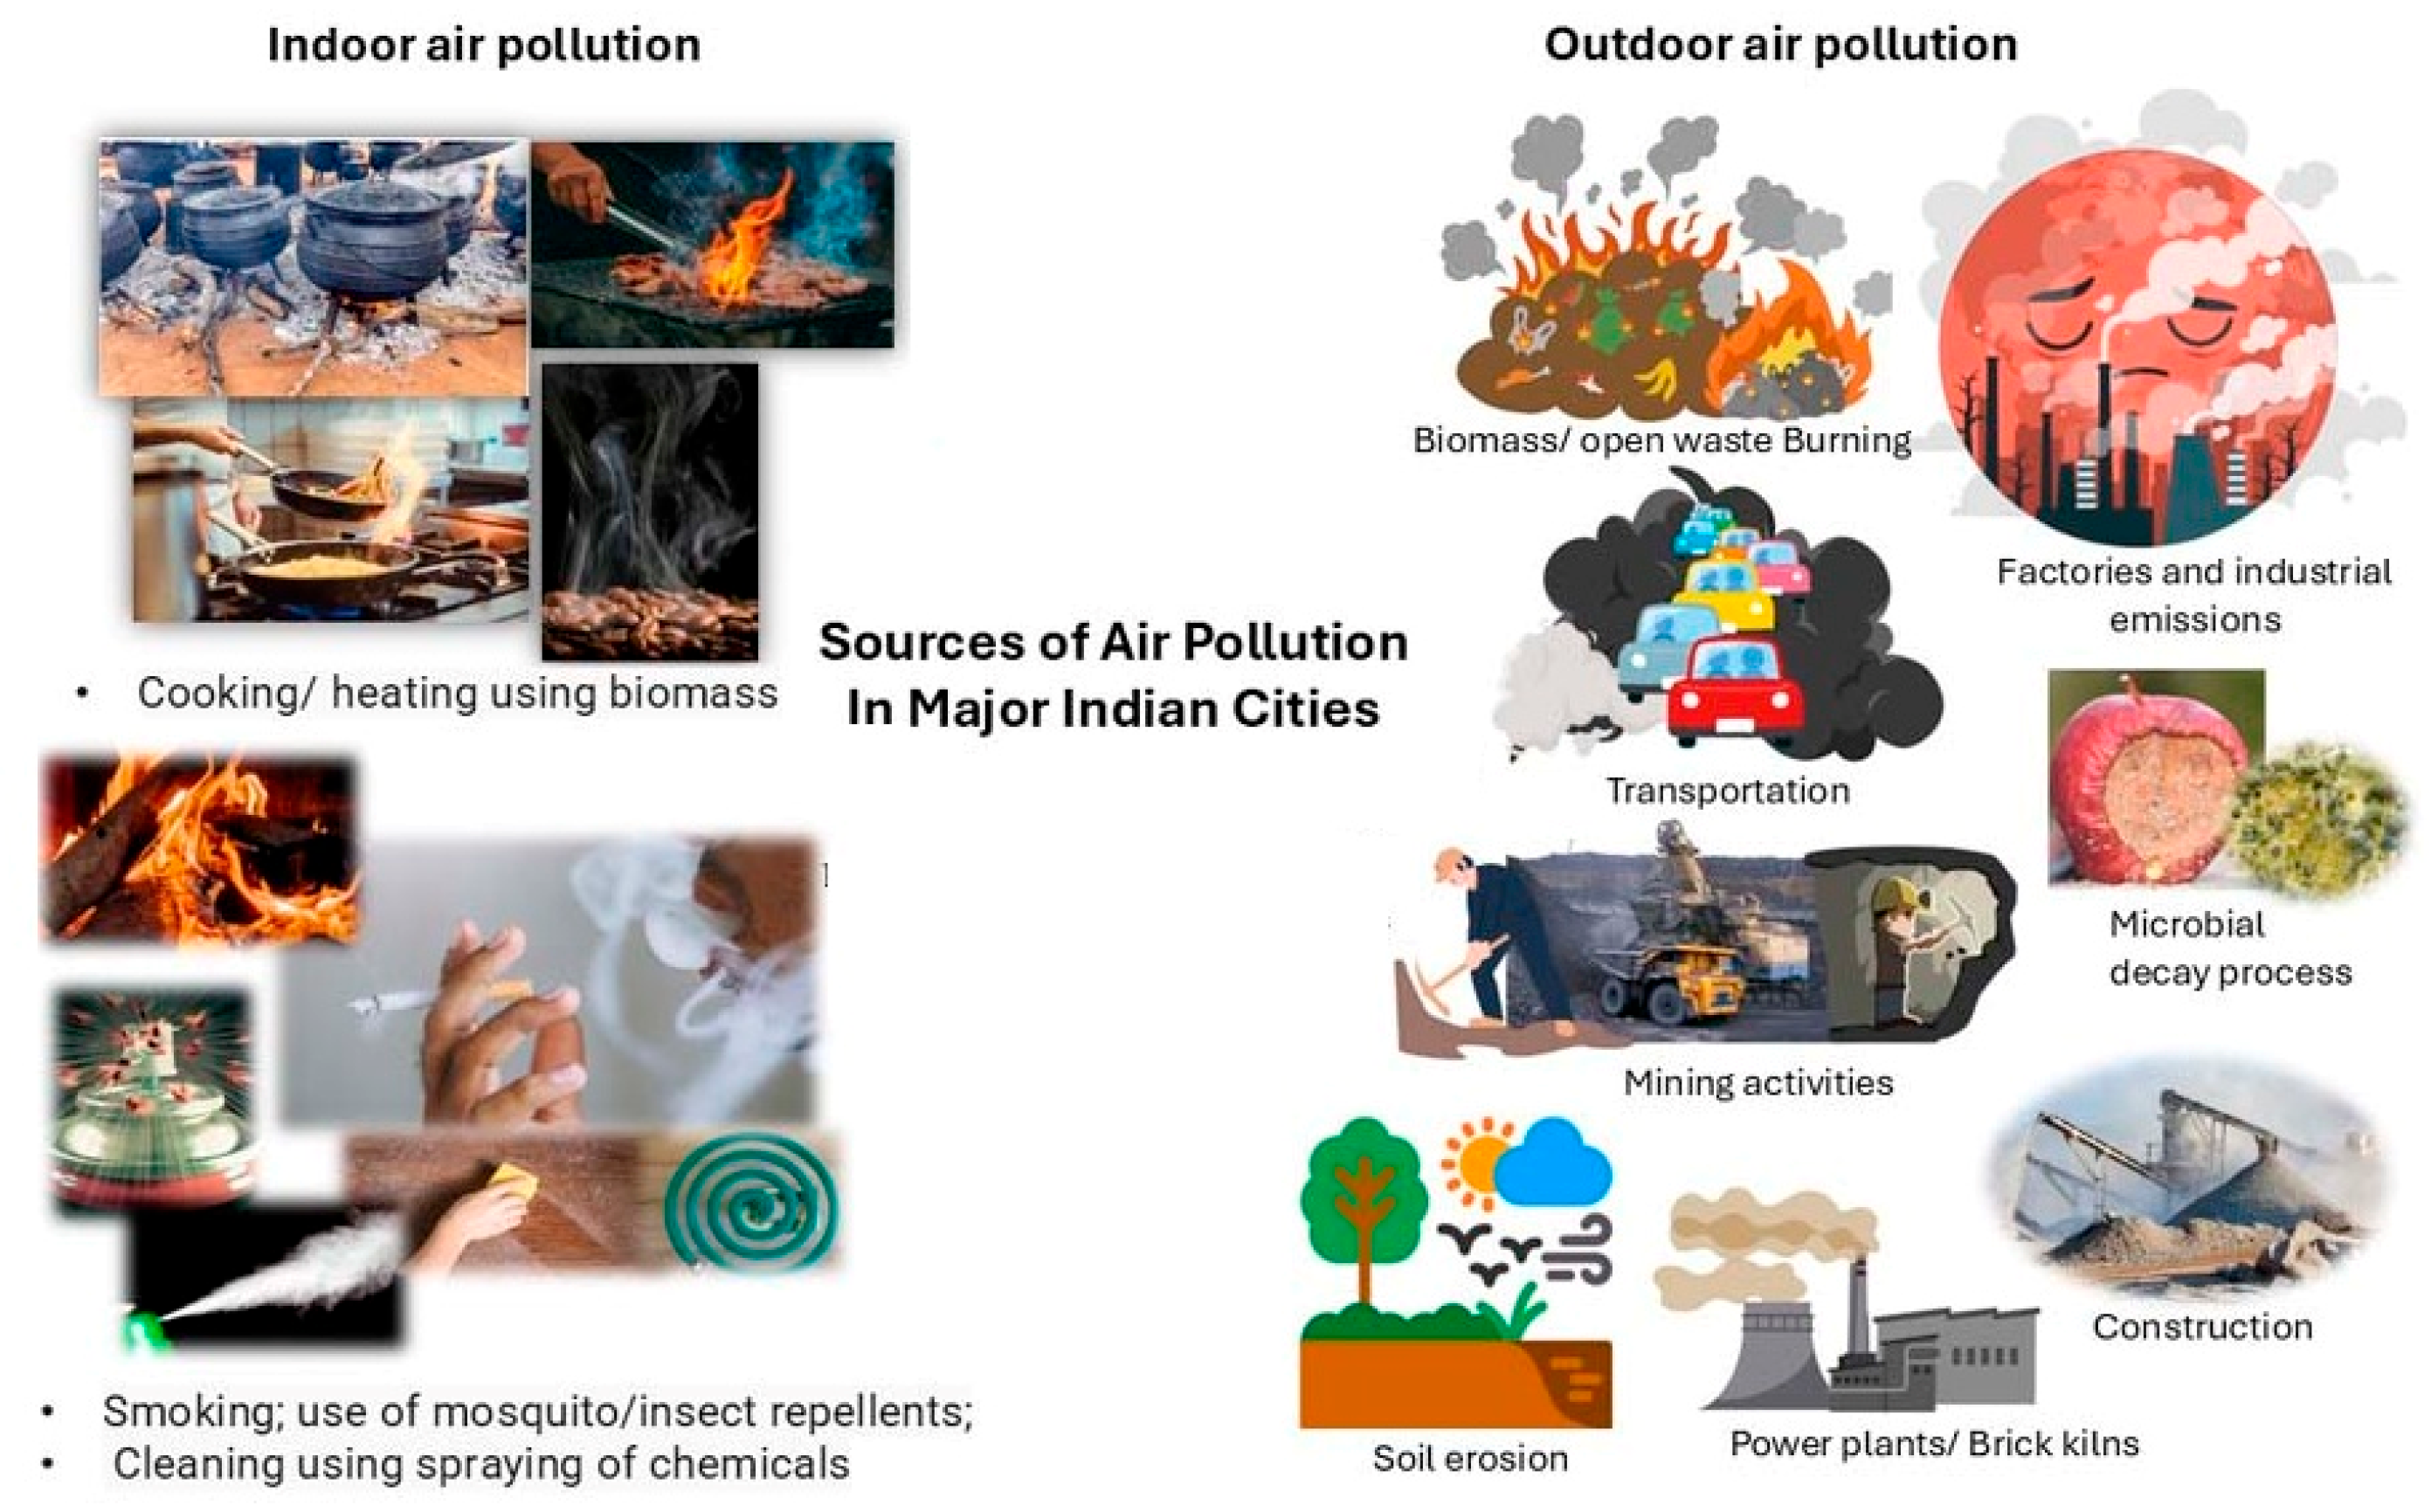
Figure 2.
Main sources of air pollution in major Indian metropolitan cities [25].
Figure 2.
Main sources of air pollution in major Indian metropolitan cities [25].
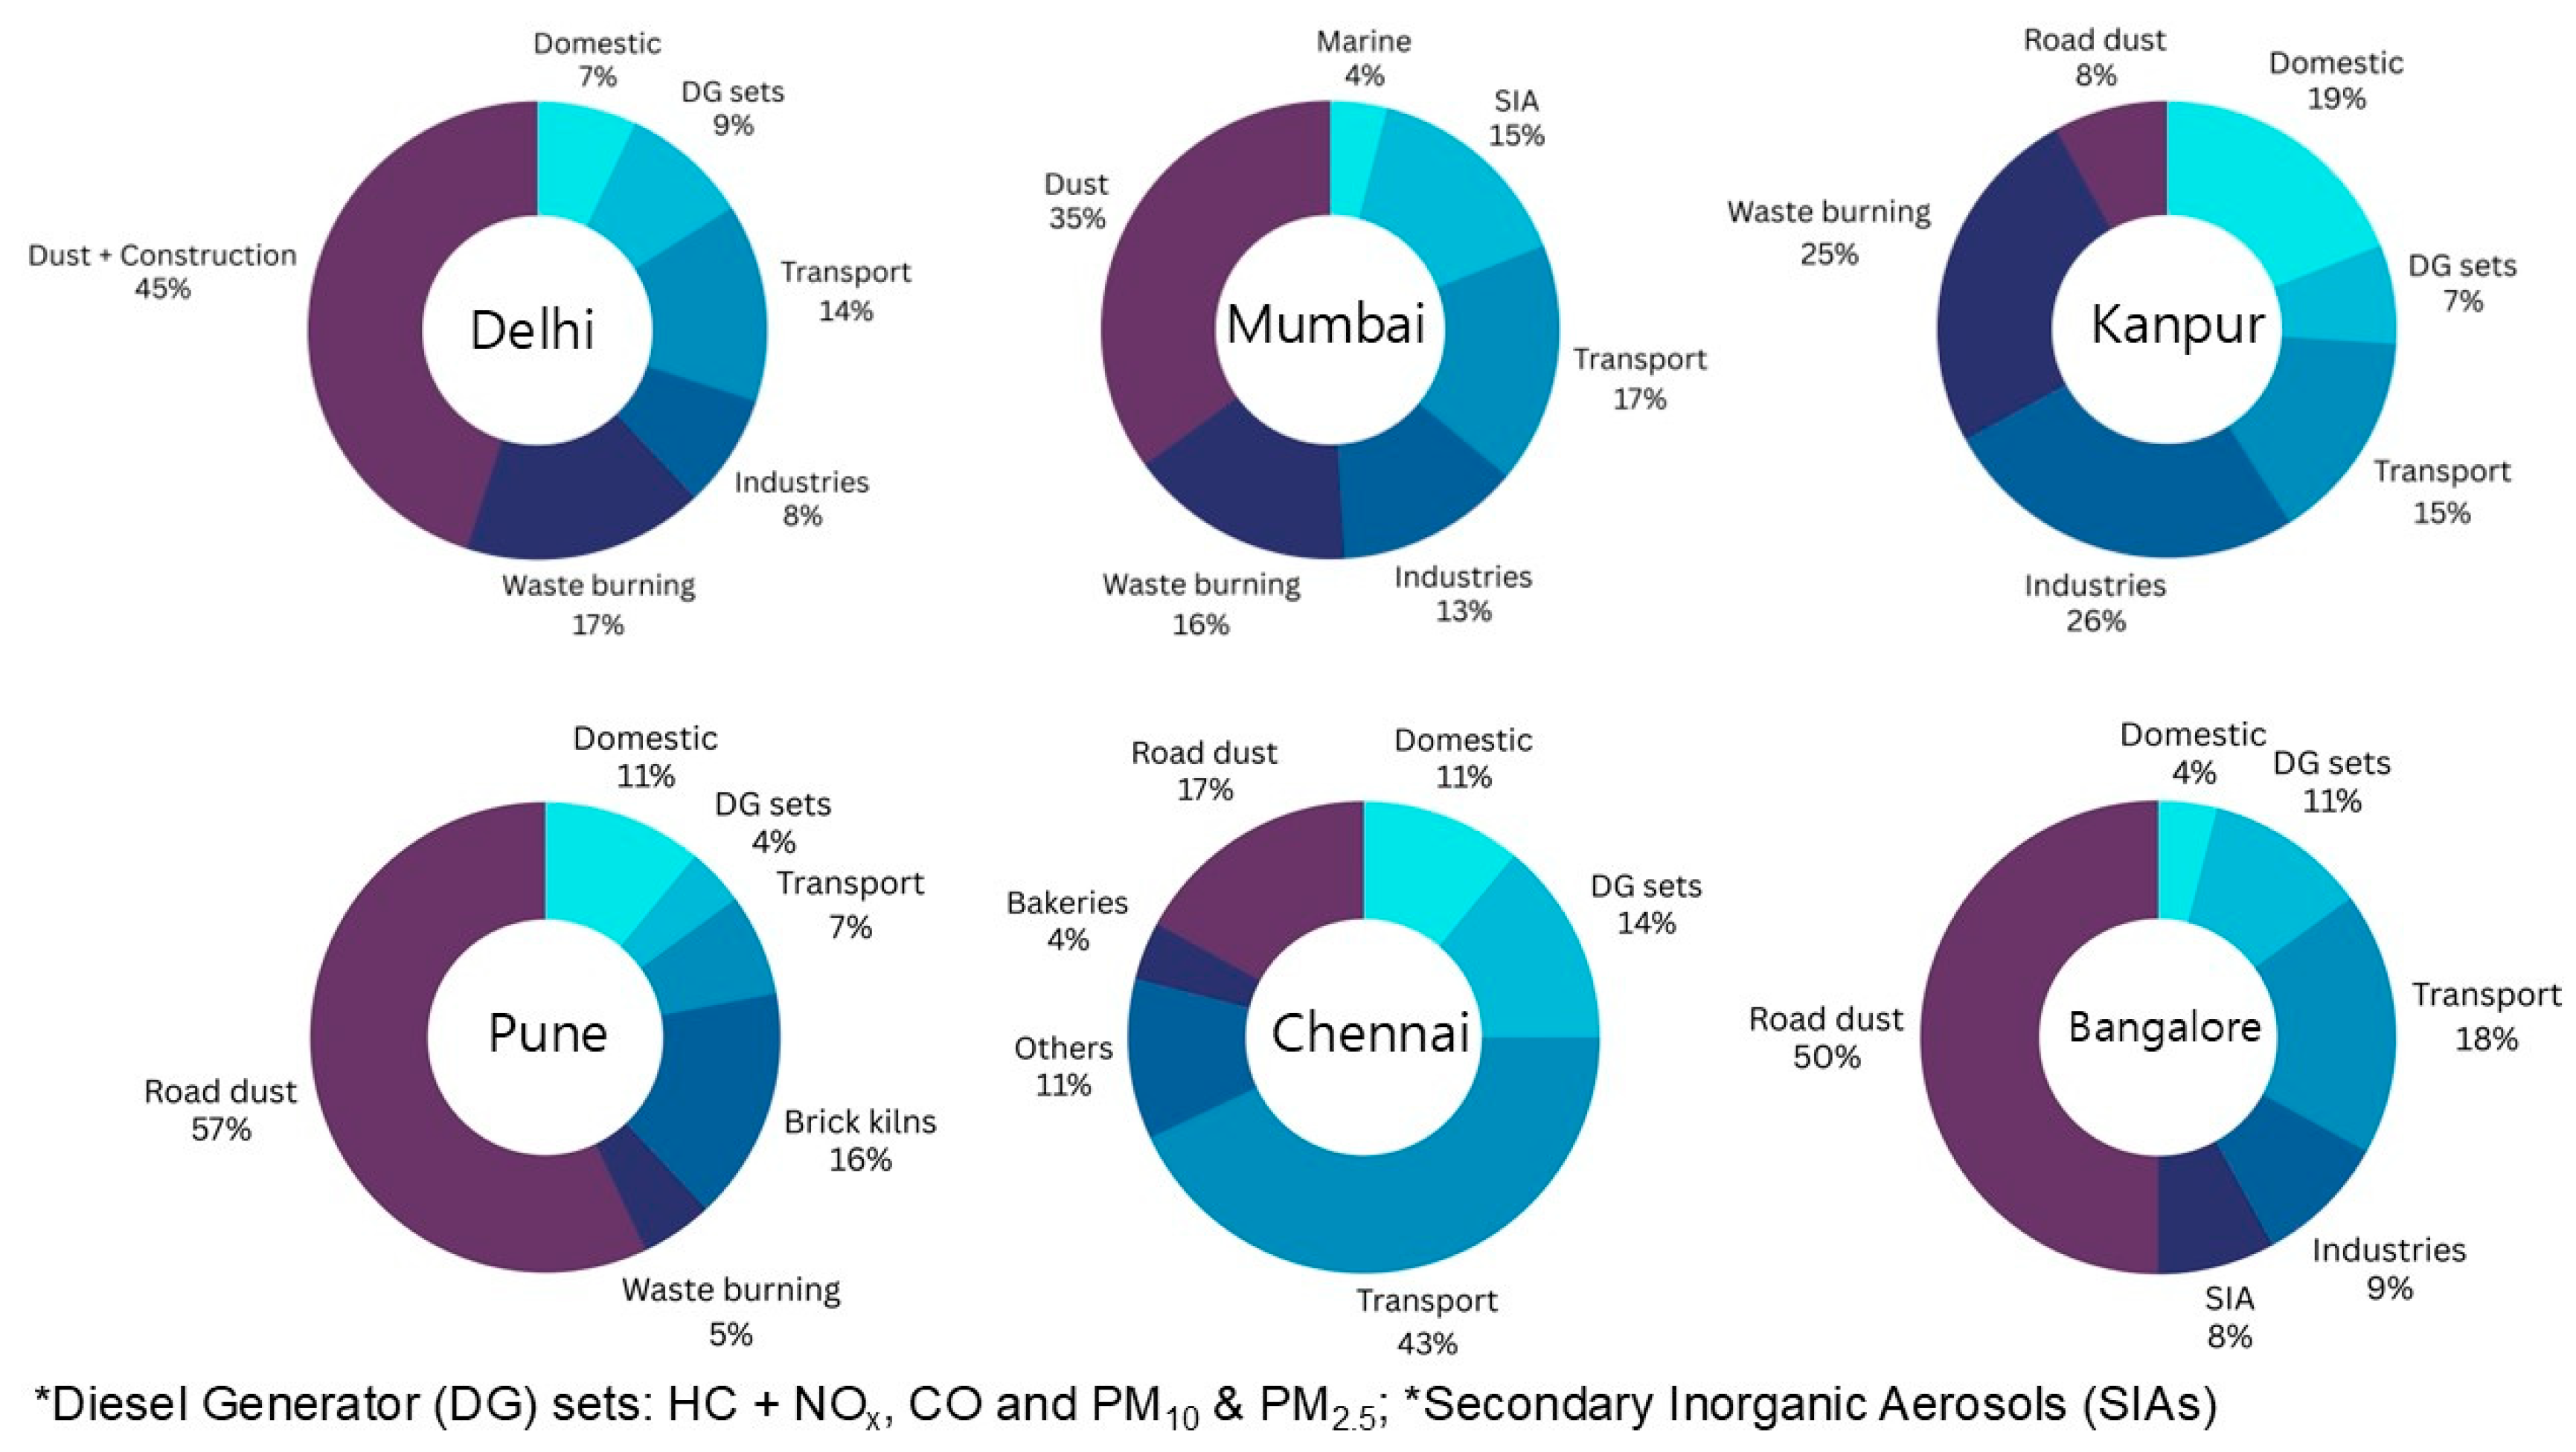
Figure 3.
Adverse effects of air pollution on human health; Image created by the author using Canva.com tools.
Figure 3.
Adverse effects of air pollution on human health; Image created by the author using Canva.com tools.
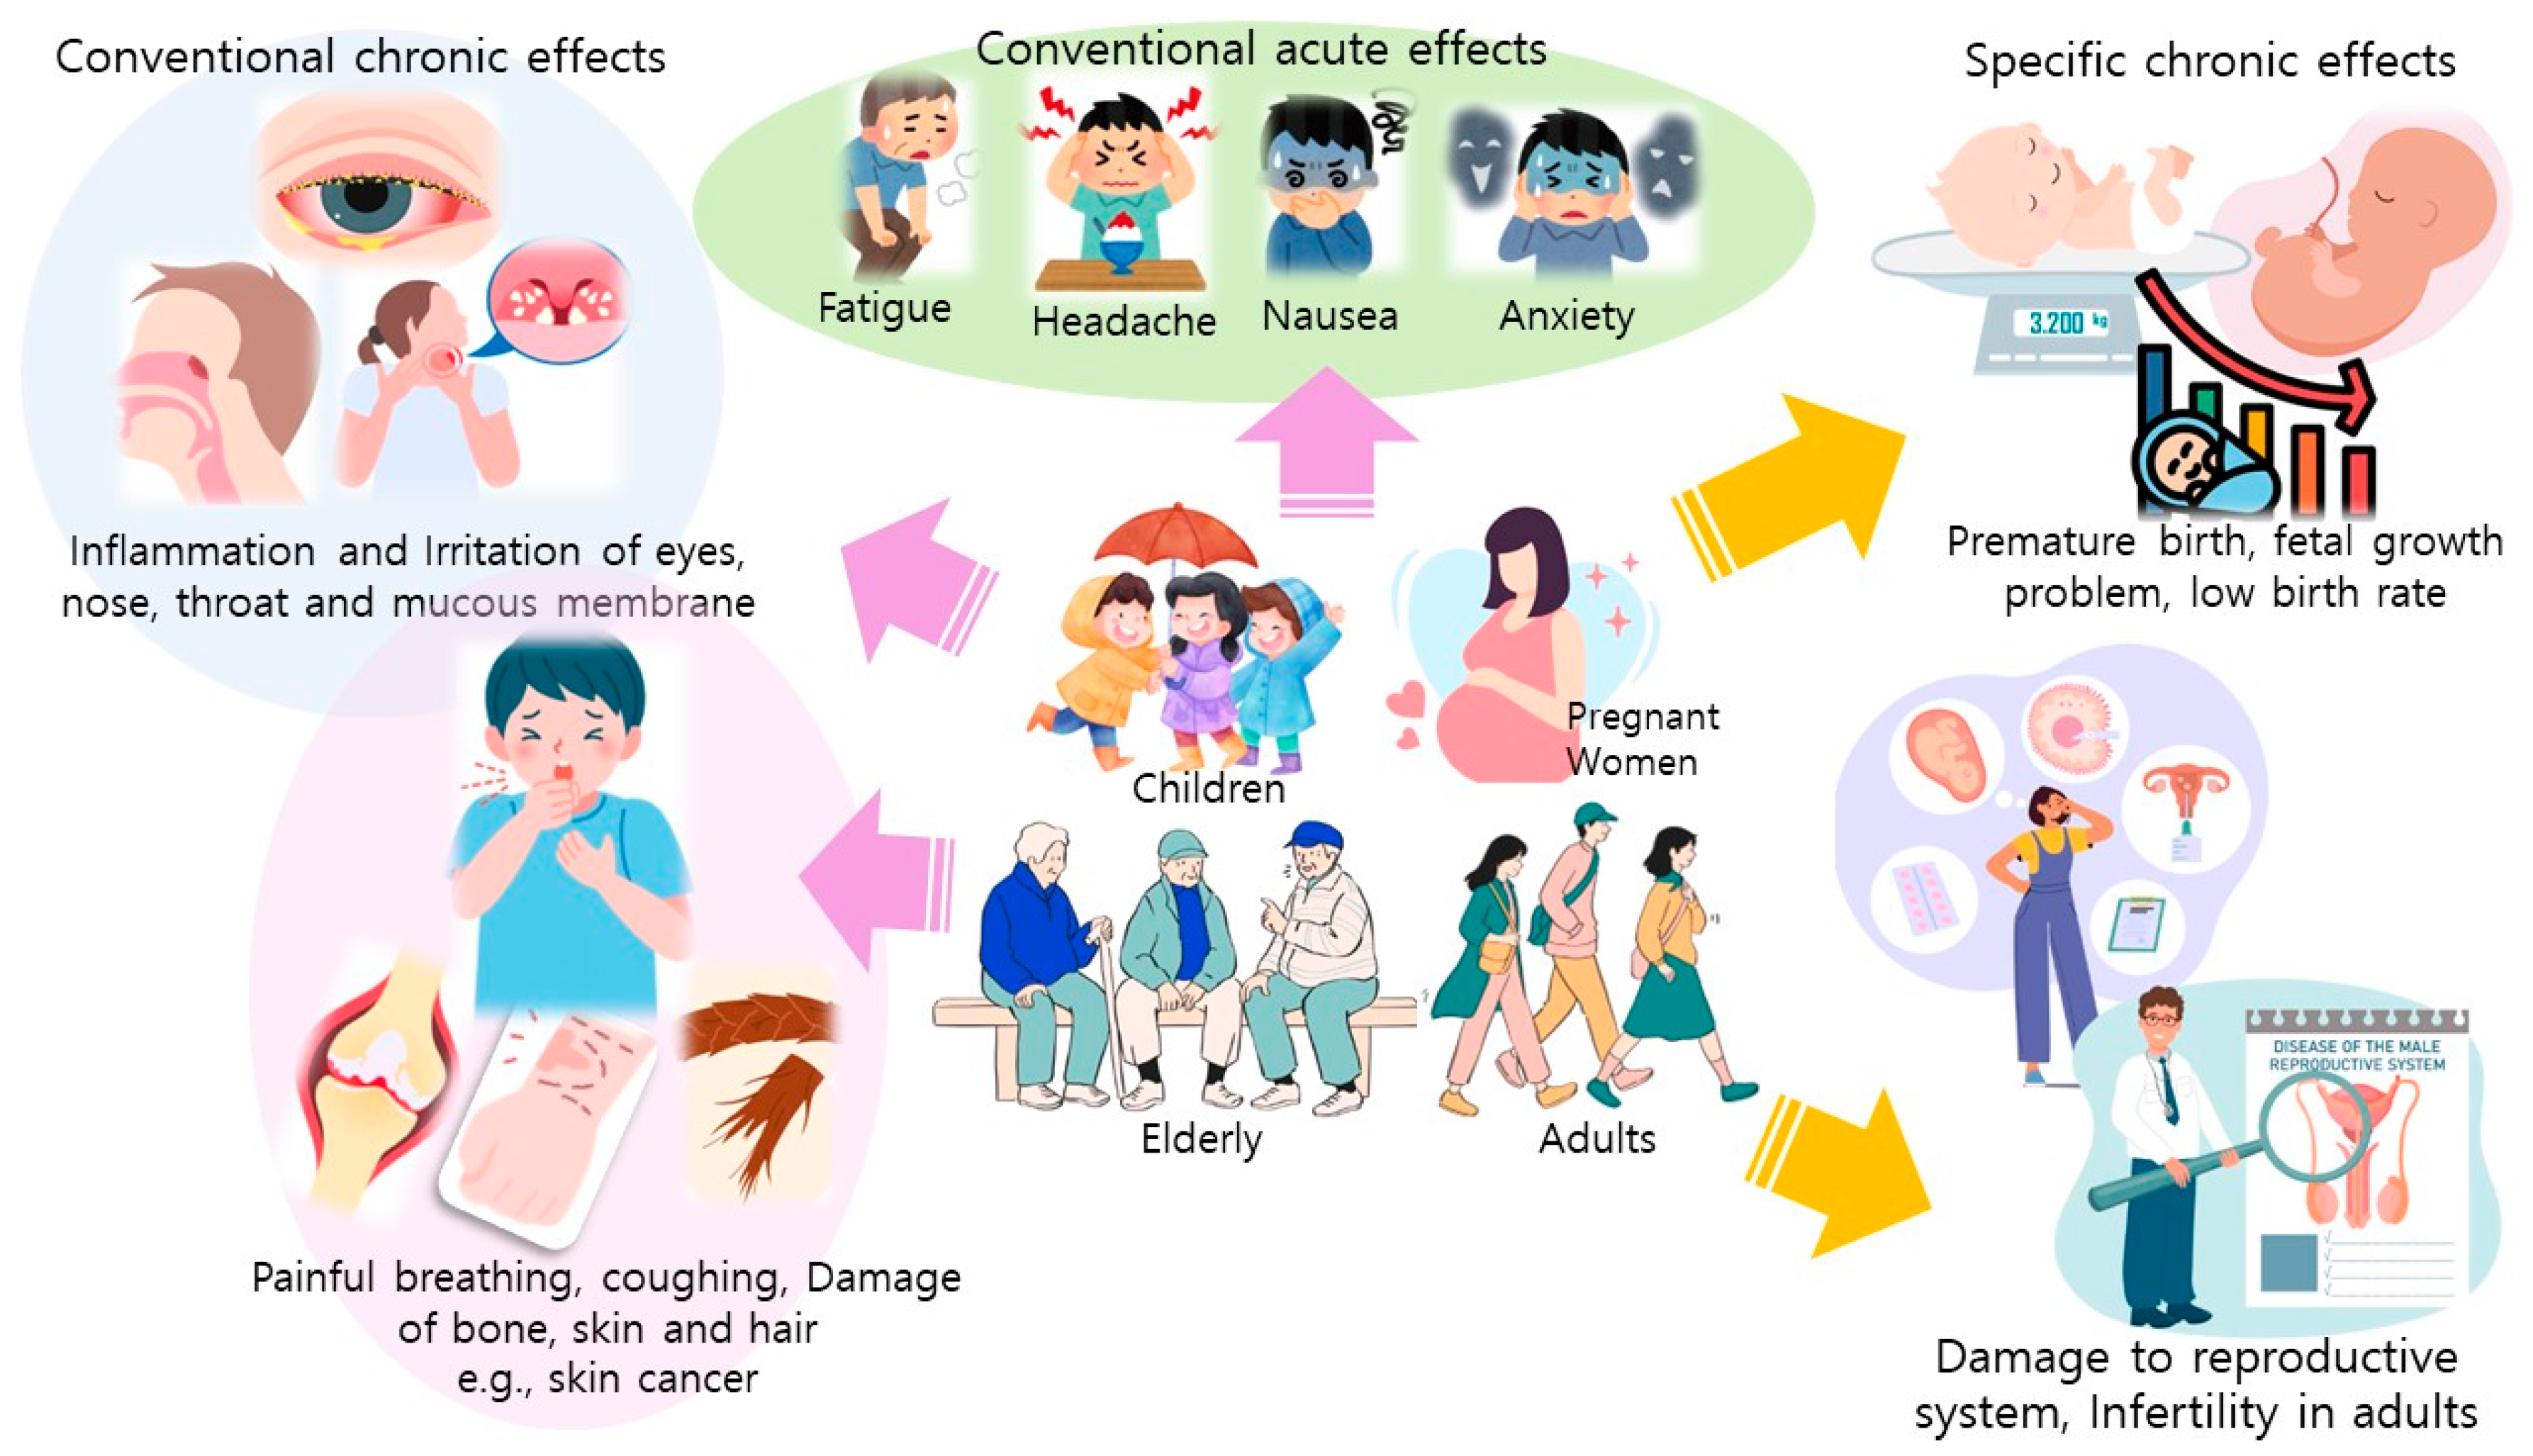
Figure 4.
Flow chart indicating the articles Selection Process according to the PRISMA guideline.
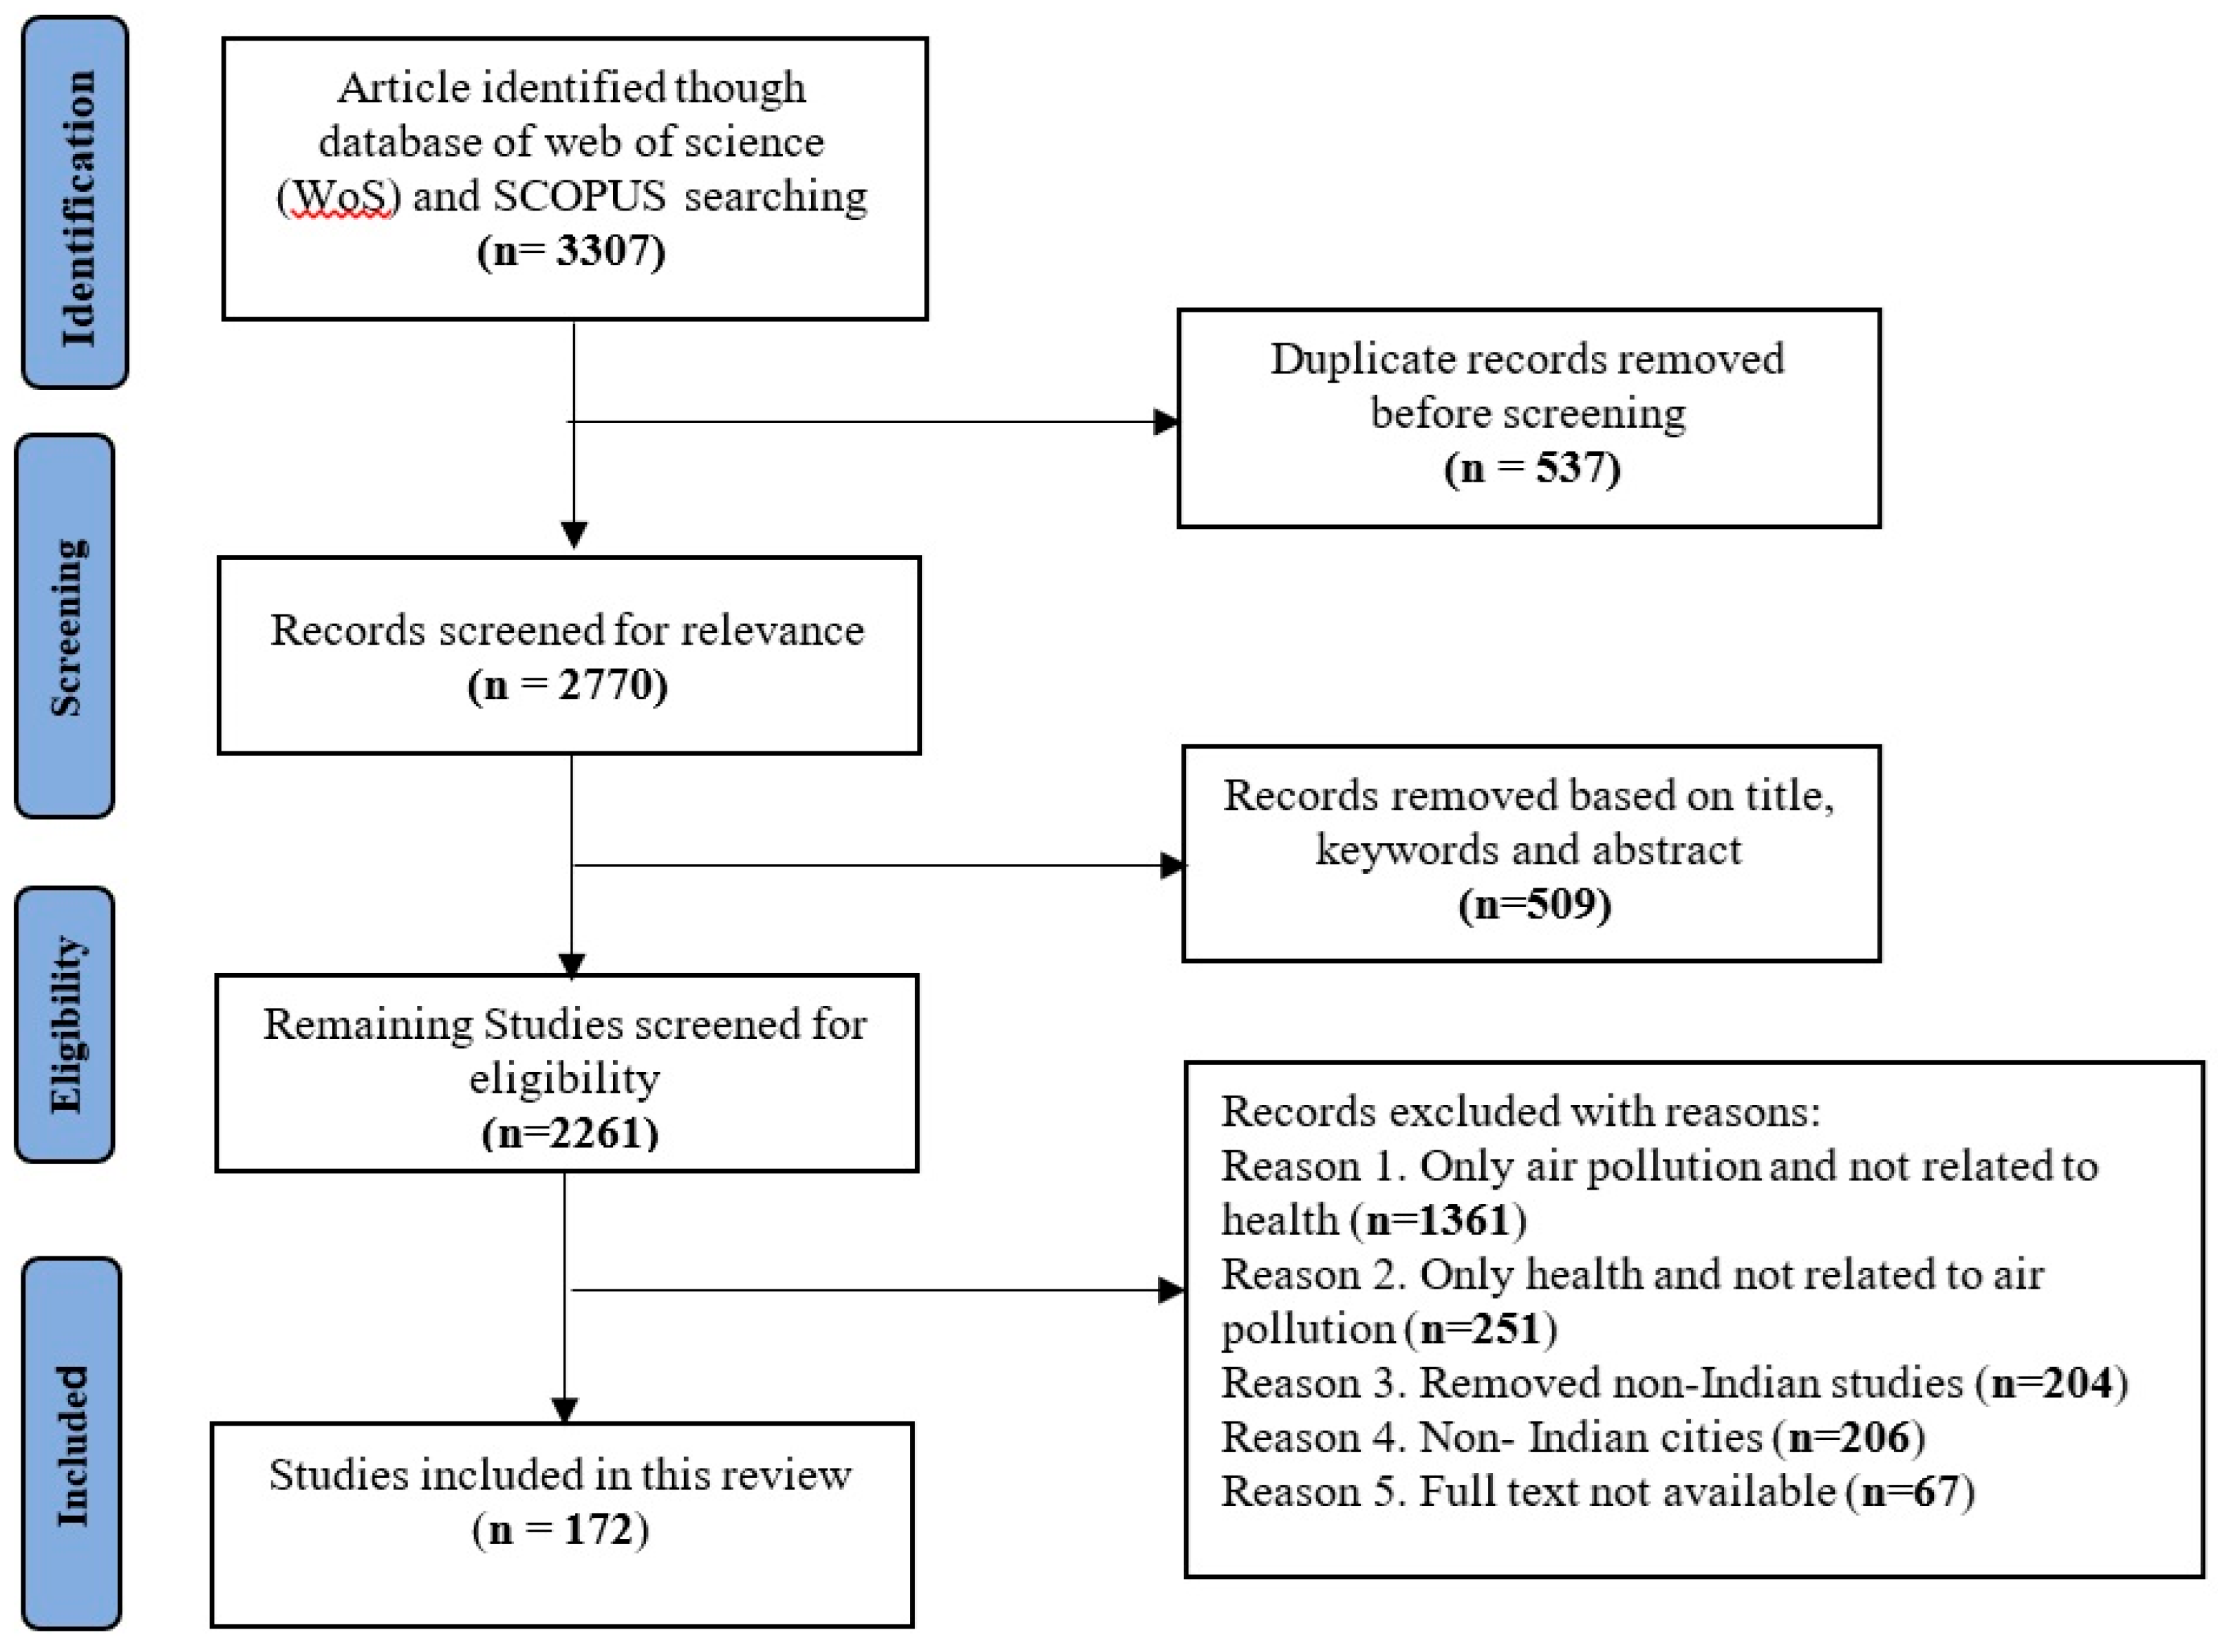
Figure 5.
Number of studies on Air pollution and health in Indian cities (Before screening) (WoS) (a); SCOPUS (b)); studies after screening (WoS) (c); and SCOPUS (d).
Figure 5.
Number of studies on Air pollution and health in Indian cities (Before screening) (WoS) (a); SCOPUS (b)); studies after screening (WoS) (c); and SCOPUS (d).
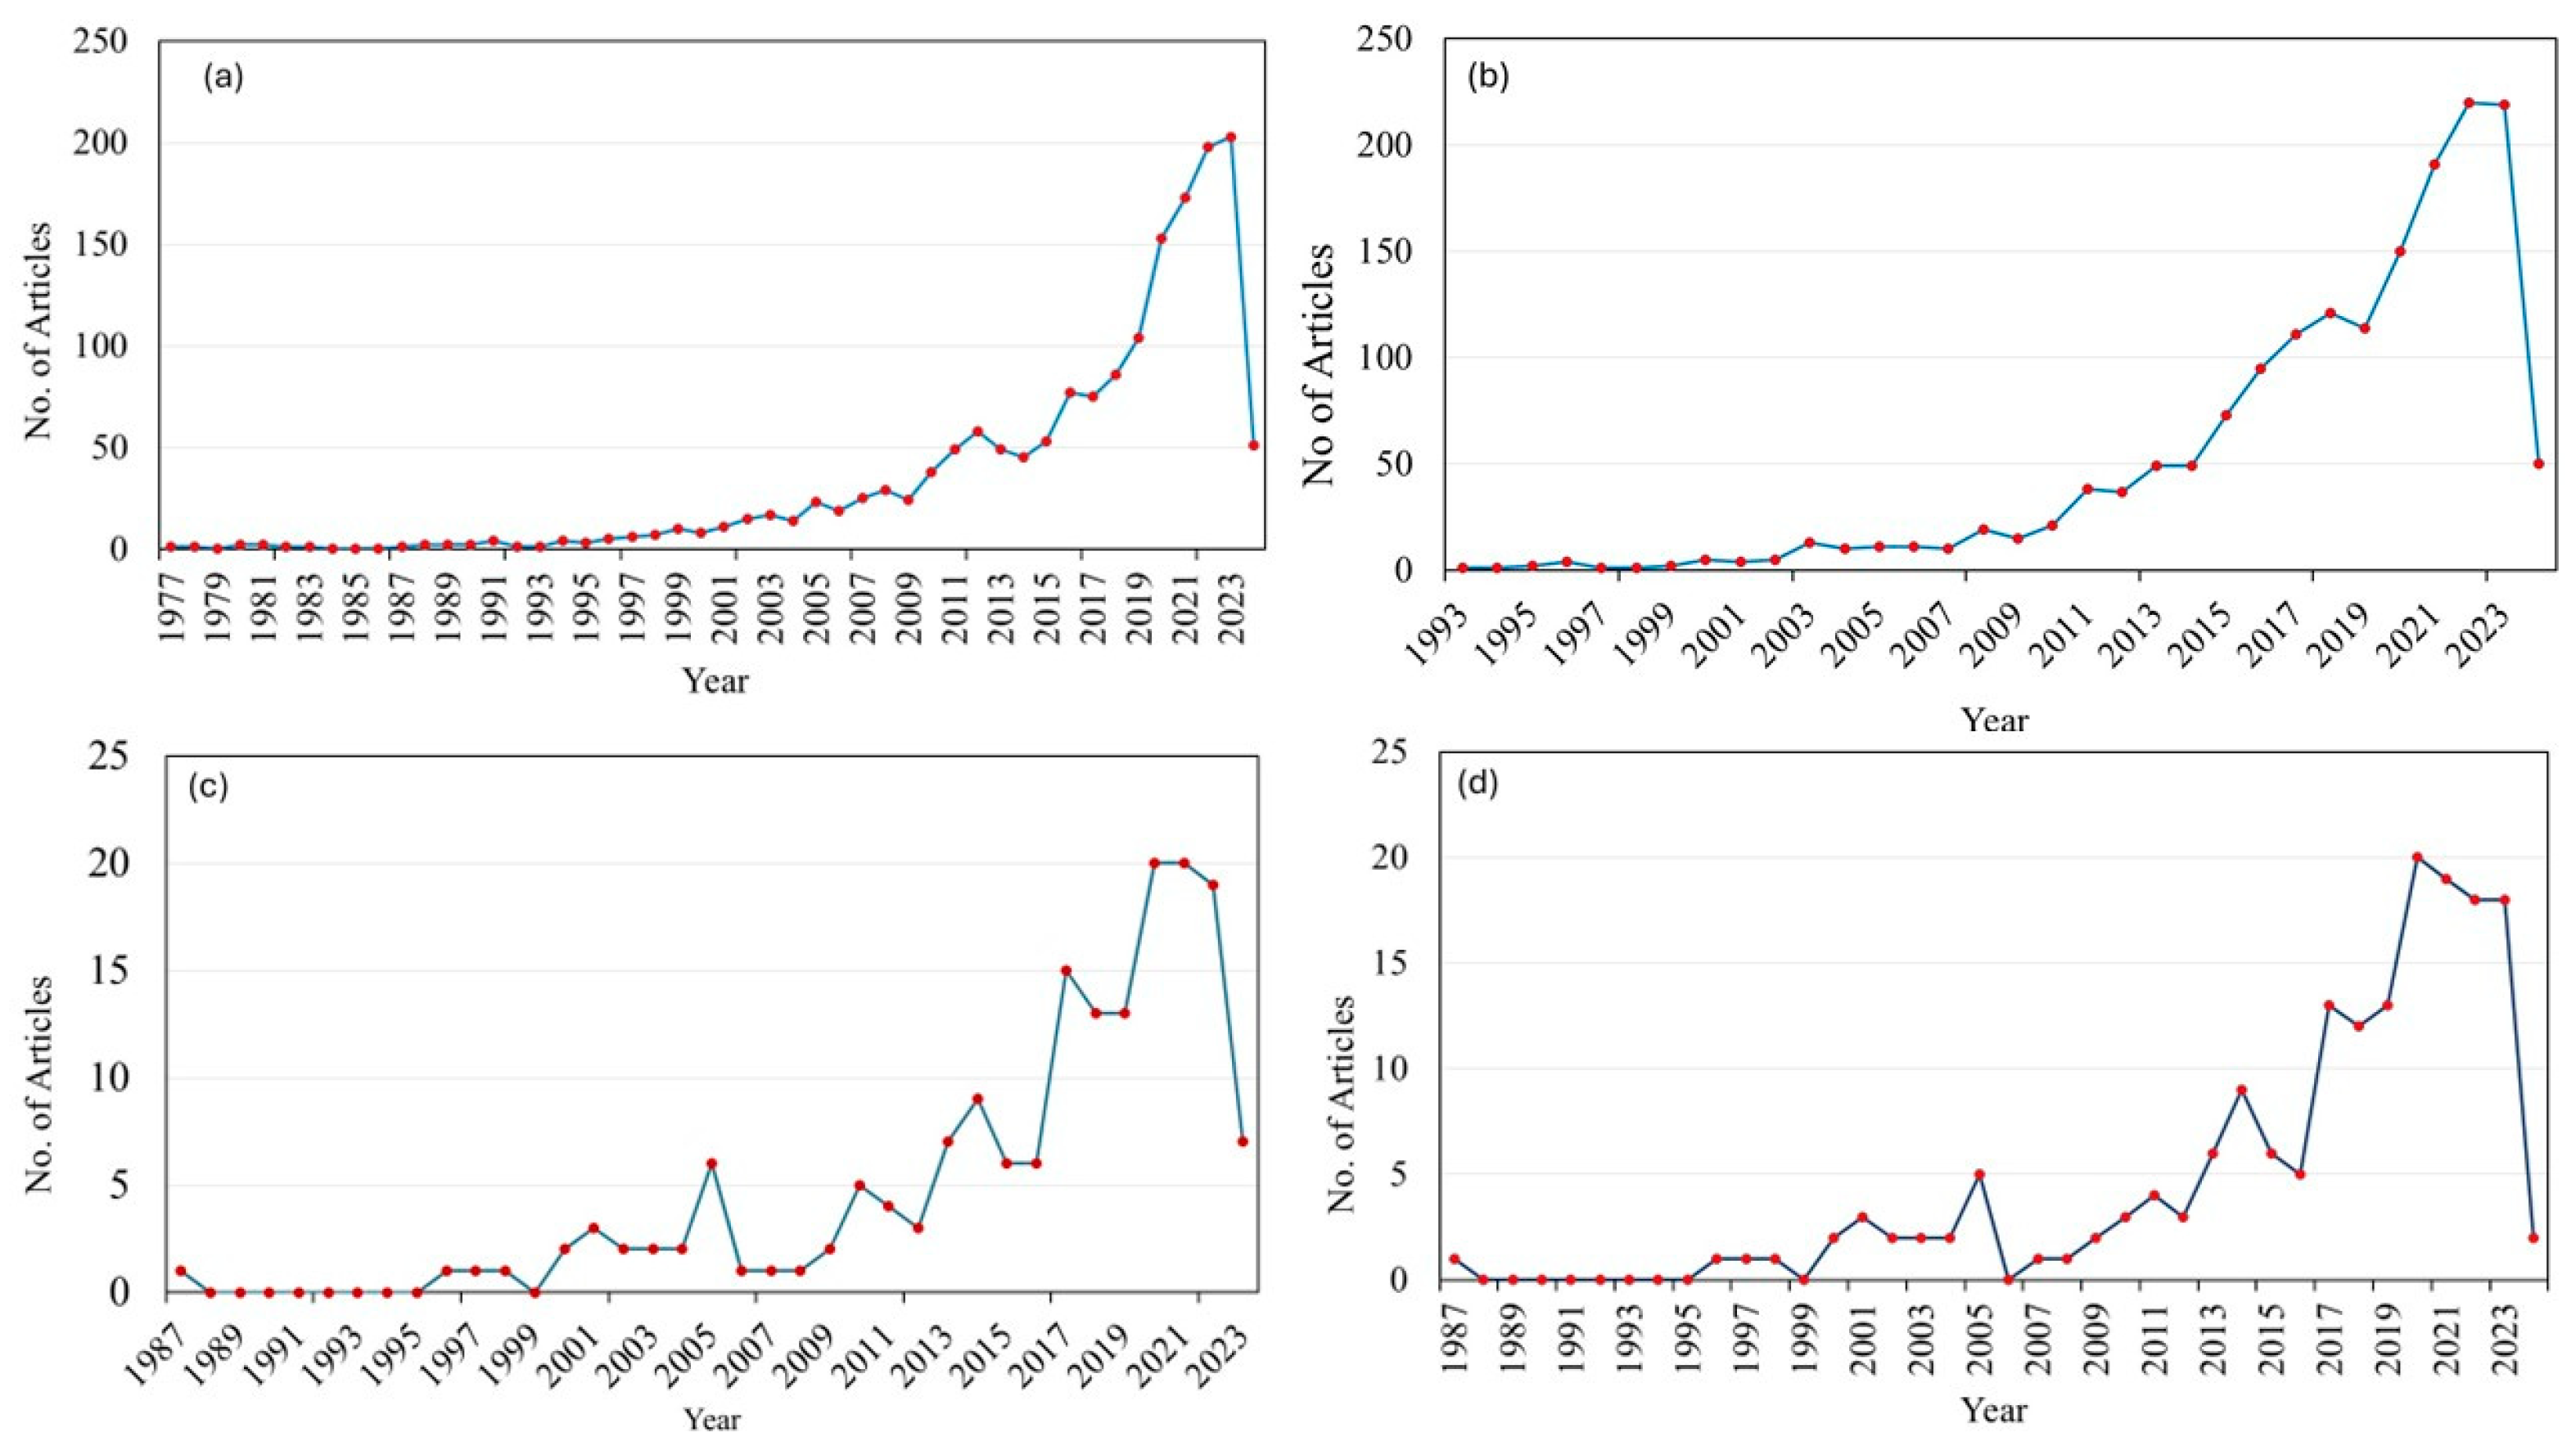
Figure 6.
Spatial distribution of included publications (1987-2024).
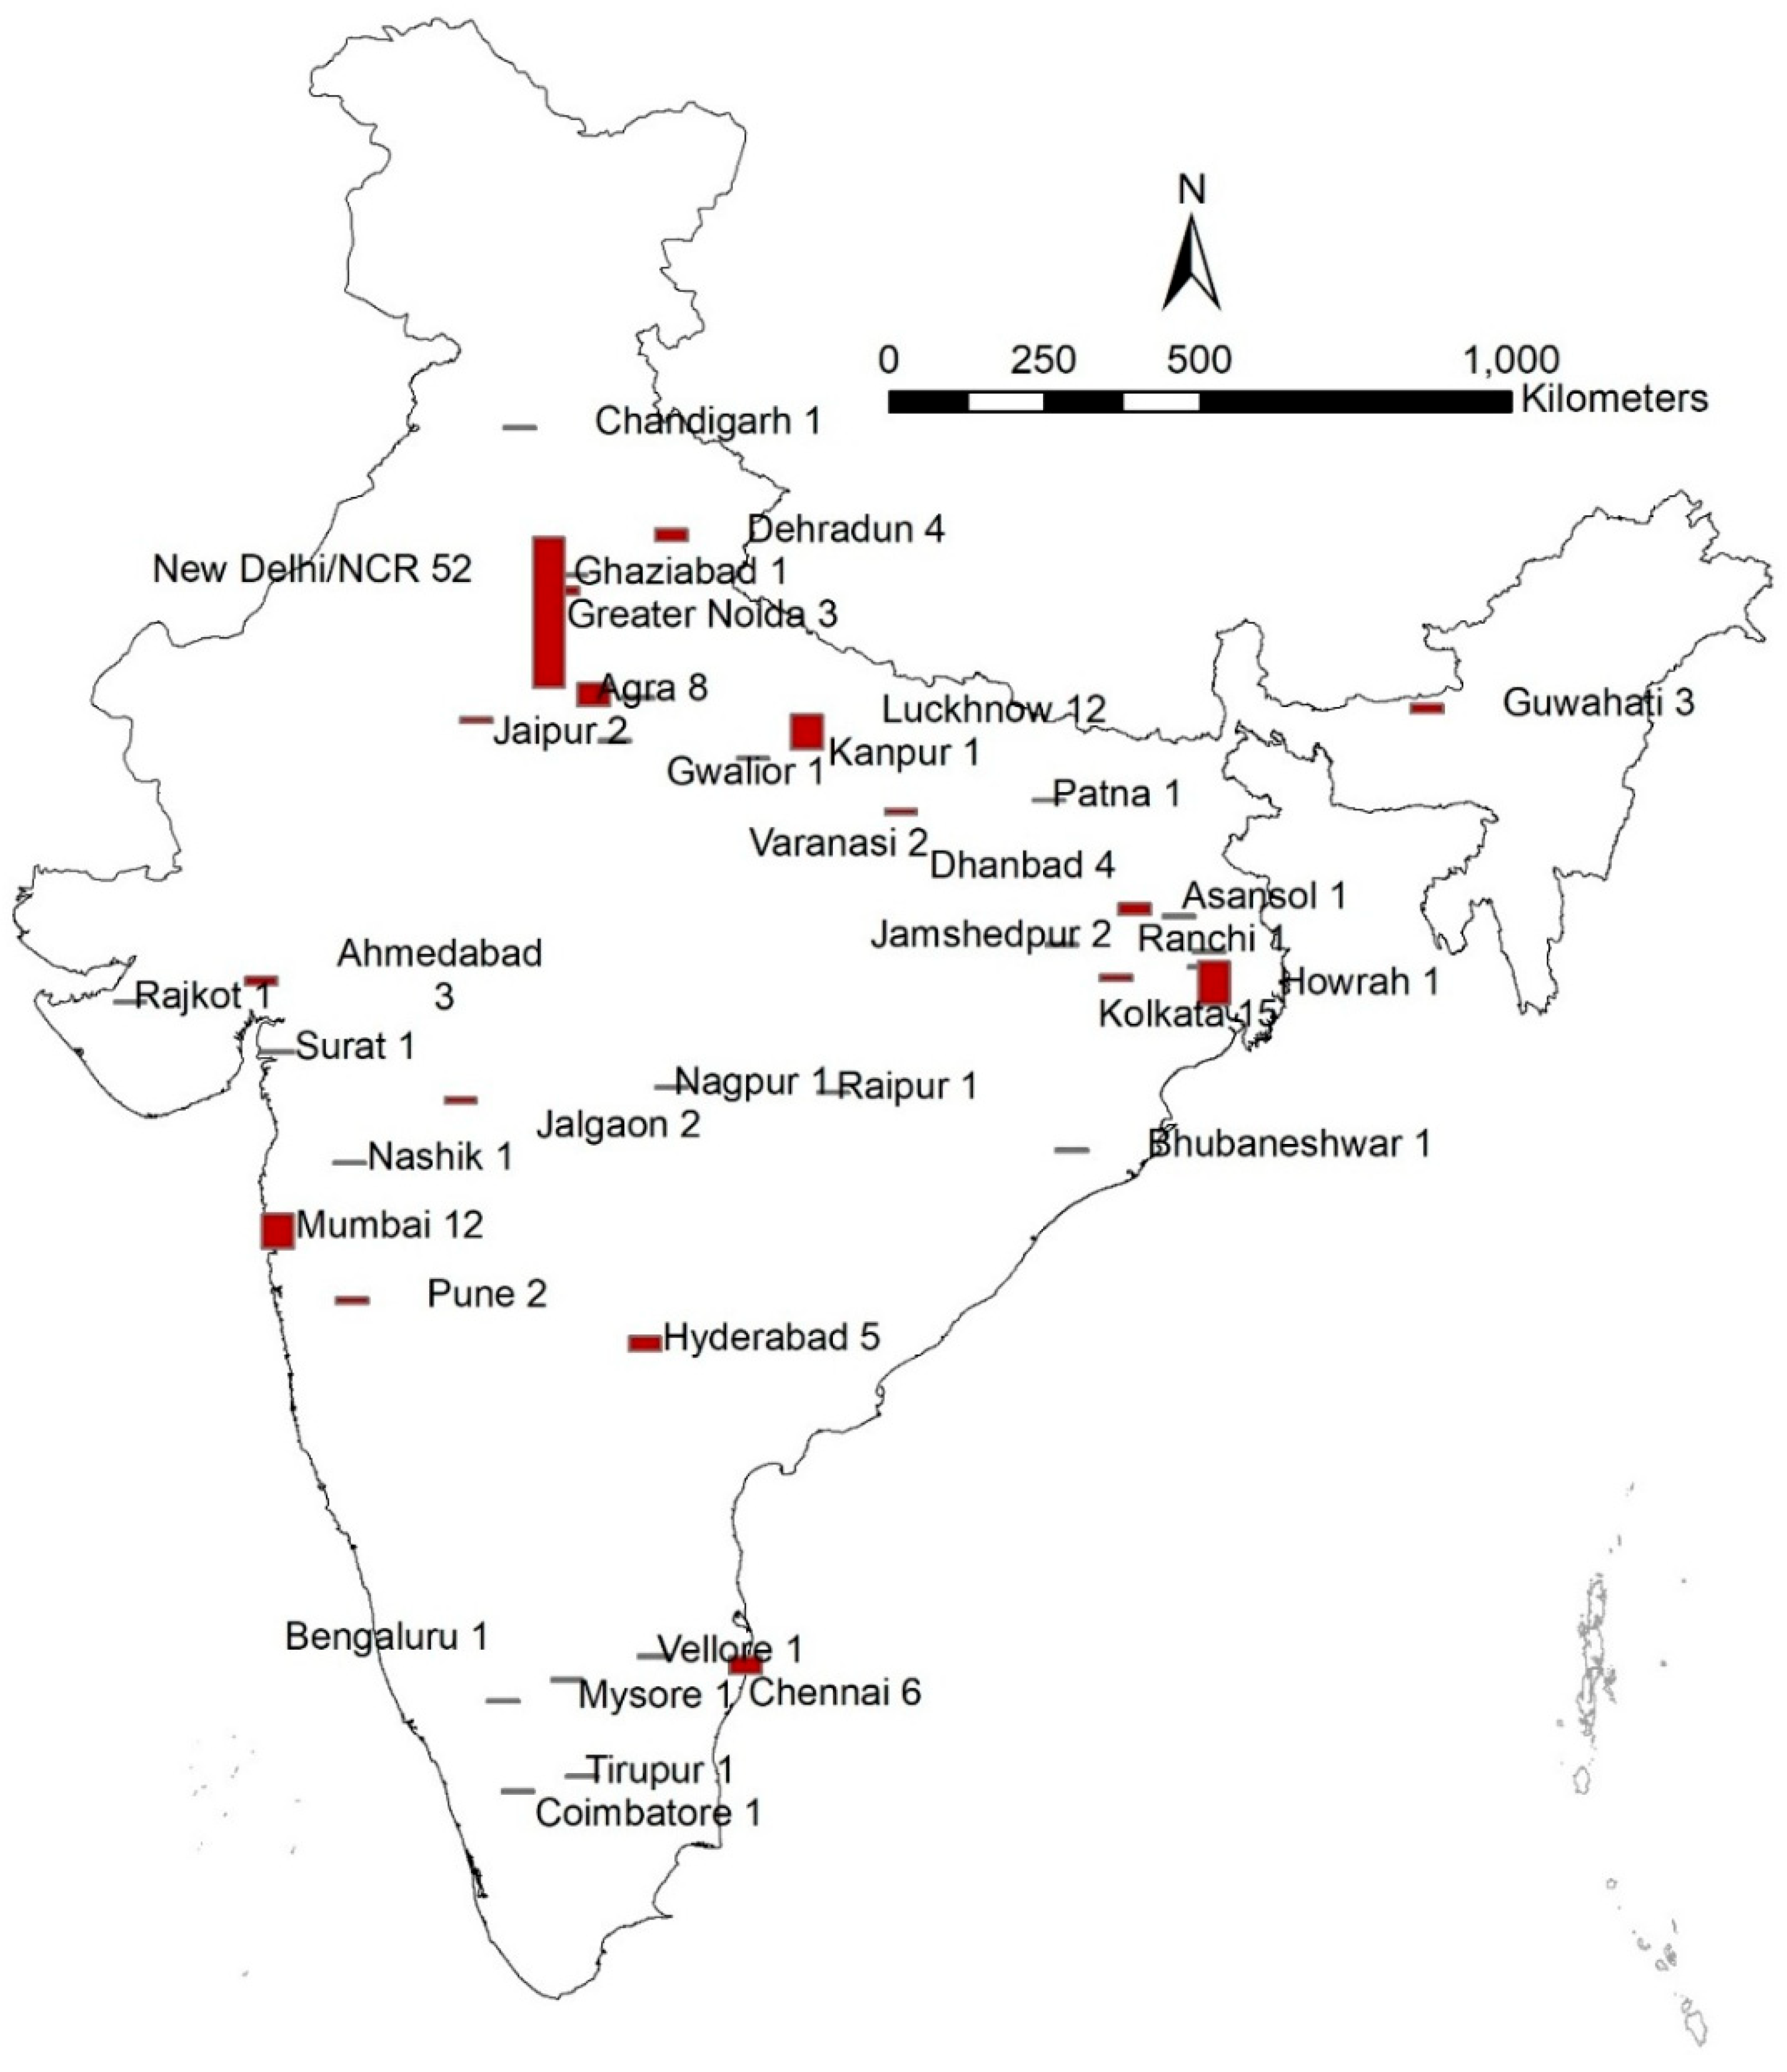
Figure 7.
Evolution of research topics during the years 1987 to 2024.
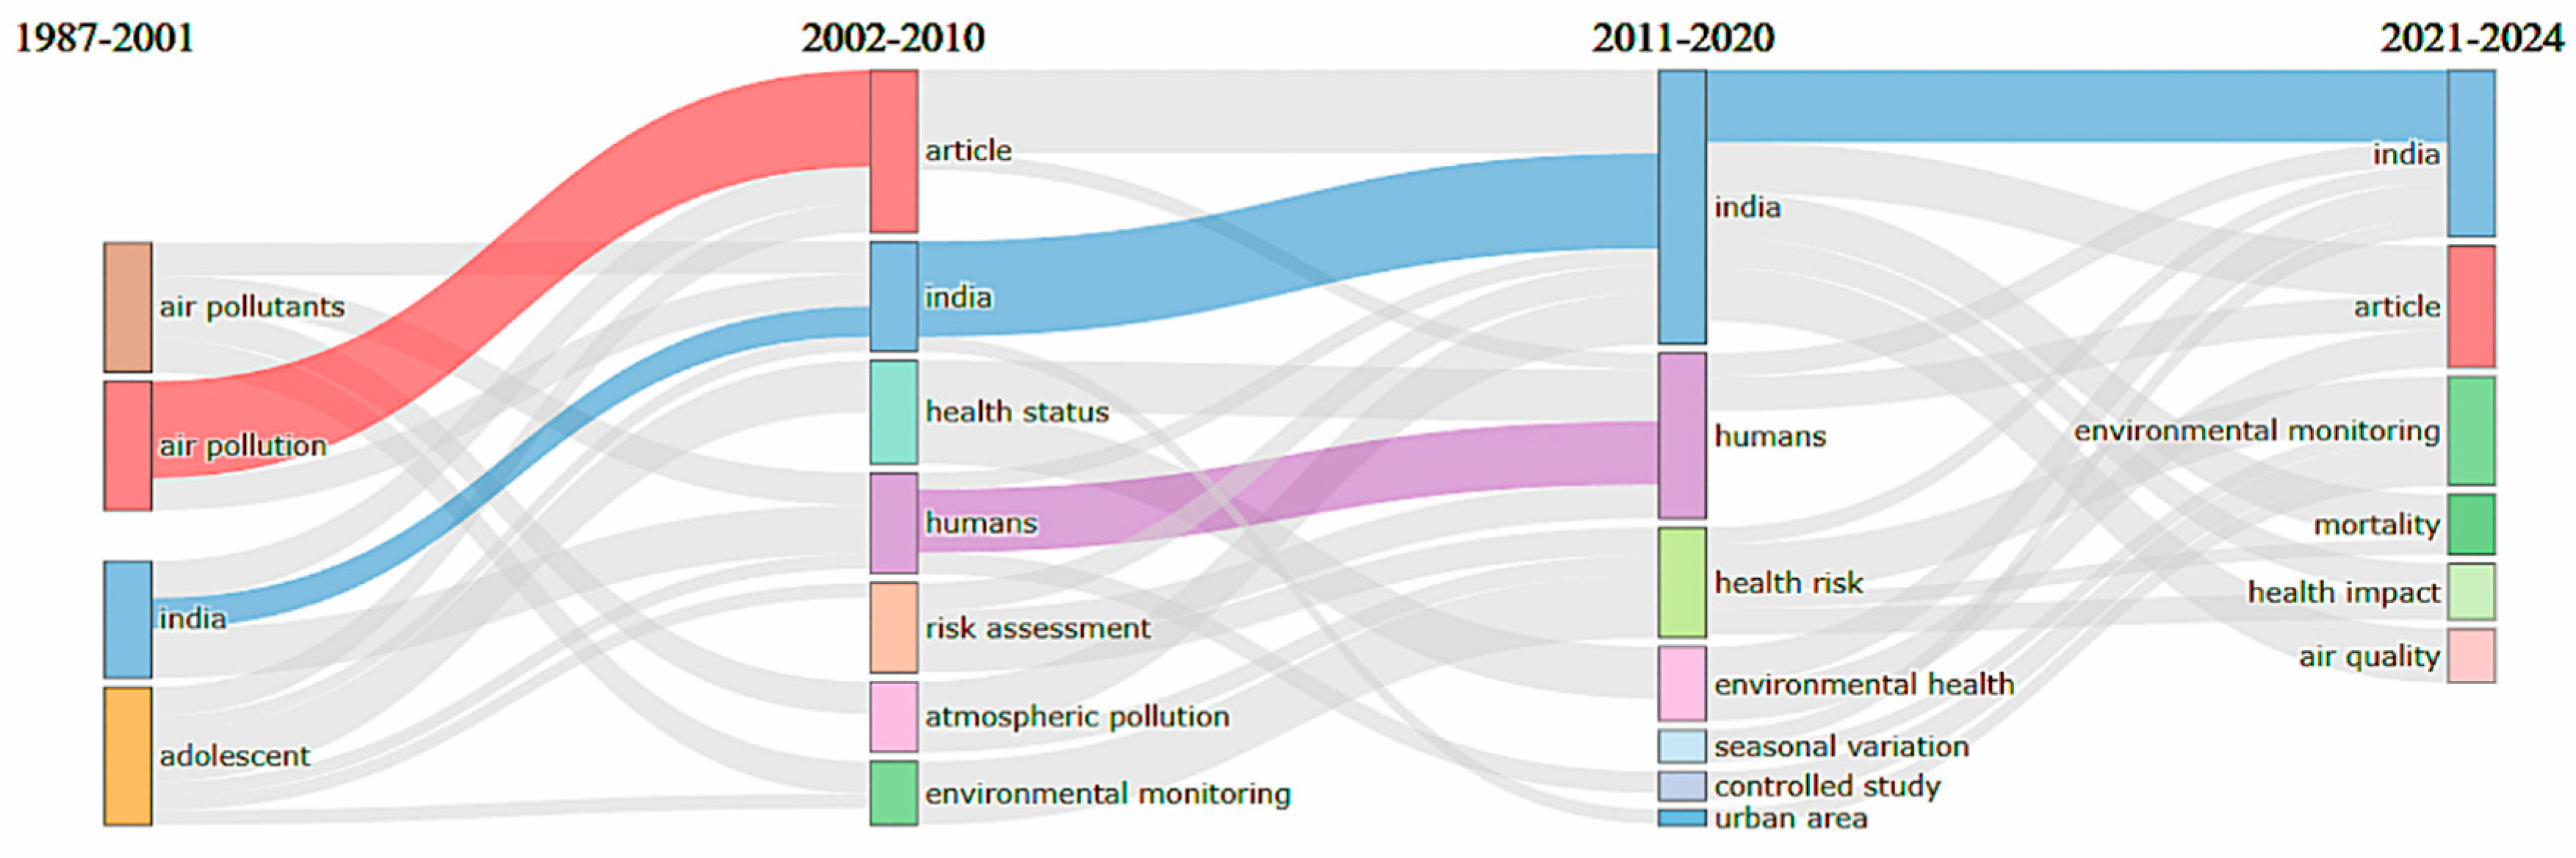
Figure 8.
Co-occurrences network link (1987–2024) with author keyword (two link threshold): a) author keyword clusters (top); b) time period overlay (bottom).
Figure 8.
Co-occurrences network link (1987–2024) with author keyword (two link threshold): a) author keyword clusters (top); b) time period overlay (bottom).
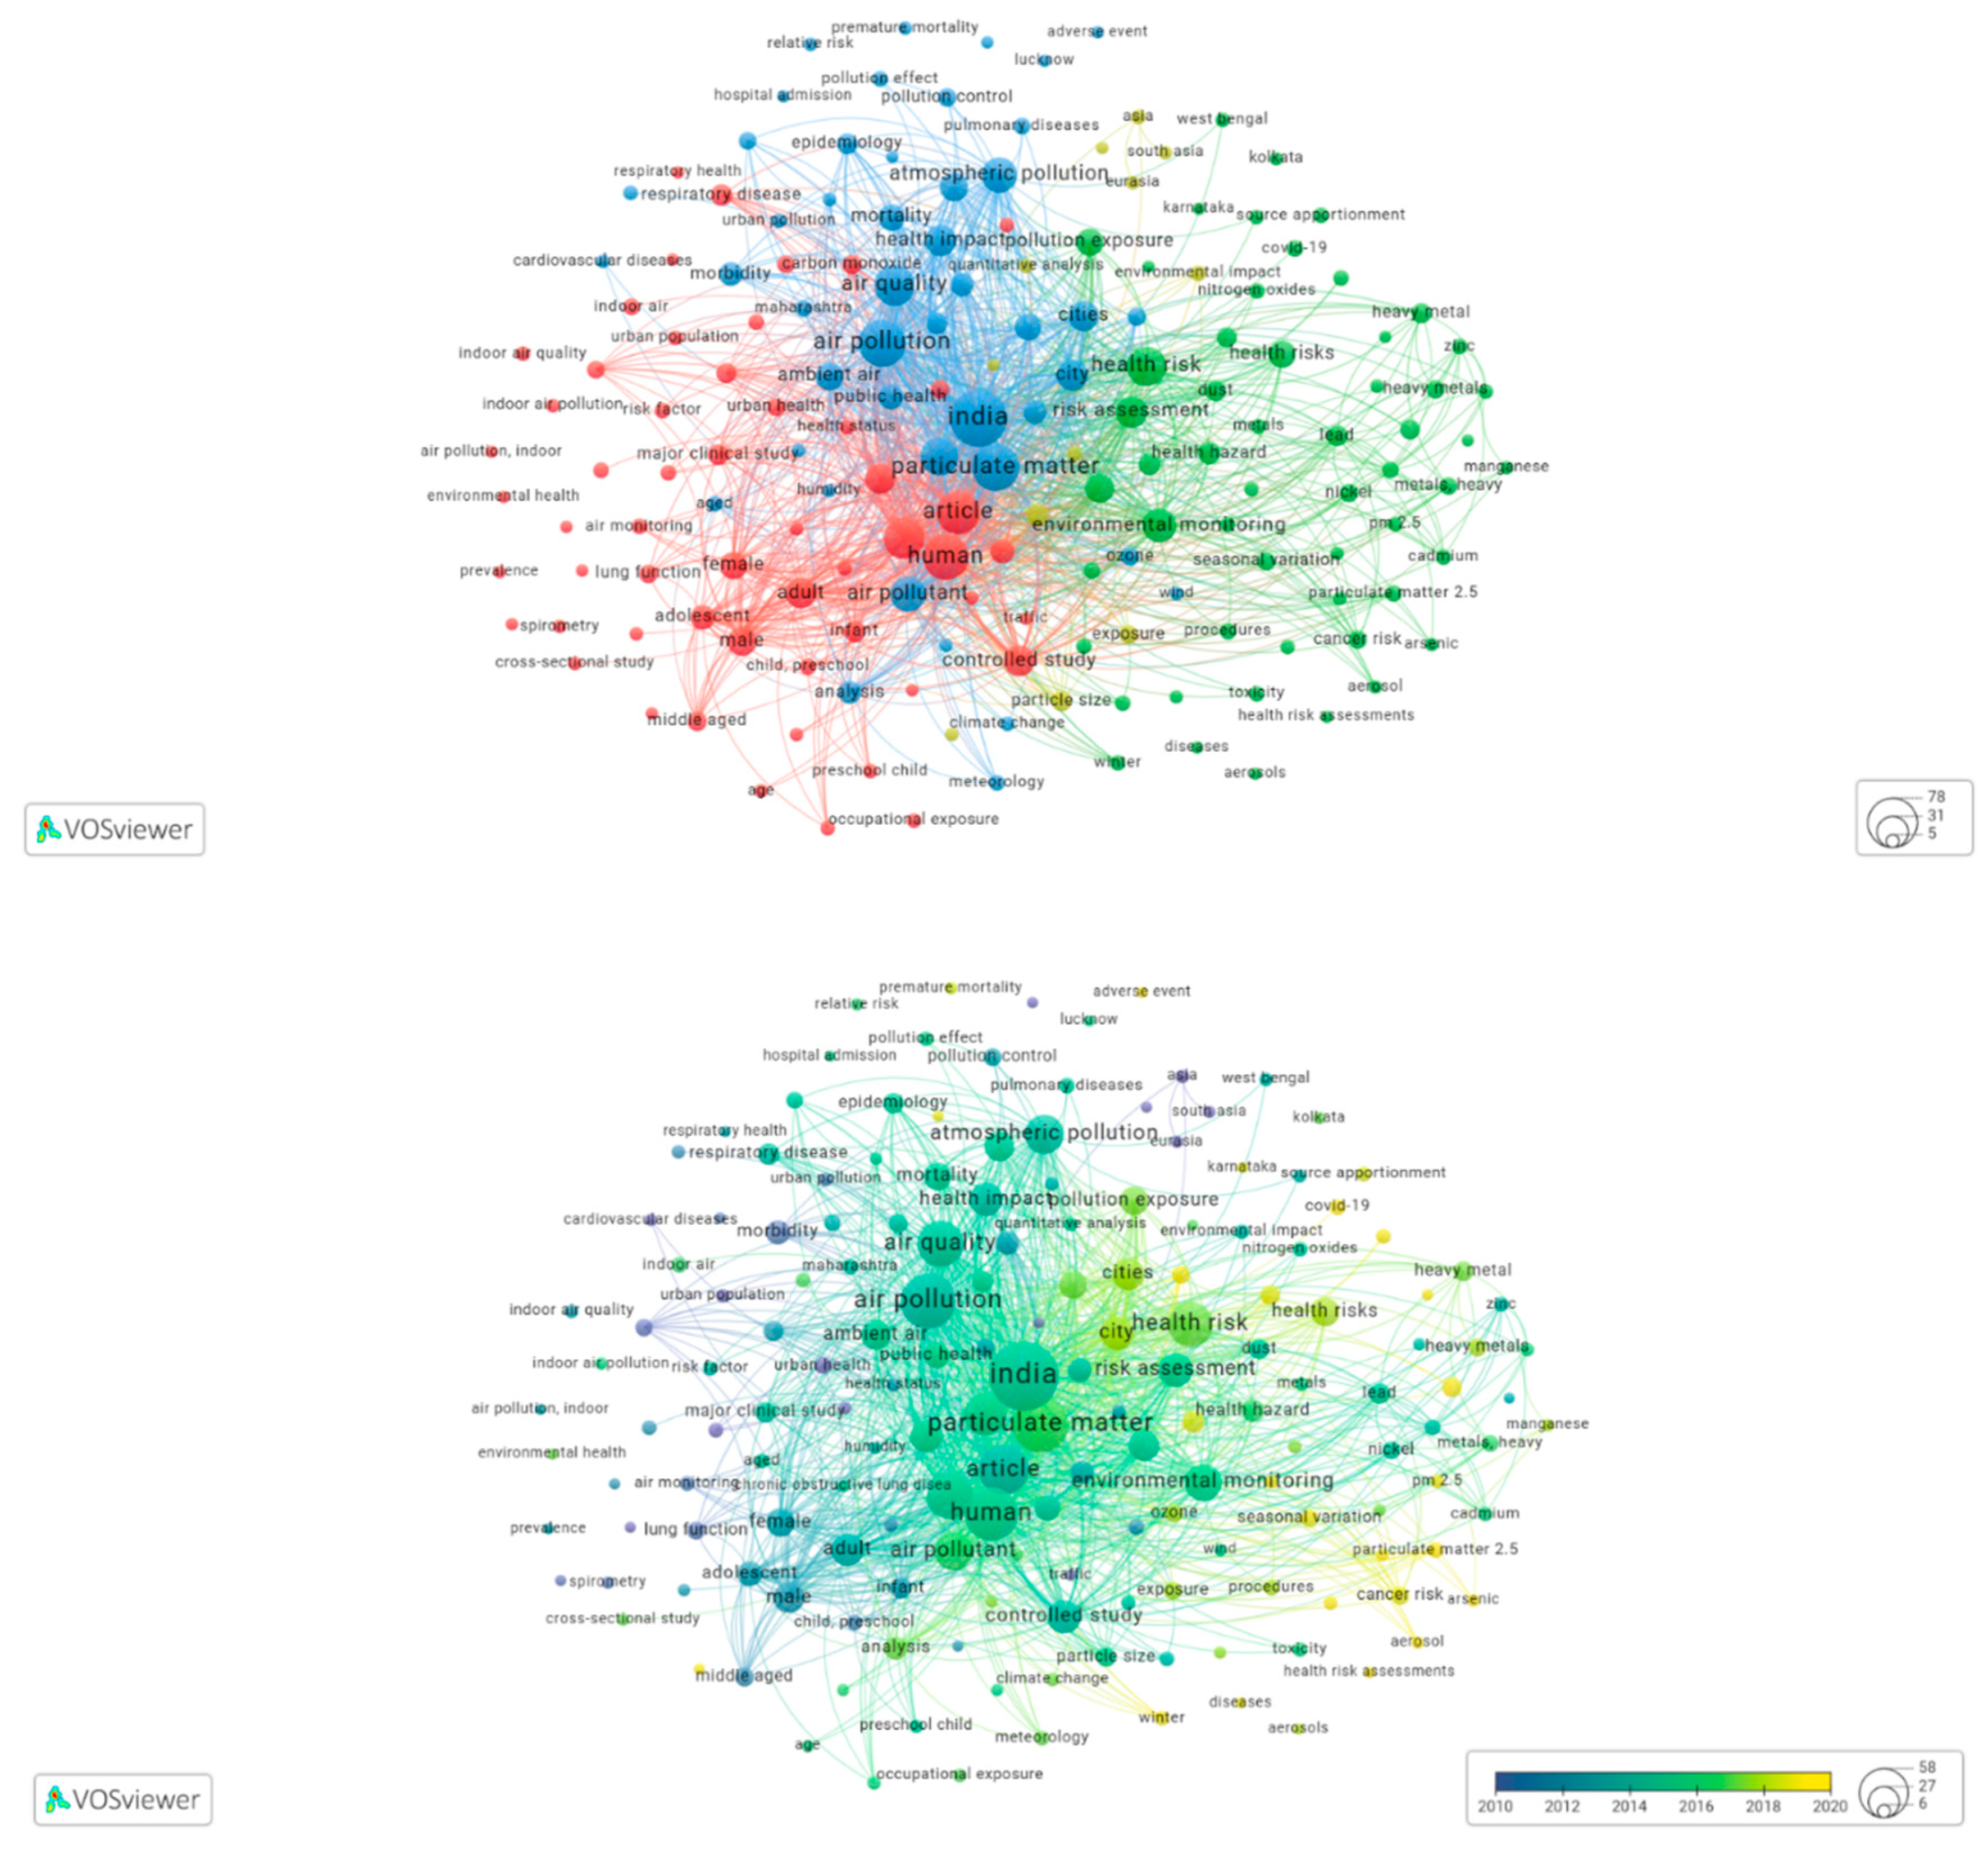
Figure 9.
Co-occurrences network link (1987–2024) for sources of air pollution: a) all keyword largest cluster (top); b) time period overlay (middle); c) time period overlay with 1 link (bottom).
Figure 9.
Co-occurrences network link (1987–2024) for sources of air pollution: a) all keyword largest cluster (top); b) time period overlay (middle); c) time period overlay with 1 link (bottom).
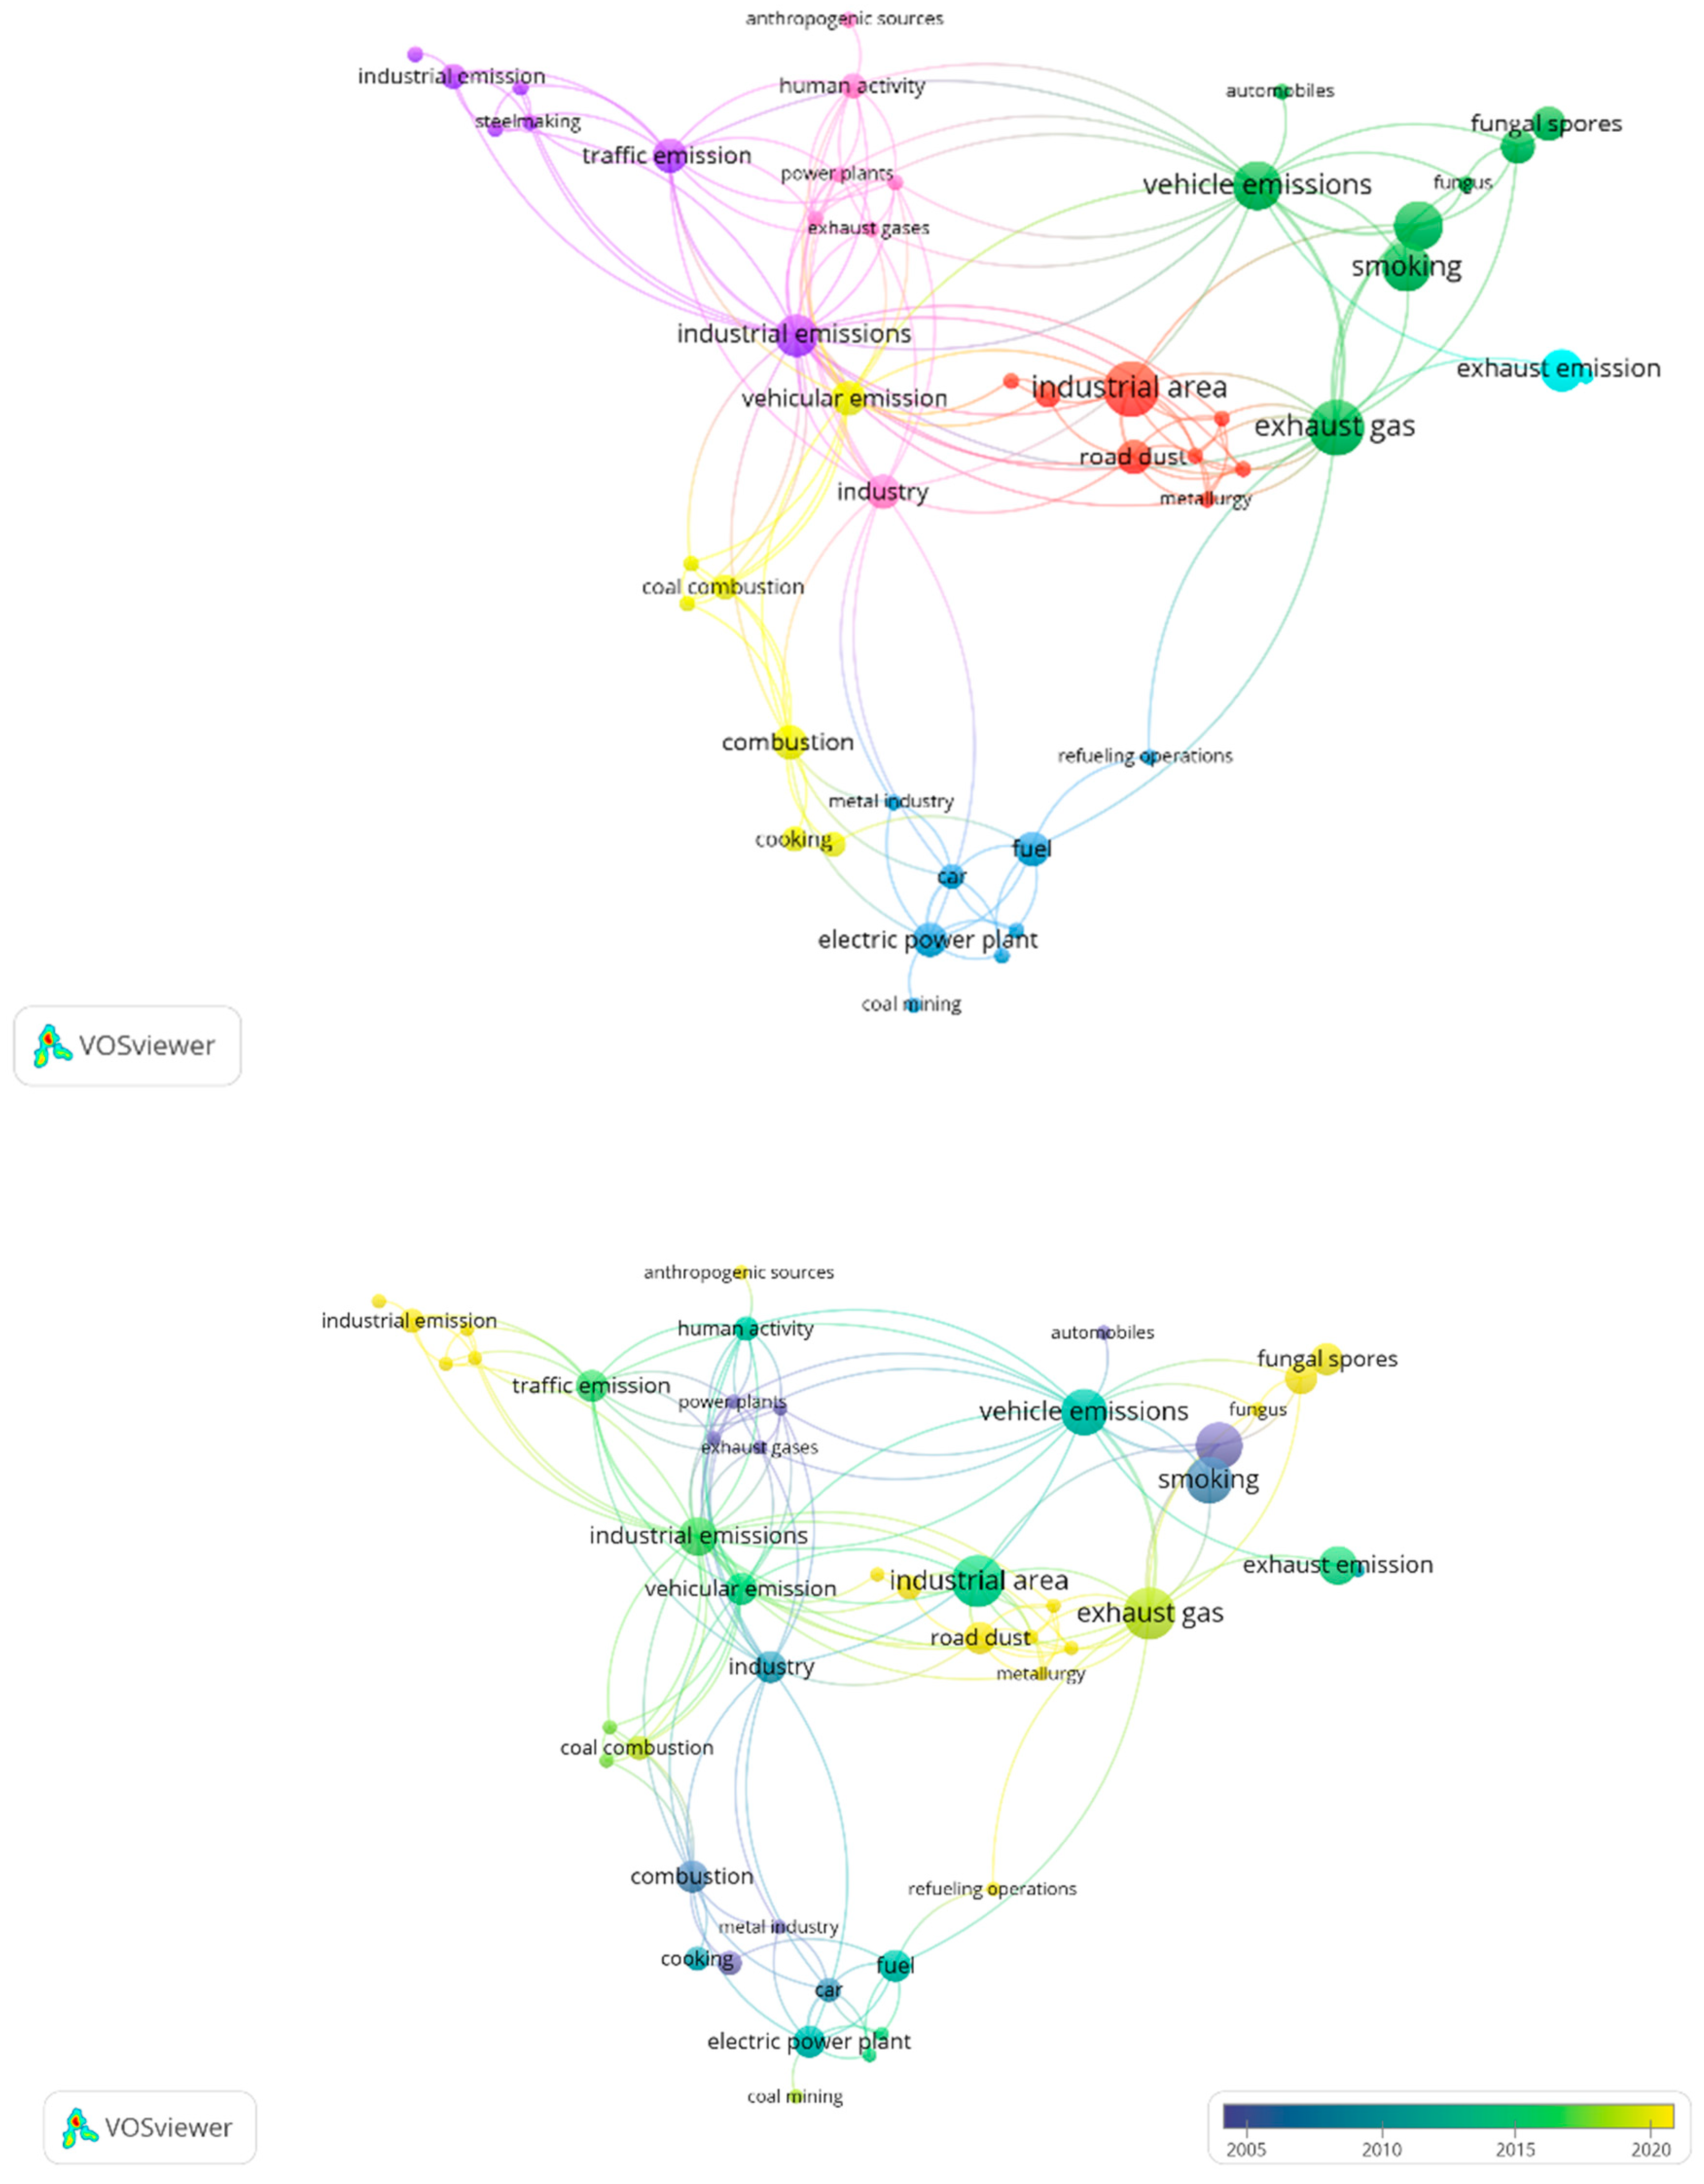
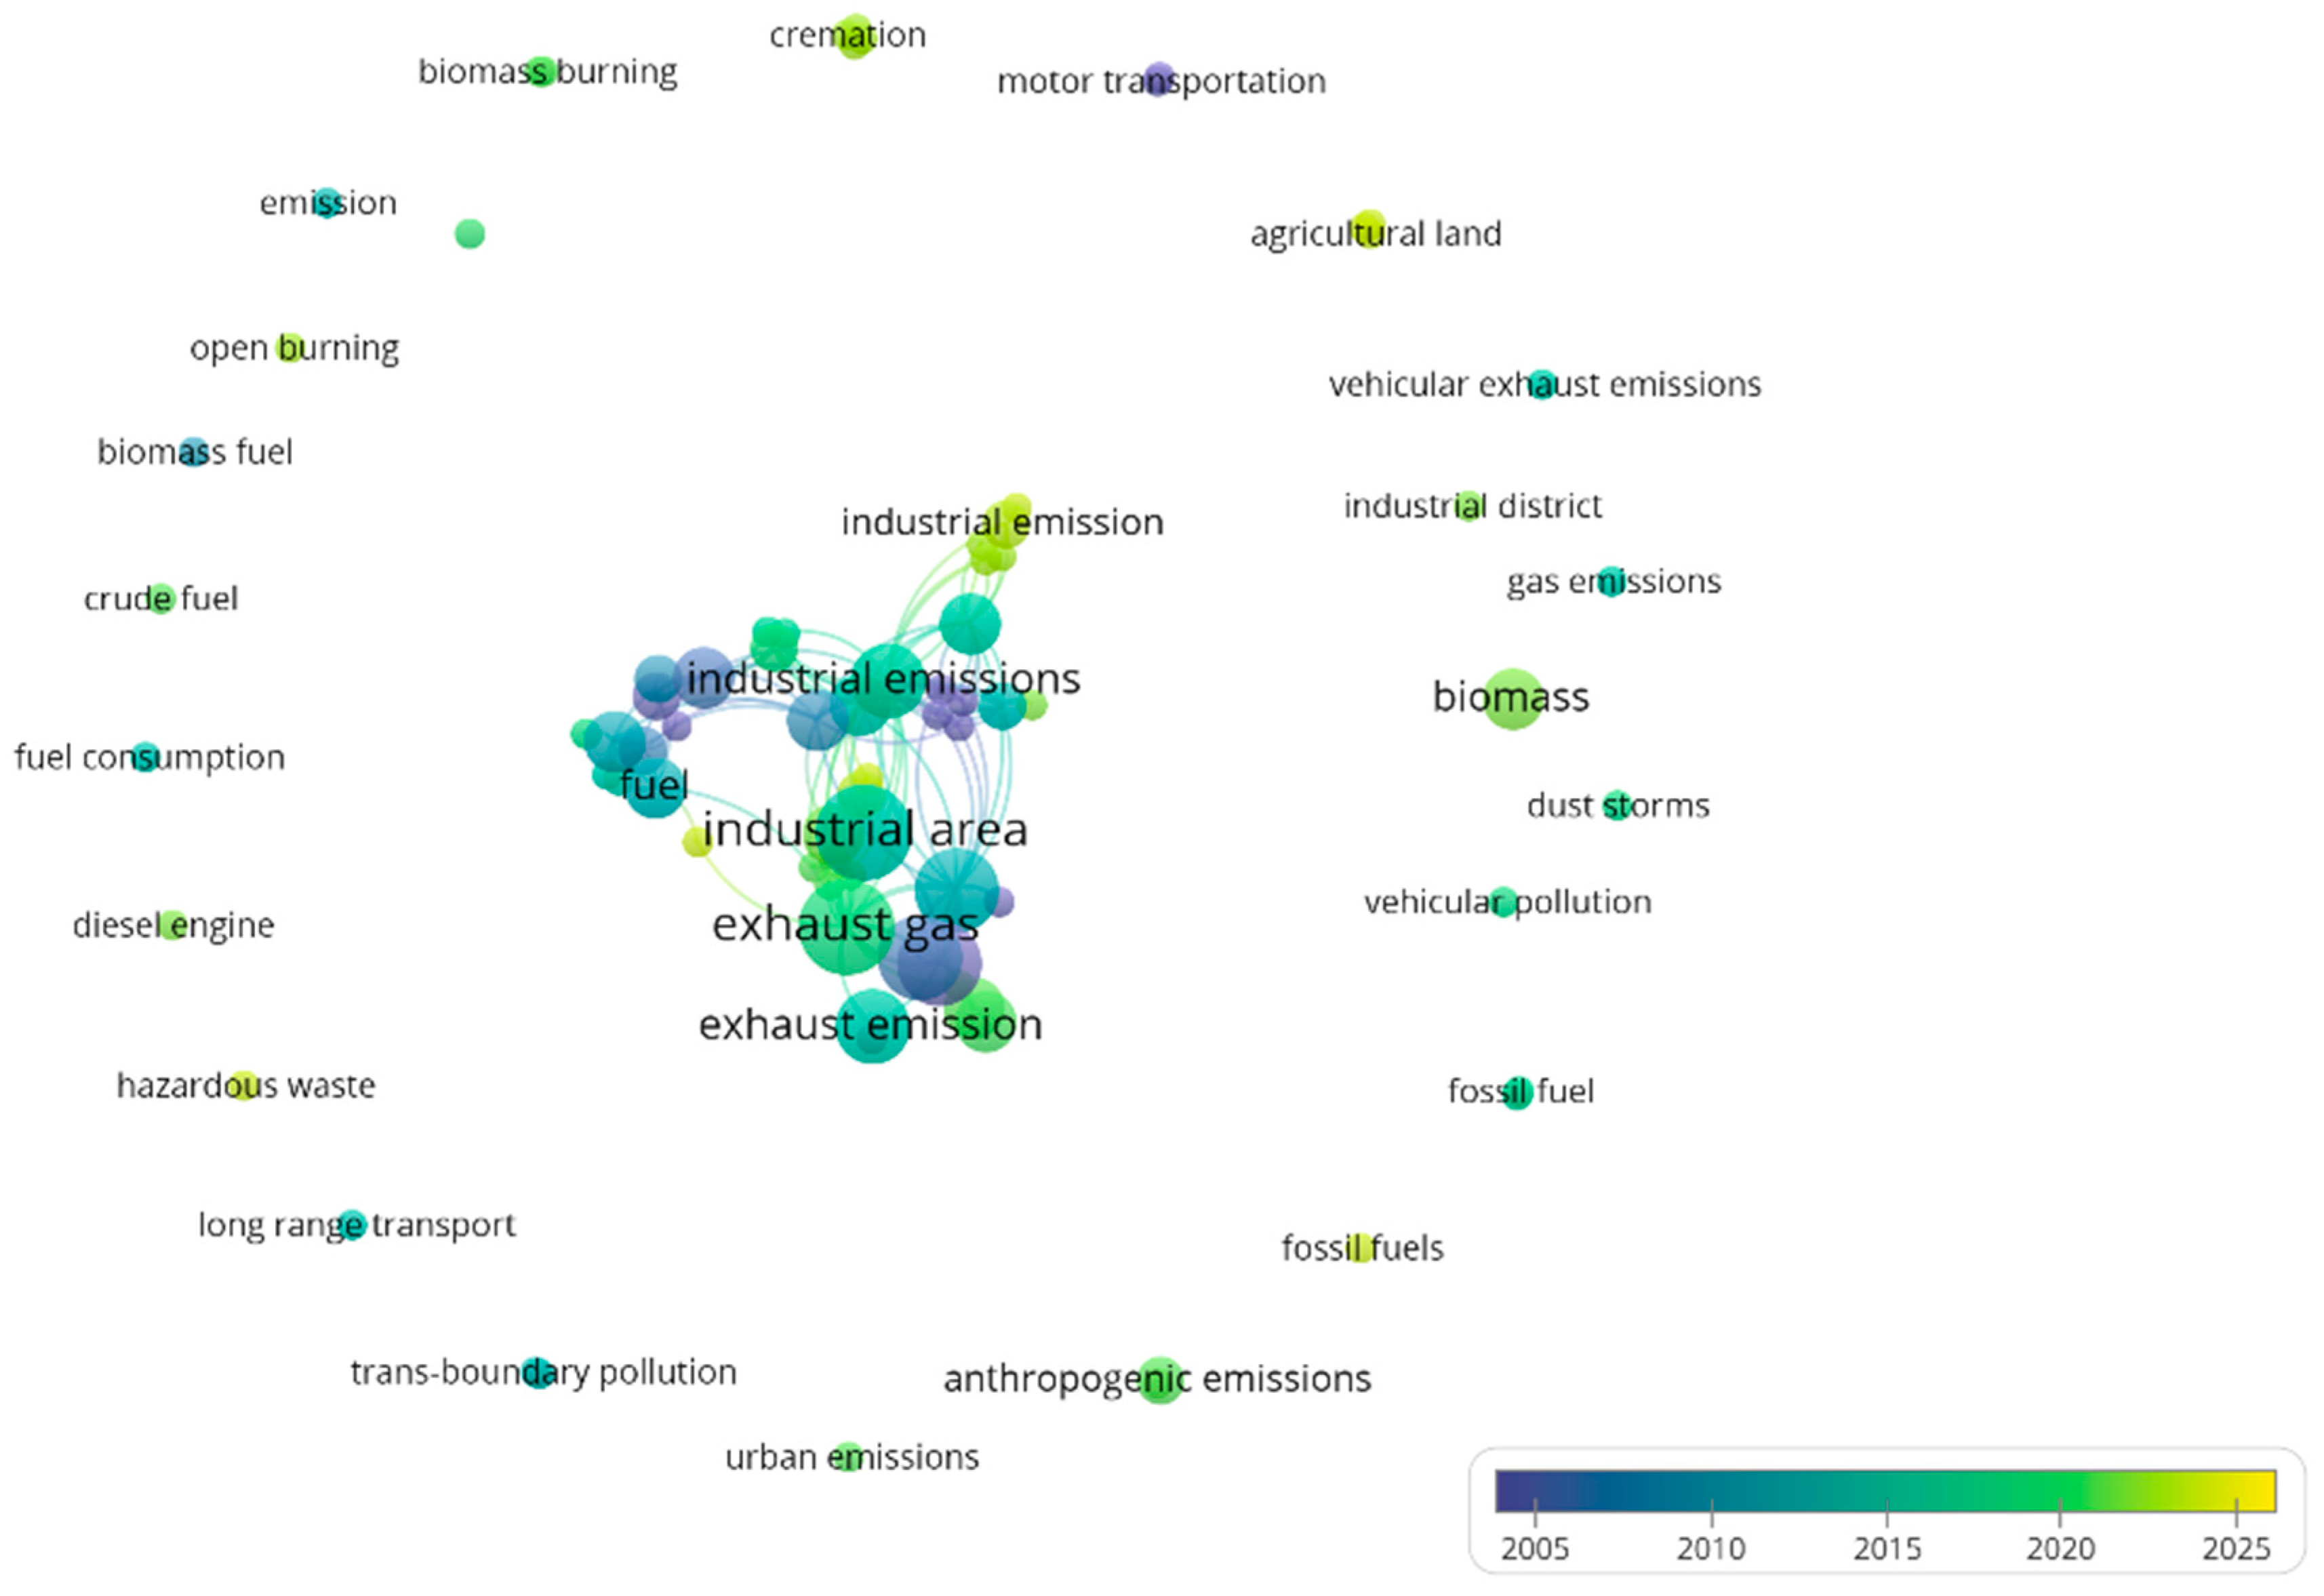
Figure 10.
Co-occurrences network link (1987–2024) for air pollutants: a) All keyword clusters with 1 link (top); time period overlay (bottom).
Figure 10.
Co-occurrences network link (1987–2024) for air pollutants: a) All keyword clusters with 1 link (top); time period overlay (bottom).
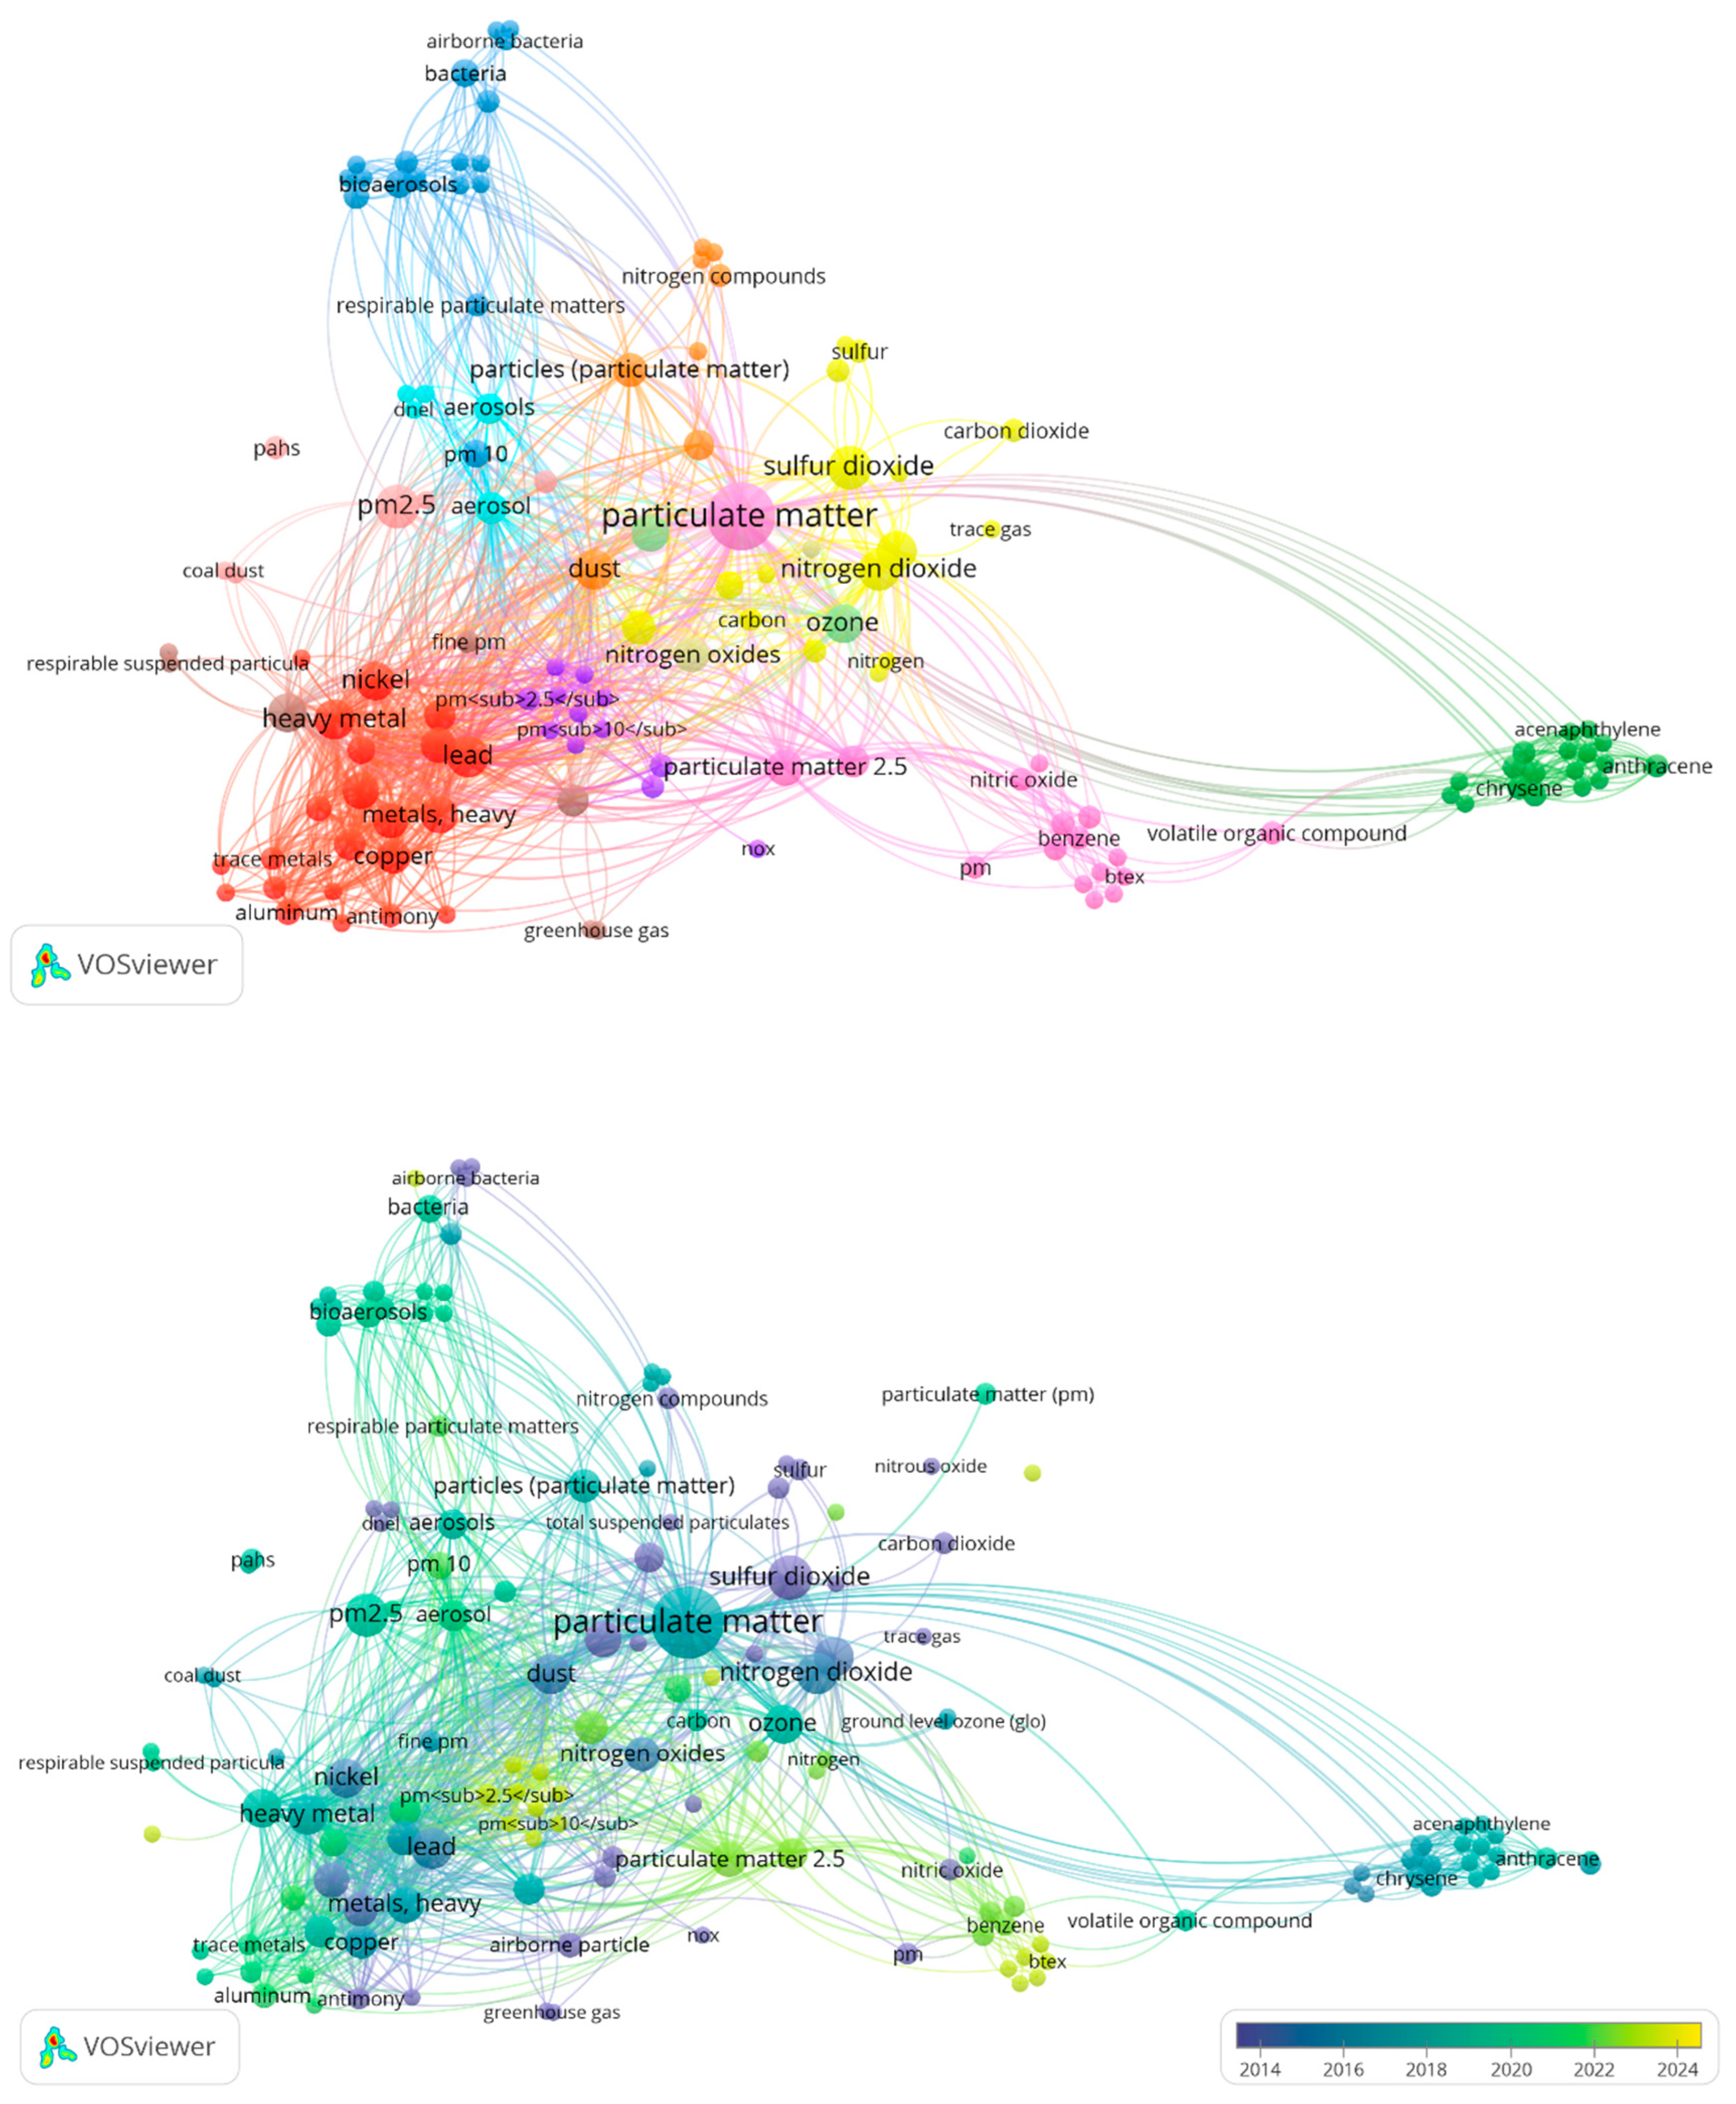
Figure 11.
Co-occurrences network link (1987–2024) for the health impact of air pollution: a) all keywords (5 links) (top); b) time overlay (bottom).
Figure 11.
Co-occurrences network link (1987–2024) for the health impact of air pollution: a) all keywords (5 links) (top); b) time overlay (bottom).
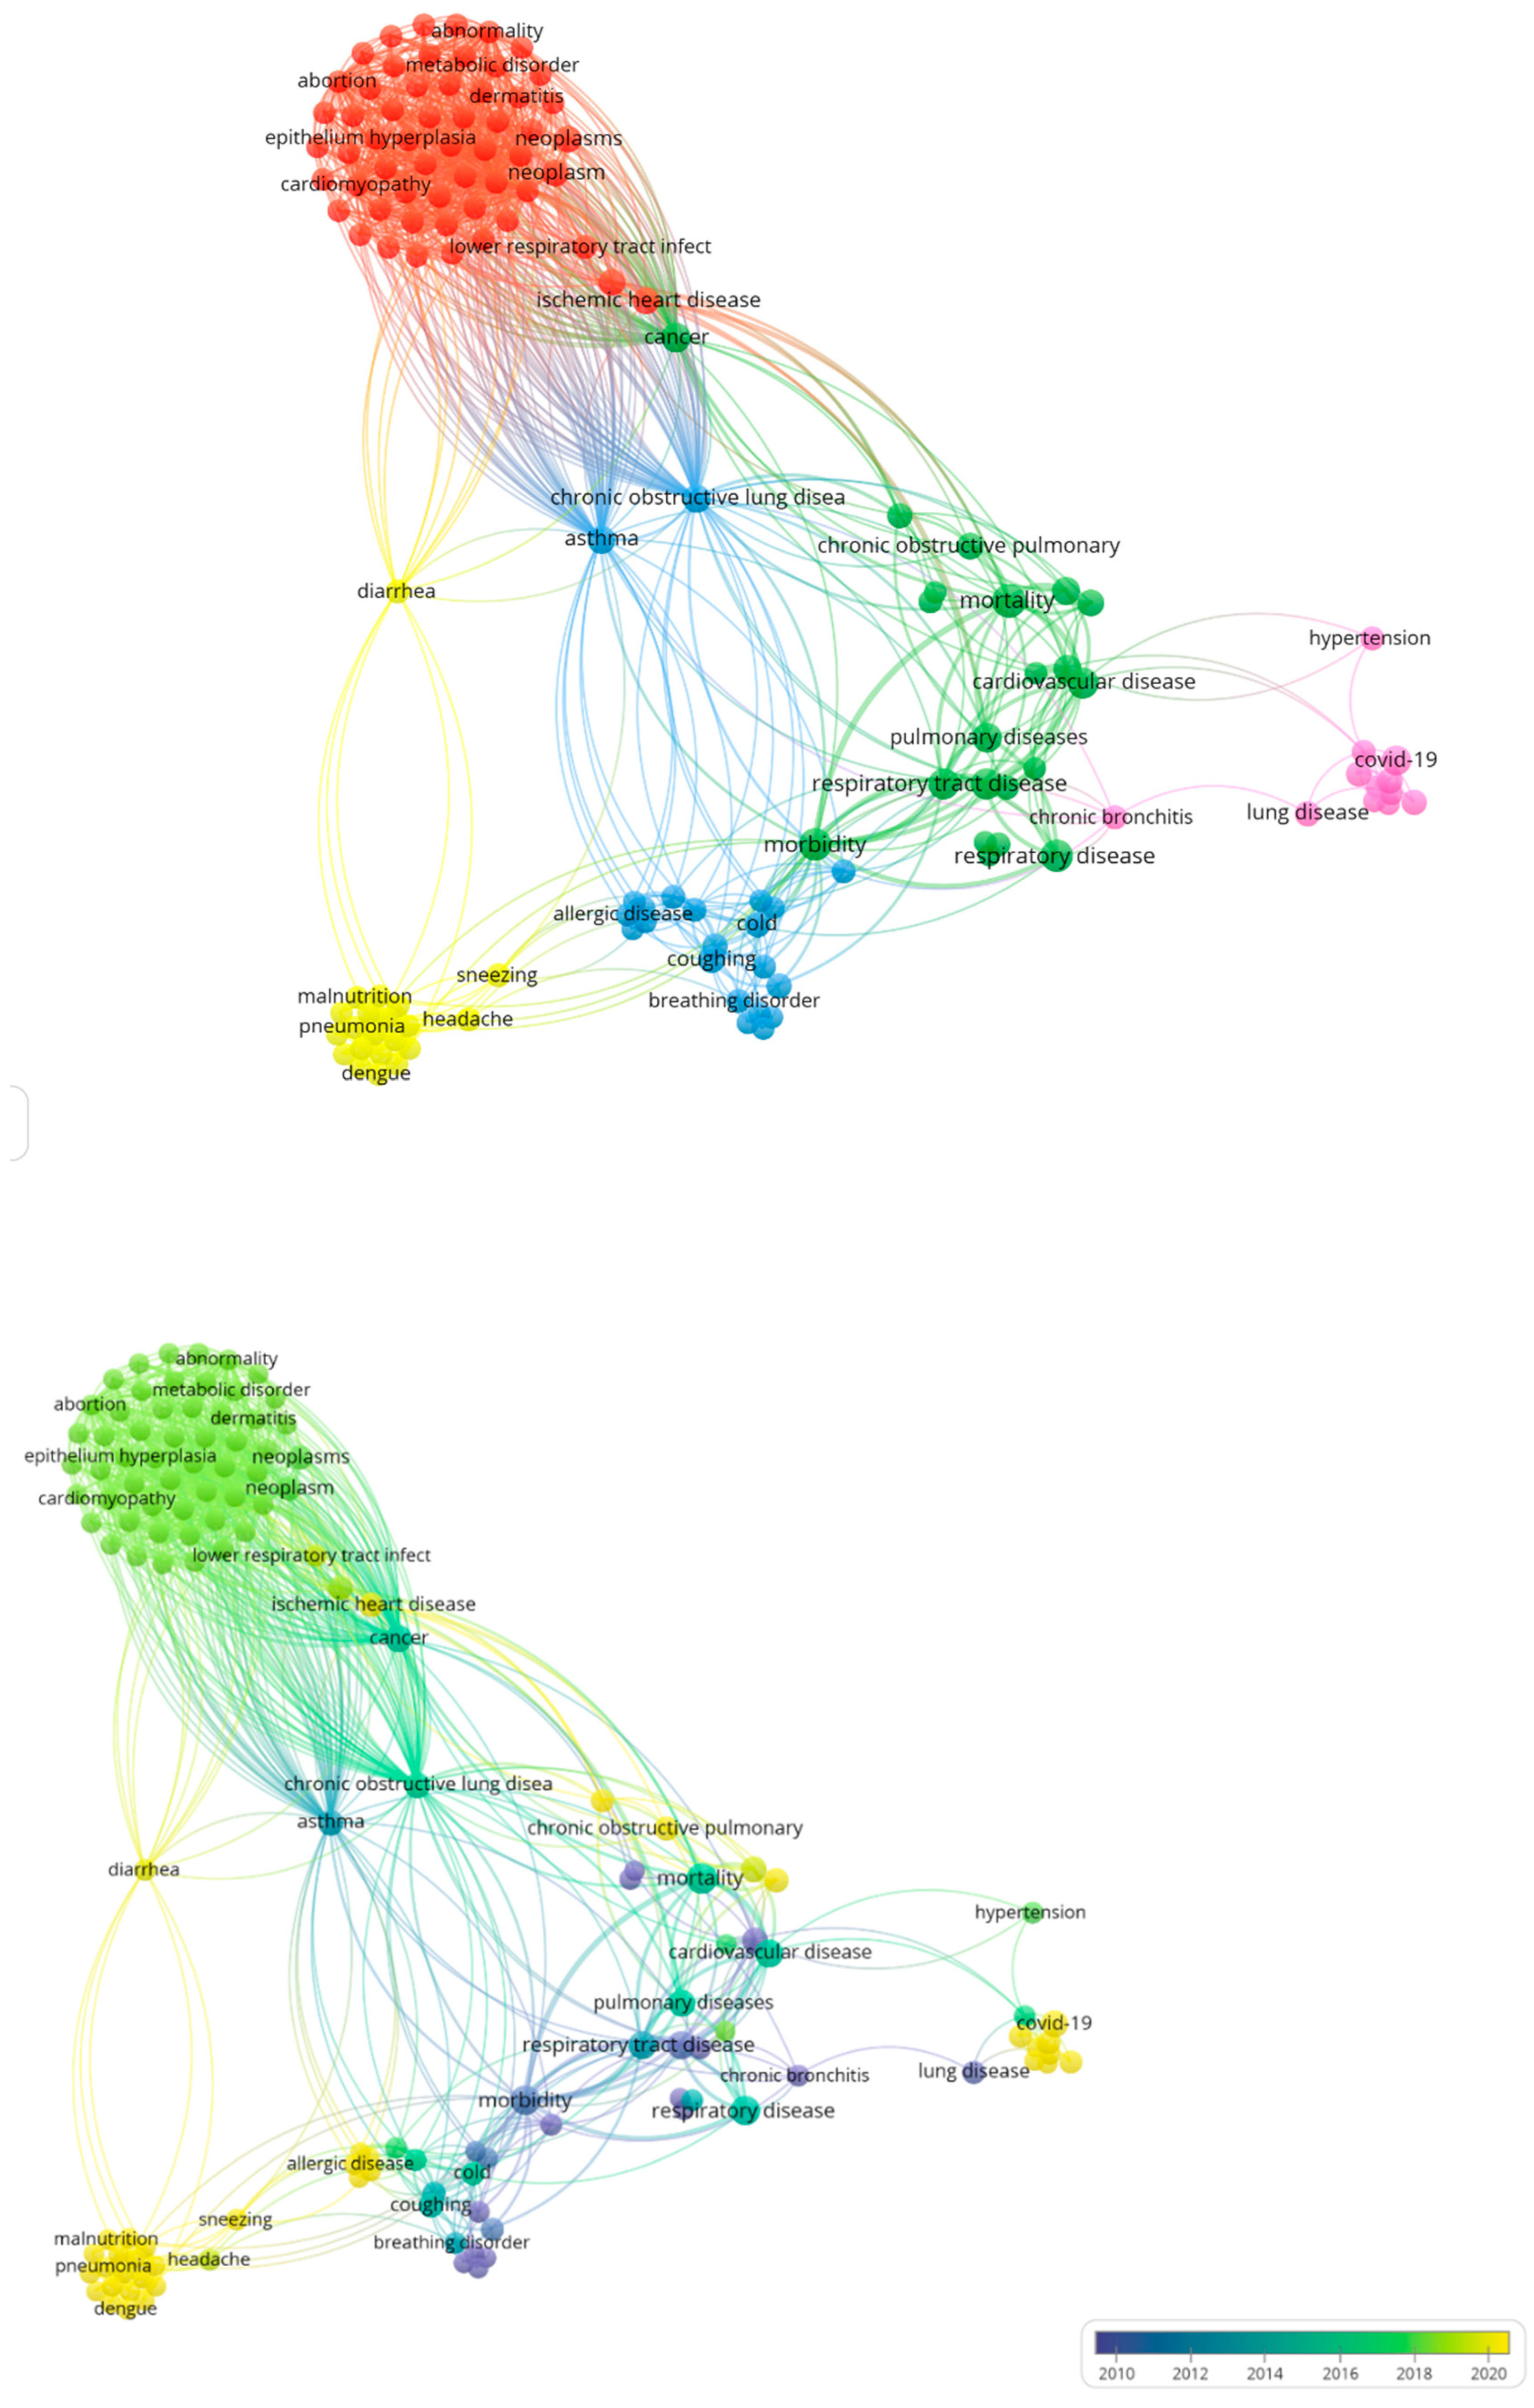
Figure 12.
Adverse effects of PMs entering the human body; Image created by the author using Canva.com tools.
Figure 12.
Adverse effects of PMs entering the human body; Image created by the author using Canva.com tools.
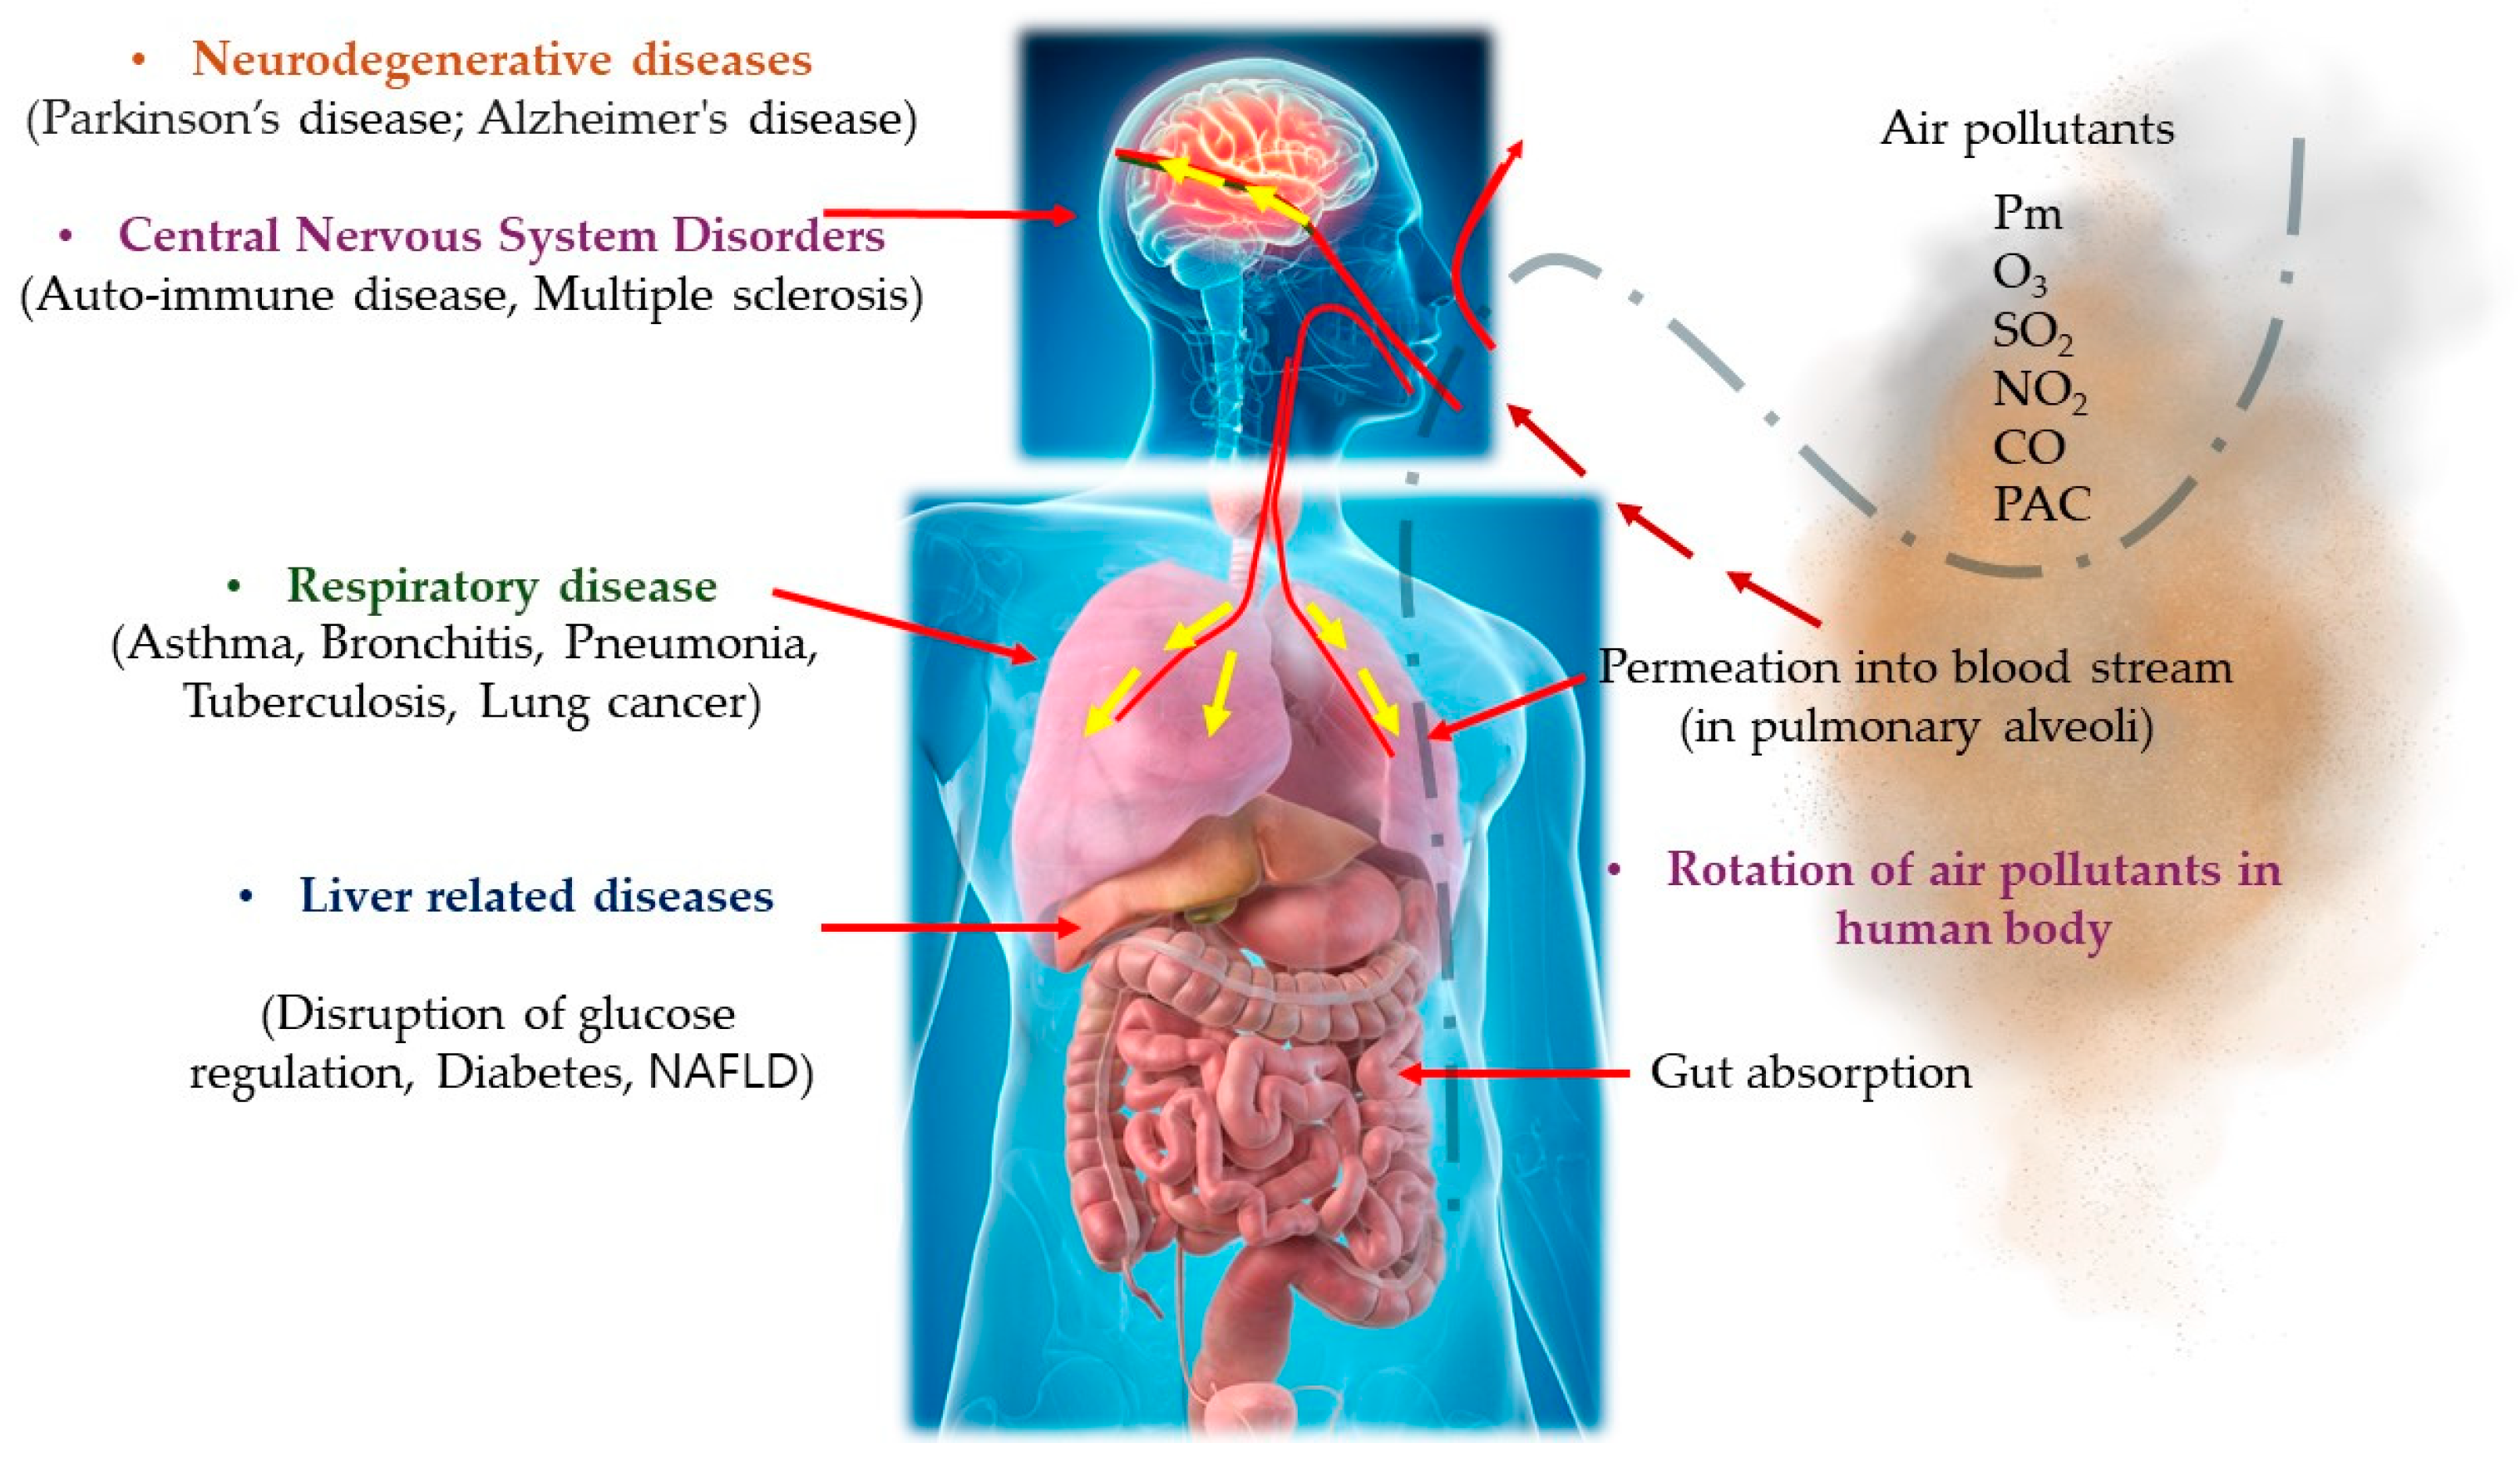
Figure 13.
Air pollution mitigation strategies at different levels (based on included studies).
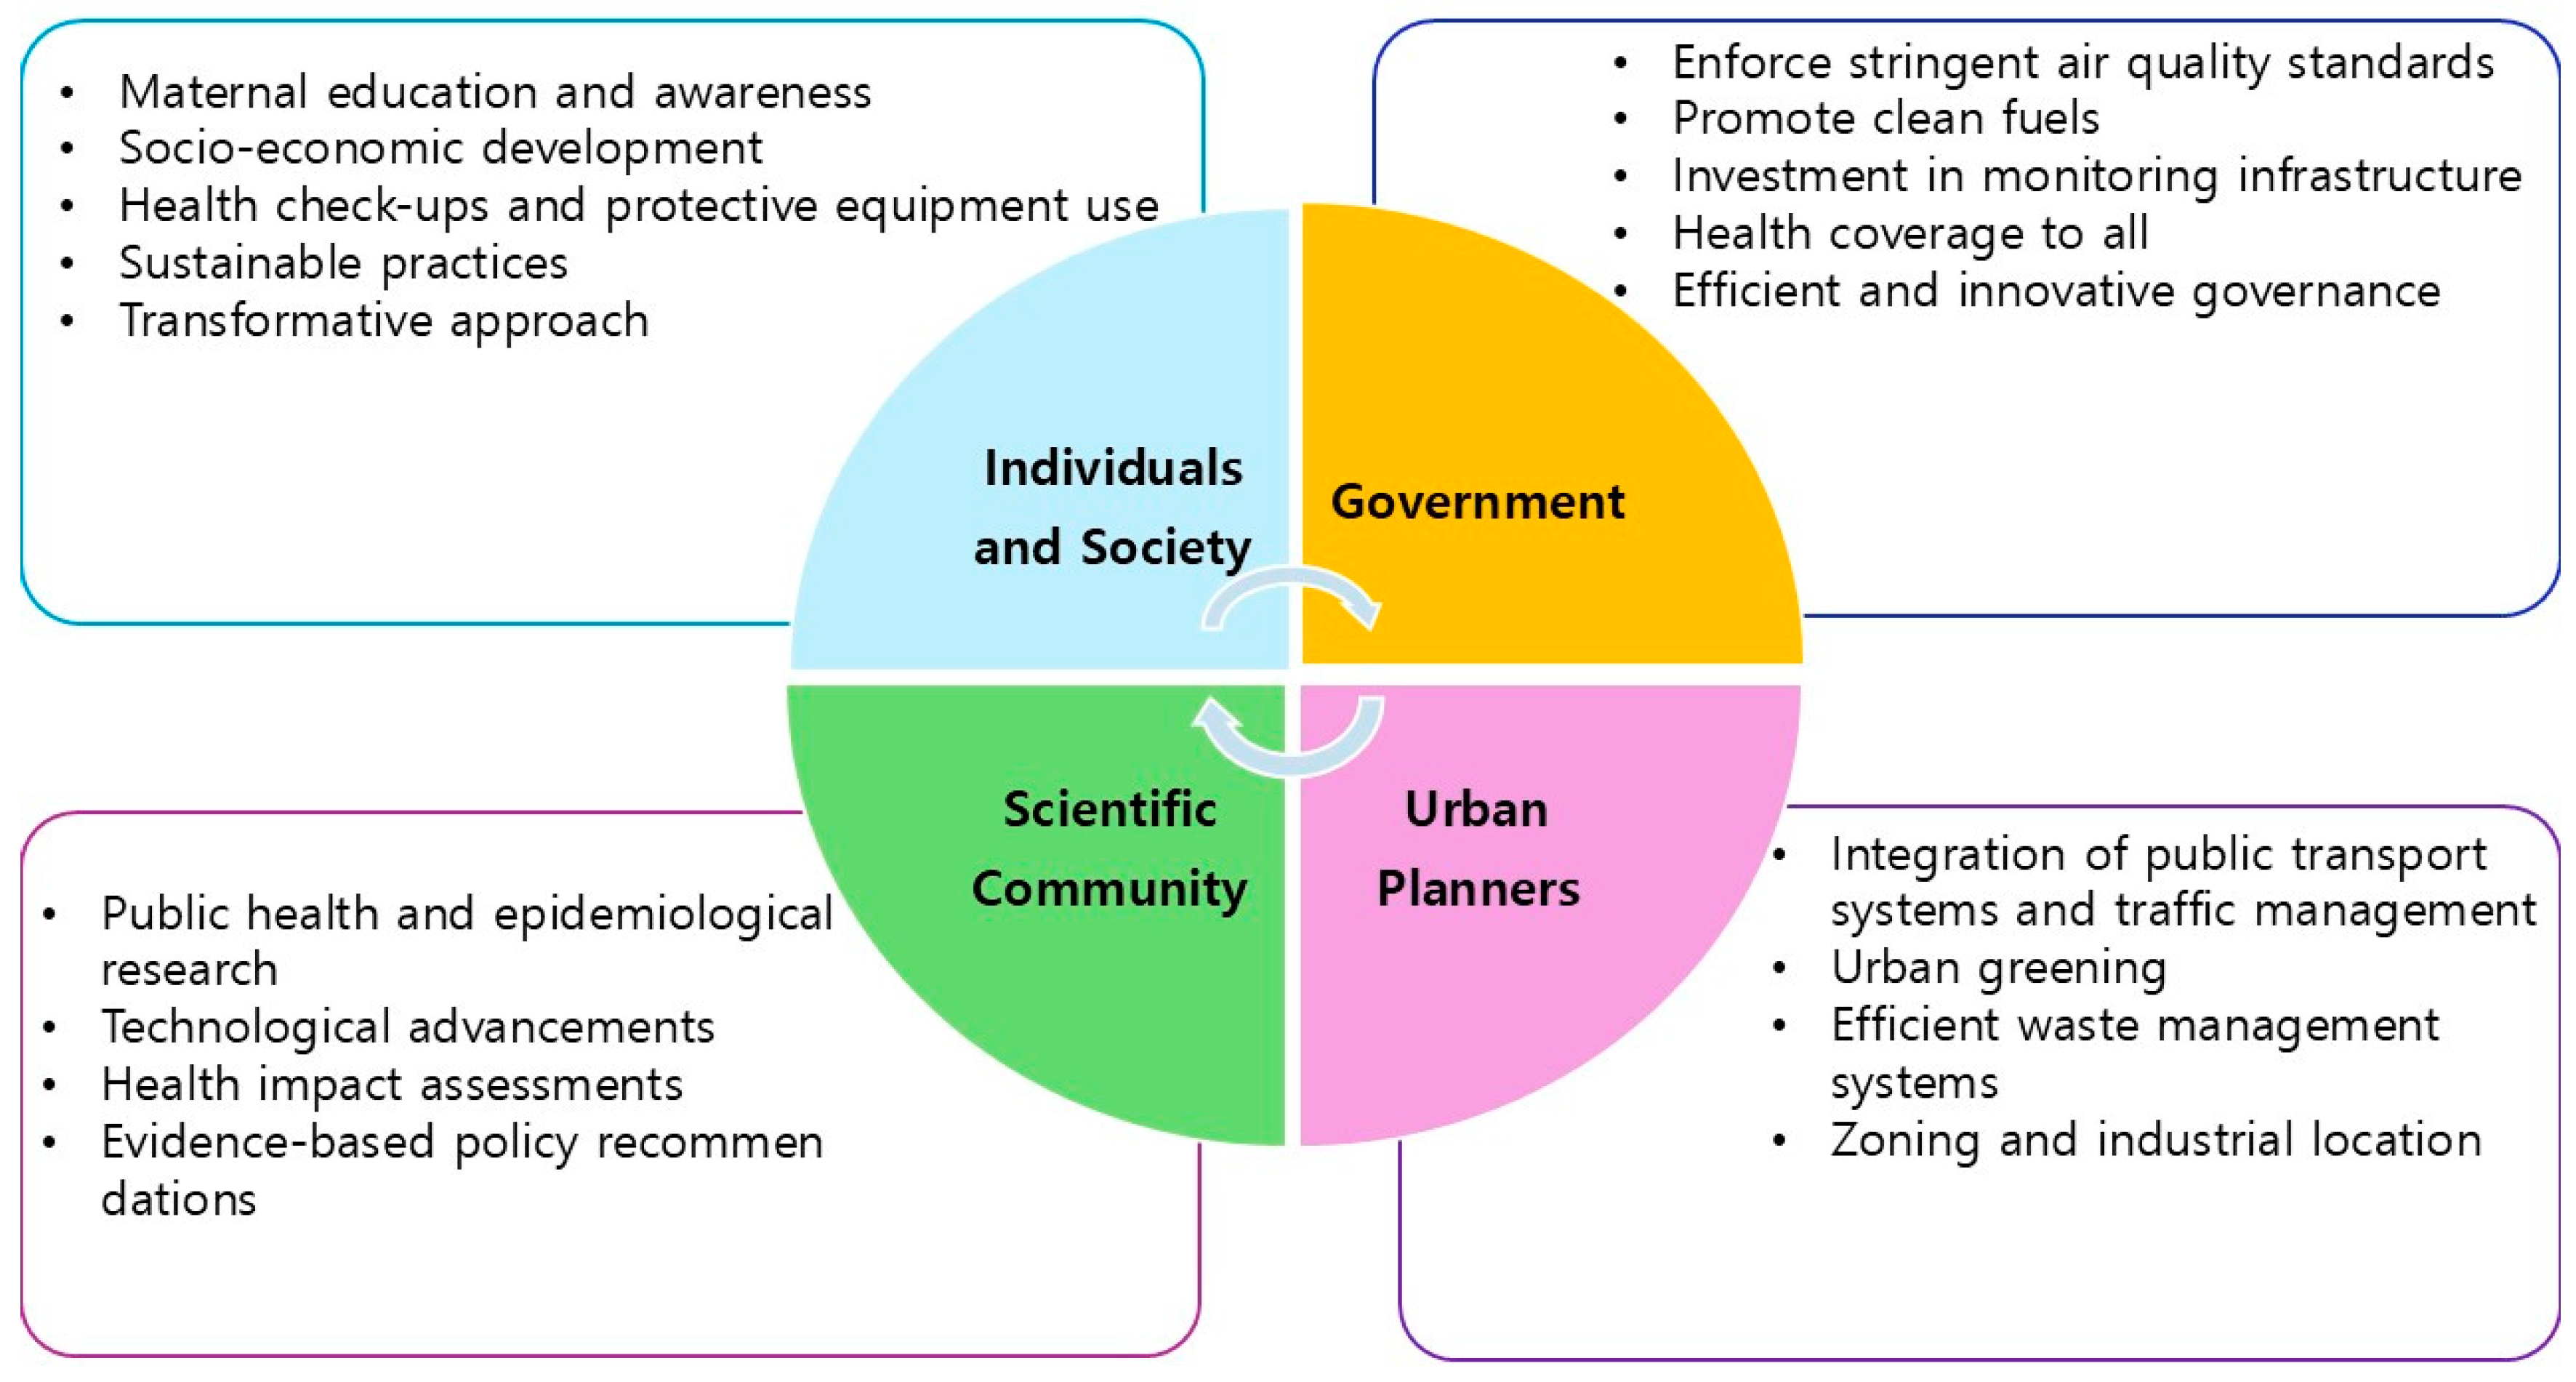
Figure 14.
Restructuring roads by constructing separate pavements for pedestrians and two-wheelers, coupled with electrified/hydrogen-powered public transport, can create a cleaner and safer city. Image created by the author using Canva.com tools.
Figure 14.
Restructuring roads by constructing separate pavements for pedestrians and two-wheelers, coupled with electrified/hydrogen-powered public transport, can create a cleaner and safer city. Image created by the author using Canva.com tools.
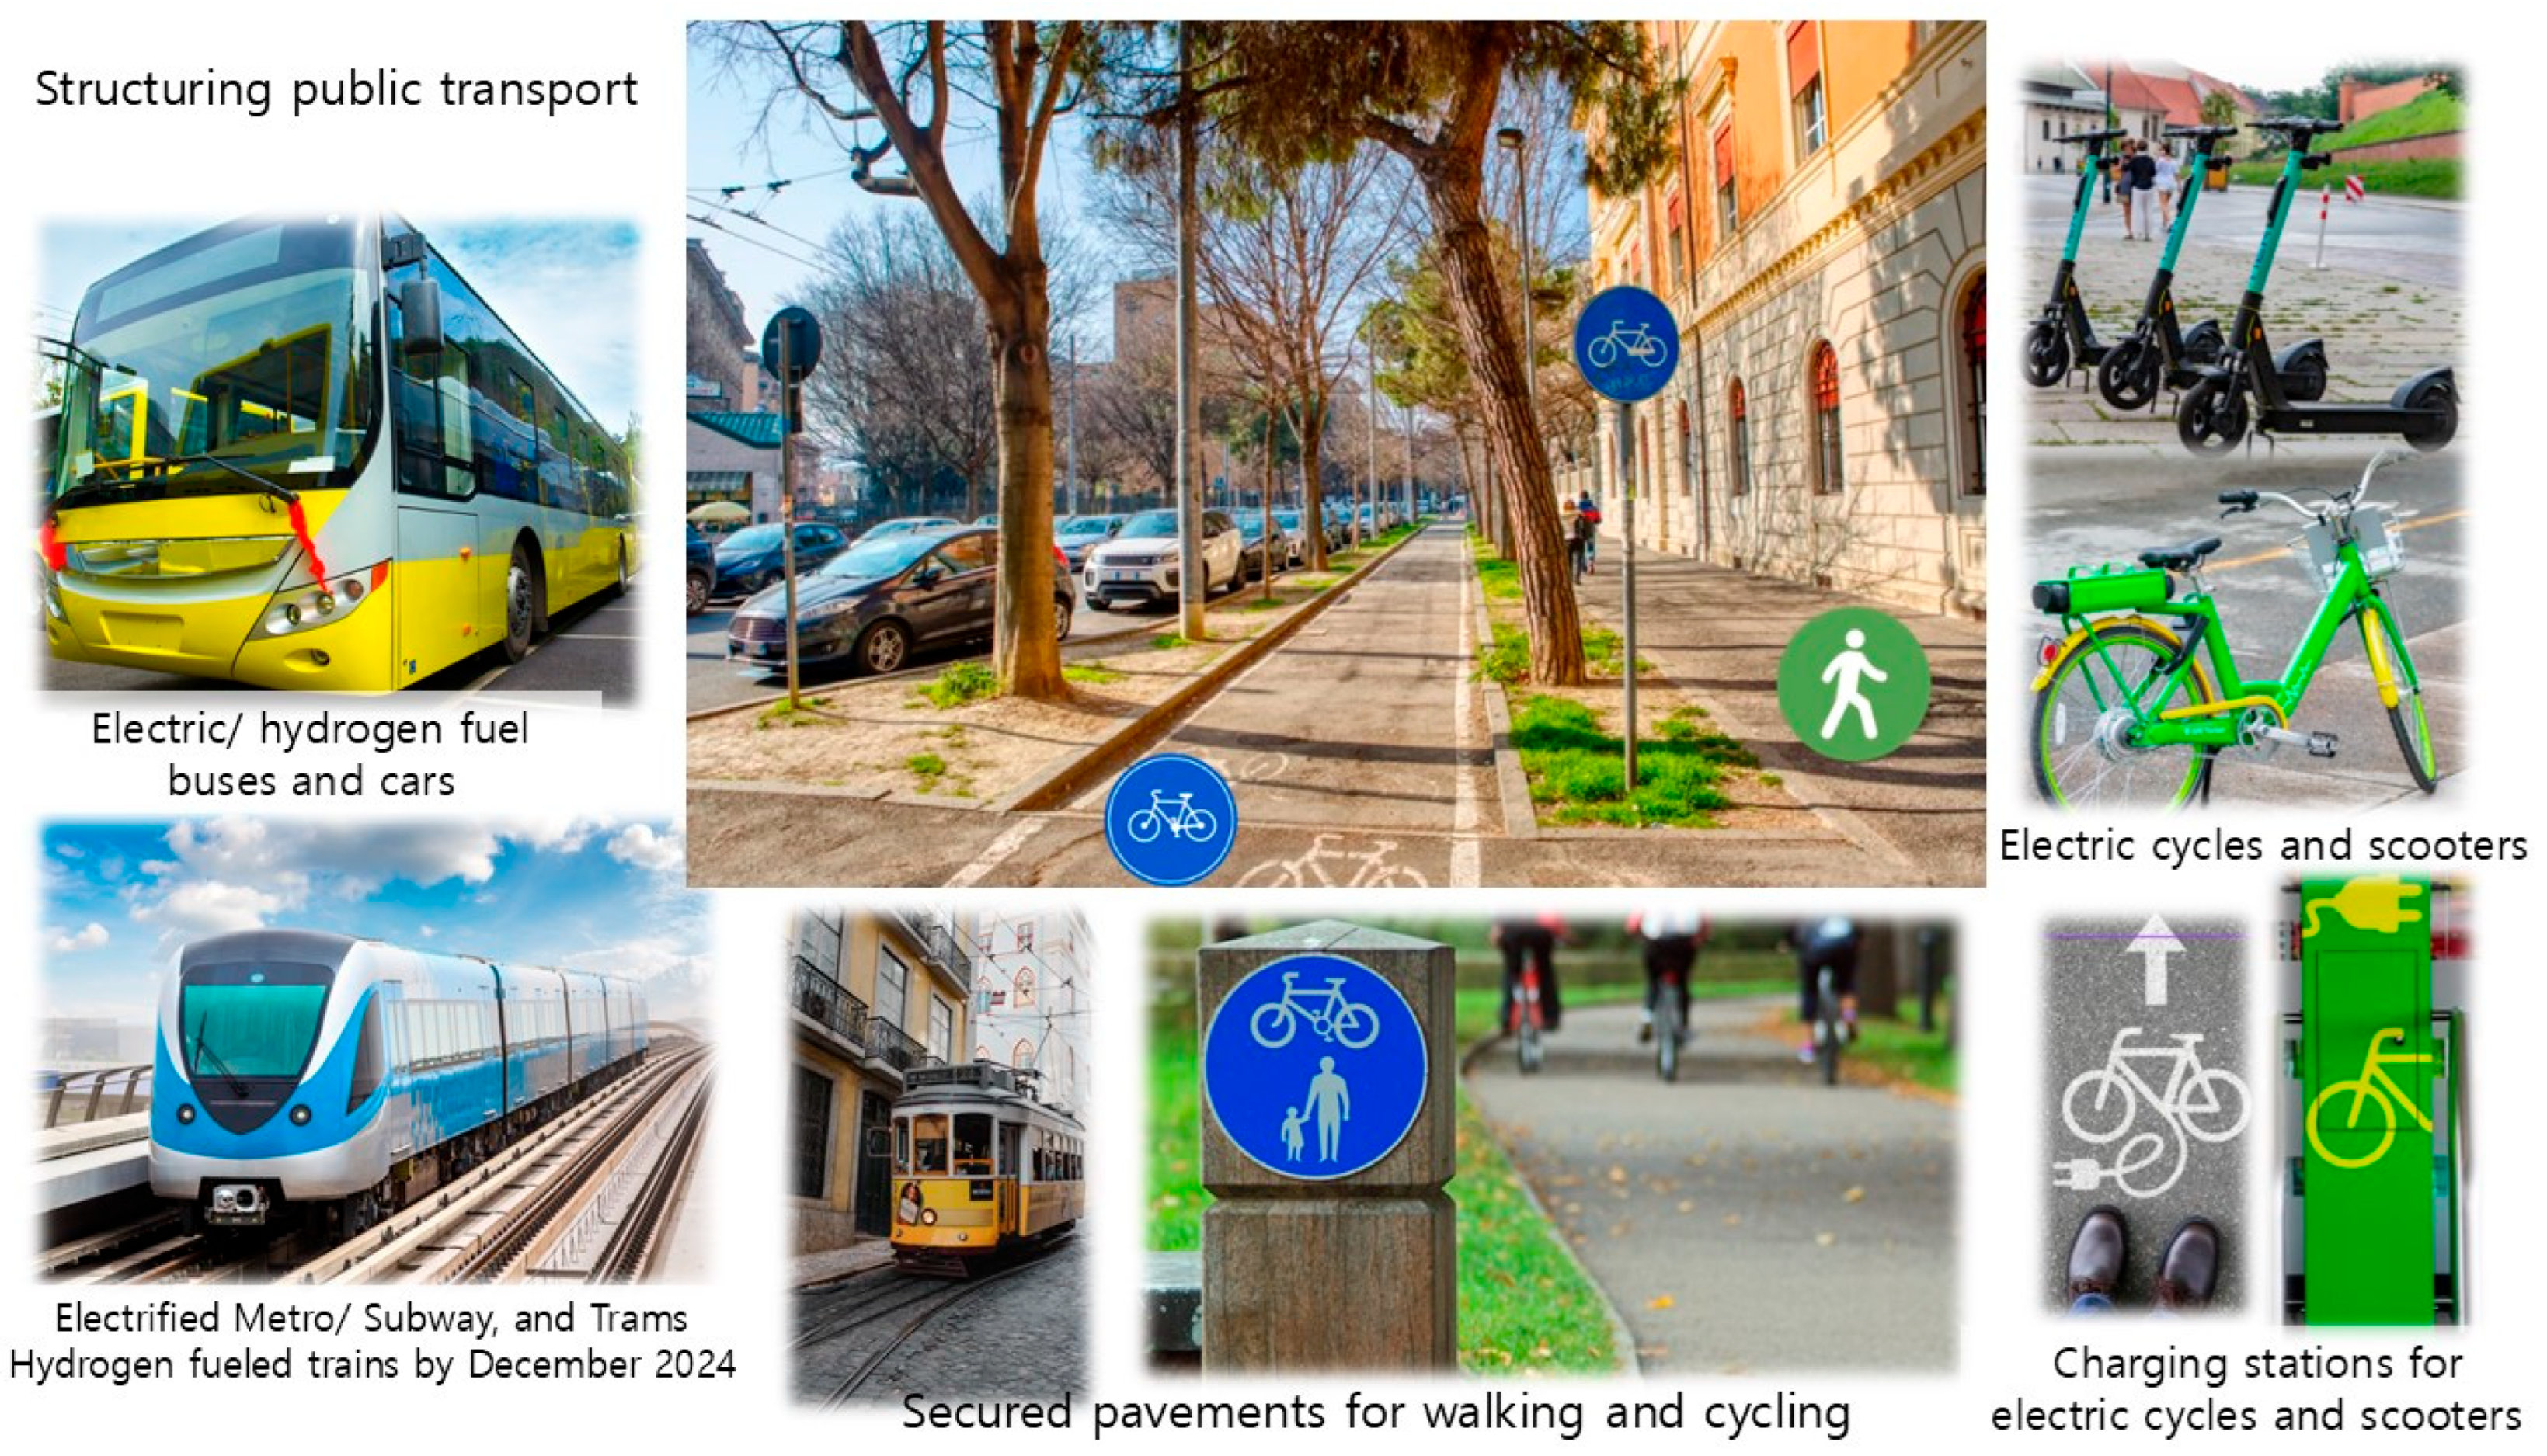
Figure 15.
Harnessing Solar power for supporting pollution-free city life; Image created by the author using Canva.com tools.
Figure 15.
Harnessing Solar power for supporting pollution-free city life; Image created by the author using Canva.com tools.
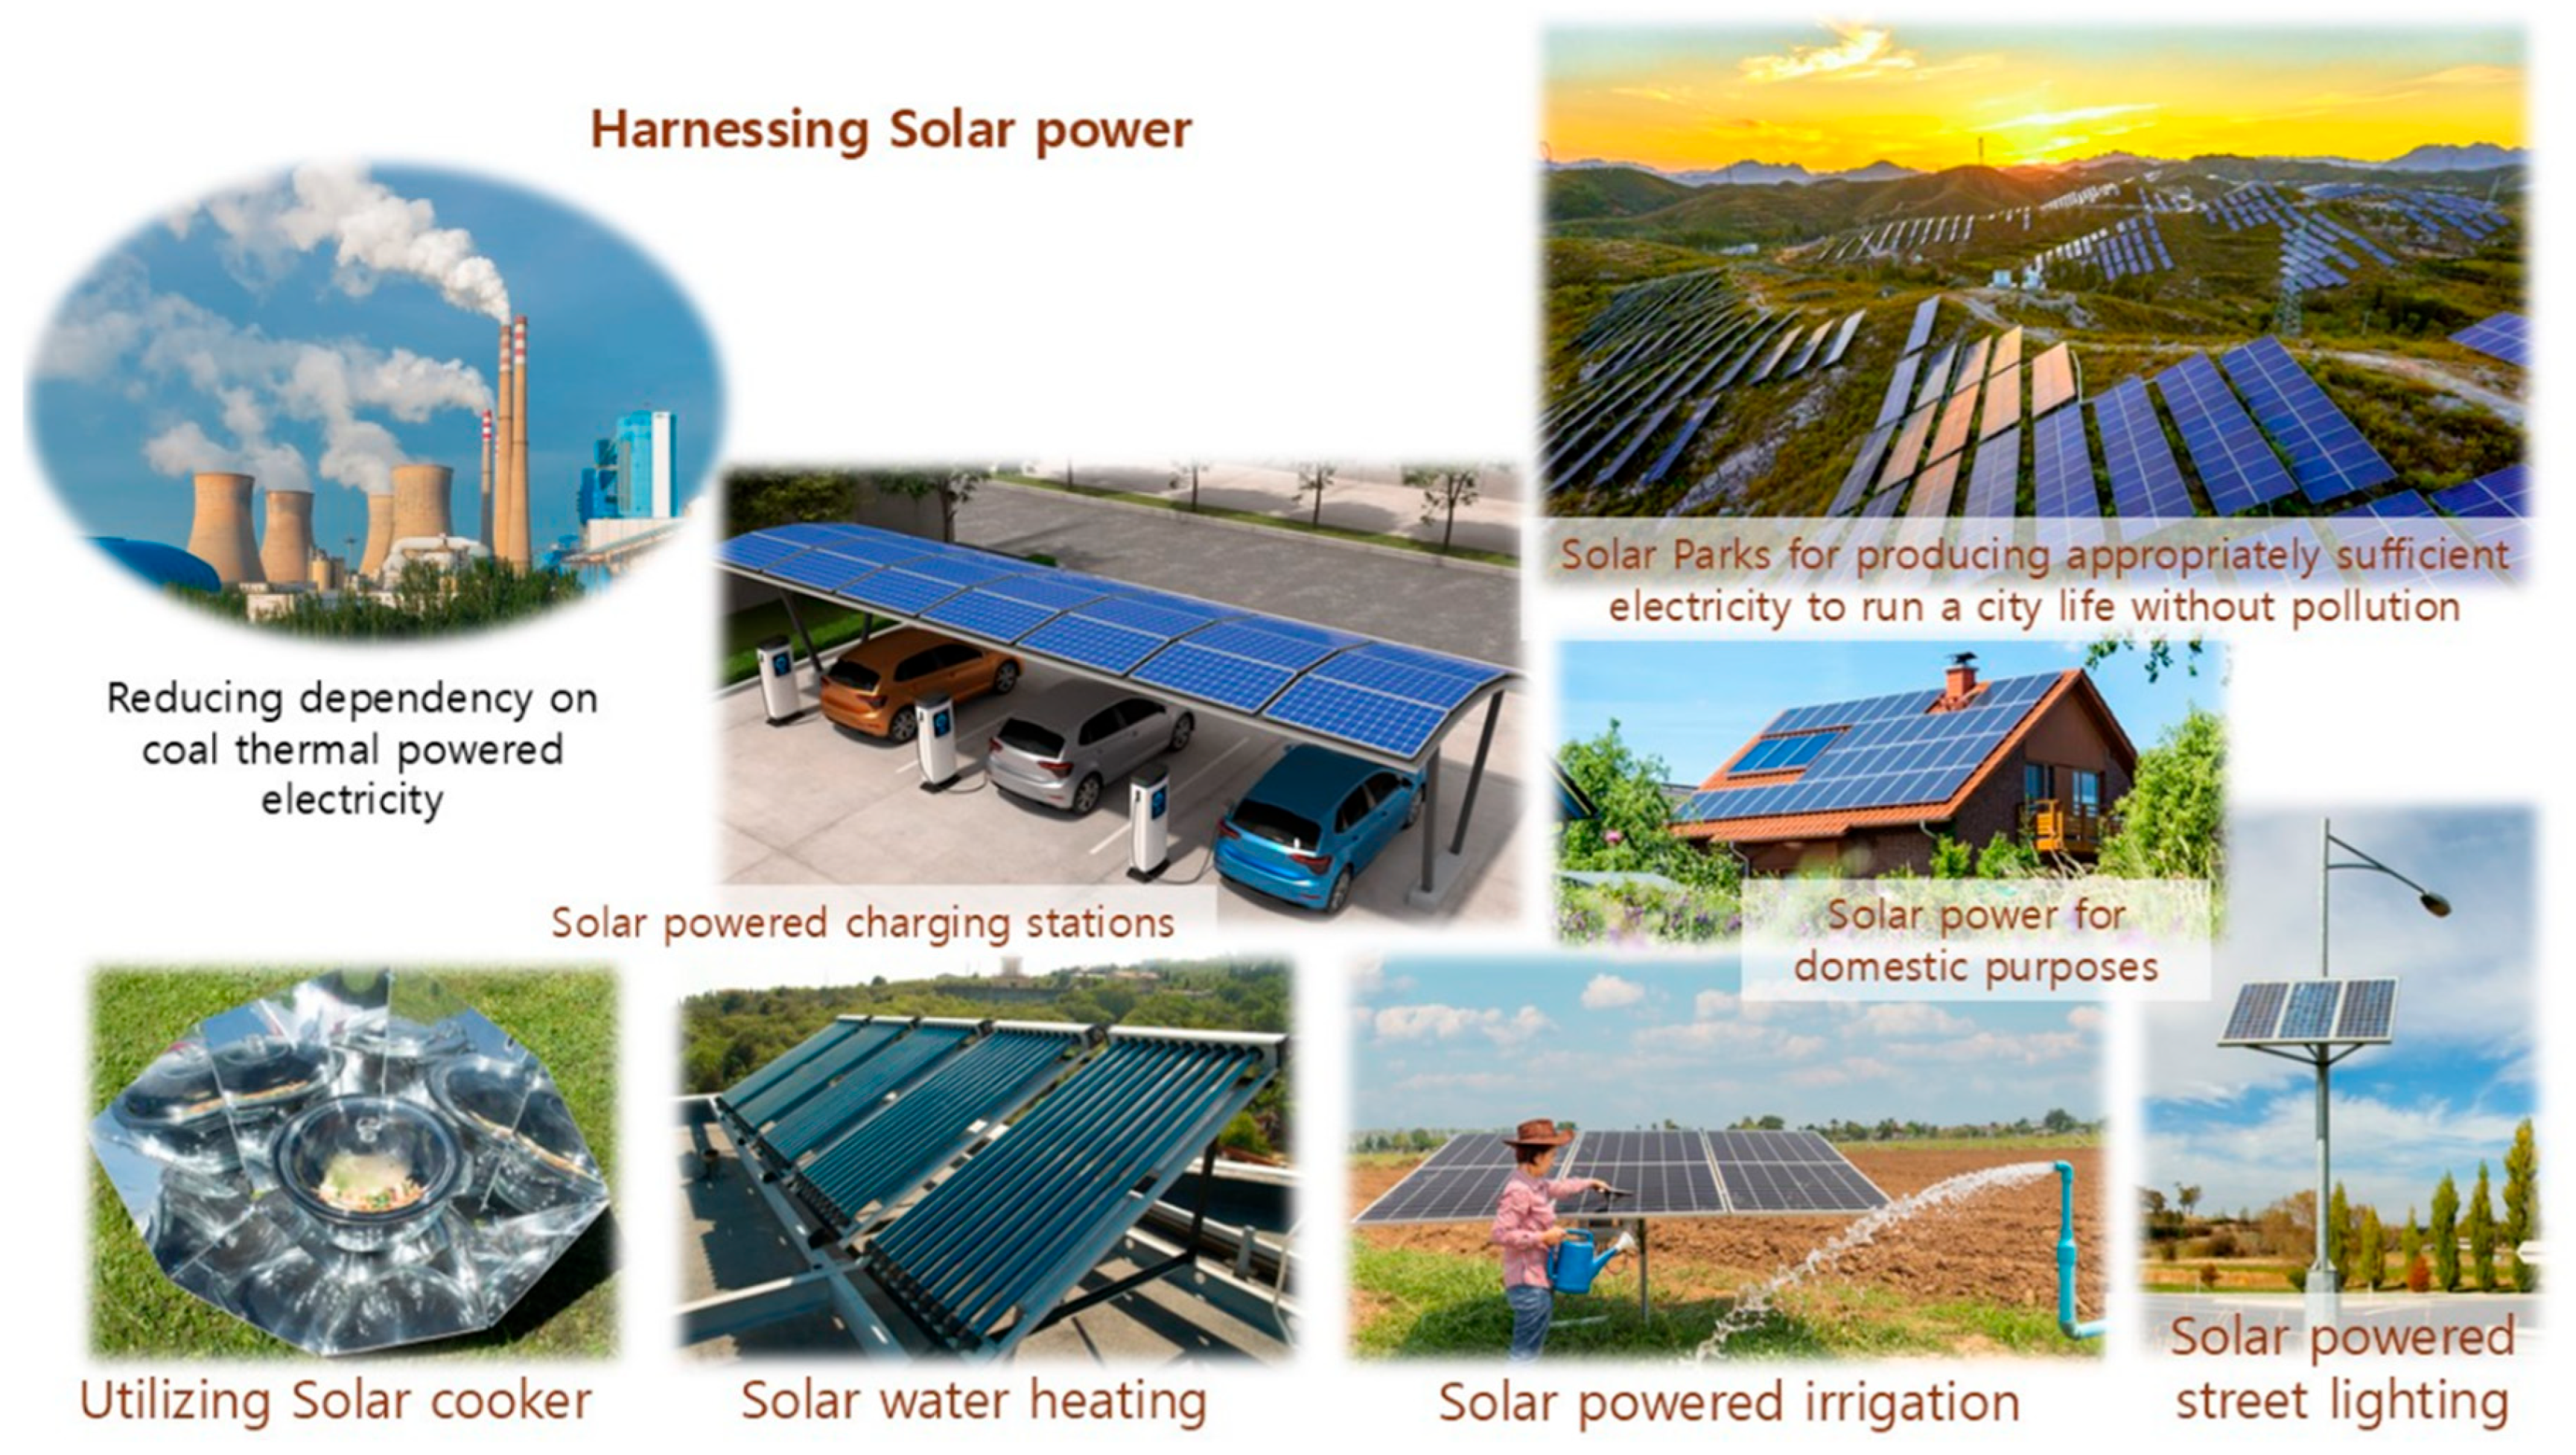
Figure 16.
Construction activities cause massive pollution. Covered construction sites during operation can effectively reduce PM emissions to the atmosphere and mitigate pollution; image created by the author using Canva.com tools.
Figure 16.
Construction activities cause massive pollution. Covered construction sites during operation can effectively reduce PM emissions to the atmosphere and mitigate pollution; image created by the author using Canva.com tools.

Figure 17.
Heavy rain causes flooding and erosion/ aerosolization of soil. The mud afterwards after drying is lifted and moved by air and winds to add huge amounts of particulate matter to the atmosphere and cause pollution; Image created by the author using Canva.com tools.
Figure 17.
Heavy rain causes flooding and erosion/ aerosolization of soil. The mud afterwards after drying is lifted and moved by air and winds to add huge amounts of particulate matter to the atmosphere and cause pollution; Image created by the author using Canva.com tools.
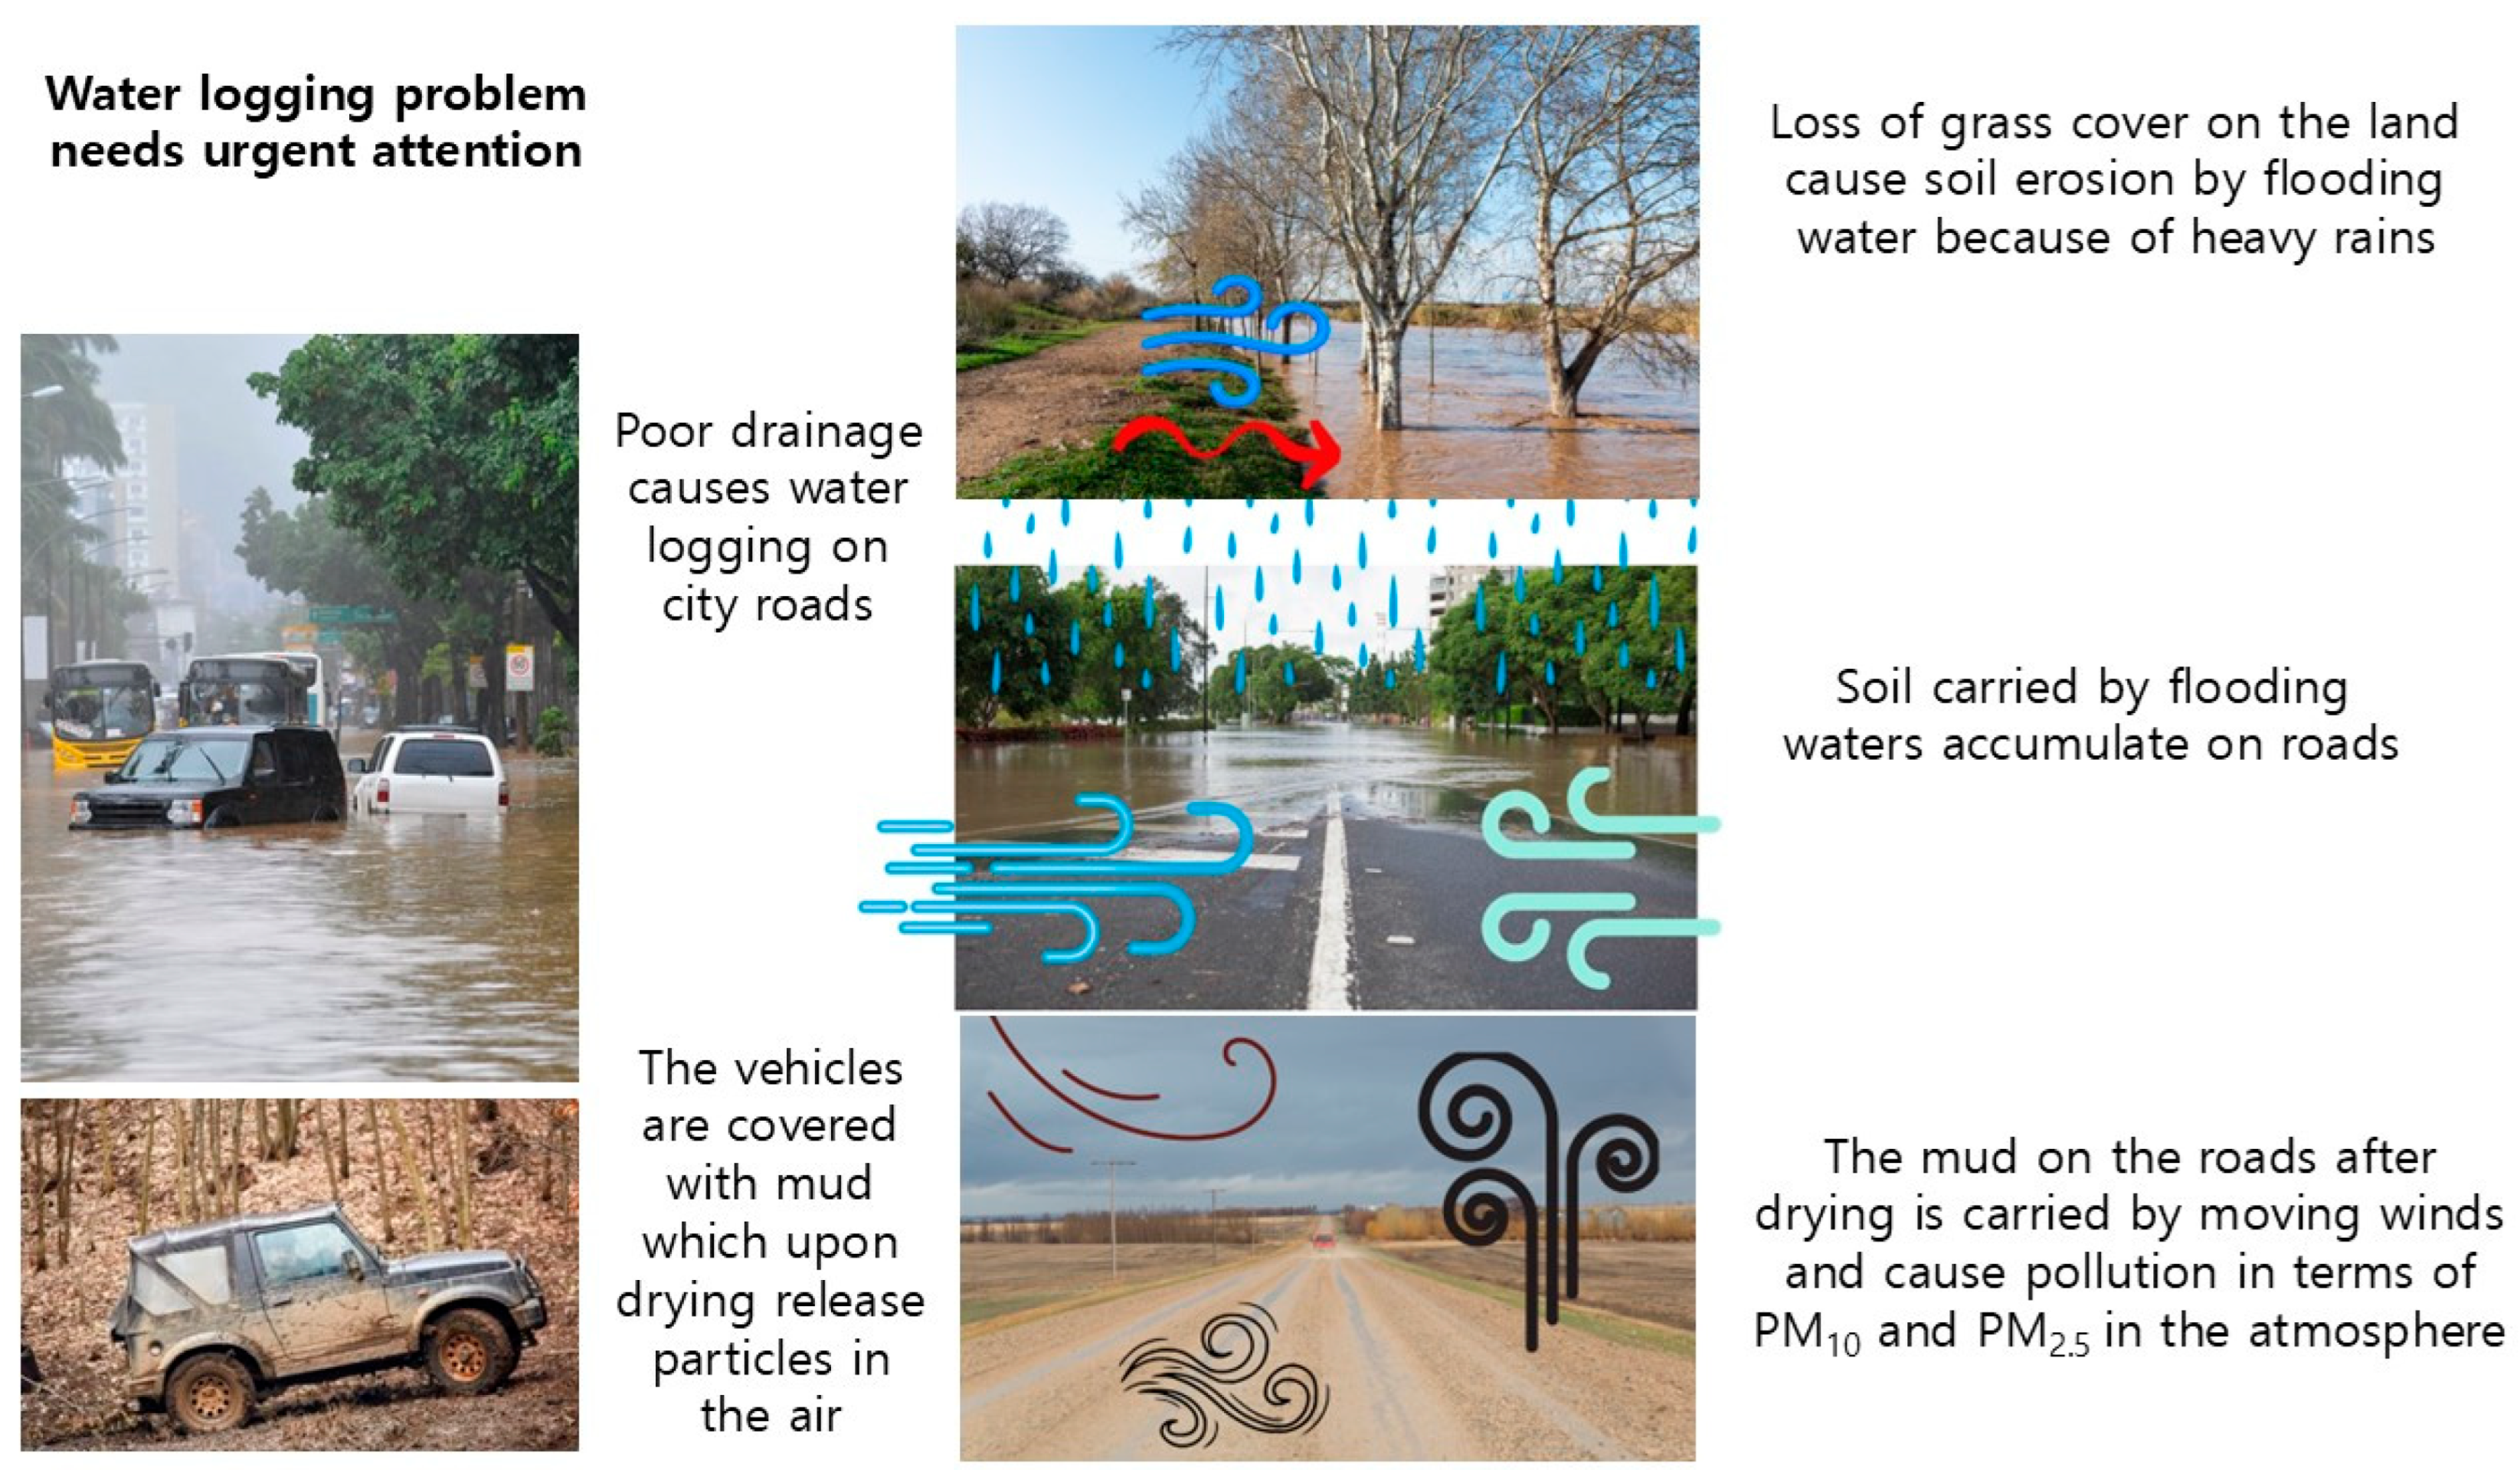
Figure 18.
Open or uncovered soil is vulnerable to erosion, and this adds PMs in the atmosphere. A properly maintained grass cover; Image created by the author using Canva.com tools.
Figure 18.
Open or uncovered soil is vulnerable to erosion, and this adds PMs in the atmosphere. A properly maintained grass cover; Image created by the author using Canva.com tools.
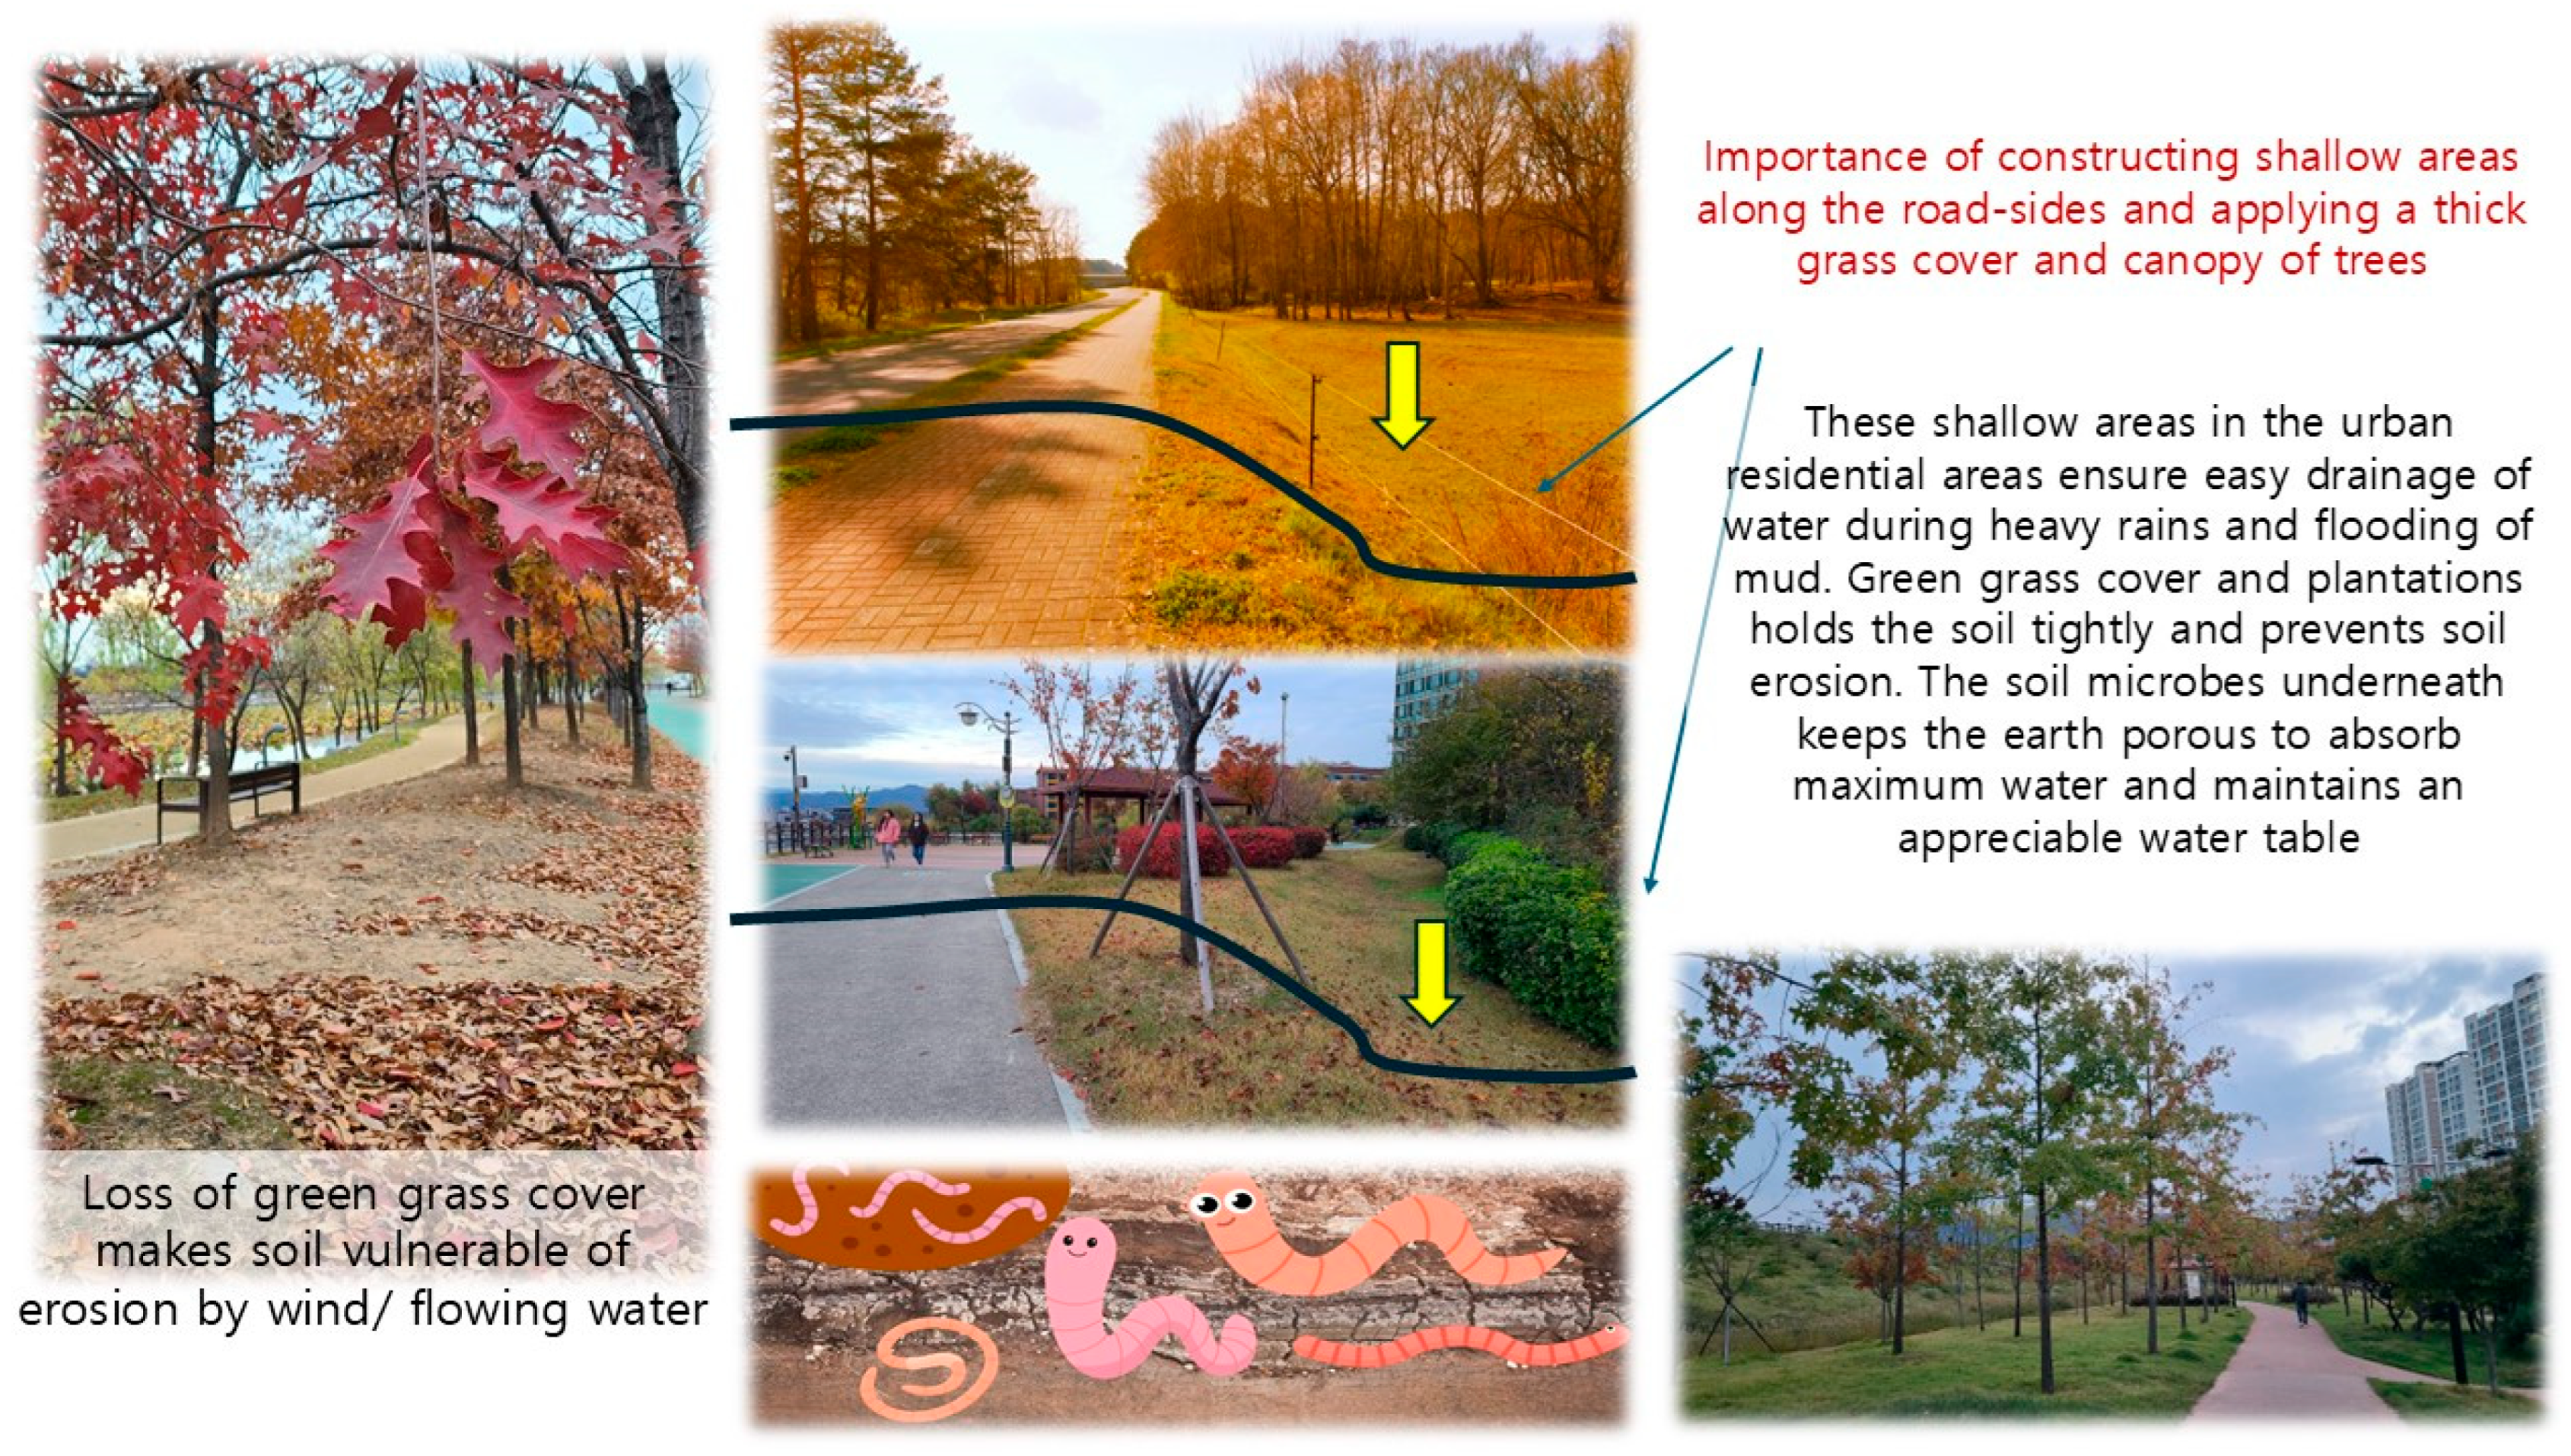
Figure 19.
Covering of open spaces at public places, such as parks and walking areas with grass and canopies of green vegetation, can effectively reduce PM in the atmosphere; Image created by the author using Canva.com tools.
Figure 19.
Covering of open spaces at public places, such as parks and walking areas with grass and canopies of green vegetation, can effectively reduce PM in the atmosphere; Image created by the author using Canva.com tools.
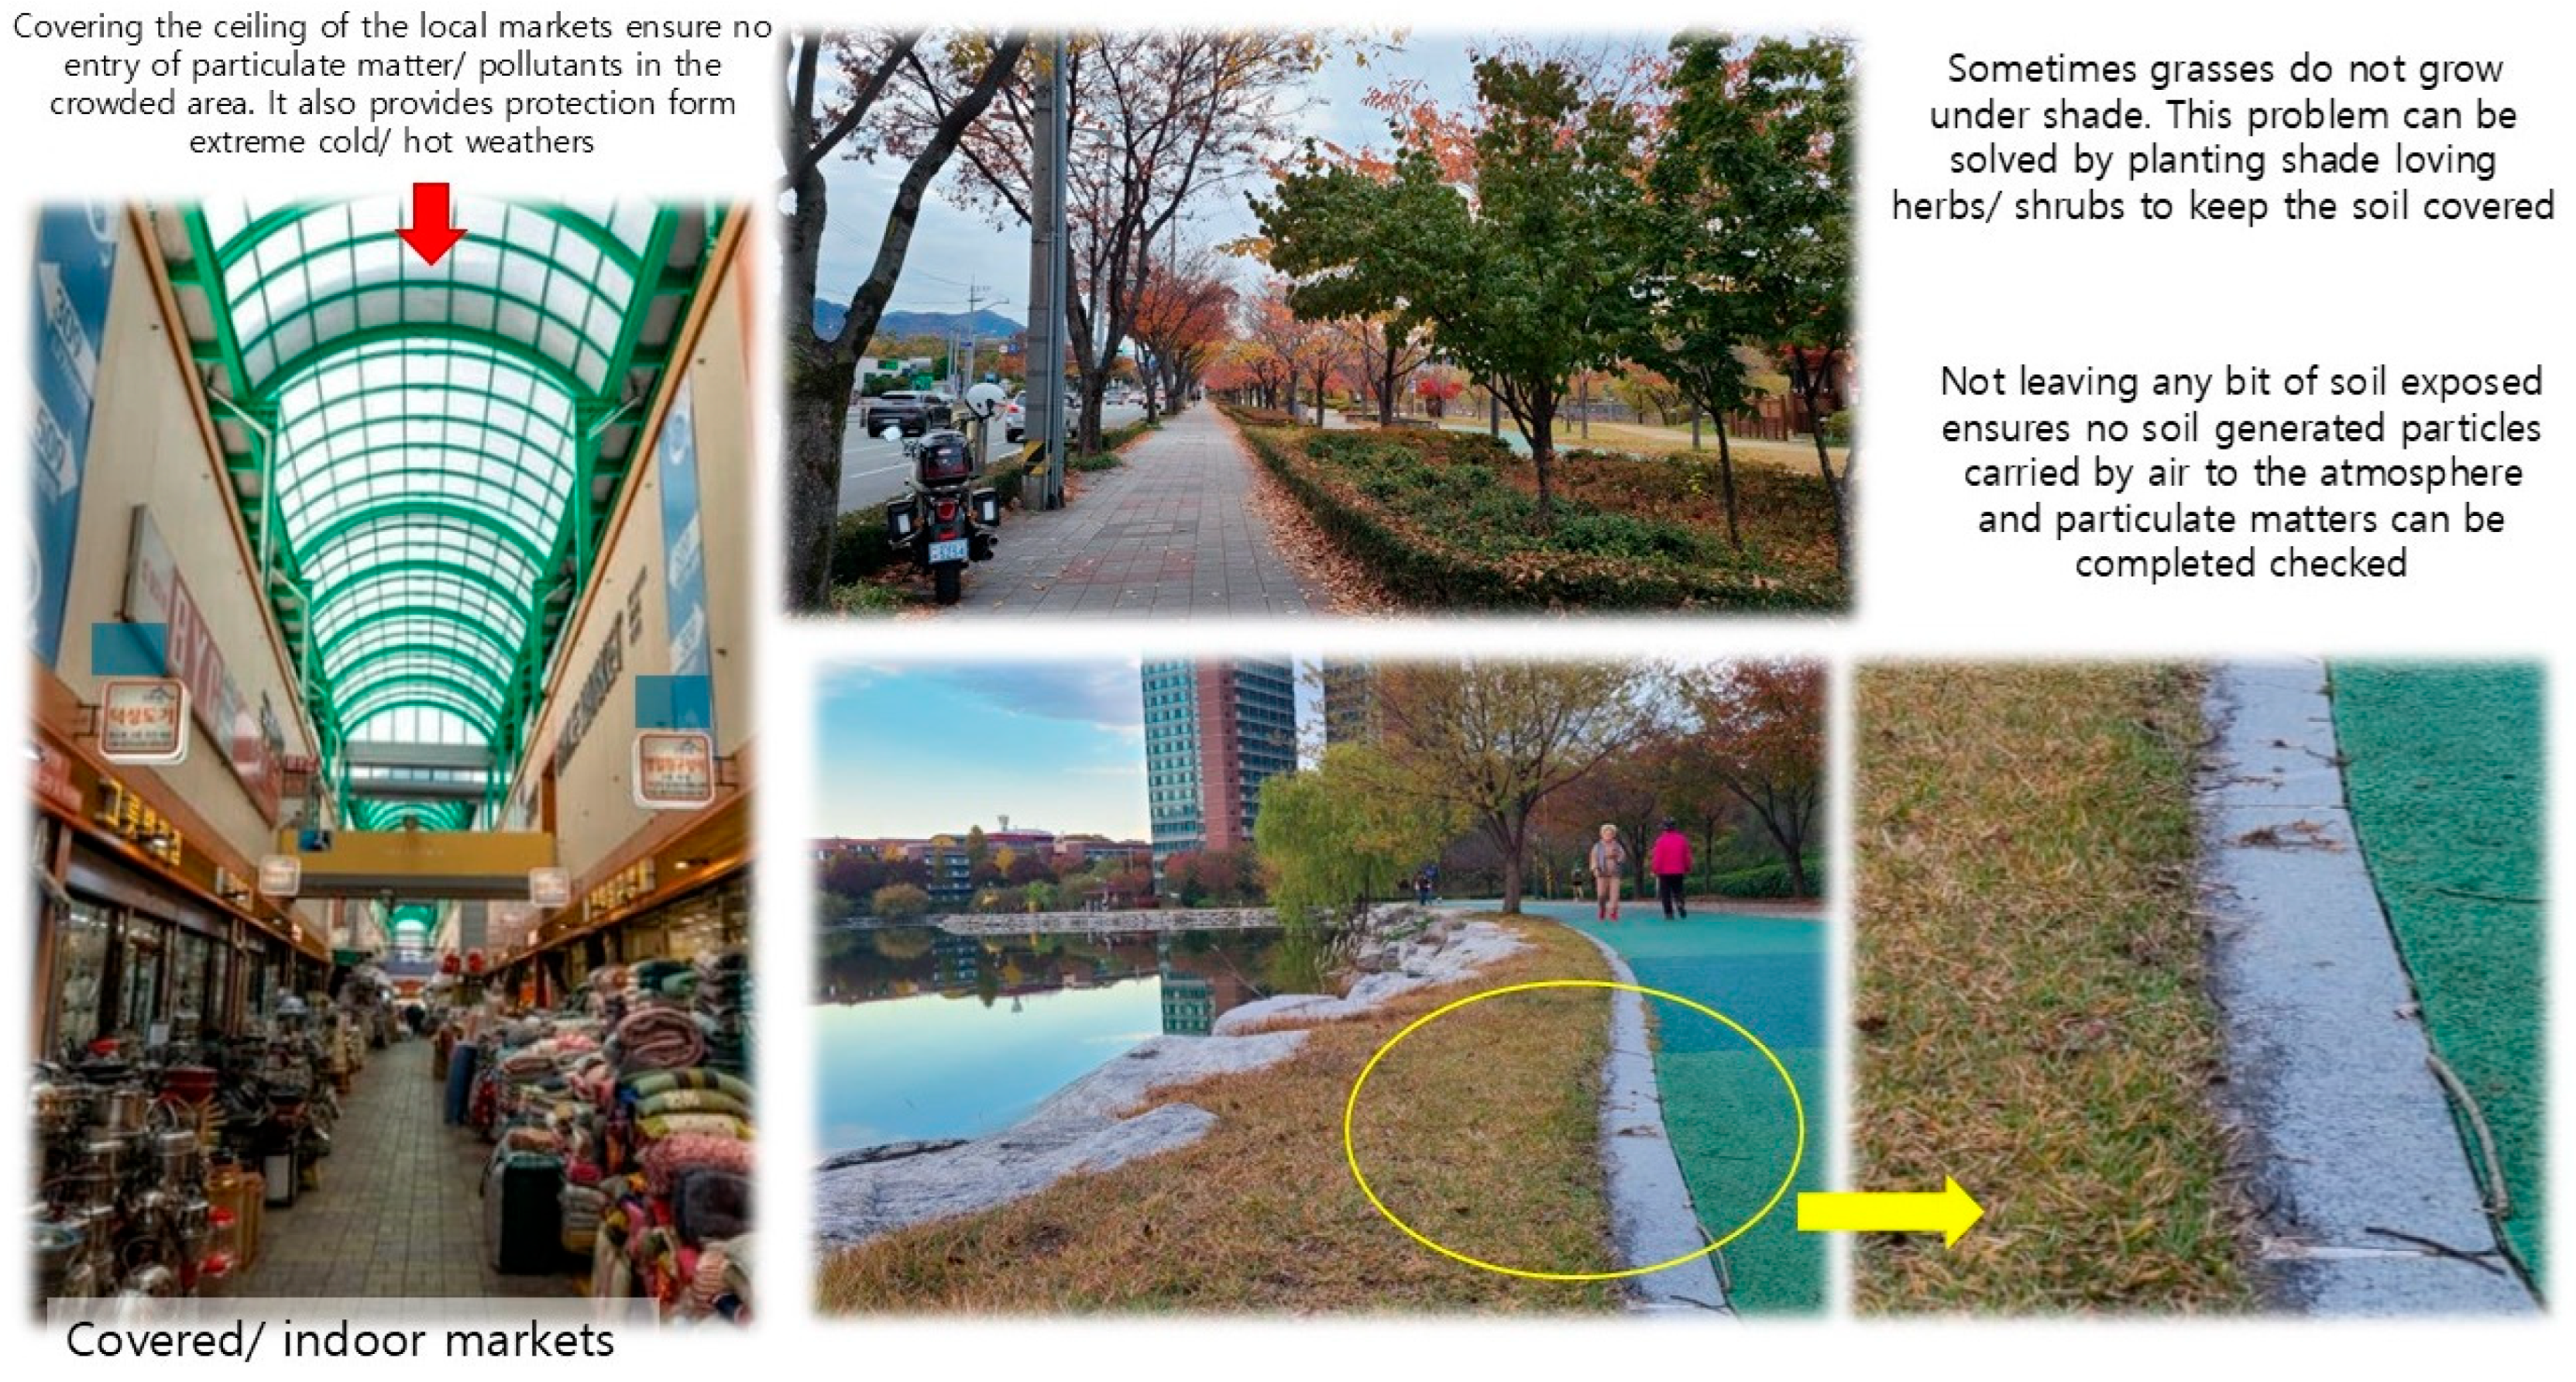
Figure 20.
High-rise buildings and residential towers are habitats of a large population, and protecting these areas from air pollution and PMs is crucial. The structured arrangement illustrated in the image, which helps in protecting the population from PMs, has proven effective. Image created by the author using Canva.com tools.
Figure 20.
High-rise buildings and residential towers are habitats of a large population, and protecting these areas from air pollution and PMs is crucial. The structured arrangement illustrated in the image, which helps in protecting the population from PMs, has proven effective. Image created by the author using Canva.com tools.
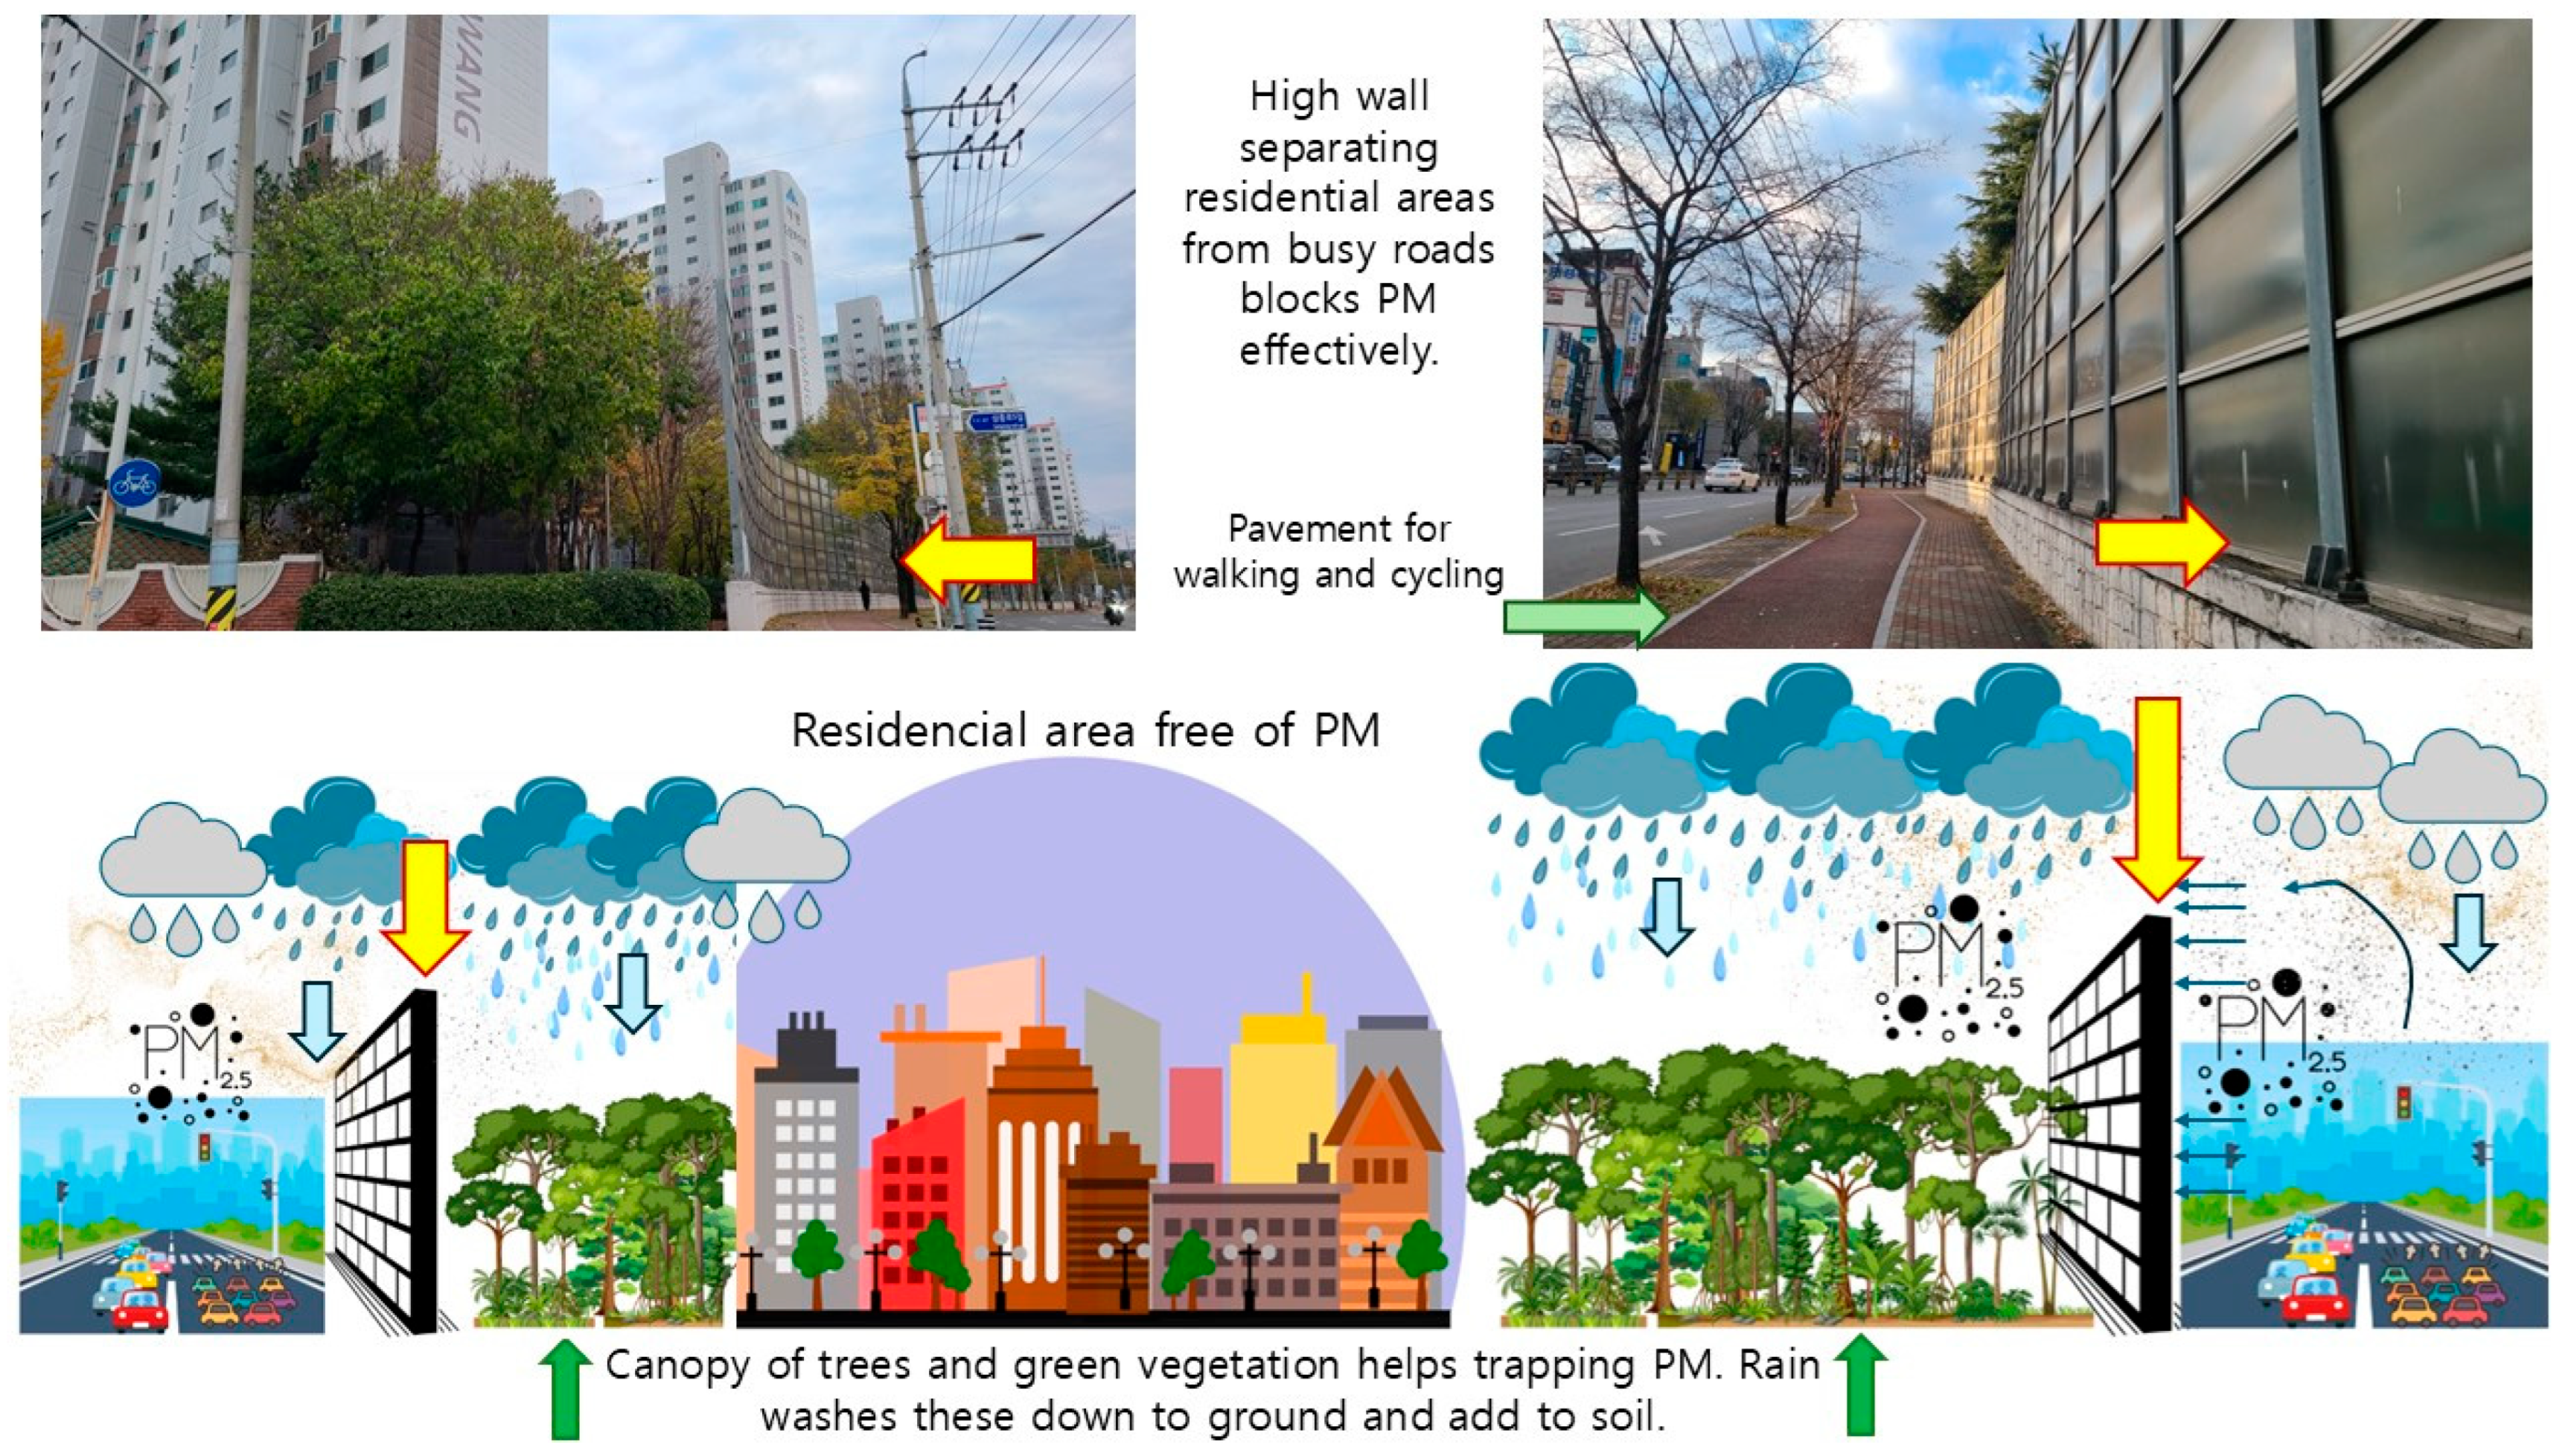

Table 1.
Queries used for searching the data.
| Database | Search Fields | Keywords | Search String | Results |
|---|---|---|---|---|
| WoS | TS | “Air pollution” “air pollutant” “air quality” “Particulate Matter” “PM” |
((“Air pollution” OR “air pollutant” OR “air quality” OR “particulate matter” OR “PM”) AND (“health” OR “human well-being” OR “quality of life”) AND (“cit*” OR “urban) AND (“India*”)) |
1653 |
| “health” “human well-being” “quality of life” | ||||
| “cit*” “urban” “India*” | ||||
| SCOPUS | TITLE-ABS-KEY | “Air pollution” “air pollutant” “air quality” “Particulate Matter” “PM” |
((“Air pollution” OR “air pollutant” OR “air quality” OR “Particulate Matter” OR “PM”) AND (“health” OR “human well-being” OR “quality of life”) AND (“cit*” OR “urban”) AND (“India*”)) |
1654 |
| “health” “human well-being” “quality of life” | ||||
| “cit*” “urban” “India*” |
Table 2.
Inclusion and Exclusion criteria.
| S. No. | Inclusion Criteria | Exclusion Criteria |
|---|---|---|
| 1 | All articles with any type of access | Duplicated Articles |
| 2 | Articles written in the English language | Articles on only one aspect of the study (air pollution or health) |
| 3 | Empirical articles | Articles not on India or Indian cities |
Table 3.
Bibliometric analysis indicators used in the current work.
| Indicator | Metrics | Function | Visualization |
|---|---|---|---|
| Annual scientific publications | Documents | Shows the year-wise publication pattern or annual growth trend of research articles | Line graphs |
| Most relevant sources | Documents | Identifies journals with the highest number of relevant research articles, i.e., journal impact | Cleveland dot plot |
| Most cited articles | Citations | Identifies articles with the maximum number of citations, i.e., article impact | Table |
| Thematic Evolution | Keywords | Shows how the main research theme has evolved, including the emergence of sub-themes and specializations, over distinct time periods | Sankey diagram |
| Trend Topics | Words | Indicates the trend of various topics within the main research theme, current or over a period of time | Cleveland dot plot |
| Keyword analysis | Words | Identifies the relevance of keywords based on how often the frequency of their use, i.e., keyword impact | Word cloud, Tree map |
| Co-occurrence networks | Words | Shows how different keywords are related to each other, i.e., relative significance in terms of connections and appearances | Network graph |
Disclaimer/Publisher’s Note: The statements, opinions and data contained in all publications are solely those of the individual author(s) and contributor(s) and not of MDPI and/or the editor(s). MDPI and/or the editor(s) disclaim responsibility for any injury to people or property resulting from any ideas, methods, instructions or products referred to in the content. |
© 2026 by the authors. Licensee MDPI, Basel, Switzerland. This article is an open access article distributed under the terms and conditions of the Creative Commons Attribution (CC BY) license (http://creativecommons.org/licenses/by/4.0/).
Copyright: This open access article is published under a Creative Commons CC BY 4.0 license, which permit the free download, distribution, and reuse, provided that the author and preprint are cited in any reuse.