

Submitted:
07 July 2026
Posted:
09 July 2026
You are already at the latest version
Abstract
Background: Given the increasing prevalence of dyslipidaemia and multimorbidity in the elderly population, the lack of safety data on combined statin–fenofibrate therapy in this age group represents a critical gap. The post hoc subgroup analysis of the Pose study addresses this issue. Materials and methods: The POSE study was a 3-year, real-world, observational, comparative, non-interventional study conducted in Europe. Patients with mixed dyslipidaemia treated either by a fixed-dose combination of pravastatin 40 mg/fenofibrate 160 mg or a moderate-intensity statin monotherapy were enrolled. Safety outcomes included the occurrence of renal or urinary disorders, musculoskeletal or connective tissue disorders, hepatobiliary disorders, cholelithiasis, thromboembolic events, pancreatitis, worsening diabetes mellitus, elevated blood homocysteine levels, interstitial pneumopathy, phototoxicity, and fatal or non-fatal cardiovascular events. Laboratory parameters related to lipid control and renal, muscular, and hepatic functions were additionally evaluated. The post hoc analysis focuses on the subgroup of patients aged 75 years and older. Results: A total of 458 patients were included in the analysis. The majority had hypertension (79.3%) and diabetes mellitus (55.0%). Over the 3-year study period, there was no difference in incidence rate of safety events between groups (RR = 2.18 [95% CI = 0.99–4.81]). Renal and urinary disorders were more frequent with the combination (5.5% vs 0.8%), whereas musculoskeletal disorders, aggravated diabetes mellitus, and cardiovascular events, showed no significant difference between groups, the 95% CI spanning 1. Globally, there were no significant differences regarding the evolution of hepatic, muscle and renal biological parameters. As expected, the pravastatin/fenofibrate combination achieved a more pronounced TG reduction and a modest increase in HDL-C, whereas the statin group showed more modest changes in these parameters. Conclusions: This real-life observational post hoc subgroup analysis suggests that in patients aged 75 years and older with mixed dyslipidaemia at high or very high CV risk, pravastatin 40 mg/fenofibrate 160 mg is well tolerated and can be used with acceptable long‑term safety. The combination offers additional TG lowering and HDL‑C improvement beyond moderate‑intensity statin monotherapy, without a significant increase in overall safety events over three years. The study confirms the positive benefit / risk balance of the fixed-dose combination of pravastatin 40 mg/fenofibrate 160 mg in this growing population of patients aged 75 years and older.
Keywords:
elderly patients
; dyslipidemia
; pravastatin 40 mg/fenofibrate 160 mg fixed dose combination
; safety
1. Introduction
The global population aged 80 years and older will reach approximately half a billion in the coming years and cardiovascular disease (CVD) remains the leading cause of mortality worldwide [1,2,3]. In Europe, demographic ageing is particularly pronounced: Eurostat projections indicate that the population aged 75–84 years in the EU-27 will increase by 56% between 2019 and 2050, reflecting the rapid transformation of the region’s age structure [4]. Large-scale meta-analyses conducted by the Cholesterol Treatment Trialists’ (CTT) Collaboration have demonstrated the efficacy of statins in major vascular events irrespective of age. However, individuals aged over 75 years have been consistently underrepresented in randomized controlled trials (RCTs) evaluating lipid-lowering therapies and data specifically addressing frail elderly populations remain scarce [1,5]. This underrepresentation is largely attributable to the frequent exclusion of older patients from clinical trials due to multiple comorbidities and the widespread use of polymedications. As a result, uncertainty persists regarding both the magnitude of cardiovascular (CV) benefit and the safety profile of statin therapy in advanced age. Beyond their proven efficacy, the use of statins in older adults raises concerns related to potential adverse effects and an increased risk of drug–drug interactions, reflecting the complex medication regimens commonly prescribed to this population. In the context of ageing and increased vulnerability to chronic conditions, particularly CVD, optimal management of dyslipidaemia in older individuals is of paramount importance. Elderly patients frequently present with multiple coexisting conditions, including hypertension, diabetes mellitus (DM), and chronic kidney disease, which complicate the therapeutic management of dyslipidaemia. Moreover, age-related alterations in lipid metabolism, characterized by elevated low-density lipoprotein cholesterol (LDL-C) and triglyceride (TG) levels, along with reduced high-density lipoprotein cholesterol (HDL-C) result in a distinct lipid profile that warrants tailored clinical attention. In this sense, the combination of statin therapy with a fibrate is supported by a strong mechanistic rationale, particularly in patients with mixed dyslipidaemia. Regarding the use of fibrates, fenofibrate was investigated in the FIELD trial. Herein, the use of fenofibrate demonstrated a significant reduction in overall CV complications among patients with type 2 DM. Although the treatment did not significantly reduce the primary outcome of major coronary events, it did demonstrate a reduction in non-fatal myocardial infarctions and a reduction in coronary revascularisations [6]. Subsequently, the ACCORD-Lipid trial assessed the addition of fenofibrate to simvastatin, showing no overall CV benefit, but suggesting a potential benefit in the predefined subgroup with atherogenic dyslipidaemia, defined by elevated triglycerides and low HDL-C levels [7]. Notably, elderly participants represented only a small proportion of both trials and concerns remain regarding renal and hepatic safety, particularly when fenofibrate is used in combination with statin therapy [8]. Given the increasing prevalence of dyslipidaemia and multimorbidity in the elderly population, the lack of safety data on combined statin–fenofibrate therapy in this age group represents a critical gap. To address this issue, this study presents a post hoc subgroup analysis of the Pose study [9], a randomized trial comparing the combination of pravastatin and fenofibrate to moderate-intensity statins monotherapy, with a three-year follow-up, focusing on patients aged 75 years and older, to evaluate both efficacy and safety outcomes in this underrepresented population.
2. Materials and Methods
This observational, real-world, multicenter, open-label, comparative cohort study was carried out in three European countries; Greece, Spain, and Portugal, between 2016 and 2022. Depending on the timing of patient enrolment, the study design included both retrospective and prospective components. A representative group of physicians, including general practitioners, cardiologists, internists, and endocrinologists, either hospital-based or in private practice, who regularly prescribed treatments for dyslipidaemia, were responsible for selecting the participating patients. The clinical trial was conducted in accordance with good pharmacovigilance and clinical practices. The study protocol received approval from the Pharmacovigilance Risk Assessment Committee, as well as from the relevant competent authorities and ethics committees in each of the participating countries. The study was registered in the HMA-EMA RWD catalogues (EUPAS 13661).
Patients were eligible if they had been prescribed, or were planning to be prescribed, either a fixed-dose combination of pravastatin 40 mg/fenofibrate 160 mg (Pravafenix®, Laboratoires SMB SA, Belgium) or a moderate-intensity statin. Moderate-intensity statins were defined in accordance with the 2019 ESC/EAS guidelines [10] as therapies expected to reduce LDL-C levels by approximately 30% to <50%, including: atorvastatin 10 mg, lovastatin 40 mg, pravastatin 40 mg, simvastatin 20–40 mg, fluvastatin 40–80 mg, and rosuvastatin 5–10 mg. Patients were randomized in a 1:1 ratio, and treatments were administered according to the indication in each country. Follow-up was conducted according to routine clinical practice over a period of three years. Laboratory tests were performed by local laboratories.
The primary objective was to document the incidence of safety endpoints associated with the fixed-dose combination of pravastatin 40 mg and fenofibrate 160 mg, as well as with moderate-intensity statin monotherapy. The composite safety endpoint was defined as the proportion of patients experiencing at least one of the following adverse events: renal or urinary disorders, musculoskeletal or connective tissue disorders, hepatobiliary disorders, cholelithiasis, thromboembolic events, pancreatitis, worsening of DM, increased blood homocysteine levels, interstitial pneumopathy, or phototoxic reactions.
The secondary objective was to assess safety by evaluating the incidence of fatal and non-fatal CV events. Additionally, laboratory parameters related to dyslipidaemia management, as well as renal, muscular, and hepatic function, were monitored.
The present post hoc analysis focuses on the subgroup of patients aged 75 years and older. Patients were eligible for enrolment if they were currently receiving or were expected to receive at the time of inclusion, either moderate-intensity statin monotherapy or a combination of pravastatin 40 mg and fenofibrate 160 mg, for up to 12 months prior to entering the study. Patients were excluded if they were involved in other clinical trials, were taking additional lipid-lowering therapies involving fibrates, or if their medical records were not accessible at the start of study treatment.
In this real-life study, baseline clinical and safety data were obtained either retrospectively from patient medical records or directly at the time of inclusion using an electronic data capture questionnaire. Upon inclusion, eligibility was confirmed, and information on demographics, medical history, dyslipidaemia, and CVD was collected. Cardiovascular risk was assessed using the Systematic Coronary Risk Evaluation (SCORE) chart, adapted from 2019 ESC/EAS guidelines [10], in the respect of statins and fenofibrate contra-indications (i.e., exclusion of patients with impaired renal function or familial monogenic hypercholesterolemia). Following enrolment, data on clinical characteristics, dyslipidaemia treatment, concomitant medications, laboratory parameters, and adverse events were collected prospectively during annual follow-up visits for up to three years or until the end of study treatment, whichever came first.
The sample size was determined to evaluate the hazard ratio for the composite safety endpoints in real-world clinical practice over a 3-year follow-up. Based on existing literature, it was anticipated that 1-5% of patients would experience one of the safety endpoints [7,11,12,13,14]. The present post hoc subgroup analysis was restricted to patients aged 75 years and older, and therefore the sample size was determined by the number of elderly patients included in the parent study (n= 458). Consequently, the subgroup analysis is exploratory and may have limited power to detect differences in rare outcomes. Incidence rates for safety and CV events were estimated along with their 95% confidence intervals (CIs). Absolute incidence rates were calculated based on the number of patients experiencing at least one event during follow-up and reported by treatment group. Statistical differences between treatment groups were assessed using relative risks (RRs) with corresponding 95% CIs. A lack of statistical significance was concluded when the 95% CI of the RR included 1. In addition, hazard ratios (HRs) for safety events were estimated using Cox proportional hazards regression to account for time-to-event data. Continuous variables were expressed as mean values with 95% CIs and standard deviations (SDs), while categorical variables were presented as counts and percentages. All analyses were performed on the full analysis set using SAS software.
3. Results
A total of 458 patients with a documented baseline visit and a signed informed consent constituted the full safety analysis set, out of which 189 were treated with pravastatin 40 mg/fenofibrate 160 mg combination and 269 were treated with a moderate-intensity statin monotherapy. At the end of the 3-year follow-up period, 81.2% of the overall patients completed the study; 77.8% patients from the pravastatin 40 mg/fenofibrate 160 mg combination group and 83.6% from the statin monotherapy group (Figure 1).
Treatment adherence was comparable between both treatment groups, with 11.1% of treatment change or discontinuation over the 3-year follow-up period in the fixed pravastatin 40 mg/fenofibrate 160 mg combination group and 8.2% in the statin group. Overall, the patient baseline characteristics were well-balanced between groups (Table 1). The mean age of the patients was 79.7 ± 3.8 years. More than half of the patients (57.4%) had a sedentary lifestyle and 7.2% were chronic smokers. The vast majority (79.3%) had hypertension and 55.0% had DM. Overall, 31.0% of patients had established CVD, reflecting a secondary-prevention population, and 96.3% of the patients were classified as at high/very high CV risk level (97.9% in pravastatin 40 mg/fenofibrate 160 mg combination group and 95.1% in the statin group).
3.1. Incidence of Main Safety Events
Over the 3-year study period, the incidence rate of safety events with its 95% CI spanning 1, suggest there are no significant differences between groups (RR = 2.18 [95% CI = 0.99–4.81]). Notably, most events occurred during the first year of follow-up. In the fixed pravastatin 40 mg/fenofibrate 160 mg combination group, the absolute risk (AR) of the safety profile decreased from 4.9% at Year 1 follow-up to 3.7% at Year 2 and continued to fall to 1.3% by the Year 3 follow-up. Similarly, in the statin group, the AR of the safety profile decreased from 2.3% at the Year 1 follow-up to 2.0% at Year 2 and further declined to 0.9% by the Year 3 follow-up (Table 2). Across the 3-year follow-up, the composite safety incidence decreased in both treatment arms. The cumulative absolute risk was 9.3% with the fixed pravastatin 40 mg/fenofibrate 160 mg combination and 4.9% with statin monotherapy (RR 2.18; 95% CI 0.99–4.81). Notably, renal and urinary disorders were more frequent with the combination (5.5% vs 0.8%; adjusted RR 6.47; 95% CI 1.42–29.48), whereas other safety categories, including musculoskeletal disorders, aggravated DM, and CV events, showed no significant between-group differences, the 95% CI spanning 1. Other safety events had either a very low global incidence (AR < 0.005 for thromboembolic events) or had a single event (cholelithiasis and hepatobiliary disorder) or even zero events (pancreatitis, blood homocysteine increase, interstitial pneumopathy and phototoxicity).
3.2. Incidence of CV Events
The global incidence of CV events collected was low (n= 8 events). The AR of fatal or non-fatal CV events over the cumulative three-year period was 0.022 (n= 4 events) in the pravastatin 40 mg/fenofibrate 160 mg combination group and 0.015 (n= 4 events) in the statin group. Over the 3-year study period, the RR for fatal and non-fatal CV events were 1.0, with a 95% confidence interval spanning 1 (0.36–5.67), indicating no significant differences between the two treatment arms—though interpretation is limited by the small number of events. In the fixed pravastatin 40 mg/fenofibrate 160 mg combination arm, the AR of fatal or non-fatal CV events declined from 0.011 (n= 2) at Year 1 to 0.000 (n= 0) at Year 3. In contrast, in the statin arm, the absolute risk increased from 0.004 (n= 1) at Year 1 to 0.009 (n= 2) at Year 3 (Table 2).
3.3. Lipids and Other Laboratory Parameters Outcome
The levels of total cholesterol, LDL-C and TG decreased steadily in both groups from baseline to the 3-year follow-up (Table 3). In addition, HDL-C levels increased in both groups. Specifically, in the combination group, the mean TG levels decreased from 2.7 ± 1.3 mmol/L at baseline to 1.5 ± 0.5 mmol/L after 3 years. In parallel, the mean HDL-C level increased from 1.2 ± 0.3 mmol/L at baseline to 1.3 ± 0.3 mmol/L after 3 years. Whereas, in the statin group, the mean TG level decreased from 1.5 ± 0.7 to 1.3 ± 0.4 mmol/L, and HDL-C remained stable at 1.3 ± 0.3 mmol/L. Laboratory safety parameters remained generally stable over the 3-year follow-up in both treatment groups. Changes in creatine phosphokinase, liver enzymes (AST and ALT), and creatinine clearance were small and of similar magnitude between groups, with no apparent signal of increased muscle, hepatic, or renal toxicity associated with the pravastatin/fenofibrate combination (Table 4).
4. Discussion
This real-life, observational post-hoc analysis of the Pose [Papadopoulos et al., 2024] study suggests that, in patients aged 75 years and older with mixed dyslipidaemia and predominantly high or very high CV risk, long-term treatment with the fixed pravastatin 40 mg/fenofibrate 160 mg combination is well tolerated. As anticipated, the pravastatin/fenofibrate combination produced a greater reduction in TG and a modest increase in HDL-C, compared with statin monotherapy, with the greatest benefit observed in patients with elevated baseline triglyceride concentrations. In contrast, patients receiving statin monotherapy experienced only modest changes in these lipid parameters. Overall, safety event rates were of the same magnitude as those observed with moderate-intensity statin monotherapy over a 3-year follow-up. Most safety events occurred during the first year and declined thereafter in both groups, supporting acceptable long-term tolerability once treatment is established. Key safety considerations for fibrate–statin combination therapy primarily involve potential renal, hepatic, and muscle-related adverse events. This post-hoc analysis specifically focused on patients aged 75 years and older confirms the data from the ACCORD-Lipid trial [7], with no new safety signals. The low overall incidence of safety events over three years was comparable with the incidence of moderate-intensity statin monotherapy. Over the 3-year follow-up, the musculoskeletal safety profile of pravastatin 40 mg/fenofibrate 160 mg was reassuring, with low rates of muscle-related events in both groups (2.2% vs 1.5%) and no statistically significant differences between them. Importantly, no cases of rhabdomyolysis occurred in the combination group, despite the advanced age and frequent multimorbidity of the participants. Renal and urinary events, mainly related to creatinine elevations, were found to have low absolute event rates (5.5% vs 0.8%), although reported more often in the combination group over 3 years. Nevertheless, these were consistent with the established renal safety profile of fibrates, suggesting that these effects may be clinically manageable in older patients. Notably, in the ACCORD-Lipid trial [7] and consistent with the FIELD study [15], fenofibrate treatment slowed progression of diabetic microvascular disease including retinopathy and nephropathy despite an early, sustained but reversible rise in serum creatinine. The PROSPER trial [16], which evaluated pravastatin 40 mg versus placebo in nearly 20,000 adults aged 70–82 years, clearly demonstrated that statin therapy reduces the risk of coronary disease in elderly individuals, even over a relatively short 3-year period. However, the PROSPER study [16] evaluated only statin monotherapy, leaving unanswered the question of fenofibrate-pravastatin combination therapy in this age group. The ACCORD-Lipid [7] and FIELD [15] studies confirmed the benefit of adding fenofibrate to statin therapy. However, these trials were not designed to specifically evaluate older patients. In a large nationwide cohort study conducted by Ku et al. in 2024 [17], which included 114,920 patients treated with either fenofibrate plus a statin or statin monotherapy and followed for a median of 7.6 years, the authors found that, among adults with type 2 DM who had been on statin therapy for more than one year, adding fenofibrate was associated with a reduced risk of peripheral vascular complications in older patients. Notably, the benefits of fenofibrate were more pronounced in older patients (age ≥ 65 years). The risk of acute kidney injury, rhabdomyolysis, or hospitalization for these events showed no significant difference between the two groups. In this analysis, the findings differ from previous reports as this focus specifically on patients aged 75 years and older, detailing their baseline risk factors (lipids, blood pressure, glucose) and the high prevalence of concomitant therapies, thus capturing the profile of a particularly fragile elderly population treated with the fixed-dose pravastatin/fenofibrate combination. In line with prior fibrate-statin trials conducted [PROSPER, ACCORD, FIELD, CTT], this study did not show a clear difference in the incidence of fatal or non-fatal CV events (2.2% for pravastatin/fenofibrate combination and 1.5% for statin monotherapy) between groups over three years. The absolute number of CV events was low (4 events in each group). However, the confidence intervals were wide, so the study was not powered to detect modest differences in this cohort. Nevertheless, the absence of an excess of CV events, combined with the observed lipid improvements and acceptable safety profile, suggests that pravastatin/fenofibrate combination can be considered a safe option when additional TG lowering and HDL-C improvement is desired beyond what is achieved with a moderate-intensity statin alone.
A major strength of this post-hoc sub-analysis is its specific focus on adults aged 75 years and older, an age group rarely represented in randomized lipid-lowering trials but frequently affected by complex dyslipidaemia, DM, and polypharmacy. Moreover, the high prevalence of hypertension, DM, and established CVD within the cohort mirrors real-world clinical practice and reinforces the external validity of the findings for elderly patients at high CV risk. However, several limitations must be acknowledged. As an observational study, the analysis is inherently subject to potential residual confounding. Although the distribution of the propensity score in the overall cohort suggested no major imbalances between treatment groups, this assessment was not specifically repeated within the ≥75-year subgroup. Additionally, the pravastatin 40 mg/fenofibrate 160 mg combination group included a slightly higher proportion of women (62.4%) compared with the statin group (52.0%), a difference likely explained by the advanced mean age of the cohort (approximately 80 years) and the longer life expectancy of women [18]. There was a higher prevalence of two major CV risk factors in the pravastatin 40 mg/fenofibrate 160 mg combination group —arterial hypertension (82.0% vs 77.3%) and DM (62.4% vs 49.8%)— a pattern consistent with the mixed dyslipidaemia phenotype and the age-related risk burden characteristic of this subpopulation. However, the modest overall sample size and the low number of events, particularly for CV outcomes, limit the precision of the estimated risks. Furthermore, as most participants were recruited in Southern European countries, the generalizability of these findings to other healthcare systems and ethnic populations may be constrained.
5. Conclusions
This real-life observational post hoc subgroup analysis suggests that in patients aged 75 years and older with mixed dyslipidaemia at high or very high CV risk, pravastatin 40 mg/fenofibrate 160 mg is well tolerated and can be used with acceptable long-term safety. The combination offers additional TG lowering and modest HDL-C improvement beyond moderate-intensity statin monotherapy, without a demonstrable increase in overall CV events over three years. The study confirms the positive benefit / risk balance of combining pravastatin 40 mg and fenofibrate 160 mg in this growing population of patients aged 75 years and older with mixed dyslipidaemia and high CV risk.
Author Contributions
SDN.and SDS. contributed in the study conception and design and wrote the manuscript. All authors have read and agreed to the published version of the manuscript.
Funding
The study was financed by Laboratoires SMB SA.
Institutional Review Board Statement
The study was conducted in accordance with the Declaration of Helsinki, and approved by the Pharmacovigilance Risk Assessment Committee, as well as from the relevant competent authorities and ethics committees in each of the participating countries. The study was registered in the HMA-EMA RWD catalogues (EUPAS 13661).
Informed Consent Statement
Informed consent was obtained from all subjects involved in the study.
Data Availability Statement
Data supporting reported results can be found, in the HMA-EMA RWD catalogues (EUPAS 13661).
Conflicts of Interest
Sophie De Niet, Monte Coffiner, and Stéphanie Da Silva are employees of Laboratoires SMB SA.
References
- Baratta, F.; Moscucci, F.; Lospinuso, I.; Cocomello, N.; Colantoni, A.; Di Costanzo, A.; et al. Lipid-lowering therapy and cardiovascular prevention in elderly. Drugs 2025, 85, 801–812. [Google Scholar] [CrossRef]
- Weverling-Rijnsburger, A.W.; Blauw, G.J.; Lagaay, A.M.; Knook, D.L.; Meinders, A.E.; Westendorp, R.G. Total cholesterol and risk of mortality in the oldest old. Lancet 1997, 350, 1119–23. [Google Scholar] [CrossRef]
- Schatz, I.J.; Masaki, K.; Yano, K.; Chen, R.; Rodriguez, B.L.; Curb, J.D. Cholesterol and all-cause mortality in elderly people fromthe Honolulu Heart Program: a cohort study. Lancet 2001, 358, 351–55. [Google Scholar] [CrossRef] [PubMed]
- Naghavi, M.; Kyu, H. H.; Aalipour, M. A.; Aalruz, H.; Ababneh, H. S.; Abafita, B. J.; Al Homsi, A. Global burden of 292 causes of death in 204 countries and territories and 660 subnational locations, 1990–2023: a systematic analysis for the Global Burden of Disease Study 2023. The Lancet 2025, 406(10513), 1811–1872. [Google Scholar] [CrossRef]
- Cholesterol Treatment Trialists’ Collaboration. Efficacy and safety of statin therapy in older people: a meta-analysis of individual participant data from 28 randomised controlled trials. Lancet 2019, 393(10170), 407–415. [Google Scholar] [CrossRef]
- Keech, A.; Simes, R.J.; Barter, P.; et al. Effects of long-term fenofibrate therapy on cardiovascular events in 9795 people with type 2 diabetes mellitus (the FIELD study): randomised controlled trial. Lancet 2005, 366(9500), 1849–1861. [Google Scholar] [CrossRef] [PubMed]
- Accord Study Group; Ginsberg, H.N.; Elam, M.B.; Lovato, L.C.; Crouse, J.R., 3rd; Leiter, L.A.; et al. Effects of combination lipid therapy in type 2 diabetes mellitus. N Engl. J. Med. 2010, 362(17), 1563–74. [Google Scholar] [CrossRef] [PubMed]
- Sobukawa, M.; et al. Safety of combined statin and fibrate therapy: nationwide cohort study. JAMA Netw. Open 2024, 7. [Google Scholar]
- Papadopoulos, N.; Arvaniti, E.; Angelopoulos, T.; Tziomalos, K.; Tembra, M.S.; Diaz, J.L.; et al. A European observational 3-year cohort comparative study on the safety of the fixed-dose combination pravastatin 40 mg/fenofibrate 160 mg vs. statin alone in real clinical practice. Pharmacoepidemiol Drug Saf. 2024, 33(11). [Google Scholar] [CrossRef] [PubMed]
- ESC/EAS Task Force. 2019 ESC/EAS guidelines for the management of dyslipidaemias: lipid modification to reduce cardiovascular risk. Atherosclerosis 2019, 290, 140–205. [Google Scholar] [CrossRef] [PubMed]
- Farnier, M.; Ducobu, J.; Bryniarski, L. Efficacy and safety of adding fenofibrate 160 mg in high-risk patients with mixed hyperlipidemia not controlled by pravastatin 40 mg monotherapy. Am. J. Cardiol. 2010, 106(6), 787–92. [Google Scholar] [CrossRef] [PubMed]
- Farnier, M.; Ducobu, J.; Bryniarski, L. Long-term safety and efficacy of fenofibrate/pravastatin combination therapy in high-risk patients with mixed hyperlipidemia not controlled by pravastatin monotherapy. Curr. Med. Res. Opin. 2011, 27(11), 2165–73. [Google Scholar] [CrossRef] [PubMed]
- Farnier, M.; Marcereuil, D.; De Niet, S.; Ducobu, J.; Steinmetz, A.; Retterstol, K.; et al. Safety of a fixed-dose combination of fenofibrate/pravastatin 160 mg/40 mg in patients with mixed hyperlipidaemia: a pooled analysis from a database of clinical trials. Clin. Drug Investig. 2012, 32(4), 281–91. [Google Scholar] [CrossRef] [PubMed]
- Cholib. Assessmnt Report fenofibrate / simvestatin Contract No.: No. EMEA/H/C/002559/0000. Eur. Med. Agency 2013. [Google Scholar]
- Chew, E.Y.; Ambrosius, W.T.; Davis, M.D.; et al. ACCORD Study Group; ACCORD Eye Study Group. Effects of medical therapies on retinopathy progression in type 2 diabetes. N Engl. J. Med. 2010, 363(3), 233–244. [Google Scholar] [PubMed]
- Shepherd, J.; Blauw, G.J.; Murphy, M.B.; Bollen, E.L.E.M.; Buckley, B.M.; Cobbe, S.M.; et al. Pravastatin in elderly individuals at risk of vascular disease (PROSPER): a randomised controlled trial. Lancet 2002, 360(9346), 1623–1630. [Google Scholar] [CrossRef] [PubMed]
- Ku, E.; Lin, F.; et al. Fenofibrate use and risk of peripheral artery disease complications in type 2 diabetes: a nationwide cohort study. Cardiovasc Diabetol. 2024, 23(1), 58. [Google Scholar] [CrossRef]
- Muszynska-Spielauer, M.; Di Giulio, P.; Minagawa, Y.; Di Lego, V.; Luy, M.; et al. Why do women live longer than men, but spend more time in poor health? A decomposition analysis of the gender gap in unhealthy life years across Europe. Eur. J. Epidemiol. 2026. [Google Scholar] [CrossRef] [PubMed]
Figure 1.
Study flow chart.
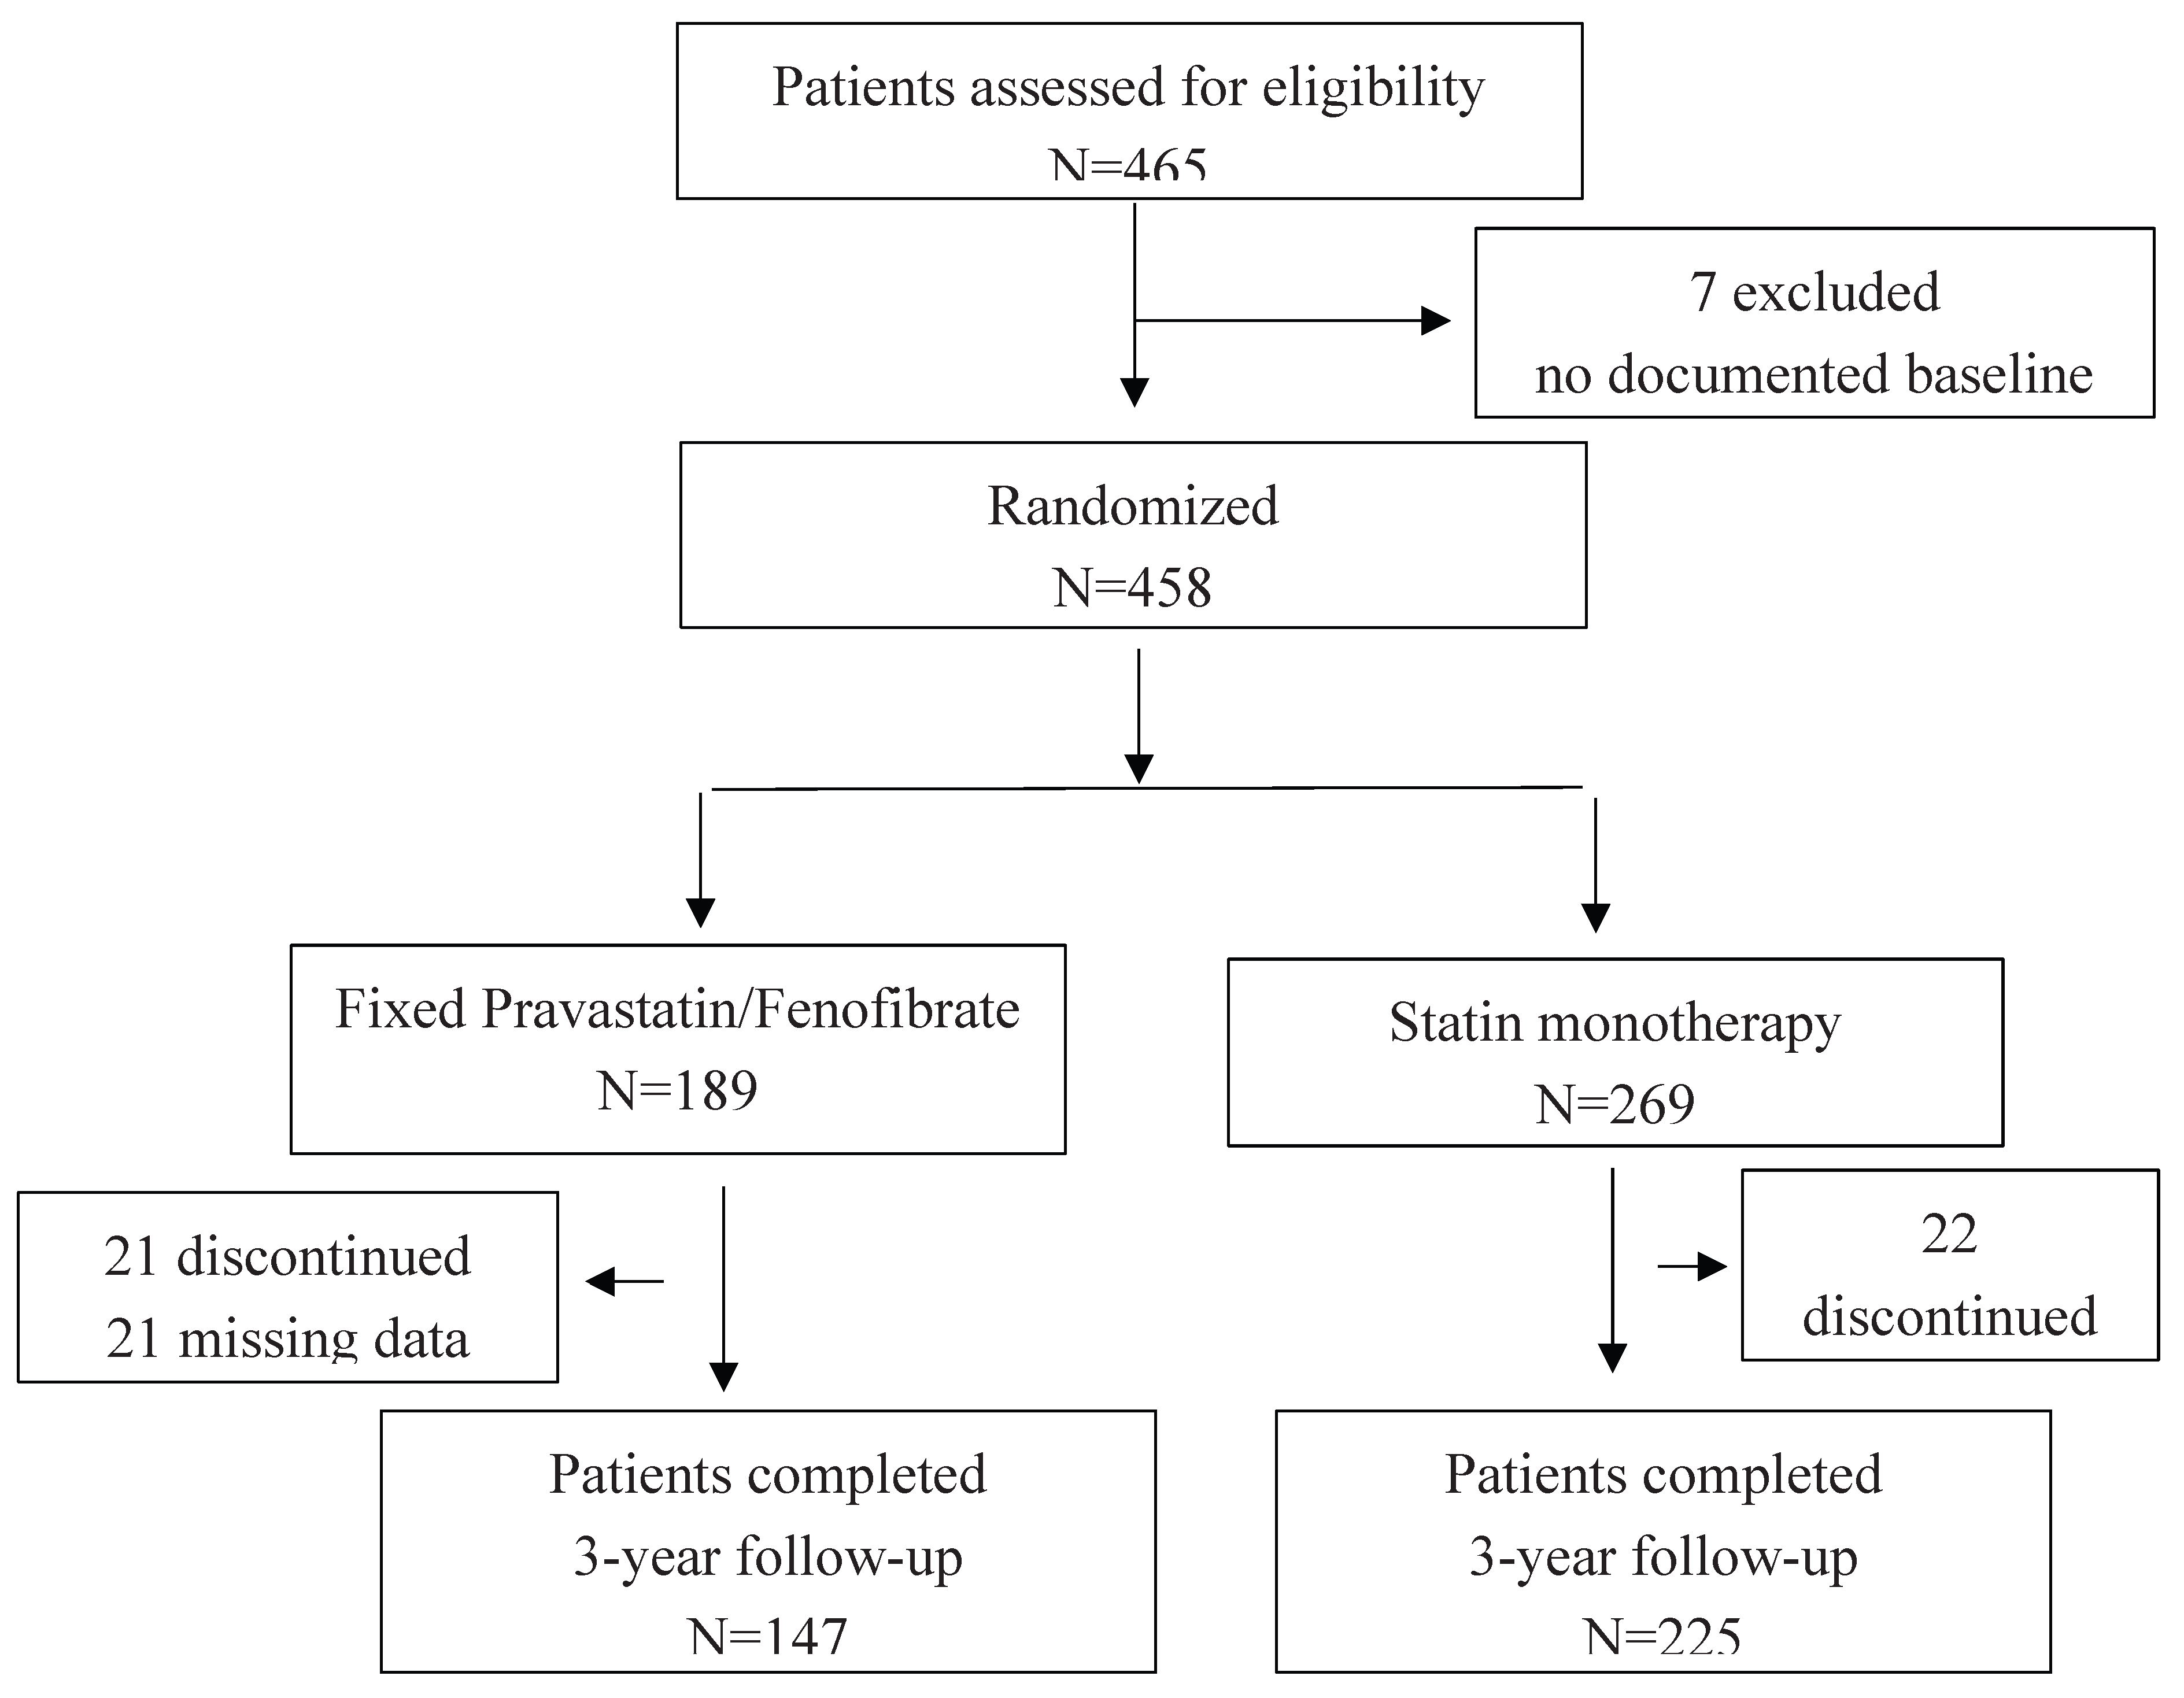

Table 1.
Summary of baseline characteristics.
| Characteristic | Pravastatin 40/ Fenofibrate 160 |
Moderate-intensity Statin |
|
|---|---|---|---|
| (N= 189) | (N= 269) | ||
| Age (years) | Mean (SD) | 79.76 (3.7) | 79.71 (3.8) |
| Male | n (%) | 71 (37.6) | 129 (48.0) |
| Female | n (%) | 118 (62.4) | 140 (52.0) |
| Smokers | n (%) | 11 (5.8) | 22 (8.2) |
| Sedentary | n (%) | 114 (60.3) | 149 (55.4) |
| Weight (kg) | n (SD) | 77.3 (12.14) | 76.1 (12.37) |
| Waist circumference (cm) | n (SD) | 97.3 (12.46) | 96.7 (11.92) |
| Diabetes mellitus | n (%) | 118 (62.4) | 134 (49.8) |
| Very high CV risk | n (%) | 72 (38.1) | 123 (45.7) |
| High CV risk | n (%) | 113 (59.8) | 133 (49.4) |
| Moderate CV risk | n (%) | 2 (1.1) | 8 (3.0) |
| Low CV risk | n (%) | NA | NA |
| Hypertension | n (%) | 155 (82.0) | 208 (77.3) |
| Presence of established CVD | n (%) | 52 (27.5) | 90 (33.5) |
N: number of patients; n: number of events; SD: standard deviation; CV: cardiovascular; NA: not applicable; CVD: cardiovascular disease.
Table 2.
Absolute and relative risk of most frequently safety events at Year 1, Year 2 and Year 3 follow-up.
Table 2.
Absolute and relative risk of most frequently safety events at Year 1, Year 2 and Year 3 follow-up.
| Absolute Riska | Relative Riskb (95% CI) |
|||
|---|---|---|---|---|
| Variable | Timeline | Pravastatin/Fenofibrate (N=183) | Statin (N=263) | |
| Composite safety profile | Year 1 | 0.049 | 0.023 | |
| Year 2 | 0.037 | 0.020 | ||
| Year 3 | 0.013 | 0.009 | ||
| Over 3 years | 0.093 | 0.049 | 2.178 (0.987; 4.810) | |
| Musculoskeletal and Connective Tissue Disorder | Year 1 | 0.005 | 0.008 | |
| Year 2 | 0.018 | 0.008 | ||
| Year 3 | 0.000 | 0.000 | ||
| Over 3 years | 0.022 | 0.015 | 1.437 (0.364;5.673) | |
| Renal and Urinary Disorder | Year 1 | 0.027 | 0.004 | |
| Year 2 | 0.025 | 0.004 | ||
| Year 3 | 0.007 | 0.000 | ||
| Over 3 years | 0.055 | 0.008 | 6.465 (1.418; 29.475) | |
| Diabetes Mellitus Aggravated | Year 1 | 0.011 | 0.011 | |
| Year 2 | 0.006 | 0.008 | ||
| Year 3 | 0.007 | 0.009 | ||
| Over 3 years | 0.022 | 0.027 | 1.024 (0.285; 3.688) | |
| Thromboembolic Events | Year 1 | 0.000 | 0.004 | |
| Year 2 | 0.006 | 0.000 | ||
| Year 3 | 0.000 | 0.000 | ||
| Over 3 years | 0.005 | 0.004 | NEc | |
| CV events | Year 1 | 0.011 | 0.004 | |
| Year 2 | 0.012 | 0.004 | ||
| Year 3 | 0.000 | 0.009 | ||
| Over 3 years | 0.022 | 0.015 | 1 (0.364;5.673) | |
CI: confidence interval; CV: cardiovascular; NE: Not Estimable. a Rate of new patients with at least one occurrence of considered event. If a patient had experienced more than once the same adverse event, the patient was counted only for the first time he/she had experienced that adverse event. b Relative rate ratio evaluated by a Log-Binomial regression model with safety event as the response and quintiles of the propensity score and treatment group as predictors. Each safety event was a dummy variable equal to ‘1’ if the patient had experienced at least one occurrence during the follow-up period, otherwise the dummy variable was equal to ‘0’. Adjusted rate ratio for the composite safety profile, renal and urinary disorder and thromboembolic events. Unadjusted rate ratio for musculoskeletal and connective tissue disorder and CV events. C Not estimable due to the low number of events.
Table 3.
Summary of lipid laboratory parameters at baseline and Year 3 Follow-up.
| Laboratory Parameter (Unit) |
Visit | Pravastatin/fenofibrate (N=189) |
Statin (N=269) |
|
|---|---|---|---|---|
| Total cholesterol (mmol/L) | Baseline | n | 185 | 265 |
| Mean (SD) | 5.465 (1.256) | 5.434 (1.257) | ||
| Median | 5.482 | 5.482 | ||
| Min, Max | 3.31, 9.41 | 2.61, 8.25 | ||
| Year 3 | n | 98 | 164 | |
| Mean (SD) | 4.151 (0.632) | 4.277 (0.881) | ||
| Median | 4.073 | 4.189 | ||
| Min, Max | 2.51, 5.95 | 2.69, 7.76 | ||
| Change | % | -24.04 | -21.29 | |
| HDL-C (mmol/L) | Baseline | n | 179 | 259 |
| Mean (SD) | 1.187 (0.282) | 1.313 (0.480) | ||
| Median | 1.164 | 1.231 | ||
| Min, Max | 0.59, 2.17 | 0.41, 5.09 | ||
| Year 3 | n | 94 | 157 | |
| Mean (SD) | 1.265 (0.273) | 1.318 (0.299) | ||
| Median | 1.241 | 1.267 | ||
| Min, Max | 0.65, 1.99 | 0.72, 2.20 | ||
| Change | % | 26.5 | 0.38 | |
| LDL-C (mmol/L) | Baseline | n | 177 | 259 |
| Mean (SD) | 3.012 (1.039) | 3.235 (1.108) | ||
| Median | 2.974 | 3.207 | ||
| Min, Max | 0.64, 6.49 | 0.93, 6.26 | ||
| Year 3 | n | 96 | 161 | |
| Mean (SD) | 2.199 (0.596) | 2.310 (0.720) | ||
| Median | 2.177 | 2.250 | ||
| Min, Max | 0.96, 3.65 | 0.91, 5.07 | ||
| Change | % | -29.99 | -28.59 | |
| Triglycerides (mmol/L) | Baseline | n | 184 | 262 |
| Mean (SD) | 2.702 (1.311) | 1.513 (0.689) | ||
| Median | 2.703 | 1.409 | ||
| Min, Max | 0.62, 8.07 | 0.13, 6.12 | ||
| Year 3 | n | 98 | 163 | |
| Mean (SD) | 1.504 (0.539) | 1.351 (0.427) | ||
| Median | 1.403 | 1.288 | ||
| Min, Max | 0.59, 3.74 | 0.47, 2.71 | ||
| Change | % | -44.34 | -10.71 | |
HDL-C: high-density lipoprotein cholesterol; LDL-C: low-density lipoprotein cholesterol; N: number of patients; n: number of events; SD: standard deviation.
Table 4.
Summary of biological laboratory parameters at baseline and following a 3 follow-up.
| Laboratory Parameter (Unit) |
Visit |
Pravastatin/fenofibrate (N=189) |
Statin (N=269) |
|
|---|---|---|---|---|
| Creatine phosphokinase (ukat/L) | Baseline | n | 118 | 151 |
| Mean (SD) | 1.657 (1.357) | 1.665 (1.256) | ||
| Median | 1.328 | 1.319 | ||
| Min, Max | 0.28, 11.62 | 0.18, 9.34 | ||
| Year 3 | n | 57 | 80 | |
| Mean (SD) | 1.622 (0.846) | 1.813 (1.030) | ||
| Median | 1.486 | 1.553 | ||
| Min, Max | 0.45, 4.91 | 0.32, 5.63 | ||
| Change | % | -2.11 | 8.89 | |
| Aspartate aminotransferase (U/L) | Baseline | n | 147 | 214 |
| Mean (SD) | 19.766 (6.789) | 21.409 (8.222) | ||
| Median | 19.000 | 20.000 | ||
| Min, Max | 8.00, 42.00 | 7.00, 69.00 | ||
| Year 3 | n | 82 | 137 | |
| Mean (SD) | 21.896 (6.765) | 22.227 (8.417) | ||
| Median | 21.500 | 21.000 | ||
| Min, Max | 9.00, 39.00 | 9.00, 81.00 | ||
| Change | % | 10.78 | 9.93 | |
| Alanine aminotransferase (U/L) | Baseline | n | 150 | 216 |
| Mean (SD) | 20.299 (11.763) | 20.220 (12.279) | ||
| Median | 18.000 | 17.000 | ||
| Min, Max | 6.00, 80.00 | 3.00, 90.00 | ||
| Year 3 | n | 84 | 137 | |
| Mean (SD) | 22.926 (10.394) | 24.053 (14.394) | ||
| Median | 21.500 | 21.000 | ||
| Min, Max | 7.00, 69.00 | 6.00, 95.00 | ||
| Change | % | 12.94 | 18.96 | |
|
Creatinine clearance (ml/s) |
Baseline | n | 44 | 46 |
| Mean (SD) | 1.081 (0.320) | 1.084 (0.386) | ||
| Median | 1.092 | 1.013 | ||
| Min, Max | 0.38, 1.89 | 0.30, 2.04 | ||
| Year 3 | n | 24 | 35 | |
| Mean (SD) | 0.971 (0.277) | 0.978 (0.249) | ||
| Median | 1.016 | 0.969 | ||
| Min, Max | 0.22, 1.48 | 0.33, 1.54 | ||
| Change | % | -10.18 | -9.78 | |
| Serum Creatinine (umol/L) | Baseline | n | 165 | 223 |
| Mean (SD) | 88.087 (23.501) | 126.531 (592.702) | ||
| Median | 85.748 | 80.444 | ||
| Min, Max | 45.97, 185.64 | 42.43, 8928.40 | ||
| Year 3 | n | 83 | 135 | |
| Mean (SD) | 95.712 (40.458) | 89.625 (25.815) | ||
| Median | 89.284 | 85.748 | ||
| Min, Max | 60.11, 420.78 | 44.20, 256.36 | ||
| Change | % | 8.66 | -29.17 | |
N: number of patients; n: number of events; SD: standard deviation.
Disclaimer/Publisher’s Note: The statements, opinions and data contained in all publications are solely those of the individual author(s) and contributor(s) and not of MDPI and/or the editor(s). MDPI and/or the editor(s) disclaim responsibility for any injury to people or property resulting from any ideas, methods, instructions or products referred to in the content. |
© 2026 by the authors. Licensee MDPI, Basel, Switzerland. This article is an open access article distributed under the terms and conditions of the Creative Commons Attribution (CC BY) license (http://creativecommons.org/licenses/by/4.0/).
Copyright: This open access article is published under a Creative Commons CC BY 4.0 license, which permit the free download, distribution, and reuse, provided that the author and preprint are cited in any reuse.


