
Submitted:
08 July 2026
Posted:
09 July 2026
You are already at the latest version
Abstract
Indoor air quality (IAQ) is an important determinant of public health, especially for individuals with multiple chemical sensitivity (MCS). Fragrances emit volatile organic compounds (VOCs) that can contribute to poor IAQ. Although scent-free policies are being widely implemented as an accommodation for those impacted by fragrances, their ability to improve IAQ has not been examined. This study assessed if scent-free policies can improve IAQ across Canadian offices. IAQ testing was conducted between December 2023 and June 2024 in 34 offices (17 with scent-free policies, 17 without). Sampling included total VOCs (TVOCs), top 35 VOCs, formaldehyde, CO, CO₂, PM₂.₅, temperature, and relative humidity. Analyses controlled for room size, occupancy, and ventilation rate using Mann-Whitney U tests and generalized linear models. Regression analysis revealed significantly higher VOC concentrations in spaces without scent-free policies, including acetaldehyde (OR = 2.2, p <.05), acetone (OR = 7.7, p <.001), toluene (OR = 3.4, p <0.05), m-/p-xylene (OR = 6.9, p <.001), o-Xylene (OR = 15.5, p <.001), and TVOCs (ORs = 3.9, p<.001). This study provides findings that support scent-free policies as a low-cost source control strategy to help lower VOC concentrations and improve IAQ accessibility.
Keywords:
indoor air quality
; accessibility
; multiple chemical sensitivity
; VOCs
; scent-free policies
; disability inclusion
; public health policy
1. Introduction
Indoor air quality (IAQ) is an important determinant of public health, and is now a top five major risk factor for developing chronic non-communicable diseases, such as cardiovascular, respiratory, and neurodegenerative disorders, indicated by the World Health Organization. Considering that individuals spend approximately 90% of their time indoors, including in workplaces, it is crucial to consider the impacts of IAQ on human health and well-being. In fact, exposure to indoor pollutants such as VOCs, particulate matter, CO, and CO₂ has been associated with adverse health impacts, including sensory irritation, exacerbation of asthma and chronic obstructive pulmonary disorder (COPD), migraines, eczema, neurodevelopmental conditions, and multiple chemical sensitivity (MCS) [1,2,3]. Although voluntary IAQ guidelines exist, they are largely unenforced, leaving vulnerable populations at risk [4,5].
Indoor air pollutants are emitted from common sources including building materials, furnishings, cleaning and consumer products, and outdoor infiltration [1,6,7]. Exposures to pollutants such as acetaldehyde, benzene, toluene, xylenes, and formaldehyde have been linked to cancer, adverse pregnancy outcomes, endocrine disruption, respiratory distress, and transgenerational effects, including increased risks of neurodevelopmental and asthmatic conditions in offspring [8,9,10,11,12,13]. Further, indoor air pollution has been shown to impact cognitive function and productivity in workplaces, resulting in a 20% loss in output due to high absenteeism and employee turnover rate [14]. Indeed, there are significant economic losses attributed to poorly managed IAQ.
Importantly, the negative impacts of indoor air pollution are not experienced equally across the population. MCS is a condition of heightened vulnerability to indoor air pollutants, particularly VOCs, and is linked to chronic exposure in indoor environments [15]. Recent Canadian surveillance data suggest that the population affected by MCS may be substantially larger than previously recognized. While an estimated 1.13 million Canadians reported a medical diagnosis of MCS in 2020 [16], preliminary Statistics Canada, Canadian Community Health Survey (CCHS) data from the January–July 2025 collection period indicate that 9.4% of Canadian adults experienced MCS, whereas 2.7% reported having received a diagnosis from a health professional. These findings suggest that a considerably larger population may experience symptoms consistent with MCS than is reflected in diagnosed prevalence estimates alone, and they may not be adequately protected under current exposure guidelines.
Historically, the toxicological principle that “the dose makes the poison” has guided thresholds for IAQ pollutants. However, this framework is being challenged by evidence showing that chronic low-level exposures to indoor air pollutants can produce health effects, especially in vulnerable populations [3,17,18,19]. Miller’s Toxicant-Induced Loss of Tolerance (TILT) model supports this evidence, which highlights that brief, low-dose exposures can trigger long-term hypersensitivity and multi-system impacts in genetically or immunologically predisposed individuals [18,19]. Chronic low-level exposure to VOCs may also contribute to the sensitization of TRPA1 and TRPV1 chemosensory receptors, which play a role in detecting chemical irritants (i.e. formaldehyde, benzene, toluene, xylenes) and triggering sensory irritation and inflammatory responses in the airways [3,20]. Prolonged receptor sensitization can result in amplified physiological responses to subsequent exposures and may contribute to the development or worsening of MCS [3,21]. Because individuals with MCS experience adverse effects at levels that never bothered them previously and do not bother most people [17], the condition may serve as a vigilant indicator for public health and poor IAQ management. Without proper IAQ surveillance, individuals with MCS may experience functional impairment in fragranced or polluted indoor environments, resulting in workplace avoidance or job loss with downstream impacts into socioeconomic status and quality-of-life [3,7,16,22]. Given the additive or synergistic effects of chemicals that may occur in “real life” mixture exposures [23], these findings collectively challenge the validity of traditional exposure threshold models and underscore the need for precautionary IAQ management strategies that better account for receptor sensitization pathways and help protect the population.
Effective IAQ management relies on a combination of source control, ventilation, and spatial design [24,25]. Although ventilation improvements are beneficial, they can be costly [26]. Source control, defined as substituting or eliminating pollutant-emitting materials and consumer products, remains a cost-effective strategy, with reported savings of up to €13,500 per family over 10 years due to reduced energy use from ventilation [27]. Accordingly, fragrance/scent-free policies are being widely adopted to restrict the use of fragranced personal care and cleaning products known to impact individuals with MCS [5,28]. The United Nations Convention on the Rights of Persons with Disabilities (UNCRPD) provides a rights-based framework and protections for persons with disabilities who are affected by environmental barriers, including indoor air pollutants, chemical exposures, and fragrances.. In human rights law, fragrance/scent-free policies are commonly recognized as appropriate accommodations that employers and other duty holders are required to implement and monitor [29].
Despite the growing adoption of fragrance/scent-free policies, to date, no studies have examined their effectiveness related to improving IAQ and accessibility in office environments [28], which can limit understanding of their role to improve occupant health and well-being. For reference, the terms scent-free and fragrance-free are often used interchangeably and lack a standardized definition. To remain consistent, the term scent-free policy will be used throughout this paper. In order to address previous study limitations, the objectives of this paper are to: (1) Compare indoor air concentrations of key IAQ parameters (PM₂.₅, top 35 VOCs, formaldehyde, CO, CO₂, temperature and relative humidity) in office spaces with and without scent-free policies; (2) Evaluate IAQ parameters between office spaces with and without scent-free policies against Canadian guidelines; and (3) Assess the role of scent-free policies in supporting healthier and more accessible indoor office space environments. Evaluating the effectiveness of scent-free policies is important given their potential to improve accessibility, especially since 20.6% of individuals with asthma and 59.4% of individuals with autism spectrum disorder report lost workdays or job loss due to fragrance and IAQ issues [30], highlighting the broader public health, economical, and accessibility implications of IAQ management.
2. Materials and Methods
2.1. Study Design
This study is part of a broader research program, designed to examine indoor accessibility through an integrated approach incorporating IAQ testing, policy assessment, and occupant experiences. The current study employed an observational, exploratory and cross-sectional design to compare IAQ in office spaces with and without scent-free policies.
The study began with the creation of a Pre-Screening Survey (see S1) that assessed office space eligibility for IAQ testing using Qualtrics. Office spaces were excluded if they reported water damage, used wood-burning fireplaces, had air intakes within 50 meters of idling vehicles, operated more than two air handling units, had fewer than 25 regular occupants per week, were under renovation, or were unsafe/inaccessible for testing. These exclusions were developed to minimize confounding factors from outdoor emissions [31], so that the study could focus on indoor pollutant sources. All IAQ assessment procedures were performed according to the United States Environmental Protection Agency (USEPA) protocol for indoor air quality in large office buildings [31] to ensure data consistency and reliability [32].
2.2. Sample and Recruitment
Ethics approval was granted by the Women’s College Hospital [REB# 2023-0030-E] on October 27th, 2023. This study focused on office environments due to their relevance for accessibility and socioeconomic disparities faced due to inaccessible workplaces [15]. Office space recruitment took place between May and October 2023. To ensure geographic and organizational diversity of office spaces, recruitment targeted all Canadian provinces, encompassing spaces located in office buildings, healthcare, and educational institutions. Office spaces were recruited through direct email campaigns, social media (i.e., Facebook, LinkedIn, Twitter), professional networks, and partnerships with organizations promoting scent-free policies. Of the 192 office space managers contacted, 85 (44.3%) responded, while 107 (55.7%) did not, which limited the study sample size.
Interested office space managers were provided with the study information, prior to the start of the sampling. Office space managers of eligible offices provided written consent, and office spaces were then confirmed and categorized as scent-free or non-scent-free based on the pre-screening survey responses. Scent-free status was confirmed through both active policy implementation and verified use of scent-free products, by reviewing answers related to product use lists from the pre-screening survey. Office space managers that reported their space being scent-free, but lacked control over product use were excluded. Non-scent-free status was verified by the reported use of scented products and these spaces using eco products were excluded as well. This yielded a total of 34 office spaces that qualified for sampling, consisting of offices with scent-free policies (n=17) and without policies (n=17), comparable to previous studies of a similar nature [33,34].
After categorization, office managers completed a Building Characteristics Survey, which included information on building activities, geographical location, size and occupancy of the spaces being tested, type of ventilation systems, building age, building materials, recent renovations, and outdoor contamination sources. Sample characteristics of office spaces were stratified by policy groups. Office space characteristics can be found in Appendix A1. Prior to IAQ testing, office managers were instructed to maintain normal operations and cleaning schedules as well as to avoid environmental changes specifically for testing purposes to ensure representative data. To maintain confidentiality, office spaces were de-identified (identified only by an office ID number in all analysis).
2.3. Air Quality Sampling
IAQ sampling took place between December 2023 to June 2024. Testing was conducted by a certified commissioned environmental service company using consistent standardized procedures for sample collection and laboratory delivery across all office sites. IAQ parameters included TVOCs, top 35 individual VOCs, formaldehyde, PM₂.₅, CO, and CO₂, as well as continuous measurements of temperature and relative humidity. The parameters were chosen based on their relevance to testing IAQ in office environments, and their ability to significantly impact health, comfort, and access to the indoor environments [10,34,35]. VOC sampling included two indoor top 35 individual VOC and TVOC measurements per space for accuracy [32], using 100-minute multi-sorbent tubes, along with one outdoor sample. Formaldehyde was sampled once per office using DNPH passive samplers. PM₂.₅, CO, CO₂, temperature, and relative humidity were collected using calibrated equipment (3M® EVM-7 Air Quality Monitor; RAE Systems® ppbRAE 3000).
Indoor samplers were set up in representative locations, including meeting rooms, offices, and washrooms, during working hours (9am-5pm), for one workday. All measurements were taken at 1.2 m above the floor, positioned centrally to reflect the human breathing zone (approximately 4–5 feet), consistent with WHO recommendations [36]. The outdoor samples were excluded from data analysis due to the indoor research focus, and VOC concentrations being under the detection limit (<1). A separate research paper will discuss these results. While a total of 34 offices with three spaces each (meeting rooms, offices, washrooms) were initially eligible (102 spaces); two offices were later excluded due to incomplete testing, resulting in 32 office spaces for data analysis (96 spaces)..
Recognizing the absence of formal decontamination protocols on scent-free practices for technicians, and the potential for personal VOCs and fragrances to confound results due to the sensitivity of modern testing equipment [37,38,39], the Environmental Health Association of Québec (ASEQ-EHAQ) provided additional training, specifically on decontamination practices of personal VOCs prior to IAQ testing, discussed in a companion paper [40]. Technicians reviewed scent-free educational materials, followed a scent-free checklist, and used only pre-approved, scent-free hygiene products for fourteen days before testing. On the day of testing, technicians wore Tyvek suits to further limit contamination of personal VOCs during sample collections.
2.4. Laboratory Analysis
Samples were analyzed by a lab accredited by the American Industrial Hygiene Association (AIHA). VOC analysis (Reference Method – ISO 16017) for this study was conducted using thermal desorption in conjunction with gas chromatography-mass spectrometry. The sampling tubes used were the standard 3 1/2 in. long stainless-steel tubes with brass caps and Teflon ferrules on both ends. The tubes were packed with carbon-based adsorbent material. They were thoroughly conditioned using a Markes TC-20 Tube Conditioner, and 2 tubes were randomly selected from a batch of 20 and checked for background levels. If passed, the tubes were prepared and shipped for sample collection. A Perkin Elmer Turbomatrix Model 650 Automated Thermal Desorber interfaced with an Agilent Gas Chromatograph (model 7890A) coupled with an Agilent Mass Spectrometer (model 5975C) was used to analyze the samples. The analytical column for separating targets was a 60-meter DB-624 column. The identification of the eluted peaks was conducted using Wiley Registry 12th Edition and NIST 2020 Mass Spectral Library, the two most comprehensive mass spectral libraries available with over 1 million mass spectra. VOCs were calculated from the same analytical procedure used for individual VOCs and reported as the sum of all detected VOC concentrations within a given sample.
Formaldehyde (Reference Method: OSHA Method 1007) samples were conducted using passive sampling with 2,4-dinitrophenylhydrazine (DNPH) coated filters for passive samplers. During sampling, airborne formaldehyde, when diffused into the sampler, reacted with DNPH to form a stable hydrazone derivative. For analysis, the filter was extracted using acetonitrile as the solvent. Quantitative analysis was performed using an Agilent 1260 Infinity high-performance liquid chromatography (HPLC) system equipped with a UV detector set at a wavelength of 360 nm. The formaldehyde concentrations in the samples were determined based on the calibration curve of analytical standards running along with samples and corrected for recovery using the results from the spiked samples. Field blanks and laboratory blanks were used to monitor contamination. Blanks were processed alongside samples and reviewed for quality control.
2.5. Data analysis
All data was cleaned, coded, and analyzed using SPSS (v.28), and Microsoft Excel. Missing data related to room size and occupancy were addressed using regression-based and mean substitution methods to preserve data integrity and reduce bias [41]. When averaging the two top 35 VOC samples, some compounds were below the detection limit (<1); in these cases, the detection limit (1) was substituted for the missing value [42].
2.5.1. Ventilation rates
Ventilation rates were calculated for each office space using the steady state equation, as discussed in ASHRAE Standard 62-1989 [43,44]:
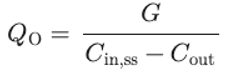
Qo is the outdoor air ventilation rate per person, G is the CO2 generation rate per person, Cin,ss is the steady-state indoor CO2 concentration, and Cout is the outdoor CO2 concentration. The CO₂ rate generation per person (L/s•person) was calculated specific to office environments [44]. Outdoor CO2 concentrations were estimated based on building location. Offices in high-traffic metropolitan areas were assigned a CO2 level of 550 ppm, while those in non-high-traffic metropolitan areas were assigned 400 ppm [45,46].
2.5.2. Comparing IAQ Pollutants Between Office Spaces with and Without the Presence of Scent-Free Policies
Descriptive statistics were calculated for the indoor air pollutants, including CO₂, CO, formaldehyde, PM₂.₅, and top 35 individual VOCs. To identify commonly detected VOCs in offices with and without scent-free policies, frequency analysis was conducted. Compounds detected in at least 50% or more of sampled spaces and/or present on hazardous lists (EPA Hazardous Air Pollutants, IARC Monographs, Health Canada’s Residential Indoor Air Quality Guidelines) were retained for further analysis to capture potentially distinct VOCs associated with scent-free and non-scent-free office spaces, as well as masking potentially prevalent VOCs in one policy group in analysis [47,48].
Commonly detected VOCs were selected for statistical comparison between office spaces with and without scent-free policies. Concentration data were not normally distributed, thus non-parametric Mann–Whitney U Tests were used to compare indoor air pollutant concentrations between office spaces with and without scent-free policies [49]. To account for potential confounding variables, analyses were stratified by office size and occupancy, factors known to influence indoor pollutant concentrations [50]. Office spaces were classified as ‘small’ or ‘large’ using the median size (sq ft) of each space type, ensuring equal observations across both policy groups [51].
2.5.3. Evaluating IAQ Parameters Against Health-based Canadian IAQ Guidelines
To evaluate how IAQ in sampled buildings relative to established standards, measured pollutant concentrations were compared against thresholds from Health Canada’s Residential Indoor Air Quality Guidelines and ASHRAE Standard 62.1 [4]. It is important to note that Health Canada’s thresholds are based on 24-hour exposure limits, while this study employed 5-hour sampling durations. Health exposure limits set by Health Canada represent the concentration of indoor air contaminants below which health effects are unlikely to occur [4]. TVOCs are not included in Health Canada’s guidelines; the WELL Standard was used as a reference [52]. Daily average concentrations were calculated for TVOCs, CO₂, CO, PM₂.₅, temperature, relative humidity, formaldehyde, acetaldehyde, acrolein, benzene, toluene, and m-/p-xylene, parameters included in Health Canada guidelines [4]. All spaces for each office (meeting rooms, offices, washrooms) were combined for a total average. Each of the 32 office spaces were then assessed for compliance with Health Canada’s guideline values and grouped by policy presence to calculate the number and percentage of offices exceeding thresholds in each policy group, if any.
2.5.4. Assessing the Role of Scent-Free Policies in Supporting Healthier and More Accessible Indoor Environments
Generalized linear regression models (GLMs) were used to examine the association between potentially hazardous pollutant concentrations and the presence of a scent-free policy, while controlling for potential confounders including room size, occupancy, and ventilation rates [50]. VOC concentrations (dependent variable) were positively right-skewed, thus statistical analyses used a gamma distribution and log-link function in SPSS, models used for non-normally distributed data [53,54]. Regression coefficients were exponentiated to estimate the proportional change in VOC concentrations associated with scent-free policies. Multicollinearity was tested using the variance inflation factor (VIF) and variables with VIFs>5 were dropped from the multivariable model [55]. Moreover, the models were assessed to ensure residuals were normally distributed and there were no influential observations.
Individual VOCs included in the regression models were selected based on their relevance to human health effects and compounds associated with TRP-receptor sensitization (e.g., acetaldehyde, acetone, xylenes, toluene) [3,20,56,57]. These VOCs are included in the Health Canada’s Residential Indoor Air Quality Guidelines [4]. Many of these compounds are also found on the International Fragrance Association (IFRA) Transparency List, indicating their use as fragrance ingredients in consumer products (e.g., acetaldehyde, acetone, m-/p-xylenes) [58], which would be relevant to scent-free policies. Additionally, these compounds have been found to cause respiratory irritation, allergies, headaches, exacerbation of breathing conditions, neurological effects, and potential long-term toxicity [3,10,59,60,61], underscoring their importance for inclusion. TVOCs were also included, with evidence linking high TVOC levels to increased discomfort and reported symptoms in workplaces [35]. Pollutants such as CO₂, CO, and PM₂.₅ were excluded from regression analyses because their concentrations are less directly influenced by fragranced product use and preliminary analyses demonstrated poor model fit for these variables. Model fit was assessed using the Pearson goodness-of-fit test and the Omnibus Test of Model Coefficients as well as McFadden’s R2.
2.6. Data verification
All statistical analyses were verified by a second researcher using RStudio. Replication of the analyses produced consistent findings across statistical models, supporting the reliability and reproducibility of the results.
3. Results
3.1. Descriptives of Common Pollutants Found in Office Spaces with and Without the Presence of Scent-Free Policies
The most common VOCs found in testing and hazardous air pollutants and respective descriptive statistics can be found in S2. Overall, similar VOCs were detected across both policy groups. However, certain compounds, such as alpha-pinene and heptane, were more common in office spaces with scent-free policies. Benzene was more commonly detected in office spaces with no scent-free policies, than in spaces with policies. 2-Methyl-1-propene, (Isobutylene), and 2-methylhexane were also detected commonly in office spaces with no policies. Ethanol was the most abundant VOC detected in the dataset across both policy groups.
Across all space types (meeting rooms, offices, and washrooms), concentrations of several hazardous VOCs were consistently higher in buildings without scent-free policies, such as acetone, toluene, benzene, m-/p-xylene, acetaldehyde, and n-hexane which showed higher mean concentrations, broader ranges, and greater variability in spaces with no policies. While median concentrations were sometimes similar in spaces with policies for certain VOCs, spaces with no policies exhibited frequent extreme values often exceeding spaces with policies by a factor of 5 to 10. TVOCs were also 2-3x higher on average in non-policy environments, with a mean of 1,229.8 µg/m³ in office spaces versus 489.3 µg/m³ in scent-free office spaces. CO₂ and PM2.5 exhibited higher mean concentrations in scent-free office spaces, while mean CO and formaldehyde concentrations were slightly higher in spaces with no scent-free policies. A number of hazardous air pollutants were detected, but less frequently, across sampled office spaces. These included acrolein, carbon tetrachloride, chloroform, ethylbenzene, ethylene glycol, o-xylene, phenol, styrene, tetrachloroethylene, and trichloroethylene.
Figure 1 illustrates VOC concentrations that were significantly different across office spaces, which consistently show higher concentrations in office areas without scent-free policies. The results are as follows; isobutylene in offices (p =0.005), acetone in offices (p = 0.003) and washrooms (p = 0.001), butane across all office areas (meeting rooms (p = 0.004), offices (p = 0.004) and washrooms (p = 0.002), 2-methylbutane (butane, 2-methyl) in washrooms (p = 0.020), 2-methylhexane (hexane, 2-methyl) in washrooms (p = 0.033), pentane in washrooms (p = 0.009), CFC-11 in washrooms (p = 0.038), and ethylbenzene in offices (p = 0.033).
3.2. Comparing Pollutant Concentrations Between Spaces with and without Scent-free policies
There were 25 statistically significant differences found between VOC concentrations in office spaces with and without scent-free policies, when stratified by space size and occupancy (See S3).
Acetone levels were consistently elevated in non-policy spaces, with significant differences observed in offices (large space, p < 0.05) and washrooms across large spaces, high and low-occupancy conditions (p < 0.05). Butane showed the strongest and most consistent differences, with significantly higher concentrations in non-policy meeting rooms (small space, p < 0.001; high occupancy, p < 0.01), offices (large and small space, p < 0.05 and p < 0.01), and washrooms (large, small, and high-occupancy, all p < 0.05). Isobutylene was significantly elevated in non-policy, small meeting rooms (p < 0.05), while cyclopentane was higher in non-policy high occupancy meeting rooms (p < 0.05). n-Hexane and pentane were significantly higher in non-policy small washrooms (p < 0.05), with pentane also elevated in non-policy, small washrooms (p < 0.05) and highly occupied washrooms and offices (both p < 0.05). TVOCs were significantly elevated in highly occupied meeting rooms and offices (both p < 0.05).
Overall, non-policy office spaces showed consistently higher mean ranks across multiple VOCs, particularly in highly occupied and smaller office spaces. Figure 2, Figure 3, Figure 4, Figure 5, Figure 6, Figure 7 and Figure 8 below illustrate statistically significant differences in concentrations between policy groups.
3.3. Evaluating Buildings Against Health-Based Canadian IAQ Guidelines
Exceedances of IAQ guidelines varied across pollutants and policy groups. Office spaces without scent-free policies had greater TVOC guideline exceedances (56.2%) compared to office spaces with policies (31.2%). Acrolein guideline exceedances were also more frequent in non-policy spaces (28.6%) than in scent-free spaces (20.0%). Benzene, for which no safe exposure threshold exists, was detected in both policy groups, at a higher frequency in office spaces with no scent-free policies. In contrast, no exceedances were observed for CO, toluene, or acetaldehyde in either group, while formaldehyde exceeded guideline values in one non-policy office space. Temperature and relative humidity frequently fell outside recommended ranges in both policy groups. See Table 1 for detailed calculations.
3.3.1. Evaluating TVOCs Against Well Standard
Figure 9 illustrates average TVOC concentrations across meeting rooms, offices, and washrooms, during IAQ testing. The Well Standard Guideline was used for advised daily concentration limits, which accounts for vulnerable populations impacted by poor IAQ, such as elderly, people with disabilities (i.e. cognitive, respiratory, dermal), and pregnant women. Office spaces with scent-free policies mostly stayed below or at the Well Standard guideline, while office spaces without scent-free policies exceeded the guideline of 500 µg/m³.
3.3.2. Evaluating Common Office Space VOCs Listed on Health Canada Guidelines
Figure 10 illustrates VOCs listed by Health Canada’s Residential Indoor Air Quality Guidelines, and their daily concentration (short-term) limits [4]. These included toluene (2,300 µg/m³), xylene mixtures, isopropyl alcohol, formaldehyde (50 µg/m³), benzene, acetone, acetaldehyde (280 µg/m³), and 2–butanone (Methyl Ethyl Ketone). All concentrations were based off 24-hour exposure limits (short-term), apart from xylene mixtures, isopropyl alcohol, benzene, acetone, and 2–butanone (Methyl Ethyl Ketone), where limits were over a long-term period, thus could not be compared in this study. In reference to the short-term limits, on average, offices stayed under the given daily thresholds, with no office space exceeding these limits. Offices with no scent-free policies exceeded spaces with scent-free policies in terms of average 24-hour concertation of all the respective VOCs, as much as up to 70%.
3.4. Associations Between Potentially Hazardous VOCs and Scent-Free Policy Implementation
GLMs were used to examine associations between VOC concentrations and the presence of scent-free policies (Table 2). While some covariates (room size and occupancy) were moderately correlated, sensitivity analyses showed that removing one variable did not change model outcomes. Therefore, the final model retained the variables based on theoretical relevance. All models displayed a moderate to strong fit. See S4 for stratified statistical results.
GLMs revealed that the absence of a policy was consistently associated with significantly higher concentrations across all measured compounds compared with spaces with a policy in place. Specifically, office spaces with no scent-free policies were associated with significantly higher concentrations of acetaldehyde (OR 2.17, 95% CI 1.05–4.38, p<0.05), acetone (OR 7.72, 95% CI 4.07–14.51, p<0.001), toluene (OR 3.40, 95% CI 1.17–9.90, p<0.05), TVOCs (OR 3.90, 95% CI 2.02–7.40, p<0.001), o-xylene (OR 15.49, 95% CI 5.64–44.31, p<0.001), and m-/p-xylenes (OR 6.86, 95% CI 2.39–19.04, p<0.001), when compared to office spaces with policies. Higher rates of ventilations were also associated with significantly reduced concentrations of acetone (OR 0.60, 95% CI 0.40-0.92, p<0.05) as well as TVOCs (OR 0.60, 95%CI 0.40-0.95, p<0.05).
4. Discussion
Previous literature has not examined the effects of scent-free policies on IAQ, despite their increasing adoption across office, healthcare, and governmental institutions [4,28,62]. This study addresses this gap by comparing IAQ parameters, including top 35 VOCs collection, PM₂.₅, CO, CO₂, and formaldehyde, between office spaces with and without scent-free policies.
Despite differences in policy implementation, office spaces in both policy groups shared several structural and environmental characteristics, including ventilation type, recent renovations, and proximity to outdoor contamination sources. These similarities may have reduced the likelihood that observed differences in VOC concentrations were driven solely by environmental confounders, thereby strengthening the internal validity of the study [63]. However, some differences were observed: scent-free office spaces were generally older and larger and included healthcare and educational settings, whereas non-scent-free buildings were all commercial office settings. Despite this, office spaces residing in educational and healthcare facilities displayed similar VOC profiles.
Office spaces with no scent-free policies generally demonstrated higher ventilation rates, possibly due to younger building ages (mean = 32.9) [64]. However, significant associations between scent-free policy implementation and VOC concentrations remained after controlling for ventilation, suggesting that scent policies may serve as a complementary strategy to reduce VOC exposures. This highlights the potential of scent-free policies as a form of source control, aligning with previous research stating that reducing emissions at their source is an effective and economical approach for IAQ improvement [27,65,66].
4.1. Differences in Pollutant Concentrations between Spaces with and without Scent-free Policies
Hazardous VOCs, including ethylbenzene, toluene, benzene, xylene mixtures, acetaldehyde, and n-hexane, were consistently detected at higher concentrations in office spaces without scent-free policies across median, mean, and distribution ranges. TVOCs were approximately 2-3 times higher in non-policy spaces, suggesting a greater overall chemical burden and more frequent or uncontrolled use of fragranced and solvent-based consumer products [7].
Figure 1 further demonstrated significantly higher concentrations of several VOCs in office spaces without scent-free policies, including isobutylene, acetone, butane, 2-methylbutane, 2-methylhexane, pentane, trichlorofluoromethane (CFC-11), and ethylbenzene across offices, meeting rooms, and washrooms. Notably, ethylbenzene is classified by the International Agency for Research on Cancer as a possible human carcinogen (Group 2B) and has been associated with asthma exacerbation and other respiratory effects [3]. Thus, the significantly lower concentrations in office spaces with scent-free policies suggests reduced exposure and improved protection for vulnerable populations.
Pollutants such as formaldehyde, CO, PM₂.₅, and CO₂ showed relatively similar concentrations across policy groups, likely reflecting sources unrelated to fragranced consumer products [51]. This suggests that while scent-free policies may reduce VOC exposures from fragrances, additional IAQ control strategies are needed to address pollutants originating solely from outdoor infiltration and building materials.
Consistent with prior studies [1,7,68], ethanol was among the most abundant VOC detected in indoor environments, possibly due to the use of hand sanitizers, and alcohol-based consumer products [1]. Terpenes, including limonene and alpha-pinene, were widely detected and generally at higher concentrations in scent-free spaces, likely reflecting emissions from fragranced or “green” commercial products [7,69,70]. Although generally considered low toxicity, terpenes have been associated with migraines and respiratory irritation [71]. They are also highly reactive indoors and can generate secondary pollutants, including formaldehyde, acetaldehyde, and ultrafine particles, through reactions with oxidants [72]. Without awareness of terpene-containing consumer products and their impacts on IAQ, scent-free environments may unknowingly contribute to the formation of secondary pollutants, thereby undermining the protective intent of scent-free policies. These findings highlight the need for improved product transparency, stricter labeling regulations, and the prioritization of verified scent-free, low-emission, and least-toxic products to ensure that scent-free policies effectively protect vulnerable populations from harmful irritants [28].
Despite being phased out since 1987 under the Montreal Protocol due to its ozone-depleting potential [73], CFC-11 was commonly detected across both policy groups and occurred at significantly higher concentrations in office spaces without scent-free policies. Its presence, particularly in office spaces without scent-free policies, where younger building ages were generally demonstrated, may reflect potential gaps in IAQ monitoring and oversight. Although international agreements stopped new production, enforcement has focused on industrial use, and not residual indoor emissions from existing buildings [73]. Potential off-gassing from insulation foams, refrigerant lines, or aging equipment may therefore negatively contribute to outdoor emissions, particularly when ventilated outside [74].
Additionally, benzene, a known human carcinogen with no safe indoor levels [4], was more frequently detected (>50%) in office spaces without scent-free policies. Although benzene is typically associated with outdoor sources such as vehicle exhaust and combustion emissions [36], this study aimed to minimize buildings with indoor or close proximity to sources of high combustion. The higher benzene concentrations observed in non-policy spaces may reflect contributions from outdoor infiltration [36]. However, with outdoor levels below detection limit, outdoor infiltration emerges as an unlikely primary source. Higher indoor concentration may therefore reflect indoor sources such as fragranced consumer and cleaning products, that have recently been reported to emit benzene as a contaminant [75,76,77]. Without IAQ testing or active and enforced preventative measures, pollutants CFC-11 and benzene remain unaddressed, posing both environmental and health risks.
4.2. Evaluation of Current IAQ Guidelines Against Sampled Office Spaces
Generally, pollutant concentrations in the sampled spaces remained within guideline limits, although exceedances were observed across several IAQ parameters. While average CO₂, and CO levels remained within Health Canada guideline thresholds, exceedances occurred in both policy groups. For instance, higher CO₂ concentrations were detected in scent-free offices, suggesting ventilation challenges, potentially due to older building ages of these spaces [78]. Importantly, if CO₂ is not properly managed, this can negatively affect both IAQ and occupant comfort, thereby posing risks to accessibility [35]. Temperature was largely within ASHRAE comfort ranges, but humidity frequently fell below recommendations in both policy groups, a factor known to increase pollutant accumulation and worsen respiratory irritation [79]. Notably, TVOC average concentrations across all office spaces were lower in scent-free spaces compared to non-scent-free spaces. However, exceedances of the WELL Standard limit of 500 µg/m³ occurred in both policy groups, with more frequent exceedances in non-scent-free spaces, higher than a previous study [80]. This is meaningful, as exceeding this threshold poses health risks for vulnerable populations, including older adults, pregnant women, and individuals with chronic conditions [81], thus protective action is recommended.
While Canada provides IAQ guidelines for office environments, these guidelines remain voluntary and unenforced [4]. This was reflected in non-scent-free offices where elevated concentrations of hazardous VOCs, including benzene, xylenes, toluene and acetaldehyde, were detected. Although TVOCs are widely recognized as indicators of chemical burden and occupant discomfort, particularly when concentrations exceed 3000 µg/m³ [82], Health Canada does not currently have TVOC thresholds, leaving many subpopulations at risk [4]. In contrast, Germany’s Umweltbundesamt (UBA) applies precautionary indoor air guideline values that function as actionable thresholds to guide remediation and exposure reduction measures [83]. Applying similar precautionary approaches in Canada could help maintain IAQ at levels that protect vulnerable populations, including individuals with MCS, who may experience adverse effects at low-level chemical exposures [3].
4.3. Increasing Accessibility: Reduction of Potentially Hazardous VOCs with Scent-Free Policies
Bivariate analyses showed significantly higher mean rank concentrations of several VOCs in office spaces without scent-free policies after stratifying for room size and occupancy. Even in smaller or highly occupied spaces, where VOC accumulation can easily increase [78], scent-free policies were associated with lower concentrations of compounds such as acetone, butane, n-hexane, pentane, isobutylene, and TVOCs. Several of these compounds are recognized as irritants, with some, including acetone, shown to activate TRPA1/TRPV1 receptors involved in sensory irritation, neuroinflammation, and chemical sensitization among individuals with MCS [3,20]. VOCs that were shown to have statistically significant higher ranks (acetone, n-hexane, butane, pentane, isobutylene) have been detected in consumer products [84,85,86,87,88], which may help explain the lower VOC concentrations observed in spaces with scent-free policies. However, statistical associations varied across office space types. Variations in ventilation efficiency between these spaces may be contributing to the observed differences in VOC concentrations and statistical associations [78]. To control for this, regression analysis included ventilation rate as a confounding variable. Several pollutants, including formaldehyde, PM₂.₅, CO, and CO₂, showed no significant associations with scent-free policy implementation, suggesting contributions from non-fragrance-related sources such as building materials, furnishings, and outdoor infiltration that may not be fully mitigated through scent-free policies alone [49,82,89].
Regression analyses demonstrated significantly higher concentrations of acetaldehyde, acetone, toluene, m-/p-/o-xylenes, and TVOCs in offices without scent-free policies after controlling for confounders, such as occupancy, room size, and ventilation rate. Such VOCs have been associated with allergies, respiratory irritation, and pulmonary conditions, including asthma and COPD [90,91,92,93,94,95]. Exposure to compounds such as xylenes, acetaldehyde, and toluene has been linked to increased risks of respiratory conditions, particularly among women and socioeconomically vulnerable populations, which may disproportionately include individuals with disabilities [95]. Several of these VOCs have also been associated with the exacerbation and development of dermatological conditions, including eczema and dermatitis [96]. Alongside symptom exacerbation, there are long-term effects associated with tested VOCs. Acetaldehyde is classified by the International Agency for Research on Cancer as a potential carcinogen (Group 2B), and has been associated with endocrine-disrupting effects, along with toluene, and xylenes [11,12,13]. Thus, the reduction of VOCs suggests that scent-free policies may help create safer indoor environments for individuals with respiratory, pulmonary, and dermatological conditions, while potentially reducing risks associated with long-term chronic disease development.
Beyond chronic toxicity, acetaldehyde, acetone, ethylbenzene, xylenes, toluene, and elevated TVOC concentrations may contribute to sensory irritation through activation of transient receptor potential channels (TRPA1/TRPV1), which are involved in chemical irritation and sensitization pathways [3,20,56,57]. Prolonged exposure to these compounds, even at low concentrations, may contribute to symptom exacerbation among individuals with MCS and potentially play a role in chemical receptor sensitization, leading to an increased risk of chemical intolerances [3].
Collectively, these findings suggest that office spaces with scent-free policies appear to provide greater protection against exposure to VOCs with sensitizing properties, and potentially prevent economic loss by properly accommodating employees [14]. The accessibility implications of these findings are particularly important in light of recent Canadian prevalence estimates. Preliminary Statistics Canada, CCHS data from the January–July 2025 collection period indicate that 9.4% of Canadian adults experience MCS, whereas 2.7% report receiving a diagnosis from a health professional. Consequently, source-control measures that reduce avoidable VOC exposures may improve accessibility for a broader segment of the population, particularly individuals whose health, participation, or ability to access workplaces depends on low-exposure indoor environments. Despite these reductions, fragrance-related VOCs were still present in office spaces with scent-free policies, highlighting potential gaps in policy implementation and enforcement.
4.4. Future Directions: Scent-Free Policy Education and Implementation
Prior studies estimate that cleaning products account for up to 50% of indoor VOC emissions [84,89]. This may have been reflected in the study, where terpenes, alcohols, and siloxanes, commonly associated with fragranced cleaning products, were frequently detected, even in office spaces with scent-free policies and can be major barriers to accessibility [82,97,98]. This suggests possible cross-contamination through shared ventilation systems, where emissions from adjacent areas may circulate into designated scent-free spaces, particularly in older buildings with lower air-exchange rates, as the scent-free buildings in this study were older on average (63.2 years) [99]. In this case, source control is encouraged as an effective method to mitigate VOC exposure and travel [100]. These findings support source control as an important strategy for limiting VOC exposure and migration within indoor environments [99], consistent with evidence that shared HVAC systems can facilitate the transfer of chemical emissions and odours across mixed-use building spaces [99,100].
Another explanation may be partial policy compliance or limited awareness of scent-free requirements among occupants and visitors. Previous research has shown that there are inadequate definitions, education, enforcement, and signage of scent-free policies [4], which can reduce the effectiveness of scent-free policies and create accessibility barriers for individuals with MCS [4,101]. Together, these findings highlight the importance of combining source control strategies, such as properly implemented scent-free policies, with ventilation strategies, occupant education, and ongoing policy monitoring to support IAQ accessibility. As education plays an important role in influencing behavioural change [102], future research should focus on developing evidence-based educational resources addressing policy implementation that encompasses low-emission product selection, and occupant awareness within workplace environments, as well as academic and healthcare institutions.
5. Conclusions
Poor IAQ can create significant accessibility barriers for individuals living with respiratory, neurocognitive, neurodegenerative, cardiovascular, dermatological, and other conditions, including MCS, particularly in environments where fragranced personal care and cleaning products are used without effective source control measures. Many IAQ standards are designed to protect healthy populations, but may not adequately account for individuals who experience adverse reactions at much lower levels of chemical exposure. This underscores the need to keep pollutant concentrations as low as reasonably achievable, following the precautionary principle. This study demonstrates the role of scent-free policies in reducing concentrations of total and hazardous VOCs such as acetone, acetaldehyde, ethylbenzene, toluene, and xylene mixtures. These reductions are important for improving IAQ and supporting accessibility for individuals whose health and functional participation depend on scent-free, least-toxic, and lowest-emission environments. Given recent Statistics Canada, CCHS estimates indicating that 9.4% of Canadian adults experience MCS, the accessibility and public health benefits of effective source-control strategies may extend well beyond populations currently captured through formal diagnosis. While scent-free policies were associated with lower pollutant levels, they did not eliminate exposures entirely. This finding underscores the need for broader IAQ policies that combine scent-free policies with additional measures, including transparent product labeling, mandating lowest-emission products, monitoring of policy compliance and education to support consistent implementation. Future research is needed to evaluate how policy design, compliance, and enforcement can influence the effectiveness of scent-free policies in improving IAQ, and to expand study populations to strengthen the evidence base on accessibility and public health benefits of scent-free, lowest-emission, and least-toxic indoor environments.
Strengths and Limitations
This study benefited from several methodological strengths. First, all sampling was conducted by trained technicians that followed a decontamination protocol prior to IAQ testing, which may have avoided confounding results, thus improving data quality [37,40]. Second, the use of two VOC samplers enhanced the reliability of measurements by providing replication across devices [32]. Third, the decision to measure individual top 35 VOCs, rather than relying solely on TVOCs, allowed for more detailed characterization of specific pollutant sources and potential health risks [32]. Additionally, measuring the top 35 VOCs, provided a comprehensive overview of indoor chemicals rather than focusing only on a few targeted compounds, which have been done in many IAQ studies. This broader approach allowed for the identification of less commonly monitored pollutants, such as CFC-11, that may otherwise go undetected in studies using targeted analysis.
Due to the study focus on occupant activities and pollutant sources, sampling was conducted over a 5-hour testing period during one workday, which may not have adequately reflected daily or seasonal fluctuations in VOC concentrations. Further, building type was not factored into analysis due to uneven sample sizes, and is recommended to be explored in future research as building activities have influence on VOC migration [98]. Despite this, this study gathered new evidence that scent-free policies appear to be an effective source control strategy to reduce indoor air pollutants, and TVOCs in workplaces, thereby improving IAQ and accessibility for vulnerable populations who depend on clean air.
Supplementary Materials
The following supporting information can be downloaded at: Preprints.org, Figure S1: title; Table S1: title; Video S1: title.
Author Contributions
Conceptualization, R.P.; methodology, R.P., A.T., N.A.D., A.W.H.C., and C.B.; validation, R.P., J.M., C.B., A.W.H.C, A.T., and N.A.D.; formal analysis, A.T.; investigation, R.P., J.M., A.T., and R.B.; data curation, A.T.; writing—original draft preparation, A.T.; review and editing, R.P., J.M., C.B., R.B., R.L., A.W.H.C., N.A.D., and A.T.; visualization, A.T.; supervision, R.P.; project administration, R.P.; funding acquisition, R.P. All authors have read and agreed to the published version of the manuscript. All authors have read and agreed to the published version of the manuscript.
Funding
This research was funded in part by Accessibility Standards Canada and the Association pour la santé environnementale du Québec-Environmental Health Association of Québec (ASEQ-EHAQ).
Institutional Review Board Statement
The study was conducted in accordance with the Declaration of Helsinki, and approved by the Ethics Committee of the Women’s College Hospital [REB# 2023-0030-E] on October 27th, 2023.
Informed Consent Statement
Informed consent was obtained from all subjects involved in the study.
Data Availability Statement
Data available upon request.
Acknowledgments
The authors sincerely thank the Steering Committee, project partners, participants who contributed their time, experiences, and perspectives to this work. We also acknowledge Isaiah Omondi of the University of Waterloo for his assistance with statistical data verification. .
Conflicts of Interest
Some authors received remuneration from (ASEQ-EHAQ) for conducting data analysis and manuscript preparation. However, this did not influence the study design, analysis, or interpretation of results.
Definitions and Abbreviations
Office Spaces:Indoor air quality testing was conducted in office spaces located within larger buildings; however, testing did not assess the entire building. To capture the areas frequently used by occupants in office settings, air quality measurements were collected in meeting rooms, individual offices, and washrooms within each participating office space located in the building.
Indoor air quality (IAQ):Describes the cleanliness and safety of air within indoor environments, including homes, offices, and public buildings. It encompasses the presence of pollutants, temperature, humidity, and overall environmental conditions that influence occupant health and comfort.
Fragrance/scent-free policies: For the purposes of this paper, the term ‘fragrance/scent-free policy’ refers to policies intended to create accessible indoor environments by eliminating sources of fragranced and chemical emissions and requiring the use of lowest-emission, least-toxic alternatives. In this context, the terms ‘scent’ and ‘fragrance’ include perfumes, colognes, fragranced personal care products, essential oils, incense, cleaning products, and other products containing added fragrance chemicals, including scenting and masking agents. Importantly, some products marketed as “fragrance-free” or “scent-free” may still contain masking agents or other volatile organic compounds (VOCs) that contribute to indoor air contamination despite having little or no detectable odour. Consequently, product selection should be based on emission characteristics and ingredient transparency rather than labelling alone. Such policies represent a source-control strategy intended to improve indoor air quality and accessibility for individuals adversely affected by chemical exposures.
Multiple chemical sensitivity (MCS):MCS is a chronic medical condition characterized by adverse health effects triggered by exposure to common chemical irritants, including fragrances, cleaning products, pesticides, solvents, and building materials (3,103]. For individuals living with MCS, these exposures can create barriers to accessing workplaces, healthcare settings, housing, and other public spaces, resulting in substantial impacts on health, participation, and quality of life [15,104].
TRP Receptors: A family of polymodal ion channels that function as cellular sensors, capable of detecting a wide range of physical and chemical stimuli. These receptors respond to factors such as temperature changes, mechanical or osmotic stress, chemical irritants, and inflammatory signals. Two important subtypes, TRPV1 and TRPA1, are widely expressed in the nervous system and play key roles in chemical perception. They act as sensory transducers that convert environmental and chemical stimuli into neural signals and are involved in physiological and pathophysiological processes such as cough reflexes, pain perception, and inflammatory responses. Sustained receptor sensitization can result in amplified physiological responses to subsequent exposures and may contribute to the development or worsening of MCS [3] .
Lowest-emission products:In this paper, the term “lowest-emission products” is used intentionally. Products marketed as “fragrance-free” or “scent-free” may still contain masking agents or other volatile chemicals that emit into indoor air despite having little or no detectable odour [5,7,59].While fragrance/scent-free policies can address a major source of exposure, emission levels, rather than perceived scent alone, provide a more reliable basis for product selection and source control. Consequently, priority should be given to products with the lowest feasible emissions and toxicity profiles in order to prevent avoidable chemical exposures and promote accessible indoor environments.
Top 35 VOC collection:Refers to the top 35 VOCs measured in each individual office space, including in meeting rooms, offices, washrooms and outdoors. This panel was chosen in order to focus on VOCs at the building intake, and from indoor emissions, including those emitted from building materials, cleaning products, and occupant activities.
Appendix A
Appendix A.1. Building Characteristics Stratified by Policy Groups
| Characteristic | With Policy (n=16) | No Policy (n=16) | |
| Building Characteristics | |||
| Building type: Office | 37.50% | 87.50% | |
| Building type: Healthcare | 37.50% | - | |
| Building type: Education | 25.00% | 12.50% | |
| Mean building age (years, SD) | 63.2 (27.9) | 32.9 (17.3) | |
| Total building size (sq. ft, SD) | 97,708 (14,577) | 48,196 (70,490) | |
| Primary province: Ontario | 68.70% | 56.20% | |
| Indoor Environment Characteristics | |||
| Ventilation: Mechanical | 50.00% | 75.00% | |
| Ventilation: Mechanical + Natural | 12.50% | 0% | |
| Meeting room size, sq. ft (SD) | 300.3 (163.2) | 633.8 (1,074.9) | |
| Office room size, sq. ft (SD) | 1,062.6 (1,982.3) | 606.1 (1,149.9) | |
| Washroom size, sq. ft (SD) | 166.8 (133.2) | 162.7 (157.1) | |
| Occupancy characteristics | |||
| Meeting room occupancy (# of people, SD) | 12.7 (13.0) | 23.7 (53.1) | |
| Office room occupancy (# of people, SD) | 11.7 (19.5) | 13.6 (19.2) | |
| Washroom occupancy # of people, SD) | 12.4 (27.5) | 3.3 (4.9) | |
| Sampling Characteristics | |||
| Sampled in spring | 56.20% | 86.50% | |
| Sampled in winter | 18.80% | 12.50% | |
| Sampled in summer | 25.00% | - | |
| Potential Exposure Sources | |||
| Renovations: Painting (within 12 months) | 18.80% | 18.80% | |
| Renovations: Carpet installation | 12.50% | 18.80% | |
| Outdoor emission sources: Airports | 31.20% | 56.30% | |
| Outdoor emission sources: Smoking areas | 25.00% | 37.50% | |
| Outdoor emission sources: Heavy traffic | 62.50% | 50.00% | |
References
- Salonen, H., Salthammer, T., Castagnoli, E., Täubel, M., & Morawska, L. (2024). Cleaning products: Their chemistry, effects on indoor air quality, and implications for human health. Environment International, 190, 108836. [CrossRef]
- Mannan, M., & Al-Ghamdi, S. G. (2021). Indoor air quality in buildings: A comprehensive review on the factors influencing air pollution in residential and commercial structure. International Journal of Environmental Research and Public Health, 18(6), 3276. [CrossRef]
- Molot, J., Sears, M., & Anisman, H. (2023). Multiple chemical sensitivity: It’s time to catch up to the science. Neuroscience & Biobehavioral Reviews, 151, 105227. [CrossRef]
- Roy, S., Molot, J., Lattanzio, R., Bray, R., Armstrong, J., Trifunovski, A., & Peris, R. Fragrance-Free Policies: A Scoping Review of Definitions, Implementation, and Gaps. Association pour la santé environnementale du Québec – Environmental Health Association of Québec. Québec, Ontario, Canada. 2026a, (Manuscript submitted).
- Canadian Centre for Occupational Health and Safety (CCOHS). (2024). Indoor air quality - general. Retrieved June 10, 2025, from https://www.ccohs.ca/oshanswers/chemicals/iaq/iaq_intro.html.
- Bhoonah, R., Mendez, M., & Maury-Micolier, A. (2024). Human health impacts and indoor chemical reactions of vocs from cleaning products and occupants. Atmospheric Environment, 338, 120846. [CrossRef]
- Steinemann, A. (2016). Fragranced consumer products: Exposures and effects from emissions. Air Quality, Atmosphere & Health, 9(8), 861–866. [CrossRef]
- Laura N. Vandenberg, Theo Colborn, Tyrone B. Hayes, Jerrold J. Heindel, David R. Jacobs, Duk-Hee Lee, Toshi Shioda, Ana M. Soto, Frederick S. vom Saal, Wade V. Welshons, R. Thomas Zoeller, John Peterson Myers. (2012). Hormones and Endocrine-Disrupting Chemicals: Low-Dose Effects and Nonmonotonic Dose Responses. Endocrine Reviews, Volume 33, Issue 3. Pages 378–455. [CrossRef]
- Thangavel, P., Park, D., & Lee, Y.-C. (2022). Recent insights into particulate matter (pm2.5)-mediated toxicity in humans: An overview. International Journal of Environmental Research and Public Health, 19(12), 7511. [CrossRef]
- Maung, T. Z., Bishop, J. E., Holt, E., Turner, A. M., & Pfrang, C. (2022). Indoor air pollution and the health of vulnerable groups: A systematic review focused on particulate matter (pm), volatile organic compounds (vocs) and their effects on children and people with pre-existing lung disease. International Journal of Environmental Research and Public Health, 19(14), 8752. [CrossRef]
- Tjalvin, G., Svanes, Ø., Igland, J., Bertelsen, R., Benediktsdóttir, B., Dharmage, S., Forsberg, B., Holm, M., Janson, C., Jõgi, N., Johannessen, A., Malinovschi, A., Pape, K., Real, F., Sigsgaard, T., Torén, K., Vindenes, H., Zock, J.-P., Schlünssen, V., & Svanes, C. (2022). Maternal preconception occupational exposure to cleaning products and disinfectants and offspring asthma. Journal of Allergy and Clinical Immunology, 149(1), 422–431.e5. [CrossRef]
- Chiarello, D. I., Ustáriz, J., Marín, R., Carrasco-Wong, I., Farías, M., Giordano, A., Gallardo, F. S., Illanes, S. E., & Gutiérrez, J. (2023). Cellular mechanisms linking to outdoor and indoor air pollution damage during pregnancy. Frontiers in Endocrinology, 14. [CrossRef]
- Palmer, R. F., Kattari, D., Rincon, R., & Miller, C. S. (2024). Assessing chemical intolerance in parents predicts the risk of autism and adhd in their children. Journal of Xenobiotics, 14(1), 350–367. [CrossRef]
- Subri, M. S. M., Arifin, K., Sohaimin, M. F. A. M., & Abas, A. (2024). The parameter of the Sick Building Syndrome: A systematic literature review. Heliyon, 10(12), Article e32431. [CrossRef]
- Yousufzai, S. J., Psaradellis, E., Peris, R., & Barakat, C. (2025). A qualitative exploration of policy, institutional, and social misconceptions faced by individuals with multiple chemical sensitivity. International Journal of Environmental Research and Public Health, 22(9), 1383. [CrossRef]
- Robins, S., Molot, J., & Peris, R. (2026). Prevalence of multiple chemical sensitivity in Canada between 2000 and 2020. International Journal of Environmental Research and Public Health, 23(2), Article 236. [CrossRef]
- Masri, S., Miller, C.S., Palmer, R.F. et al. Toxicant-induced loss of tolerance for chemicals, foods, and drugs: assessing patterns of exposure behind a global phenomenon. Environ Sci Eur 33, 65 (2021). [CrossRef]
- Miller, C. S., & Prihoda, T. J. (1999). The environmental exposure and sensitivity inventory (eesi): A standardized approach for measuring chemical intolerances for research and clinical applications. Toxicology and Industrial Health, 15(3-4), 370–385. [CrossRef]
- Grandjean, P. (2016). Paracelsus revisited: The dose concept in a complex world. Basic & Clinical Pharmacology & Toxicology, 119(2), 126–132. [CrossRef]
- Saito, A., Tanaka, H., Usuda, H., Shibata, T., Higashi, S., Yamashita, H., Inagaki, N., & Nagai, H. (2011). Characterization of skin inflammation induced by repeated exposure of toluene, xylene, and formaldehyde in mice. Environmental Toxicology, 26(3), 224–232. [CrossRef]
- Miao, F., Wang, R., Cui, G., Li, X., Wang, T., & Li, X. (2019). Engagement of microrna-155 in exaggerated oxidative stress signal and trpa1 in the dorsal horn of the spinal cord and neuropathic pain during chemotherapeutic oxaliplatin. Neurotoxicity Research, 36(4), 712–723. [CrossRef]
- Rossi, S., & Pitidis, A. (2018). Multiple chemical sensitivity. Journal of Occupational & Environmental Medicine, 60(2), 138–146. [CrossRef]
- Domingo, J. L. (2026). Mixture toxicity revisited: A translational review of experimental evidence from animal models to human health risk assessment. Toxicology, 520, Article 154372. [CrossRef]
- Health Canada. (2023). Consultation: Draft guidance on improving indoor air quality in office buildings. Retrieved October 11, 2025, from https://www.canada.ca/en/health-canada/programs/consultation-draft-guidance-improving-indoor-air-quality-office-buildings/for-professionals.html.
- Chamseddine, A., Elzein, I. M., & Hassan, N. (2025). Indoor air quality in critical indoor environments: A review paper. Water, Air, & Soil Pollution, 236(13). [CrossRef]
- Niza, I., Bueno, A., Gameiro da Silva, M., & Broday, E. (2024). Air quality and ventilation: Exploring solutions for healthy and sustainable urban environments in times of climate change. Results in Engineering, 24, 103157. [CrossRef]
- Babich, F., Demanega, I., Avella, F., & Belleri, A. (2020). Low polluting building materials and ventilation for good air quality in residential buildings: A cost–benefit study. Atmosphere, 11(1), 102. [CrossRef]
- Steinemann, A. (2019). Ten questions concerning scent-free policies and indoor environments. Building and Environment, 159, 106054. [CrossRef]
- Canadian Human Rights Commission. (2026). Environmental sensitivities and scent-free policies [PDF]. Retrieved July 2, 2025, from https://publications.gc.ca/collections/collection_2024/ccdp-chrc/HR4-124-2024-eng.pdf.
- Steinemann, A. (2020). The fragranced products phenomenon: Air quality and health, science and policy. Air Quality, Atmosphere & Health, 14(2), 235–243. [CrossRef]
- U.S. Environmental Protection Agency [EPA]. (2003). A standardized EPA protocol for characterizing indoor air quality in large office buildings (EPA/600/R-03/004). Environmental Health & Engineering, Inc. Retrieved from https://www.epa.gov/sites/default/files/2016-04/documents/standardized_iaq_base_protocol_for_characterizing_iaq_in_large_buildings-pdf.pdf.
- Horvat, T., Pehnec, G., & Jakovljević, I. (2025). Volatile organic compounds in indoor air: Sampling, determination, sources, health risk, and regulatory insights. Toxics, 13(5), 344. [CrossRef]
- Wu, X., Apte, M. G., Maddalena, R., & Bennett, D. H. (2011). Volatile organic compounds in small- and medium-sized commercial buildings in california. Environmental Science & Technology, 45(20), 9075–9083. [CrossRef]
- Zhong, L., Su, F.-C., & Batterman, S. (2017). Volatile organic compounds (vocs) in conventional and high performance school buildings in the u.s. International Journal of Environmental Research and Public Health, 14(1), 100. [CrossRef]
- Wolkoff, P. (2013). Indoor air pollutants in office environments: Assessment of comfort, health, and performance. International Journal of Hygiene and Environmental Health, 216(4), 371–394. [CrossRef]
- World Health Organization (WHO). (2010). Who guidelines for indoor air quality: Selected pollutants. World Health Organization. https://www.who.int/publications/i/item/9789289002134.
- Papapostolou, V., Kuang, M., Mui, W., Low, J. C., & Polidori, A. (2023). Laboratory Evaluation of VOC Sensors: Laboratory Testing Protocol [Technical report]. South Coast Air Quality Management District. https://www.aqmd.gov/docs/default-source/aq-spec/protocols/voc-sensors-laboratory-testing-protocol.pdf.
- Wang, N., Müller, T., Ernle, L., Bekö, G., Wargocki, P., & Williams, J. (2024). How does personal hygiene influence indoor air quality? Environmental Science & Technology, 58(22), 9750–9759. [CrossRef]
- Wu, T., Müller, T., Wang, N., Byron, J., Langer, S., Williams, J., & Licina, D. (2024). Indoor emission, oxidation, and new particle formation of personal care product related volatile organic compounds. Environmental Science & Technology Letters, 11(10), 1053–1061. [CrossRef]
- Trifunovski, A., Lattanzio, R., Molot, J., Barakat, C., Gaudet, M., Bray, R., Diallo, N., & Peris, R. (2026). Technician decontamination and indoor air quality testing: Toward formalized protocols. Association pour la santé environnementale du Québec – Environmental Health Association of Québec. Québec, Ontario, Canada. (Manuscript in preparation; under review).
- Kang, H. (2013). The prevention and handling of the missing data. Korean Journal of Anesthesiology, 64(5), 402. [CrossRef]
- Wendelberger, J., & Campbell, K. (1994). NON-DETECT DATA IN ENVIRONMENTAL INVESTIGATIONS [PDF]. https://digital.library.unt.edu/ark:/67531/metadc1315539/m2/1/high_res_d/10156972.pdf.
- Persily, A. (2015). Challenges in developing ventilation and indoor air quality standards: The story of ashrae standard 62. Building and Environment, 91, 61–69. [CrossRef]
- Persily, A., & de Jonge, L. (2017). Carbon dioxide generation rates for building occupants. Indoor Air, 27(5), 868–879. [CrossRef]
- Takahashi, H., Bivolarova, M., Keli, A., Nickel, J., & Melikov, A. (2019). Non-uniformity in outdoor co2 concentration in city of copenhagen. E3S Web of Conferences, 111, 02007.
- Kim, M., & Choi, J.-H. (2019). Can increased outdoor co2 concentrations impact on the ventilation and energy in buildings? a case study in shanghai, china. Atmospheric Environment, 210, 220–230. [CrossRef]
- Caron-Beaudoin, É., Whyte, K., Bouchard, M. F., Chevrier, J., Haddad, S., Copes, R., Frohlich, K. L., Dokkie, D., Juul, S., Bouchard, M., & Verner, M.-A. (2022). Volatile organic compounds (vocs) in indoor air and tap water samples in residences of pregnant women living in an area of unconventional natural gas operations: Findings from the experiva study. Science of The Total Environment, 805, 150242. [CrossRef]
- Rothman, K. J., Huybrechts, K. F., & Murray, E. J. (2024). Stratified analysis. In Epidemiology (pp. 171–193). Oxford University PressNew York. [CrossRef]
- Mai, J.-L., Yang, W.-W., Zeng, Y., Guan, Y.-F., & Chen, S.-J. (2024). Volatile organic compounds (vocs) in residential indoor air during interior finish period: Sources, variations, and health risks. Hygiene and Environmental Health Advances, 9, 100087. [CrossRef]
- Domhagen, F., Langer, S., & Sasic Kalagasidis, A. (2023). Modelling voc levels in a new office building using passive sampling, humidity, temperature, and ventilation measurements. Building and Environment, 238, 110337. [CrossRef]
- Liang, X., Zhang, B., Wang, K., Ji, X., Geng, Z., & Chen, C. (2022). Indoor formaldehyde pollution and its influencing factors of newly decorated residential buildings in kunshan city, jiangsu province. Current Urban Studies, 10(02), 263–274. [CrossRef]
- International WELL Building Institute. (2016). Building WELL through performance verification. Retrieved November 9, 2025, from https://resources.wellcertified.com/articles/building-well-through-performance-verification/.
- Mansor, A. A. ., Abdullah, S., Ahmad, A. N., Ismail, N. A., & Ismail, M. (2023). Investigating Indoor Air Quality (IAQ) and Sick Building Syndrome Symptoms (SBSS) using generalized linear model. Healthscope: The Official Research Book of Faculty of Health Sciences, UiTM, 6(1), 23-30. Retrieved from https://healthscopefsk.com/index.php/research/article/view/308.
- Justo Alonso, M., Moazami, T., Liu, P., Jørgensen, R., & Mathisen, H. (2022). Assessing the indoor air quality and their predictor variable in 21 home offices during the covid-19 pandemic in Norway. Building and Environment, 225, 109580. [CrossRef]
- Mansfield E.R., Helms B.P. Detecting Multicollinearity. Am. Stat. 1982;36:158–160. [CrossRef]
- González-Ramírez, R., Chen, Y., Liedtke, W. B., & Morales-Lázaro, S. L. (2017). TRP channels and pain. In T. L. Emir (Ed.), Neurobiology of TRP channels. CRC Press/Taylor & Francis. https://www.ncbi.nlm.nih.gov/books/NBK476120/.
- Talavera, K., Startek, J. B., Alvarez-Collazo, J., Boonen, B., Alpizar, Y. A., Sanchez, A., Naert, R., & Nilius, B. (2020, April 1). Mammalian transient receptor potential TRPA1 channels: From structure to disease. Physiological Reviews, 100(2), 725–803. [CrossRef]
- International Fragrance Association. (n.d.). IFRA transparency list. Retrieved March 17, 2026, from https://ifrafragrance.org/transparency-list.
- Steinemann, A. (2017). Health and societal effects from exposure to fragranced consumer products. Preventive Medicine Reports, 5, 45–47. [CrossRef]
- Kazemi, Z., Aboutaleb, E., Shahsavani, A., Kermani, M., & Kazemi, Z. (2022). Evaluation of pollutants in perfumes, colognes and health effects on the consumer: A systematic review. Journal of Environmental Health Science and Engineering, 20(1), 589–598. [CrossRef]
- Lv, J., Li, X., Shen, Y., You, J., Wen, M., Wang, J., & Yang, X. (2023). Assessing volatile organic compounds exposure and chronic obstructive pulmonary diseases in us adults. Frontiers in Public Health, 11. [CrossRef]
- American Medical Association (AMA). Policy Finder American Medical Association. (2025). Fragrance regulation H-135.902. American Medical Association.
- Lin, W.-T., Tsai, R.-Y., Chen, H.-L., Tsay, Y.-S., & Lee, C.-C. (2022). Probabilistic prediction models and influence factors of indoor formaldehyde and voc levels in newly renovated houses. Atmosphere, 13(5), 675. [CrossRef]
- Holøs, S. B., Yang, A., Lind, M., Thunshelle, K., Schild, P., & Mysen, M. (2018). VOC emission rates in newly built and renovated buildings, and the influence of ventilation – a review and meta-analysis. International Journal of Ventilation, 18(3), 153–166. [CrossRef]
- Robertson, N. M., Qiu, A., Raju, S., McCormack, M. C., & Koehler, K. (2024). Cleaning indoor air—what works for respiratory health: An updated literature review and recommendations. Journal of Allergy and Clinical Immunology, 154(4), 847–860. [CrossRef]
- Gržinić, G., Wolska, L., Rybak, B., Olkowska, E., & Nyka, M. (2025). Managing the quality of indoor air in office rooms: Looking for a solution. International Journal of Environmental Science and Technology, 22(14), 14591–14606. [CrossRef]
- Martins, C., Teófilo, V., Clemente, M., Corda, M., Fermoso, J., Aguado, A., Rodriguez, S., Moshammer, H., Kristian, A., Ferri, M., Costa-Ruiz, B., Pérez, L., Hanke, W., Badyda, A., Kepa, P., Affek, K., Doskocz, N., Martín-Torrijos, L., Mulayim, M.,...Viegas, S. (2025). Sources, levels, and determinants of indoor air pollutants in Europe: A systematic review. Science of The Total Environment, 964, 178574. [CrossRef]
- Zarogianni, A., Loupa, G., & Rapsomanikis, S. (2018). Fragrances and aerosol during office cleaning. Aerosol and Air Quality Research, 18(5), 1162–1167. [CrossRef]
- Siddiqui, T., Khan, M. U., Sharma, V., & Gupta, K. (2024). Terpenoids in essential oils: Chemistry, classification, and potential impact on human health and industry. Phytomedicine Plus, 4(2), 100549. [CrossRef]
- Nematollahi, N., Ross, P. A., Hoffmann, A. A., Kolev, S. D., & Steinemann, A. (2021). Limonene emissions: Do different types have different biological effects? International Journal of Environmental Research and Public Health, 18(19), 10505. [CrossRef]
- Wolkoff, P. (2020). Indoor air chemistry: Terpene reaction products and airway effects. International Journal of Hygiene and Environmental Health, 225, 113439. [CrossRef]
- Calogirou, A., Larsen, B., & Kotzias, D. (1999). Gas-phase terpene oxidation products: A review. Atmospheric Environment, 33(9), 1423–1439. [CrossRef]
- Environment and Climate Change Canada. (2022). Ozone layer depletion: Montreal Protocol [Web page]. Retrieved November 9, 2025, from https://www.canada.ca/en/environment-climate-change/corporate/international-affairs/partnerships-organizations/ozone-layer-depletion-montreal-convention.html.
- United Nations Environment Programme (UNEP). (2021). The story behind unexpected emissions of CFC-11. Retrieved September 22, 2025, from https://ozone.unep.org/story-behind-unexpected-emissions-cfc-11.
- Rahman, M., & Kim, K.-H. (2014). Potential hazard of volatile organic compounds contained in household spray products. Atmospheric Environment, 85, 266–274. [CrossRef]
- Kazemi, Z., Aboutaleb, E., Shahsavani, A., Kermani, M., & Kazemi, Z. (2022). Evaluation of pollutants in perfumes, colognes and health effects on the consumer: A systematic review. Journal of Environmental Health Science and Engineering, 20(1), 589–598. [CrossRef]
- Gautam, A., & Cressey, P. J. (2025). Benzene in cosmetic products: Non cancer and cancer risk assessment. Toxicology Reports, 15, 102135. [CrossRef]
- Holden, K. A., Lee, A. R., Hawcutt, D. B., & Sinha, I. P. (2023). The impact of poor housing and indoor air quality on respiratory health in children. Breathe, 19(2), 230058. [CrossRef]
- Wolkoff, P. (2024). Indoor air humidity revisited: Impact on acute symptoms, work productivity, and risk of influenza and covid-19 infection. International Journal of Hygiene and Environmental Health, 256. Retrieved November 5, 2025, from . [CrossRef]
- Garcia-Gonzalez, H., Lopez-Pola, M. T., Rodriguez, R., Fernandez-Rubio, P., & Fernandez-Rodriguez, P. (2025). Assessing volatile organic compounds (VOCs) in a laboratory and office building environment. Air Quality, Atmosphere & Health, 18(11), 3329–3345. [CrossRef]
- Cleary, E., Asher, M., Olawoyin, R., & Zhang, K. (2017). Assessment of indoor air quality exposures and impacts on respiratory outcomes in river rouge and dearborn, Michigan. Chemosphere, 187, 320–329. [CrossRef]
- Bernstein, J. A., Alexis, N., Bacchus, H., Bernstein, I., Fritz, P., Horner, E., Li, N., Mason, S., Nel, A., Oullette, J., Reijula, K., Reponen, T., Seltzer, J., Smith, A., & Tarlo, S. M. (2008). The health effects of nonindustrial indoor air pollution. Journal of Allergy and Clinical Immunology, 121(3), 585–591. [CrossRef]
- Umweltbundesamt. (UBA). (2025). German committee on indoor air guide values. Umweltbundesamt. Retrieved June 26, 2025, from https://www.umweltbundesamt.de/en/topics/health/commissions-working-groups/german-committee-on-indoor-air-guide-values#german-committee-on-indoor-air-guide-values-air.
- Bari, M., Kindzierski, W. B., Wheeler, A. J., Héroux, M.-È., & Wallace, L. A. (2015). Source apportionment of indoor and outdoor volatile organic compounds at homes in edmonton, canada. Building and Environment, 90, 114–124. [CrossRef]
- Nematollahi, N., Doronila, A., Mornane, P.J. et al. Volatile chemical emissions from fragranced baby products. Air Qual Atmos Health 11, 785–790 (2018). [CrossRef]
- Pál, L., Lovas, S., McKee, M., Diószegi, J., Kovács, N., & Szűcs, S. (2024). Exposure to volatile organic compounds in offices and in residential and educational buildings in the European Union between 2010 and 2023: A systematic review and health risk assessment. Science of The Total Environment, 945, 173965. [CrossRef]
- Rádis-Baptista, G. (2023). Do synthetic fragrances in personal care and household products impact indoor air quality and pose health risks? Journal of Xenobiotics, 13(1), 121–131. [CrossRef]
- Temkin, A. M., Geller, S. L., Swanson, S. A., Leiba, N. S., Naidenko, O. V., & Andrews, D. Q. (2023). Volatile organic compounds emitted by conventional and “green” cleaning products in the u.s. market. Chemosphere, 341, 139570. [CrossRef]
- Harčárová, K., Vilčeková, S., & Balintova, M. (2020). Building materials as potential emission sources of voc in the indoor environment of buildings. Key Engineering Materials, 838, 74–80. [CrossRef]
- Nurmatov, U. B., Tagieva, N., Semple, S., Devereux, G., & Sheikh, A. (2013). Volatile organic compounds and risk of asthma and allergy: A systematic review and meta-analysis of observational and interventional studies. Primary Care Respiratory Journal, 22(1), PS9–PS15. [CrossRef]
- Yoon, H., Hong, Y., Cho, S., Kim, H., Kim, Y., Sohn, J., Kwon, M., Park, S., Cho, M., & Cheong, H. (2010). Exposure to volatile organic compounds and loss of pulmonary function in the elderly. European Respiratory Journal, 36(6), 1270–1276. [CrossRef]
- Halios, C. H., Landeg-Cox, C., Lowther, S. D., Middleton, A., Marczylo, T., & Dimitroulopoulou, S. (2022). Chemicals in european residences – part i: A review of emissions, concentrations and health effects of volatile organic compounds (vocs). Science of The Total Environment, 839, 156201. [CrossRef]
- Radbel, J., Rebuli, M. E., Kipen, H., & Brigham, E. (2024). Indoor air pollution and airway health. Journal of Allergy and Clinical Immunology, 154(4), 835–846. [CrossRef]
- Liu, X., Chang, Y., Xu, C., Li, Y., Wang, Y., Sun, Y., Duan, M., Li, W., & Cui, J. (2024). Association of volatile organic compound levels with chronic obstructive pulmonary diseases in nhanes 2013–2016. Scientific Reports, 14(1). [CrossRef]
- Lv, J., Li, X., Shen, Y., You, J., Wen, M., Wang, J., & Yang, X. (2023). Assessing volatile organic compounds exposure and chronic obstructive pulmonary diseases in us adults. Frontiers in Public Health, 11. [CrossRef]
- Khoshakhlagh, A., Mohammadzadeh, M., & Gruszecka-Kosowska, A. (2024). Dermatitis, a nightmare for those exposed to environmental pollutants. Journal of Hazardous Materials Advances, 15, 100454. [CrossRef]
- Steinemann, A. C., MacGregor, I. C., Gordon, S. M., Gallagher, L. G., Davis, A. L., Ribeiro, D. S., & Wallace, L. A. (2011). Fragranced consumer products: Chemicals emitted, ingredients unlisted. Environmental Impact Assessment Review, 31(3), 328–333. [CrossRef]
- Diallo, N.A.; Molot, J.; Bray, R.; Trifunovski, A.; Peris, R. Chemical exposures, sensitization, provocation and symptom profiles in adults with multiple chemical sensitivity: A cross-sectional survey. 2026; (Manuscript submitted).
- Du, L., Batterman, S., Godwin, C., Rowe, Z., & Chin, J. (2016). Air exchange rates and migration of vocs in basements and residences. Indoor Air, 25(6), 598–609. [CrossRef]
- Ceballos, D. M., & Burr, G. A. (2012). Evaluating a persistent nuisance odor in an office building. Journal of Occupational and Environmental Hygiene, 9(1), D1–D6. [CrossRef]
- Roy, S., Diallo, N., Molot, J., Lattanzio, R., Bray, R., Armstrong, J., & Peris, R. Fragrance-free policies in practice: identifying implementation gaps through lived experience. Association pour la santé environnementale du Québec – Environmental Health Association of Québec. Québec, Ontario, Canada. 2026a, (Manuscript submitted).
- Trifunovski, A., Rotondi, N. K., Abbass-Dick, J., & Barakat, C. (2025). Analysis of women’s knowledge, health risk perceptions, beliefs and avoidance behaviour in relation to Endocrine-Disrupting Chemicals in Personal care and household products. Toxics, 13(5), Article 414. [CrossRef]
- Damiani, G., Alessandrini, M., Caccamo, D., Cormano, A., Guzzi, G., Mazzatenta, A., Micarelli, A., Migliore, A., Piroli, A., Bianca, M., Tapparo, O., & Pigatto, P. (2021). Italian expert consensus on clinical and Therapeutic management of multiple chemical sensitivity (MCS). International Journal of Environmental Research and Public Health, 18(21), Article 11294. [CrossRef]
- Bray R, Wang Y, Argiropoulos N, Robins S, Molot J, Pigeon MA, Gaudet M, Auger P, Bélanger E, Peris R. (2024). The Impact of COVID-19 Health Measures on Adults With Multiple Chemical Sensitivity: Cross-Sectional Study jMIR Form Res 2024;8:e48434. http://doi.org/10.2196/48434.
Figure 1.
Graph of means selected VOCs by office space and Scent-free policy enforcement. P-values arise from Mann–Whitney U Tests for concentrations between policy and non-policy across office spaces.
Figure 1.
Graph of means selected VOCs by office space and Scent-free policy enforcement. P-values arise from Mann–Whitney U Tests for concentrations between policy and non-policy across office spaces.
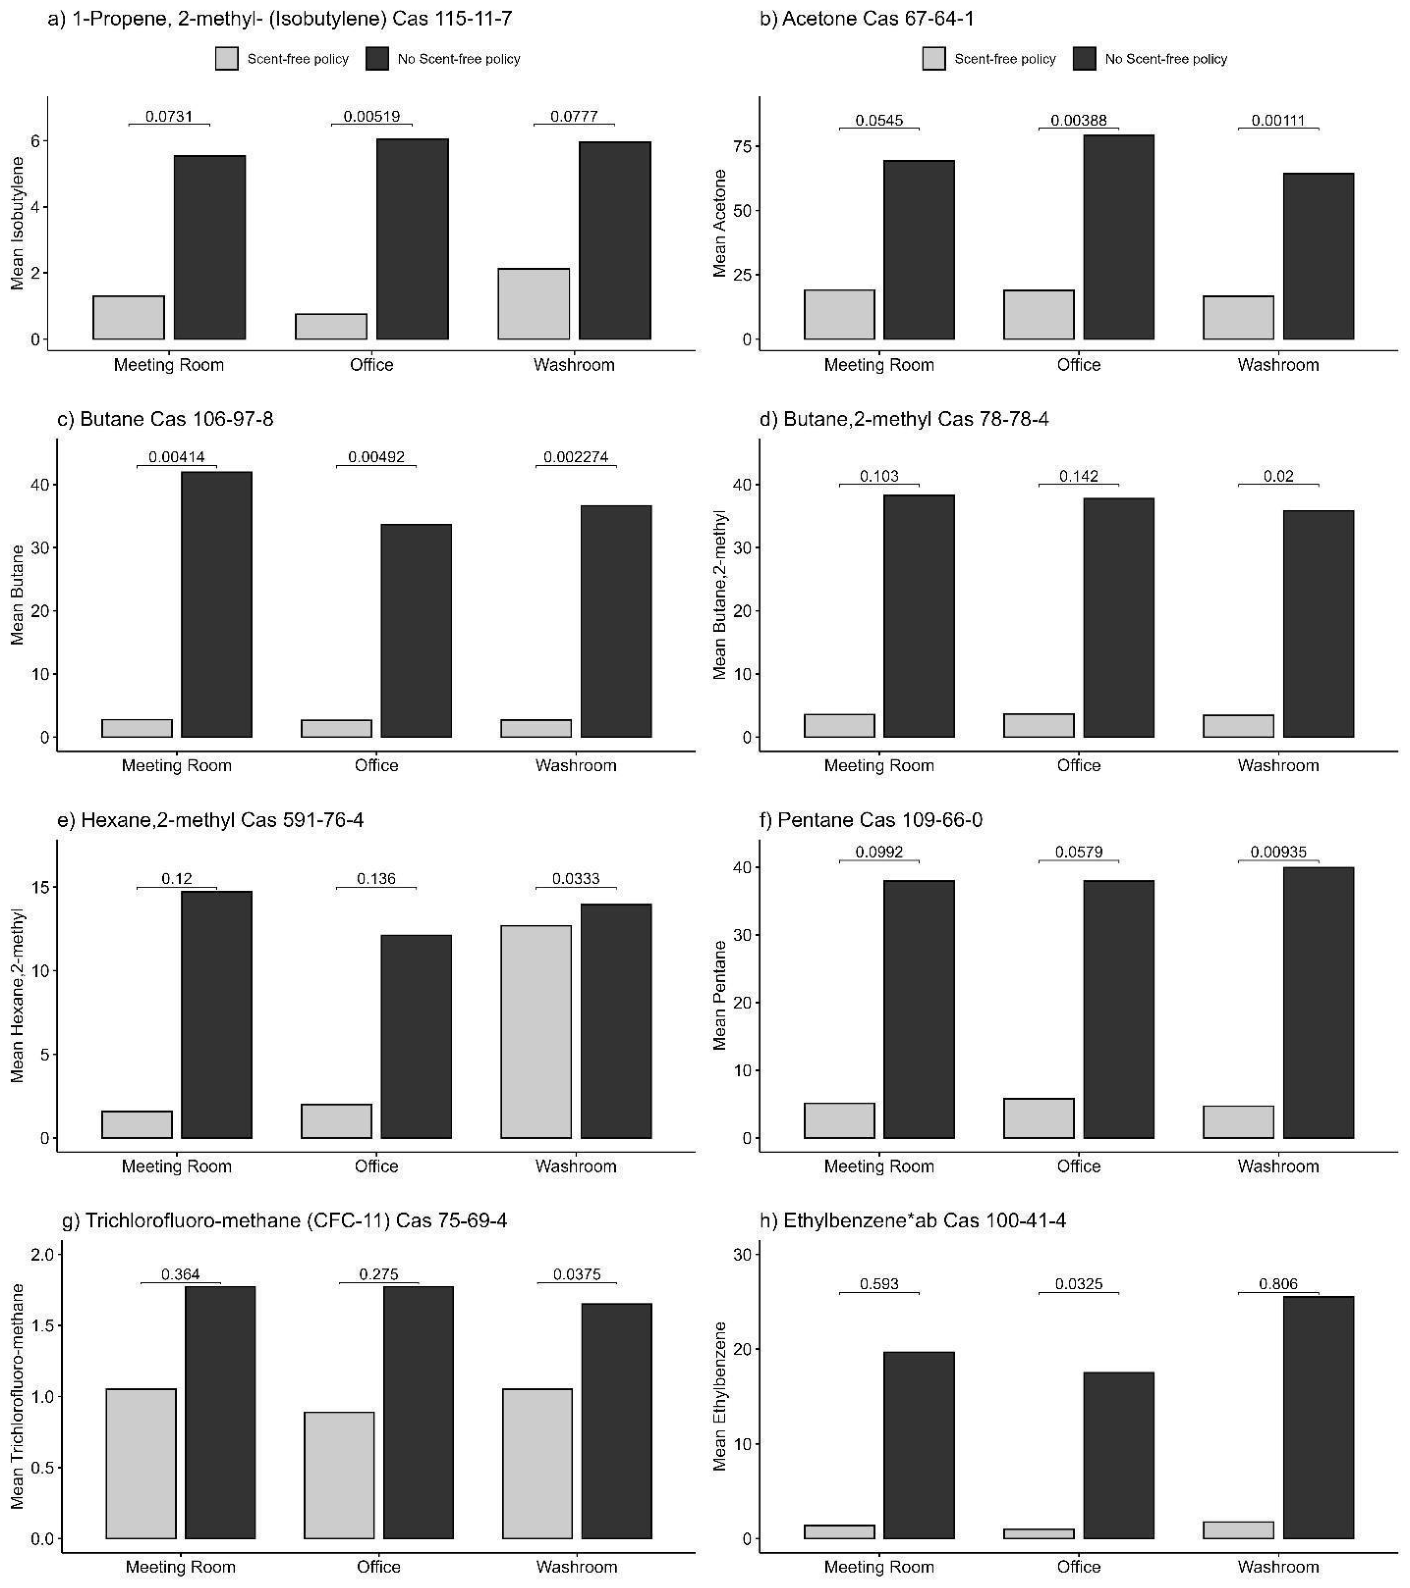
Figure 2.
Average Acetone concentration by office space and Scent-free policy enforcement. P-values follow Mann–Whitney U Tests for concentrations between policy and non-policy across office spaces, by office occupancy and size.
Figure 2.
Average Acetone concentration by office space and Scent-free policy enforcement. P-values follow Mann–Whitney U Tests for concentrations between policy and non-policy across office spaces, by office occupancy and size.
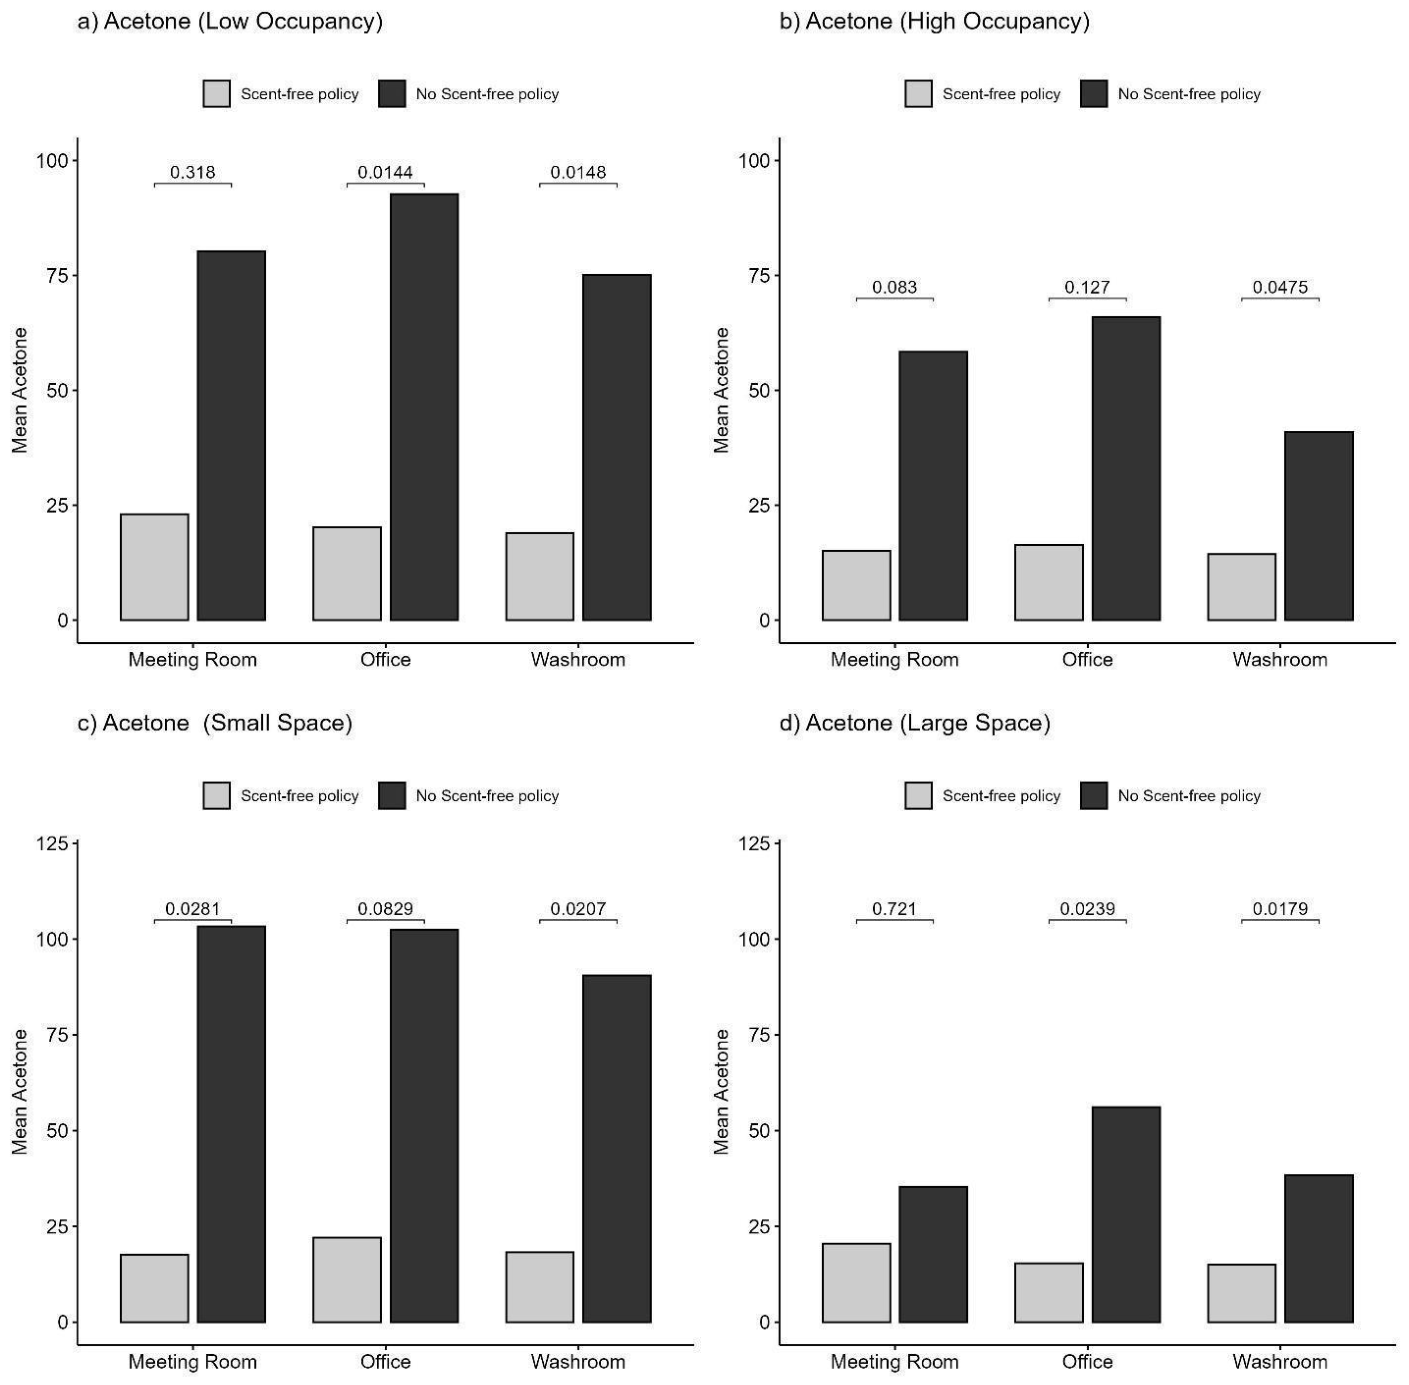
Figure 3.
Average Butane concentration by office space and Scent-free policy enforcement. P-values follow Mann–Whitney U Tests for concentrations between policy and non-policy across office spaces, by office occupancy and size.
Figure 3.
Average Butane concentration by office space and Scent-free policy enforcement. P-values follow Mann–Whitney U Tests for concentrations between policy and non-policy across office spaces, by office occupancy and size.
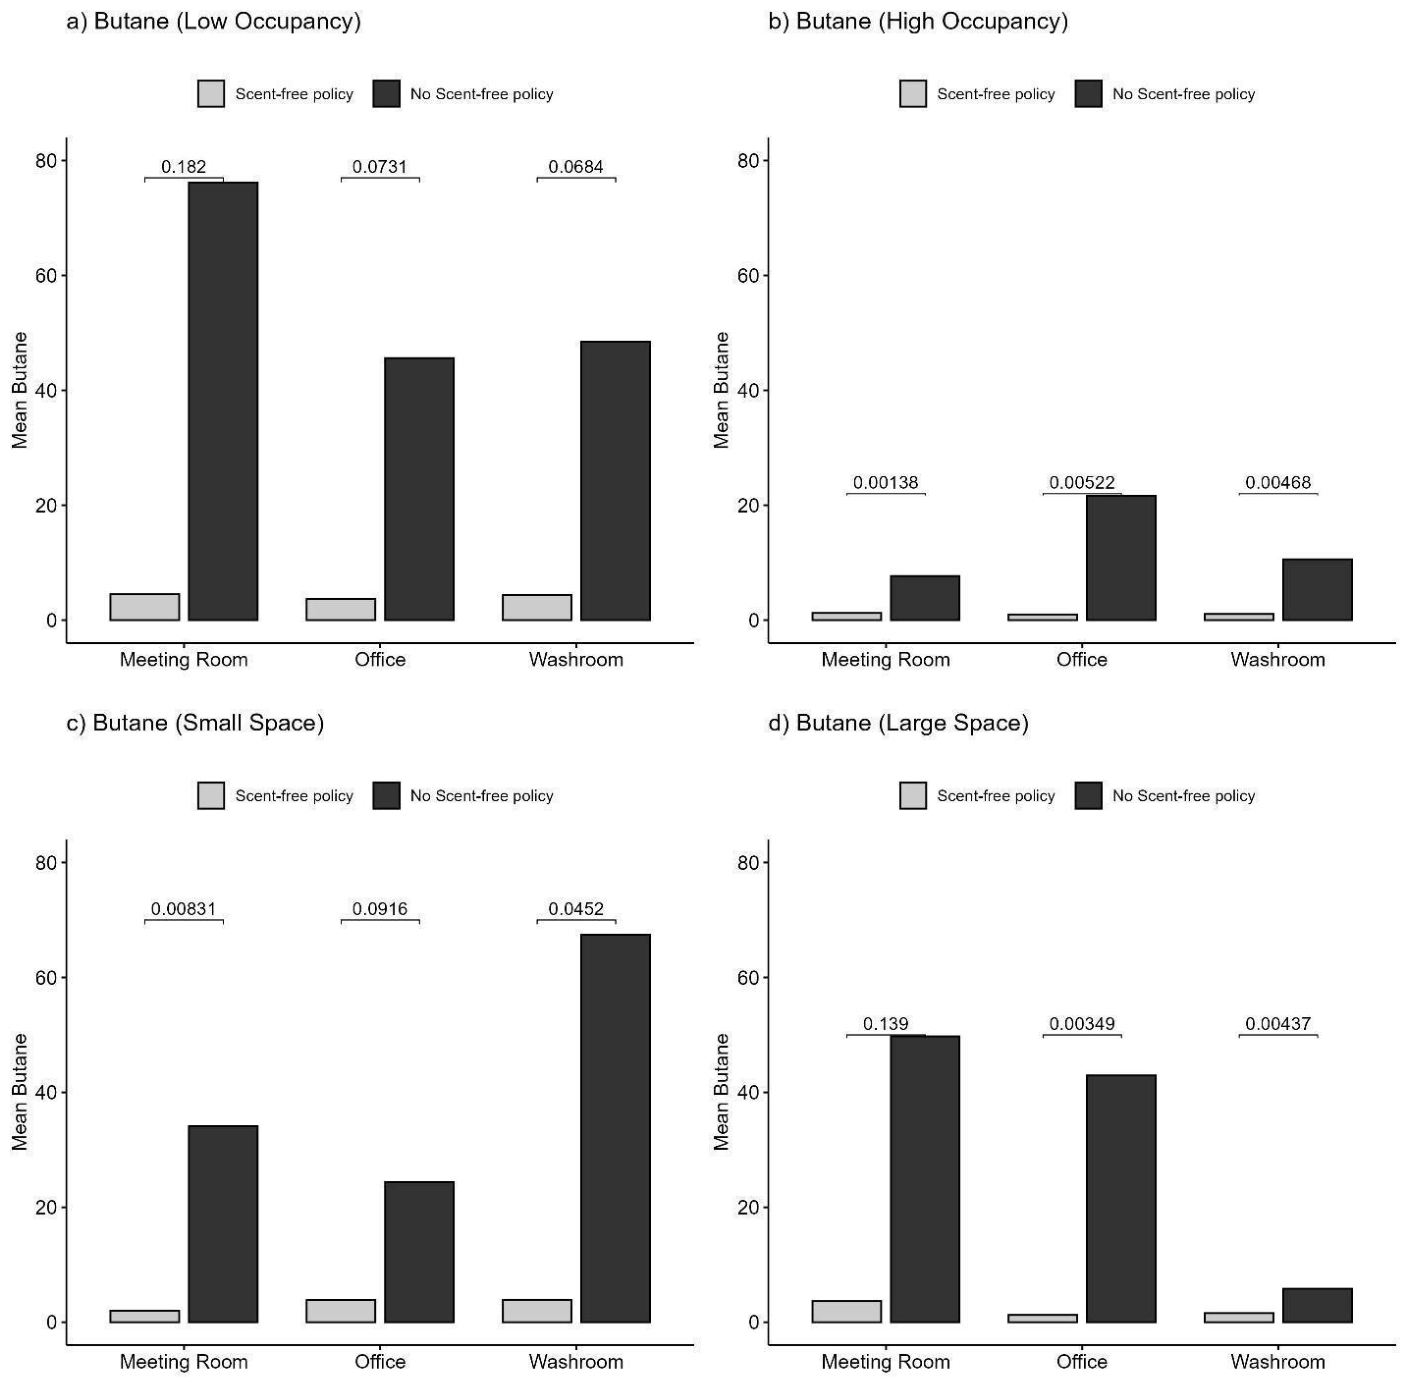
Figure 4.
Average Cyclopentane concentration by office space and Scent-free policy enforcement. P-values follow Mann–Whitney U Tests for concentrations between policy and non-policy across office spaces, by office occupancy and size.
Figure 4.
Average Cyclopentane concentration by office space and Scent-free policy enforcement. P-values follow Mann–Whitney U Tests for concentrations between policy and non-policy across office spaces, by office occupancy and size.
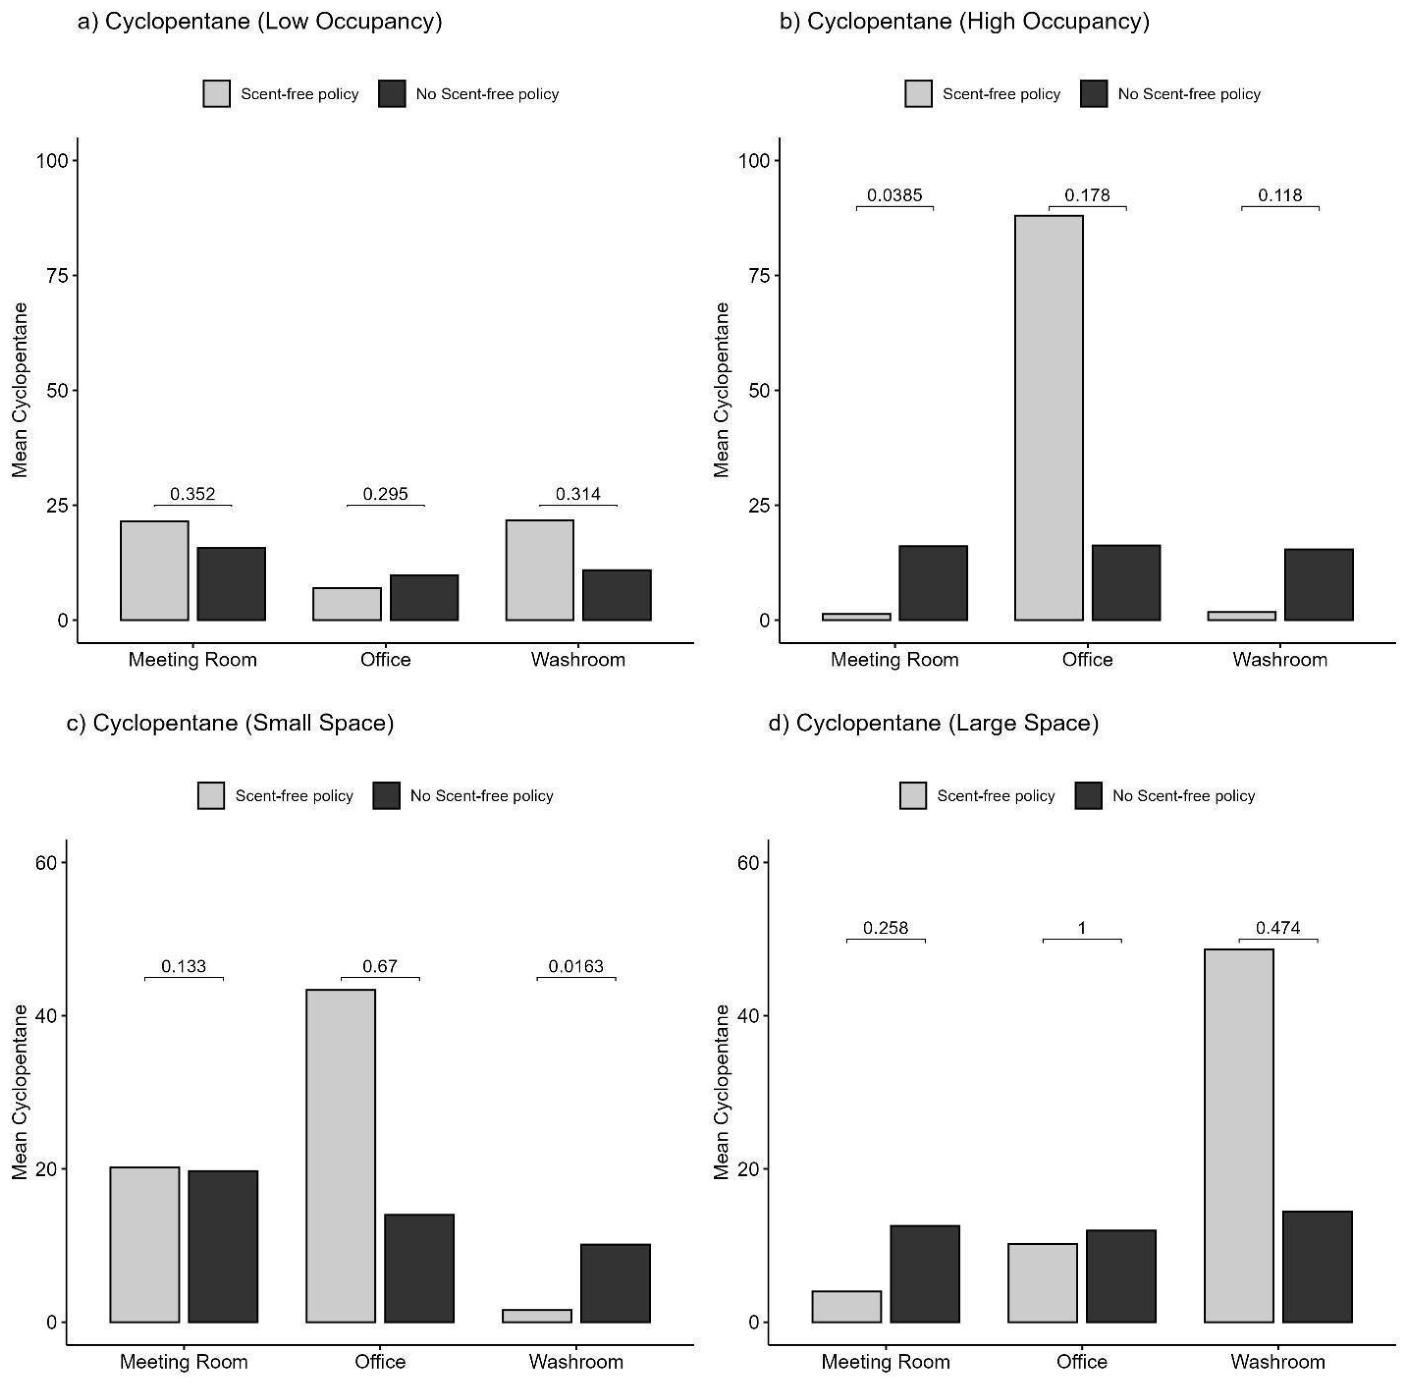
Figure 5.
Average isobutylene concentration by office space and Scent-free policy enforcement. P-values follow Mann–Whitney U Tests for concentrations between policy and non-policy across office spaces, by office occupancy and size.
Figure 5.
Average isobutylene concentration by office space and Scent-free policy enforcement. P-values follow Mann–Whitney U Tests for concentrations between policy and non-policy across office spaces, by office occupancy and size.
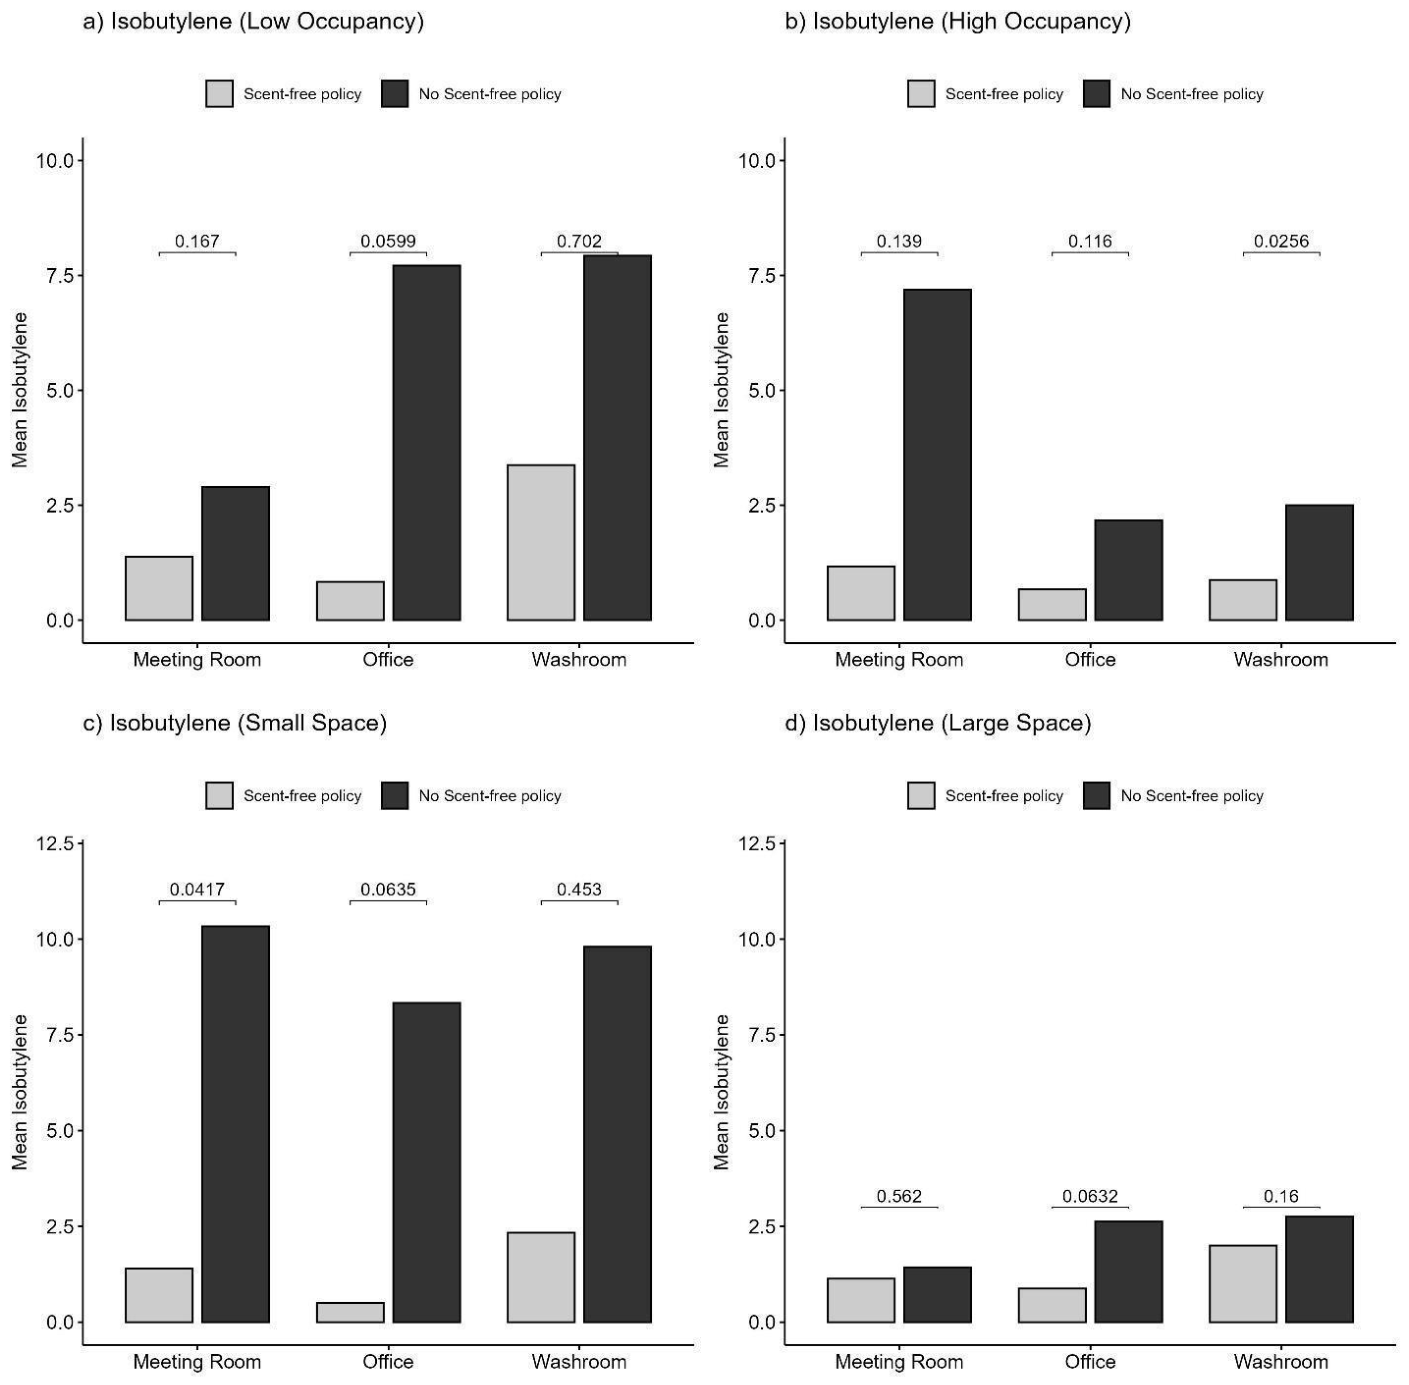
Figure 6.
Average nHexane concentration by office space and Scent-free policy enforcement. P-values follow Mann–Whitney U Tests for concentrations between policy and non-policy across office spaces, by office occupancy and size.
Figure 6.
Average nHexane concentration by office space and Scent-free policy enforcement. P-values follow Mann–Whitney U Tests for concentrations between policy and non-policy across office spaces, by office occupancy and size.
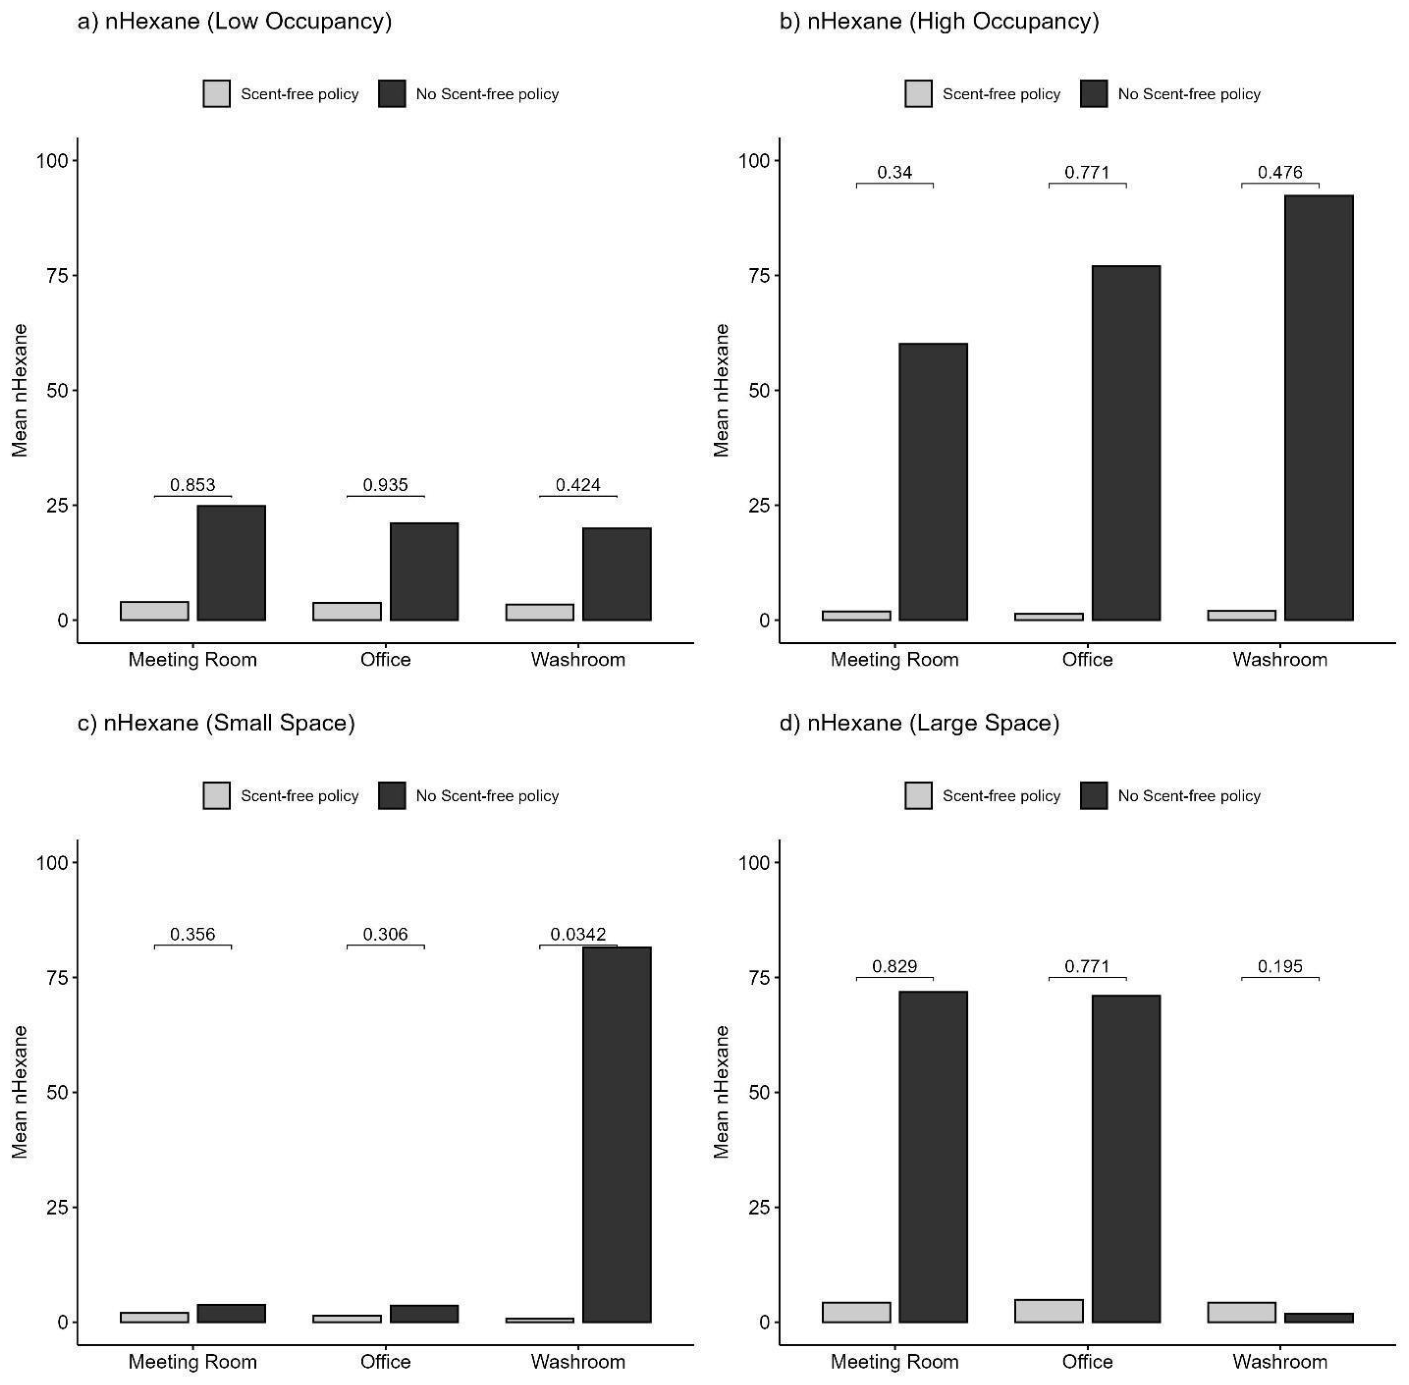
Figure 7.
Average Pentane concentration by office space and Scent-free policy enforcement. P-values follow Mann–Whitney U Tests for concentrations between policy and non-policy across office spaces, by office occupancy and size.
Figure 7.
Average Pentane concentration by office space and Scent-free policy enforcement. P-values follow Mann–Whitney U Tests for concentrations between policy and non-policy across office spaces, by office occupancy and size.
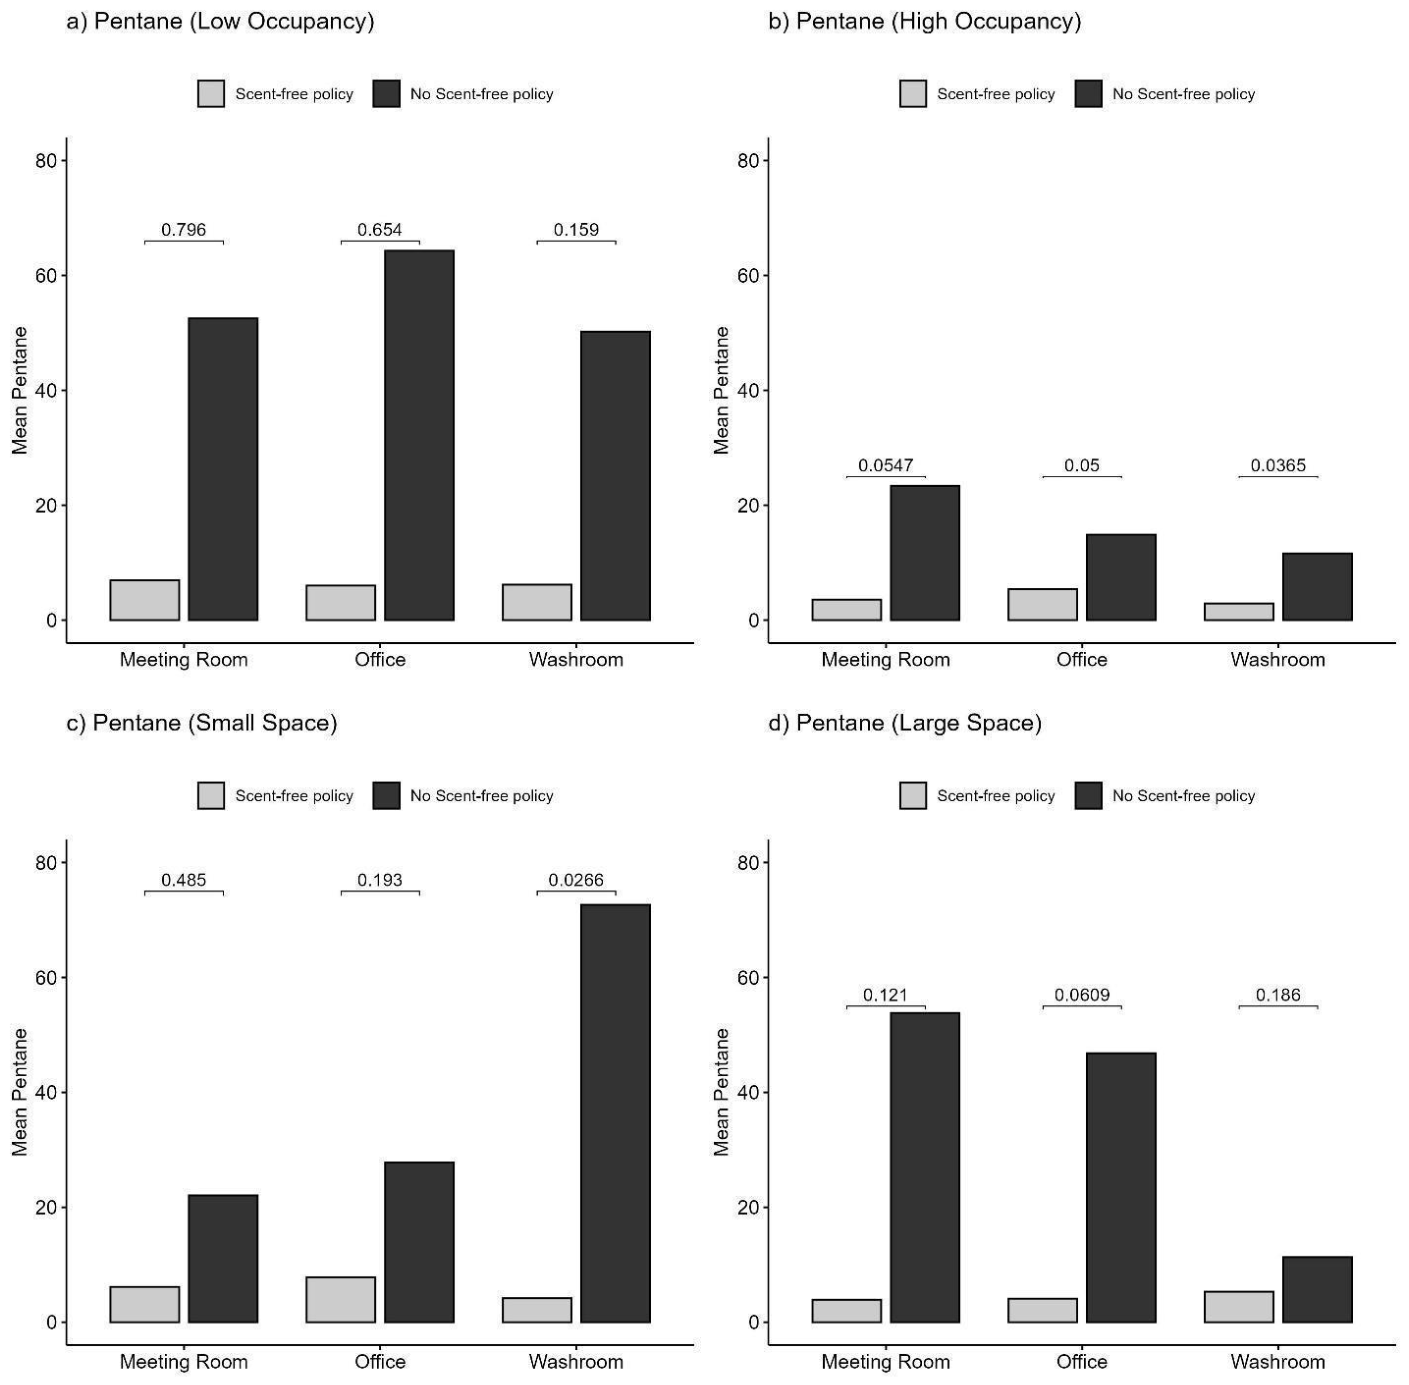
Figure 8.
Average TVOC concentration by office space and Scent-free policy enforcement. P-values follow Mann–Whitney U Tests for concentrations between policy and non-policy across office spaces, by office occupancy and size.
Figure 8.
Average TVOC concentration by office space and Scent-free policy enforcement. P-values follow Mann–Whitney U Tests for concentrations between policy and non-policy across office spaces, by office occupancy and size.
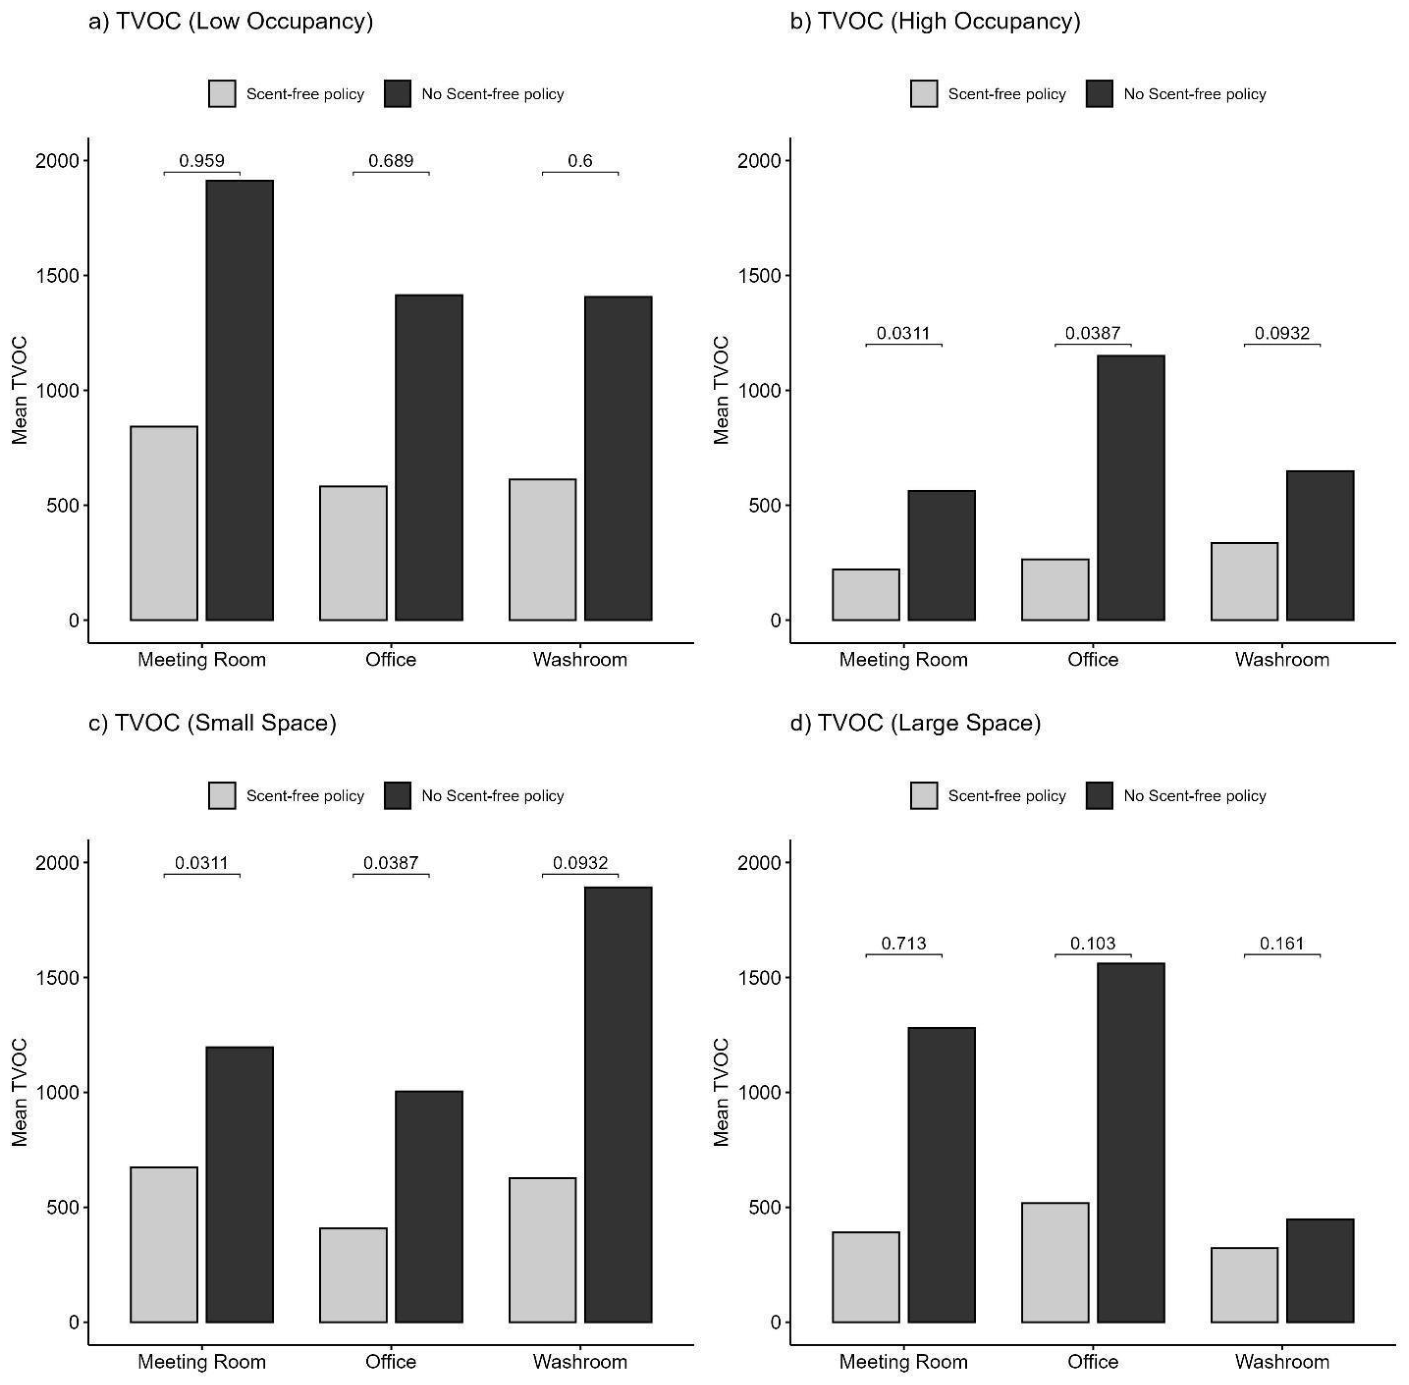
Figure 9.
TVOCs in Office Spaces with and without Scent-free policies vs Well-Standard [52].
Figure 9.
TVOCs in Office Spaces with and without Scent-free policies vs Well-Standard [52].
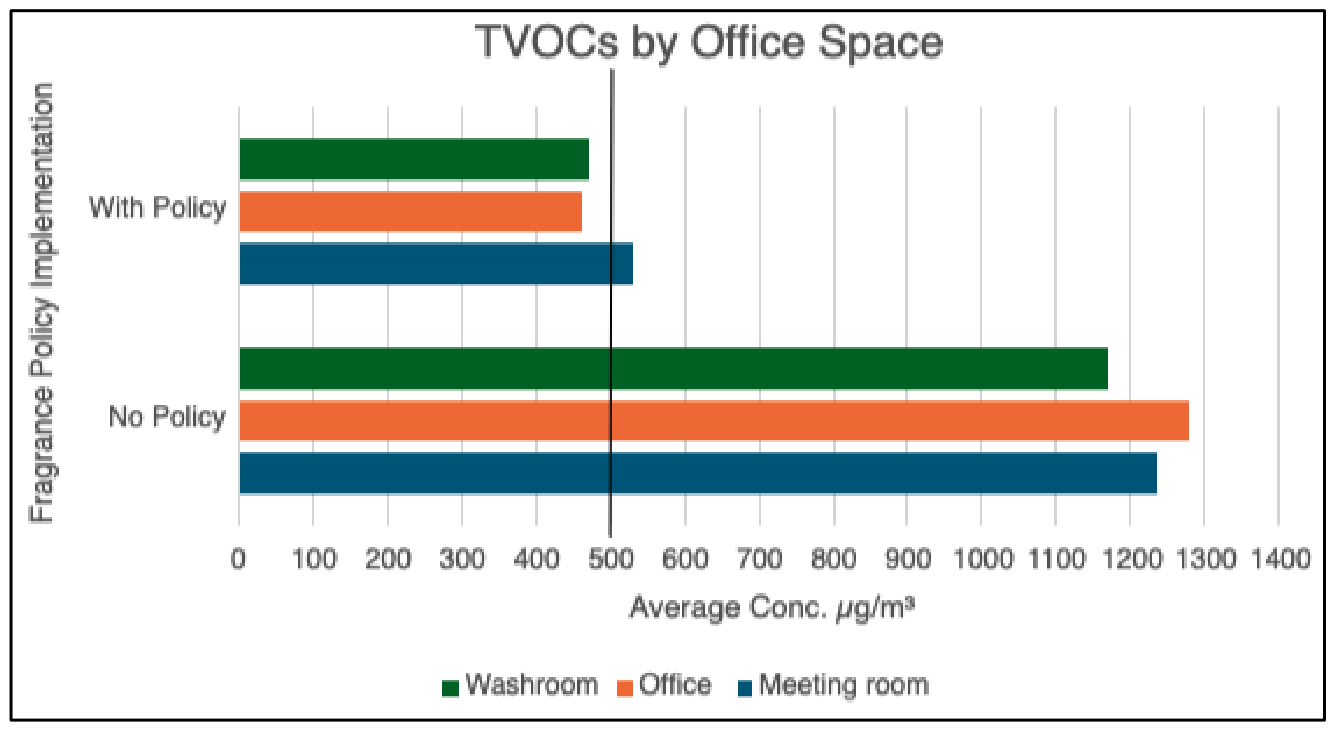
Figure 10.
Concentrations of VOCs Listed on Health Canada’s Residential Indoor Air Quality Guidelines and comparison between Office Spaces with and without Scent-free policies [4].
Figure 10.
Concentrations of VOCs Listed on Health Canada’s Residential Indoor Air Quality Guidelines and comparison between Office Spaces with and without Scent-free policies [4].
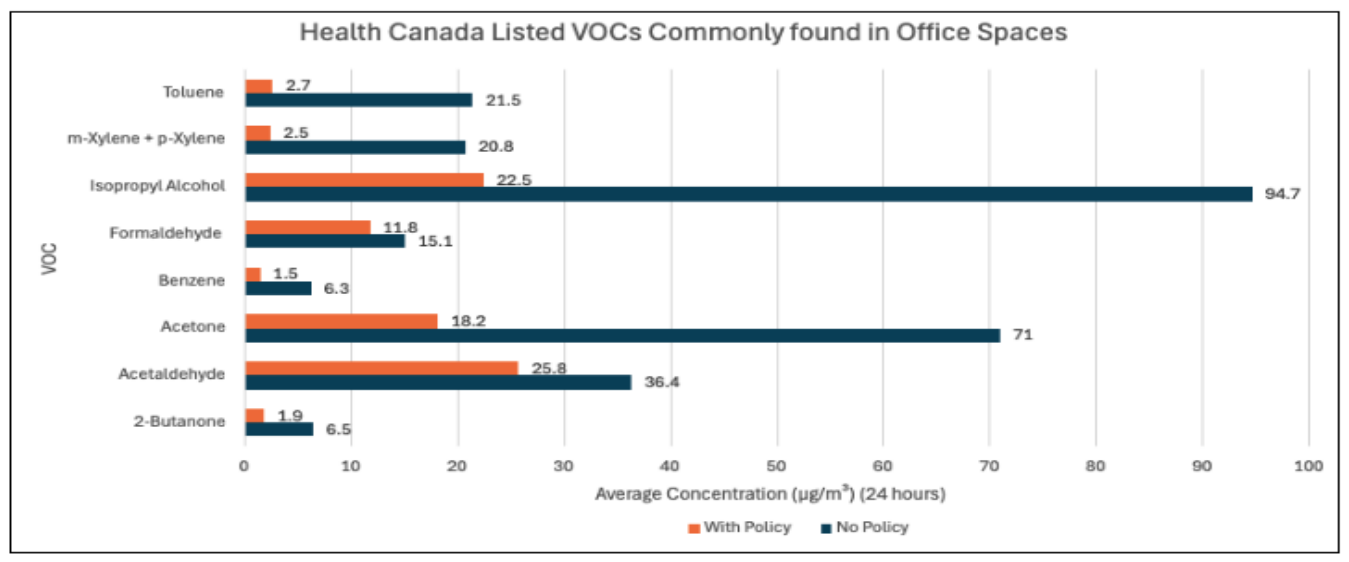

Table 1.
Evaluation of IAQ Results Against Canadian Threshold Guidelines.
| IAQ Parameter | Guideline Threshold |
Average Value |
Average Value |
Offices Not Meeting Guidelines |
Offices Not Meeting Guidelines |
| With Policies | No Policies | With Policies n (%) | No Policies n (%) | ||
| CO₂ (ppm) n=32 | < 1000 | 669 | 563 | 2/16 (12.5%) | 0 (0) |
| CO (ppm) n=32 | < 10.0 | 0.57 | 1.8 | 0 (0) | 0 (0) |
| PM₂.₅ n=32 (mg/m³) | Unknown | 0.004 | 0.004 | - | - |
| Temperature (°C) n=32 | 23.0 - 25.5 | 23.1 | 22.9 | 9/16 (56.2%) | 9/16 (56.2%) |
| Relative Humidity (%) n=32 | 30.0 - 60.0 | 35.5 | 29.9 | 11/16 (68.8%) | 8/16 (50.0%) |
| Formaldehyde (µg/m³) n=32 | < 50.0 | 11.9 | 15.1 | 0 (0) | 1/16 (6.2%) |
| TVOCs (µg/m³) | < 500 | 489.3 | 1,229.8 | 5/16 (31.2%) | 9/16 (56.2%) |
| Acetaldehyde (µg/m³) n=30 | < 280 | 25.8 | 36.4 | 0 (0) | 0 (0) |
| Acrolein (µg/m³) n=12 | < 0.44 | 0.667 | 0.808 | 1/5 (20%) | 2/7 (28.6%) |
| Benzene (µg/m³) n=22 | No safe level | 1.4 | 6.12 | 7/7 (100%) | 15/15 (100%) |
| Toluene (µg/m³) n=31 | < 2,300 | 2.71 | 21.5 | 0 (0) | 0 (0) |
| m-/p-xylene (µg/m³) n=25 | < 150 | 2.58 | 17.9 | 0 (0) | 1/14 (7.1%) |
TVOCs thresholds adopted from International WELL Building Institute Standard (8 hours) [52]. VOCs thresholds adopted from Health Canada’s Residential Indoor Air Quality Guidelines [4]. Temperature and relative humidity adopted from ASHRAE 55-2023 (8 hours) n represents number of buildings in which the pollutant was detected
Table 2.
Associations Between Hazardous Indoor Air Pollutants and Scent-free policies using gamma family, log-link.
Table 2.
Associations Between Hazardous Indoor Air Pollutants and Scent-free policies using gamma family, log-link.
| Multivariable regression (gamma family, log link function) | ||||||
| Acetaldehyde | Acetone | Toluene | TVOCs | o-Xylene | m-/p-Xylenes | |
| Adjusted OR (95% CI) | ||||||
| Policy | ||||||
| Without policy |
2.17 (1.05-4.38)* |
7.72 (4.07-14.51)*** |
3.40 (1.17-9.90)* |
3.90 (2.02-7.40)*** |
15.49 (5.64-44.31)*** |
6.86 (2.39-19.04)*** |
| With policy | Ref | Ref | Ref | Ref | Ref | Ref |
| Site | ||||||
| Meeting room | Ref | Ref | Ref | Ref | Ref | Ref |
| Office | 1.26 (0.55-2.81) |
0.72 (0.32-1.55) |
1.23 (0.29-5.02) |
1.29 (0.60-2.71) |
0.61 (0.19-1.92) |
1.08 (0.29-4.14) |
| Washroom | 1.21 (0.45-3.40) |
0.48 (0.19-1.22) |
0.43 (0.10-1.97) |
0.81 (0.32-2.12) |
1.42 (0.42-4.78) |
1.20 (0.28-5.08) |
| Size | 0.58 (0.25-1.38) |
1.01 (0.53-1.92) |
1.06 (0.34-3.17) |
0.86 (0.45-1.66) |
2.88 (0.79-12.03) |
1.38 (0.42-4.98) |
| Occupancy | 1.19 (0.64-2.15) |
0.54 (0.25-1.13) |
0.42 (0.11-1.62) |
0.57 (0.32-1.00) |
N/A | N/A |
| Ventilation rate | 0.82 (0.53-1.35) |
0.60 (0.40-0.92)* |
0.39 (0.21-0.74) |
0.60 (0.40-0.95)* |
0.59 (0.26-1.30) |
N/A |
| McFadden’s R² | 0.031 | 0.119 | 0.154 | 0.048 | 0.231 | 0.066 |
| Note: Data are Odds Ratio (95% confidence interval); *p<0.05, **p<0.01, p<***<0.001; N/A = Variable excluded due to failed convergence | ||||||
Disclaimer/Publisher’s Note: The statements, opinions and data contained in all publications are solely those of the individual author(s) and contributor(s) and not of MDPI and/or the editor(s). MDPI and/or the editor(s) disclaim responsibility for any injury to people or property resulting from any ideas, methods, instructions or products referred to in the content. |
© 2026 by the authors. Licensee MDPI, Basel, Switzerland. This article is an open access article distributed under the terms and conditions of the Creative Commons Attribution (CC BY) license (http://creativecommons.org/licenses/by/4.0/).
Copyright: This open access article is published under a Creative Commons CC BY 4.0 license, which permit the free download, distribution, and reuse, provided that the author and preprint are cited in any reuse.


