
Submitted:
08 July 2026
Posted:
09 July 2026
You are already at the latest version
Abstract
Accurate quantification of wildfire risk is essential for balancing wildfire mitigation and prescribed fire management in grassland ecosystems, yet existing fire danger indices do not explicitly distinguish seasonal fuel dynamics from daily weather variability. This study presents a hierarchical framework for quantifying wildland fire risk by explicitly separating seasonal wildfire potential from daily weather-driven fire activity. The framework introduces the Daily Burned Area Ratio (DBAR) as a quantitative measure of realized wildfire risk and decomposes it into the Seasonal Burned Area Ratio (SBAR) and the Daily Burn Activity Index (DBAI). Wildfire records from the U.S. Forest Service Fire Program Analysis Fire-Occurrence Database, Oklahoma Mesonet weather observations, and remotely sensed vegetation data collected between 1995 and 2020 were used to develop and evaluate the framework in the Flint Hills of Kansas and Oklahoma. SBAR was modeled using grass curing and air temperature to characterize the seasonal baseline of wildfire activity, whereas DBAI was modeled using dead fuel moisture content (DFMC) and wind speed to quantify day-to-day departures from that seasonal baseline. The SBAR model accurately reproduced the characteristic bimodal wildfire regime of the Great Plains, whereas the DBAI model identified DFMC as the dominant control on daily wildfire activity, with wind speed providing an important secondary influence. Compared with the Burning Index (BI) and the Grassland Fire Danger Index (GFDI), the hierarchical framework achieved superior performance in discriminating fire days from non-fire days. Global sensitivity analysis further demonstrated that the framework provides a more balanced representation of the influences of grass curing, relative humidity, air temperature, and wind speed than the conventional indices. By explicitly separating seasonal fuel dynamics from short-term weather variability, the proposed framework provides an ecologically interpretable, locally calibratable, and operationally practical approach to wildfire risk assessment. Because the seasonal and daily components can be calibrated independently, the framework is readily transferable to other grassland ecosystems and provides a flexible foundation for adaptive wildfire and prescribed fire management under changing climatic conditions.
Keywords:
wildfire risk
; prescribed fire
; fire danger index
; grass curing
; dead fuel moisture content
; Great Plains
; hierarchical modeling
; grassland fire
; prescribed burning
1. Introduction
Wildfire activity has increased globally over recent decades, driven by climate change, fuel accumulation associated with long term fire suppression, and expanding human development in fire prone landscapes [1,2,3,4]. Wildfires pose significant threats to human life, infrastructure, air quality, ecosystem services, and biodiversity, while altering natural fire regimes in both forest and grassland ecosystems [5]. In the Great Plains of the United States, recurrent droughts, reduced fire use, and continued expansion of the wildland-urban interface have contributed to increasing wildfire activity during the past three decades [1,6,7]. At the same time, prescribed fire remains one of the most effective management practices for maintaining grassland ecosystems by reducing woody plant encroachment, improving biodiversity, sustaining forage production, and mitigating future wildfire risk [8,9]. However, the application of prescribed fire is often constrained by concerns regarding fire escape, smoke management, and the limited availability of reliable tools for quantitatively assessing wildfire risk under grassland conditions [3,10,11,12,13].
Wildfire behavior in Great Plains grasslands is governed by interactions among fuel condition, weather, and vegetation phenology. Wind speed, air temperature, and relative humidity (RH) strongly influence ignition and fire spread through their effects on dead fuel moisture content (DFMC), which responds rapidly to changing atmospheric conditions [14]. In contrast, grass curing reflects seasonal changes in vegetation phenology and determines the amount and continuity of combustible fine fuels. Because grass curing evolves gradually throughout the year whereas DFMC responds over periods of hours to days, wildfire risk in grasslands is controlled by processes operating at distinctly different temporal scales. This distinction is particularly important for prescribed fire management, where managers must simultaneously consider seasonal fuel availability and daily weather conditions when selecting suitable burn windows. Although prescribed burns in the Great Plains have traditionally been conducted within a relatively narrow spring window [10,11,15,16,17], a more quantitative understanding of both seasonal and daily wildfire risk is needed to safely expand prescribed burning opportunities while maintaining acceptable levels of fire risk.
Many fire danger indices have been developed to support wildfire management, including the Keetch-Byram Drought Index (KBDI), the Burning Index (BI), and McArthur’s Grassland Fire Danger Index (GFDI). These indices have substantially improved operational fire management but were generally developed for specific climatic regions, vegetation types, or management objectives. KBDI primarily represents cumulative drought conditions and does not adequately capture the rapid changes in fine-fuel moisture characteristic of grasslands [18,19,20,21]. BI emphasizes fire intensity and suppression difficulty but relies on standardized fuel models and daily weather summaries that may not adequately represent the rapidly changing weather and heterogeneous fuel conditions of Great Plains prairies [22,23]. GFDI explicitly incorporates grassland fuels and has been widely applied in Australia, but previous evaluations have demonstrated reduced performance when applied without regional calibration [24,25,26,27,28,29,30]. Specifically, an attempted calibration of the Mark 4 GFDI in the Great Plains showed a tendency to underestimate fire danger under low RH and challenged wind parameterization [28]. The existing fire danger indices generally do not explicitly distinguish between slowly varying seasonal fuel dynamics and rapidly changing daily weather conditions, limiting their ability to represent wildfire risk in Great Plains grasslands.
Many wildfire prediction studies estimate fire occurrence or ignition probability, whereas operational fire danger indices generally characterize the potential for fire ignition and spread. Burned area complements these approaches by integrating both wildfire occurrence and subsequent fire growth, thereby providing a quantitative measure of realized wildfire activity. Wildfire activity in grassland ecosystems is governed by two fundamentally different temporal processes: a slowly varying seasonal background established by vegetation phenology and climatic conditions, and rapidly changing day-to-day variability driven by weather and fine fuel moisture. Explicitly separating these temporal components provides a more interpretable representation of wildfire risk while allowing the underlying ecological processes to be modeled independently.
To better represent these distinct temporal processes, this study proposes a hierarchical framework for quantifying wildfire risk in Great Plains grasslands. The principal innovation of the framework is the explicit separation of wildfire risk into the Seasonal Burned Area Ratio (SBAR) and the Daily Burn Activity Index (DBAI), whose product defines the Daily Burned Area Ratio (DBAR), a quantitative measure of realized wildfire risk. SBAR characterizes the seasonal baseline established by grass curing and climatic conditions, whereas DBAI quantifies day-to-day departures from that baseline resulting from short term weather variability and fine fuel moisture dynamics. Using wildfire records from the U.S. Forest Service Fire Program Analysis Fire-Occurrence Database, Oklahoma Mesonet weather observations, and remotely sensed vegetation data collected from 1995 to 2020, the objectives of this study were to: (1) develop a hierarchical framework for quantifying wildfire risk in Great Plains grasslands; (2) model seasonal and daily wildfire risk using locally calibrated fuel and weather variables; (3) evaluate the performance of the proposed framework against BI and GFDI; and (4) assess its potential application to prescribed fire management.
2. Materials and Methods
2.1. Study Area
The Flint Hills ecoregion is located within the central Great Plains and extends across eastern Kansas into the Osage Hills of northern Oklahoma, centered near 37.3° N, 96.7° W. The region encompasses approximately 2.4 million ha and ranges in elevation from 320 to 512 m above sea level [31]. Shallow, rocky limestone soils have limited agricultural cultivation, allowing one of the largest remaining expanses of native tallgrass prairie in North America to persist [32]. The Flint Hills experience a continental climate characterized by hot, humid summers and cold winters. Mean annual precipitation is approximately 800 mm, with the majority occurring during late spring and early summer [33]. The vegetation is dominated by warm season perennial grasses, including big bluestem (Andropogon gerardii), little bluestem (Schizachyrium scoparium), Indiangrass (Sorghastrum nutans), and switchgrass (Panicum virgatum), together with a diverse assemblage of native forb species [32]. Owing to its ecological integrity and biodiversity, the Flint Hills represent the largest remaining tract of tallgrass prairie in North America and are recognized as a globally significant grassland ecosystem.
Fire is the principal ecological process maintaining the structure and function of the Flint Hills grasslands. Prescribed burning, typically conducted during the spring, is widely used in combination with livestock grazing to maintain forage productivity, suppress woody plant encroachment, recycle nutrients, and preserve native prairie communities [10,13,34]. The Flint Hills provide an ideal landscape for developing and evaluating quantitative fire risk models to support prescribed fire management. Although the proposed framework is generally applicable across the Great Plains, model development was conducted using Kay and Osage Counties in the Oklahoma Flint Hills because they provide continuous long term wildfire, meteorological, and fuel condition datasets representative of the region.
2.2. Wildfire Data
Wildfire records were obtained from the U.S. Forest Service’s Fire Program Analysis Fire-Occurrence Database (FPA-FOD), Version 6, which contains standardized wildfire records from 1992 to 2020 [35]. The FPA-FOD is the most comprehensive publicly available wildfire database in the United States and has been widely used for regional wildfire analyses. It consolidates incident reports from federal, state, local, tribal, and other participating agencies using standardized reporting procedures established by the National Wildfire Coordinating Group (NWCG). Each wildfire record includes spatial coordinates with a minimum reported accuracy of the Public Land Survey System (PLSS) section, providing sufficient spatial resolution for regional scale analyses. Although the FPA-FOD underwent extensive quality assurance and quality control during database development, additional preprocessing was performed to improve data consistency for this study. Duplicate records were identified and removed. Missing county information was assigned by spatially joining wildfire ignition locations to U.S. county boundaries using the tigris package [36] and spatial operations implemented in the sf package [37] within R (version 4.3.1). After preprocessing, 6126 wildfire records were retained for the 17 counties comprising the Flint Hills study area, representing a cumulative burned area of 439,380 ha. From the 50 attributes available in the FPA-FOD database, wildfire size, discovery date, county, and fire size class were retained because they directly support quantification of wildfire occurrence and burned area for subsequent risk modeling. Fire size classes followed the NWCG classification system: Class A (<0.1 ha), Class B (0.1 to <4 ha), Class C (4 to <40 ha), Class D (40 to <120 ha), Class E (120 to <400 ha), Class F (400 to <2000 ha), and Class G (≥2000 ha).
2.3. Fire Weather Data
Fire weather data were obtained from the Oklahoma Mesonet, a statewide environmental monitoring network that provides standardized, quality controlled meteorological observations [38,39,40]. Weather records for Kay and Osage Counties from 1995 to 2020 were retrieved and processed using the mesonet package in R [41]. The Skiatook (SKIA) and Blackwell (BLAC) Mesonet stations were selected to represent Osage and Kay Counties, respectively. Kay and Osage Counties were selected for model development because they provide the longest continuous records of wildfire occurrence, weather observations, and remotely sensed fuel condition data within the Flint Hills. Together, these counties span the northern and southern portions of the Oklahoma Flint Hills and accounted for 37.1% of the recorded wildfires and 53.8% of the cumulative burned area in the Flint Hills during 1995–2020. They provide a representative case study for developing the proposed fire risk framework. Meteorological variables included air temperature, RH, sustained wind speed measured at a 10-m height, and precipitation, following the Oklahoma Mesonet observation protocols [40]. Five minute observations were aggregated to hourly and daily time scales for subsequent analyses. Aggregation to daily summaries was performed to match the temporal resolution of the wildfire occurrence records. Daily weather variables included mean and maximum air temperature, mean and minimum RH, mean and maximum wind speed, and total daily precipitation. Daily weather observations were linked to wildfire records by county and date. Day of year (DOY) was retained as a temporal variable to characterize seasonal fire dynamics and facilitate subsequent fire risk modeling.
2.4. Fuel Moisture Data
Fuel conditions were represented using two complementary indicators that capture distinct temporal scales of fire dynamics: DFMC, which reflects short term variations in fuel flammability, and grass curing, which characterizes seasonal changes in fuel condition and phenology. Because DFMC responds rapidly to atmospheric conditions, it was used to represent short term fuel moisture dynamics and served as a predictor of the DBAI. Calibrated DFMC was obtained from the Oklahoma Mesonet, and for missing data points, DFMC was estimated from air temperature and RH using a regional empirical model developed for the Great Plains [42]. Grass curing was used to characterize seasonal changes in fuel condition. It is defined as the proportion of dead material within the grass sward [43,44] and influences both fuel availability and combustibility over the growing season. Following Newnham et al. [45], grass curing was estimated from relative greenness, an NDVI-based metric scaled from 0 to 100% using a multi-year, pixel specific historical record, where higher relative greenness corresponds to lower levels of curing [46]. Relative greenness was calculated from temporally smoothed NDVI observations to reduce residual cloud contamination and short-term fluctuations unrelated to vegetation phenology. This approach has been widely adopted in remote sensing and fire ecology studies for monitoring seasonal fuel condition and assessing grassland fire potential [43,44,45,46]. Together, DFMC and grass curing represent the short term and seasonal components of fuel dynamics, respectively, and provide the fuel related predictors used in the hierarchical fire risk modeling framework.
2.5. Hierarchical Fire Risk Framework of the Daily Burned Area Ratio (DBAR)
The proposed hierarchical framework decomposes wildfire risk into a seasonal component representing slowly varying fuel dynamics and a daily component representing short term weather variability. The framework assumes that seasonal vegetation phenology establishes the baseline level of wildfire activity, whereas short term weather conditions determine day-to-day departures from that seasonal baseline. DBAR is expressed as:
DBAR = SBAR × DBAI
The multiplicative formulation reflects the assumption that seasonal background conditions establish the baseline level of wildfire activity, while daily weather conditions amplify or suppress fire activity relative to that baseline. This decomposition explicitly separates the ecological processes governing wildfire activity at seasonal and daily time scales, thereby improving both model interpretability and regional transferability.
DBAR is defined as the ratio of daily wildfire burned area to the total persistent rangeland area and serves as a quantitative measure of realized wildfire activity. Unlike conventional fire danger indices, which primarily estimate the potential for fire occurrence or fire spread, DBAR integrates both wildfire occurrence and burned extent, and it provides a more comprehensive measure of realized wildfire risk than fire occurrence alone. SBAR is defined as the ratio of the seasonal baseline daily burned area to the total persistent rangeland area. SBAR represents the expected background level of wildfire activity for a given season and primarily reflects the cumulative effects of vegetation phenology and longer term climatic conditions. DBAI is defined as the ratio of the observed daily burned area to the corresponding seasonal baseline daily burned area. DBAI quantifies the day-to-day departure of wildfire activity from the seasonal baseline and primarily reflects short term variations in weather and fine fuel moisture. DBAI is a dimensionless multiplier, where values greater than one indicate above average fire activity relative to the seasonal baseline, whereas values less than one indicate below average activity.
The hierarchical fire risk framework is summarized in in Figure 1 and Table 1. In the framework, SBAR was modeled using grass curing and air temperature to characterize seasonal fuel dynamics and climatic variability, whereas DBAI was modeled using DFMC and wind speed to represent short term meteorological controls on wildfire activity. These two components provide complementary representations of the seasonal baseline and daily variability in wildfire risk.
2.6. Modeling of the Seasonal Burned Area Ratio (SBAR)
Persistent rangeland area was delineated using the National Land Cover Database (NLCD) products for 2001, 2006, 2011, 2016, and 2019 [47]. Land cover classes representing shrub/scrub, grassland/herbaceous, and pasture/hay were considered rangelands. Pixels classified as rangeland in at least three of the five NLCD products were retained to generate a persistent rangeland mask, which was used to calculate the total rangeland area for each study region. Wildfire records were aggregated into daily burned area totals for each county by DOY. The seasonal baseline daily burned area was estimated as the multi-year mean daily burned area for each DOY. To separate seasonal trends from short term variability, the multi-year average burned area, grass curing, and mean daily air temperature were independently smoothed using generalized additive models (GAMs) with Gamma distributions, log-link functions, and cyclic cubic regression splines (k = 7). A value of k = 7 was selected because it adequately captured the annual seasonal cycle while avoiding overfitting.
Previous studies have shown that wildfire activity in the grassland dominated Great Plains exhibits a consistent bimodal seasonal pattern, with a primary peak in spring before green-up and a secondary peak in autumn after vegetation senescence [7]. Because seasonal fire activity is largely governed by vegetation phenology and climatic conditions [43,48], grass curing and air temperature were selected as the primary predictors of SBAR. Other factors, including fuel load and continuity, land use change, wildland-urban expansion, grazing, drought, prescribed fire frequency, and fire suppression, may also influence seasonal fire activity [8,49,50,51,52,53]. However, these variables are difficult to quantify consistently across large spatial and temporal scales and were therefore not explicitly incorporated into the model. The SBAR model was developed as a locally calibrated empirical relationship. A case study SBAR model was developed using wildfire records from Kay and Osage Counties, Oklahoma, consistent with the data selection described above. The persistent rangeland area within the two counties totaled 465,928 ha. The two counties were broadly representative of regional fire activity. Separate power function models were developed for the first and second halves of the year to account for the distinct spring and autumn fire seasons. Model parameters were estimated using nonlinear least squares regression with the Gauss-Newton algorithm, and parameter uncertainty was quantified using nonparametric bootstrap confidence intervals. The objective of this study was to develop a transferable hierarchical modeling framework rather than a single region-wide empirical equation. Therefore, model development was conducted using two representative counties with complete long term datasets, while the framework itself is designed to be recalibrated for other locations using local wildfire, weather, and fuel-condition data.
2.7. Modeling of the Daily Burn Activity Index (DBAI)
Daily wildfire and weather records from Kay and Osage Counties were merged by county and date to create a unified dataset for modeling daily fire activity. Exploratory analyses indicated that larger wildfires exhibited stronger and more consistent relationships with dead fuel moisture content DFMC and wind speed than smaller fires. Accordingly, the DBAI analysis was restricted to days with a total burned area exceeding 60 ha, thereby emphasizing environmental conditions associated with sustained wildfire growth and spread rather than fire ignition alone. Preliminary analyses indicated that relationships between weather variables and wildfire activity became considerably more consistent once fires exceeded approximately 60 ha, representing events dominated by spread rather than ignition processes. To further isolate fire conducive conditions, the analysis was limited to observations with mean daily air temperature above 2 °C, no recorded precipitation, and an SBAR of at least 0.02%. The SBAR threshold prevented numerical instability in DBAI calculations when the seasonal baseline burned area approached zero. Because DBAI is calculated as the ratio of observed daily burned area to SBAR, very small SBAR values can produce disproportionately large and unstable DBAI estimates. After applying these screening criteria, the final dataset contained 106 daily observations. Observed DBAI values were modeled using a generalized linear model (GLM) with a Gamma error distribution and a log-link function. DBAI was expressed as a function of DFMC and the square root of maximum daily wind speed, with the latter transformation accounting for the nonlinear influence of wind speed on wildfire activity reported in previous studies [24,54]. The DBAI model quantifies the short term amplification or suppression of wildfire activity relative to the seasonally expected baseline represented by SBAR.
2.8. Performance Evaluation and Comparison with Existing Fire Danger Indices
The ability of DBAR, BI, and GFDI to discriminate fire days from non-fire days was evaluated using binary logistic regression following the approach of Andrews et al. [55]. BI values were obtained from the Oklahoma Mesonet, whereas GFDI values were calculated according to the formulation of Purton [26]. Daily wildfire records from Kay and Osage Counties were classified into two categories based on total daily burned area. Days with burned areas exceeding 20 ha were defined as fire days (1), whereas all remaining days were classified as non-fire days (0). Separate logistic regression models were fitted for DBAR, BI, and GFDI, with each fire danger index serving as the sole predictor of fire-day occurrence. Model discrimination was evaluated using the area under the receiver operating characteristic curve (AUC-ROC) [56] and the pseudo coefficient of determination (R2). The ROC curve was constructed by plotting the true positive rate against the false positive rate across all possible classification thresholds. The AUC summarizes the overall discriminatory ability of each index, where a value of 0.5 indicates no discrimination and a value of 1.0 indicates perfect discrimination between fire and non-fire days. AUC values between 0.7 and 0.8 indicate acceptable discrimination, whereas values exceeding 0.8 indicate excellent performance [57,58].
2.9. Global Sensitivity Analysis
A global sensitivity analysis was conducted using the delta moment-independent method [59,60] and implemented using the open source Python package SALib [61]. This approach quantifies the influence of each input variable on the entire output distribution rather than only on its variance, making it well suited for nonlinear fire danger models. The delta sensitivity measure (δᵢ) is defined as
where Y denotes the output of the fire danger index (DBAR, BI, or GFDI), Xᵢ represents an individual input variable (RH, air temperature, maximum sustained wind speed, or grass curing), fY(y) is the unconditional probability density function of the model output, and fY|Xᵢ(y) is the conditional probability density function when Xᵢ is fixed. The expectation 𝔼[·] is taken over the full range of Xᵢ. The delta index quantifies the average change in the output distribution caused by fixing an individual input variable. Values range from 0, indicating no influence on the model output, to 1, indicating complete determination of the output by that variable. Larger δᵢ values indicate greater sensitivity of the fire danger index to the corresponding input. Uncertainty in the sensitivity estimates was quantified using 100 bootstrap resamples.
δᵢ = ½ 𝔼[∫|fY(y) − fY|Xᵢ(y)|dy]
3. Results
3.1. Seasonal Wildfire Patterns
Wildfire activity in the grassland dominated regions of the Great Plains exhibited a distinct bimodal seasonal pattern, with a primary peak in spring and a secondary peak in autumn (Figure 2). Across Kansas and Oklahoma, the spring peak generally occurred in late March before grass green-up, whereas the autumn peak occurred in late October after vegetation senescence. This seasonal pattern is consistent with previous studies of wildfire occurrence in Great Plains grasslands [7].
Pronounced spatial variation in SBAR was observed across the study region (Figure 2). In general, southern regions exhibited higher SBAR values than northern regions throughout the year. The timing of both the spring and autumn SBAR peaks also followed a clear south to north progression. The primary spring peak occurred on DOY 60 in southern Oklahoma, DOY 63 in northern Oklahoma, DOY 70 in southern Kansas, and DOY 73 in northern Kansas. In contrast, the autumn SBAR peak was negligible in southern Kansas. The observed spatial and temporal differences in SBAR indicate that seasonal wildfire activity varies systematically across the Great Plains, with both the magnitude and timing of peak fire activity changing along the north-south climatic gradient. These spatial and temporal patterns define the seasonal baseline of wildfire activity that the SBAR model seeks to quantify.
3.2. Modeling the Seasonal Burned Area Ratio (SBAR)
SBAR was modeled as a power-law function of smoothed grass curing (0–100%) and smoothed air temperature (T, °C):
SBAR = α × Curingβ1 × Tβ2
Separate models were developed for the first (H1, DOY ≤ 182) and second (H2, DOY > 182) halves of the year. Estimated model parameters are presented in Table 2.
The fitted SBAR model reproduced the characteristic bimodal seasonal wildfire pattern in the Flint Hills (Figure 3), with a primary peak of 0.034% in late March and a secondary peak of 0.010% in mid-October. Across the annual cycle, the smoothed air temperature ranged from 2.9 to 27.5 °C. The exponent for grass curing (β1) was substantially larger during H1 than during H2, indicating that SBAR was considerably more sensitive to grass curing during the first half of the year. This result suggests that grass curing is the dominant driver of seasonal wildfire risk before peak green-up, whereas its influence becomes much weaker during the second half of the year. In contrast, the temperature exponent (β2) differed only modestly between the two seasonal models. Overall, the SBAR model provided an excellent representation of the seasonal fire regime in the Flint Hills, explaining 97% of the variation in the smoothed seasonal burned area ratio (R2 = 0.97) with a cross-validated root mean square error (RMSE) of 0.001%.
3.3. Modeling the Daily Burn Activity Index (DBAI)
DBAI was modeled as an exponential function of DFMC (%) and maximum sustained 10-m wind speed (U, km h−1):
Estimated model parameters are presented in Table 3.
Both maximum sustained wind speed and DFMC were statistically significant predictors (p < 0.05). The fitted model explained 20.3% of the day-to-day variation in DBAI. During the study period, DFMC ranged from 5% to 17%, whereas maximum sustained 10-m wind speed ranged from 14 to 55 km h⁻1 (9–34 mph). Compared with SBAR, DBAI represents short term weather driven variability and therefore exhibits substantially greater day-to-day variation. The negative coefficient for DFMC indicates that daily fire activity increased as fine fuels became drier, whereas the positive wind speed coefficient indicates that stronger winds further amplified wildfire activity under dry fuel conditions. The model indicates that DFMC exerted a stronger influence on DBAI than wind speed over the observed range of conditions.
3.4. Performance of the Hierarchical DBAR Framework and Comparison with BI and GFDI
The hierarchical framework was evaluated by comparing its ability to discriminate fire days from non-fire days with two widely used fire danger indices: BI and GFDI, using receiver operating characteristic (ROC) analysis (Figure 4). All three indices produced ROC curves above the diagonal reference line representing random classification (AUC = 0.50), indicating meaningful discrimination between fire and non-fire days. Among the three indices, DBAR achieved the highest area under the ROC curve (AUC = 0.923), followed by BI (0.848) and GFDI (0.831), demonstrating superior discriminatory performance. Consistent with the ROC analysis, DBAR also explained the greatest proportion of variation in fire-day occurrence (pseudo-R2 = 0.316), compared with 0.258 for BI and 0.207 for GFDI. These results demonstrate that explicitly separating seasonal fuel dynamics from short term weather variability improves discrimination of fire days relative to conventional fire danger indices.
The cumulative distribution functions of DBAR, BI, and GFDI are presented in Figure 5. For all three indices, the cumulative distribution for fire days was consistently shifted toward higher index values relative to those for non-fire days and all days, indicating that increasing index values were associated with greater wildfire activity. Among the three indices, DBAR exhibited the greatest separation between the fire day and non-fire day distributions. In particular, the wider spacing among the 70th, 80th, and 90th percentile thresholds indicates that DBAR provides greater discrimination across moderate, high, and extreme fire conditions than either BI or GFDI.
Overall, the DBAR framework consistently outperformed BI and GFDI in both discrimination and explanatory power, demonstrating its potential as a quantitative fire risk metric for operational fire danger assessment and prescribed fire planning in the Great Plains. Given its superior predictive performance, the relative influence of the meteorological and fuel variables contributing to DBAR was further examined through global sensitivity analysis.
3.5. Global Sensitivity Analysis
The results of the delta moment-independent sensitivity analysis for DBAR, BI, and GFDI are presented in Figure 6. The three indices exhibited distinct sensitivity profiles with respect to the four input variables: RH, grass curing, wind speed, and air temperature. Among the three indices, BI exhibited the greatest sensitivity to RH, whereas GFDI was most sensitive to grass curing and showed comparatively little sensitivity to RH under Great Plains conditions. In contrast, DBAR exhibited substantially greater sensitivity to RH while maintaining strong sensitivity to grass curing. DBAR also remained responsive to wind speed and air temperature, indicating that all four input variables contributed meaningfully to the model response. Overall, DBAR exhibited a more balanced sensitivity profile across the four input variables than either BI or GFDI.
4. Discussion
4.1. Seasonal and Daily Controls on Wildfire Risk
Wildfire activity in Great Plains grasslands is governed by ecological processes operating at different temporal scales. Seasonal fuel dynamics establish the background level of wildfire potential, whereas short term weather conditions determine the extent to which wildfire activity deviates from that seasonal baseline. The proposed hierarchical framework was developed to explicitly represent these two complementary processes by separating wildfire risk into a seasonal component (SBAR) and a daily component (DBAI).
The SBAR model demonstrated that grass curing and air temperature accurately reproduced the characteristic bimodal wildfire regime of the Great Plains. Grass curing reflects seasonal vegetation phenology and directly controls the amount and continuity of combustible fine fuels. Previous studies have shown that fires rarely sustain when curing is below 20%, and sustained fire spread in grasslands generally requires more than 50% curing, with spread rate and flame height increasing rapidly above 60 to 70%, as vegetation becomes increasingly dormant [62,63]. The higher sensitivity of SBAR to grass curing during the first half of the year indicates that vegetation phenology is the dominant control on seasonal wildfire activity before peak green-up, whereas its influence becomes weaker during the latter half of the year. The earlier spring and autumn SBAR peaks observed in southern Oklahoma are also consistent with earlier grass curing and warmer temperatures associated with the regional climatic gradient.
The subdued autumn SBAR peak observed in southern Kansas is likely associated with the intensive spring prescribed burning practiced throughout the central Flint Hills. Frequent spring burning reduces fine fuel accumulation during the subsequent growing season, thereby limiting fuel continuity and wildfire potential later in the year [8,53]. Although additional factors such as grazing intensity, drought, land use change, and fire suppression also influence seasonal wildfire activity [64,65], the SBAR model captures the dominant seasonal controls using variables that are readily available across broad geographic regions.
Daily wildfire activity exhibited substantially greater variability than seasonal wildfire activity, reflecting the inherently stochastic nature of wildfire occurrence. The DBAI model identified DFMC as the dominant predictor of day-to-day wildfire activity, with wind speed acting as an important secondary control by enhancing fire spread under dry fuel conditions. DFMC integrates the combined effects of atmospheric conditions and vegetation moisture status and has long been recognized as one of the primary determinants of ignition probability and flame persistence [66,67]. Wind further increases fire spread through enhanced convective heat transfer and flame attachment to fine fuels [46,68]. The lower explanatory power of the DBAI model compared with the SBAR model was therefore expected because daily wildfire activity is additionally influenced by ignition timing, human activities, fuel continuity, grazing, suppression response, and other stochastic factors that are difficult to quantify consistently at regional scales.
4.2. Advantages of the Hierarchical Framework
The principal contribution of this study is the development of a hierarchical framework that explicitly separates seasonal wildfire potential from daily weather driven fire activity. Unlike conventional fire danger indices, which generally combine multiple meteorological and fuel variables into a single empirical metric, the proposed framework decomposes wildfire activity into a seasonal baseline represented by SBAR and a daily modifier represented by DBAI. This decomposition closely follows the ecological processes governing wildfire activity in grasslands, where vegetation phenology evolves gradually over weeks to months, whereas weather and fine fuel moisture fluctuate over hours to days. Explicitly separating these temporal scales provides several scientific and practical advantages. First, it improves model interpretability because each component corresponds to distinct ecological processes rather than representing a purely empirical relationship. Second, the framework allows seasonal and daily components to be calibrated independently, facilitating regional adaptation while maintaining a common conceptual structure. Third, the multiplicative formulation provides a straightforward interpretation of wildfire risk, in which seasonal fuel conditions establish the expected baseline level of wildfire activity and daily weather conditions either amplify or suppress wildfire activity relative to that baseline.
Although the empirical coefficients developed in this study are specific to the Flint Hills, the hierarchical framework itself is not region specific. The same conceptual approach may be applied to other grassland ecosystems by recalibrating the seasonal and daily component models using locally available wildfire, weather, and vegetation data. The framework therefore provides a flexible foundation for quantitative wildfire risk assessment across diverse fire prone landscapes.
4.3. Comparison with Existing Fire Danger Indices
The hierarchical DBAR framework consistently outperformed both BI and GFDI in discriminating fire days from non-fire days. The improved performance of DBAR is attributable not only to the hierarchical separation of seasonal and daily wildfire processes but also to the selection of predictors that more directly represent the underlying controls on wildfire activity.
One important distinction between the proposed framework and many conventional fire danger indices is the use of DFMC rather than individual meteorological variables to represent short term fuel conditions. DFMC integrates the combined effects of air temperature and RH on fine fuel flammability and therefore provides a more direct representation of the physical processes governing fire ignition and spread. In this study, the DFMC-based DBAI model explained substantially more variation in daily wildfire activity than a weather only model using air temperature, RH, and wind speed. Adding air temperature and RH to the DFMC model produced only negligible improvement, with neither variable remaining statistically significant. These results indicate that DFMC effectively captures the information contained in the individual meteorological variables while representing the underlying fuel condition more directly. Using DFMC simplifies the model without sacrificing predictive performance.
The global sensitivity analysis provides additional insight into the differences among the three fire danger indices. BI was strongly influenced by RH, reflecting its emphasis on short term atmospheric conditions. In contrast, GFDI was dominated by grass curing and exhibited comparatively little sensitivity to RH under Great Plains conditions. Previous evaluations have similarly reported that GFDI underrepresents the influence of atmospheric moisture when applied outside the Australian grasslands for which it was originally developed, highlighting the need for regional calibration [28]. Unlike BI and GFDI, DBAR exhibited a balanced sensitivity profile across RH, grass curing, wind speed, and air temperature. The increased sensitivity of DBAR to RH, while maintaining strong sensitivity to grass curing, is particularly important because RH strongly influences DFMC and, consequently, fire ignition and spread in Great Plains grasslands. Rather than depending predominantly on a single environmental driver, the hierarchical framework integrates both slowly varying seasonal fuel dynamics and rapidly changing atmospheric conditions. This balanced representation of fuel and weather controls provides a more realistic characterization of wildfire activity than conventional approaches.
4.4. Implications for Prescribed Fire Management
The proposed framework provides practical decision support for both strategic fire planning and day-to-day prescribed fire operations. The SBAR model identifies periods of elevated seasonal wildfire potential, allowing land managers to anticipate seasonal resource requirements, wildfire preparedness, and smoke management needs. In the Flint Hills, the primary SBAR peak in late March corresponds to the period of greatest dormant-season wildfire potential, suggesting that prescribed burning conducted outside this peak may reduce the probability of escaped fires while maintaining desired ecological outcomes.
The DBAI model complements the seasonal assessment by quantifying daily wildfire activity under prevailing weather conditions. Because DFMC can be estimated from routinely measured air temperature and RH [42], together with observed wind speed, the framework can be implemented operationally without requiring continuous field measurements of fuel moisture. Daily monitoring of DBAI therefore provides an objective basis for evaluating burn day suitability, estimating escape potential, allocating suppression resources, and communicating wildfire risk among land managers and regulatory agencies.
Growing evidence indicates that expanding prescribed burning beyond the traditional spring burn window can achieve many of the same ecological objectives while distributing fire activity more evenly throughout the year [11,69]. The hierarchical framework provides a quantitative basis for identifying such opportunities by simultaneously considering both seasonal fuel conditions and daily weather variability.
4.5. Limitations and Future Research
The hierarchical framework was developed using wildfire, weather, and vegetation data from Kay and Osage Counties because these counties provide long term, high quality datasets that are representative of the Flint Hills region. Although the empirical coefficients reported here are intended for local application, the framework itself is broadly transferable through regional calibration. Future studies should incorporate additional factors influencing wildfire activity, including fuel continuity, grazing intensity, prescribed fire history, vegetation structure, drought severity, and human ignition patterns. Emerging remote sensing products capable of monitoring live fuel moisture, biomass accumulation, and vegetation structure at increasingly high spatial and temporal resolutions provide additional opportunities for improving seasonal wildfire risk estimation. The hierarchical framework also offers a suitable foundation for integrating process-based fire behavior models and machine learning approaches while retaining the ecological interpretability that is often lacking in purely empirical models. Although this study focused on the Great Plains, the conceptual framework is applicable to any ecosystem in which wildfire activity is jointly controlled by slowly varying seasonal fuel conditions and rapidly changing weather. Explicitly separating these temporal processes provides a scientifically interpretable and operationally practical approach for wildfire risk assessment that can be adapted to a wide range of fire-prone landscapes.
5. Conclusions
This study presents a hierarchical framework for quantifying wildland fire risk by explicitly separating seasonal wildfire potential from daily weather driven fire activity in Great Plains grasslands. The framework introduces DBAR as a quantitative measure of realized wildfire risk and decomposes it into SBAR, representing the seasonal baseline of wildfire activity, and DBAI, representing day-to-day departures from that baseline. This decomposition reflects the ecological processes governing wildfire activity, in which vegetation phenology establishes the seasonal background level of fire potential while short term weather and fine fuel moisture regulate daily fire activity.
The results demonstrate that the hierarchical framework successfully captures wildfire dynamics across complementary temporal scales. SBAR accurately reproduced the characteristic bimodal seasonal wildfire regime of the Great Plains using grass curing and air temperature, whereas DBAI quantified daily wildfire variability using DFMC and wind speed. Together, these two components provide a process informed representation of wildfire activity that is both ecologically interpretable and operationally relevant.
Compared with BI and GFDI, the hierarchical framework provided more accurate discrimination of fire days and a more balanced representation of the meteorological and fuel related controls governing wildfire activity. These findings demonstrate that explicitly separating seasonal fuel dynamics from short term weather variability offers a more realistic characterization of wildfire risk than conventional approaches.
Beyond improving wildfire risk assessment, the proposed framework provides a practical foundation for prescribed fire management by supporting both seasonal planning and day-to-day operational decision making. Because the seasonal and daily components can be calibrated independently, the framework is readily transferable to other grassland ecosystems using locally available wildfire, weather, and vegetation data. Future research should incorporate additional drivers of wildfire activity, including grazing, fuel continuity, prescribed fire history, drought severity, and high resolution remote sensing products. More broadly, the hierarchical framework establishes a flexible and scientifically interpretable foundation for quantitative wildfire risk assessment that can support adaptive fire management under changing climatic conditions.
Author Contributions
Z. Liu conceived the study and developed the methodology. I.O. Okafor and M.B. George curated data and assisted with acquisition and processing. I.O. Okafor performed the analyses and drafted the manuscript under Z. Liu’s supervision. All authors reviewed and approved the final manuscript.
Funding
This research was funded by National Science Foundation, grant number 2306603 (SCC-IRG Track 1: Smart and Safe Prescribed Burning for Rangeland and Wildland Urban Interface Communities).
Institutional Review Board Statement
Not applicable.
Informed Consent Statement
Not applicable.
Data Availability Statement
The datasets analyzed for this study are available in the USDA/Forest Service research data archive, https://www.fs.usda.gov/rds/archive/catalog/RDS-2013-0009.6/. The raw data supporting the conclusions of this article will be made available by the authors on request.
Acknowledgments
Contribution no. 26-099-J from the Kansas Agricultural Experiment Station. This research was supported in part by the intramural research program of the U.S. Department of Agriculture, National Institute of Food and Agriculture, Hatch project 7010794. Oklahoma Mesonet data are provided courtesy of the Oklahoma Mesonet, which is jointly operated by Oklahoma State University and the University of Oklahoma. Continued funding for maintenance of the network is provided by the taxpayers of Oklahoma. We thank the Association for Fire Ecology for support through the Wayne Harrison Memorial Scholarship.
Conflicts of Interest
The authors declare no conflicts of interest. The funders had no role in the design of the study; in the collection, analyses, or interpretation of data; in the writing of the manuscript; or in the decision to publish the results.
Abbreviations
The following abbreviations are used in this manuscript:
| AFDRS | Australian Fire Danger Rating System |
| API | Application programming interface |
| BI | Burning Index |
| DBAI | Daily Burn Activity Index |
| DBAR | Daily Burned Area Ratio |
| DFMC | Dead fuel moisture content |
| DOY | Day of year |
| GFDI | Grassland Fire Danger Index |
| ha | hectares |
| KBDI | Keetch–Byram Drought Index |
| NDVI | Normalized Difference Vegetation Index |
| RH | Relative humidity |
| RMSE | Root mean square error |
References
- Bowman, D.M.J.S.; Williamson, G.J.; Abatzoglou, J.T.; Kolden, C.A.; Cochrane, M.A.; Smith, A.M.S. Human exposure and sensitivity to globally extreme wildfire events. Nat. Ecol. Evol. 2017, 1, 0058. [Google Scholar] [CrossRef] [PubMed]
- Abatzoglou, J.T.; Williams, A.P.; Barbero, R. Global emergence of anthropogenic climate change in fire weather indices. Geophys. Res. Lett. 2019, 46, e2018GL080959. [Google Scholar] [CrossRef]
- Kolden, C.A. We’re not doing enough prescribed fire in the West. Fire 2019, 2, 30. [Google Scholar] [CrossRef]
- Alizadeh, M.R.; Adamowski, J.; Entekhabi, D. Land and atmosphere precursors to fuel loading, wildfire ignition and post-fire recovery. Geophys. Res. Lett. 2024, 51, e2023GL105324. [Google Scholar] [CrossRef]
- Yu, G.; Feng, Y.; Wang, J.; Wright, D.B. Performance of fire danger indices and their utility in predicting future wildfire danger over the conterminous United States. Earth’s Future 2023, 11, e2023EF003823. [Google Scholar] [CrossRef]
- Donovan, V.M.; Wonkka, C.L.; Wedin, D.A.; Twidwell, D. Land-use type as a driver of large wildfire occurrence in the U.S. Great Plains. Remote Sens. 2020, 12, 1869. [Google Scholar] [CrossRef]
- Liu, Z.; Okafor, I.O.; George, M.B. Characterizing risks for wildfires and prescribed fires in the Great Plains. Fire 2025, 8, 235. [Google Scholar] [CrossRef]
- Roos, C.I.; Zedeño, M.N.; Hollenback, K.L.; Erlick, M.M.H. Indigenous impacts on North American Great Plains fire regimes of the past millennium. Proc. Natl. Acad. Sci. USA 2018, 115, 8143–8148. [Google Scholar] [CrossRef] [PubMed]
- Williams, J.N.; Quinn-Davidson, L.; Safford, H.D.; Grupenhoff, A.; Middleton, B.R.; Restaino, J.; Smith, E.; Adlam, C.; Rivera-Huerta, H. Overcoming obstacles to prescribed fire in the North American Mediterranean climate zone. Front. Ecol. Environ. 2024, 22, e2687. [Google Scholar] [CrossRef]
- Weir, J.R. Are weather and tradition reducing our ability to conduct prescribed burns? Rangelands 2011, 33, 1–7. [Google Scholar] [CrossRef]
- Yurkonis, K.A.; Dillon, J.; McGranahan, D.A.; Toledo, D.; Goodwin, B.J. Seasonality of prescribed fire weather windows and predicted fire behavior in the northern Great Plains, USA. Fire Ecol. 2019, 15, 7. [Google Scholar] [CrossRef]
- Hiers, J.K.; O’Brien, J.J.; Varner, J.M.; et al. Prescribed fire science: The case for a refined research agenda. Fire Ecol. 2020, 16, 11. [Google Scholar] [CrossRef]
- Akinbile, D.S.; Liu, Z.; Lin, X.; Moore, T.; Song, W. Optimum weather conditions for prescribed burning in the Flint Hills region. J. ASABE 2023, 66, 647–656. [Google Scholar] [CrossRef]
- Cruz, M.G.; Alexander, M.E.; Kilinc, M. Wildfire rates of spread in grasslands under critical burning conditions. Fire 2022, 5, 55. [Google Scholar] [CrossRef]
- Higgins, K.F.; Piehl, J.L.; Kruse, A.D. Prescribed Burning Guidelines in the Northern Great Plains; U.S. Fish and Wildlife Service: Denver, CO, USA, 1989. [Google Scholar]
- Sullivan, A.L. Grassland fire management in future climate. In Advances in Agronomy; Elsevier: Amsterdam, The Netherlands, 2010; Volume 106, pp. 111–161. [Google Scholar] [CrossRef]
- Swain, D.L.; Abatzoglou, J.T.; Kolden, C.; et al. Climate change is narrowing and shifting prescribed fire windows in western United States. Commun. Earth Environ. 2023, 4, 340. [Google Scholar] [CrossRef] [PubMed]
- Keetch, J.J.; Byram, G.M. A Drought Index for Forest Fire Control; USDA Forest Service Research Paper SE-38; USDA Forest Service: Asheville, NC, USA, 1968. [Google Scholar]
- Plucinski, M.P.; Tartaglia, E.; Huston, C.; et al. Exploring the influence of the Keetch–Byram Drought Index and McArthur’s Drought Factor on wildfire incidence in Victoria, Australia. Int. J. Wildland Fire 2023. ahead of print. [Google Scholar] [CrossRef]
- Banerjee, T.; Heilman, W.; Goodrick, S.; Hiers, J.K.; Linn, R. Effects of canopy midstory management and fuel moisture on wildfire behavior. Sci. Rep. 2020, 10, 17312. [Google Scholar] [CrossRef] [PubMed]
- Weir, J.R.; Elmore, D.; Bidwell, T.G.; et al. Oklahoma Prescribed Burning Handbook; Oklahoma State University: Stillwater, OK, USA, 2021. [Google Scholar]
- Jolly, W.M.; Freeborn, P.H.; Page, W.G.; Butler, B.W. Severe fire danger index: A forecastable metric to inform firefighter and community wildfire risk management. Fire 2019, 2, 47. [Google Scholar] [CrossRef]
- Schmidt, K.M.; Menakis, J.P.; Hardy, C.C.; Hann, W.J.; Bunnell, D.L. Development of Coarse Scale Spatial Data for Wildland Fire and Fuel Management; RMRS-GTR-87; USDA Forest Service: Salt Lake City, UT, USA, 2002. [Google Scholar] [CrossRef]
- McArthur, A.G. Weather and Grassland Fire Behaviour; Forestry and Timber Bureau Leaflet 100: Canberra, Australia, 1966. [Google Scholar]
- Noble, I.R.; Gill, A.M.; Bary, G.A.V. McArthur’s fire-danger meters expressed as equations. Aust. J. Ecol. 1980, 5, 201–203. [Google Scholar] [CrossRef]
- Purton, C.M. Equations for the McArthur Mark 4 Grassland Fire Danger Meters; Meteorological Note 147; Bureau of Meteorology: Melbourne, Australia, 1982. [Google Scholar]
- Cheney, P.; Sullivan, A.L. Grassfires: Fuel, Weather and Fire Behaviour, 2nd ed.; CSIRO Publishing: Collingwood, VIC, Australia, 2008. [Google Scholar] [CrossRef]
- Schreck, M.B.; Howerton, P.J.; Cook, K.R. Adapting Australia’s Grassland Fire Danger Index for the United States’ Central Plains; NOAA Technical Attachment 1002, 2010.
- Hollis, J.J.; Matthews, S.; Fox-Hughes, P.; et al. Introduction to the Australian fire danger rating system. Int. J. Wildland Fire 2024, 33, 301–313. [Google Scholar] [CrossRef]
- Kenny, B.J.; Matthews, S.; Sauvage, S.; et al. Australian fire danger rating system: Implementing fire behaviour calculations to forecast fire danger in a research prototype. Int. J. Wildland Fire. 2024, 33, 418–433. [Google Scholar] [CrossRef]
- Akinbile, D.S.; Liu, Z. Daily burned area mapping for prescribed rangeland burning. J. ASABE 2022, 65, 1507–1518. [Google Scholar] [CrossRef]
- Anderson, K.L. Utilization of grasslands in the Flint Hills of Kansas. J. Range Manag. 1953, 6, 86–91. [Google Scholar] [CrossRef]
- McKane, R.B.; Halama, J.J.; Barnhart, B.L.; et al. Estimation of Flint Hills tallgrass prairie productivity and fuel loads. Landsc. Ecol. 2025, 40, 24. [Google Scholar] [CrossRef] [PubMed]
- Baker, K.R.; Koplitz, S.N.; Foley, K.M.; et al. Characterizing grassland fire activity in the Flint Hills region. Sci. Total Environ. 2019, 659, 1555–1566. [Google Scholar] [CrossRef] [PubMed]
- Short, K.C. Spatial Wildfire Occurrence Data for the United States, 1992–2020; Forest Service Research Data Archive, 2022. [CrossRef]
- Walker, K. Tigris: An R package to access geographic data. R J. 2016, 8, 231–236. [Google Scholar] [CrossRef]
- Pebesma, E. Simple features for R. R J. 2018, 10, 439–446. [Google Scholar] [CrossRef]
- Brock, F.V.; Crawford, K.C.; Elliott, R.L.; Cuperus, G.W.; Stadler, S.J.; Johnson, H.L.; Eilts, M.D. The Oklahoma Mesonet: A Technical Overview. J. Atmos. Ocean. Technol. 1995, 12, 5–19. [Google Scholar] [CrossRef]
- McPherson, R.A.; Fiebrich, C.A.; Crawford, K.C.; Kilby, J.R.; Grimsley, D.L.; Martinez, J.E.; Basara, J.B.; Illston, B.G.; Morris, D.A.; Kloesel, K.A.; et al. Statewide Monitoring of the Mesoscale Environment: A Technical Update on the Oklahoma Mesonet. J. Atmos. Ocean. Technol. 2007, 24, 301–321. [Google Scholar] [CrossRef]
- Oklahoma Mesonet. Standard Mesonet Observations; Oklahoma Mesonet: Norman, OK, USA, 2025; Available online: https://mesonet.org (accessed on 16 June 2026).
- Alderman, P.D. mesonet: Download and Process Oklahoma Mesonet Data; R Package Version 0.0.2; CRAN: Vienna, Austria, 2025; Available online: https://CRAN.R-project.org/package=mesonet (accessed on 16 June 2026).
- George, M.B.; Liu, Z.; Okafor, I.O. Modeling Moisture Factors in Grassland Fire Danger Index for Prescribed Fire Management in the Great Plains. Fire 2025, 8, 469. [Google Scholar] [CrossRef]
- Chaivaranont, W.; Evans, J.P.; Liu, Y.Y.; Sharples, J.J. Estimating grassland curing. Nat. Hazards Earth Syst. Sci. 2018, 18, 1535–1554. [Google Scholar] [CrossRef]
- Sharma, S.; Carlson, J.D.; Krueger, E.S.; et al. Soil moisture as an indicator of growing season herbaceous fuel moisture. Int. J. Wildland Fire 2021, 30, 57–69. [Google Scholar] [CrossRef]
- Newnham, G.J.; Verbesselt, J.; Grant, I.F.; Anderson, S.A.J. Relative greenness index. Remote Sens. Environ. 2011, 115, 1456–1463. [Google Scholar] [CrossRef]
- Carlson, J.D.; Burgan, R.E.; Engle, D.M.; Greenfield, J.R. Oklahoma fire danger model. Int. J. Wildland Fire 2002, 11, 183–197. [Google Scholar] [CrossRef]
- Dewitz, J.; U.S. Geological Survey. National Land Cover Database (NLCD) 2019 Products (Version 2.0, June 2021); U.S. Geological Survey Data Release, 2021. [CrossRef]
- Prestemon, J.P.; Hawbaker, T.J.; Bowden, M.; et al. Wildfire Ignitions; SRS-GTR-171; USDA Forest Service: Salt Lake City, UT, USA, 2013. [Google Scholar] [CrossRef]
- Addington, R.N.; Hudson, S.J.; Hiers, J.K.; et al. Relationships among wildfire, prescribed fire, and drought. Int. J. Wildland Fire 2015, 24, 778–783. [Google Scholar] [CrossRef]
- Bond, W.J.; Keeley, J.E. Fire as a global “herbivore”. Trends Ecol. Evol. 2005, 20, 387–394. [Google Scholar] [CrossRef] [PubMed]
- Wilcox, B.P.; Fuhlendorf, S.D.; Walker, J.W.; et al. Saving imperiled grassland biomes. Front. Ecol. Environ. 2022, 20, 179–186. [Google Scholar] [CrossRef]
- Abatzoglou, J.T.; Williams, A.P. Impact of anthropogenic climate change on wildfire. Proc. Natl. Acad. Sci. USA 2016, 113, 11770–11775. [Google Scholar] [CrossRef] [PubMed]
- Gannon, C.S.; Steinberg, N.C. Global wildfire potential under climate change. Environ. Res. Commun. 2021, 3, 035002. [Google Scholar] [CrossRef]
- Sharples, J.J.; McRae, R.H.D.; Weber, R.O.; Gill, A.M. A simple index for assessing fire danger rating. Environ. Model. Softw. 2009, 24, 764–774. [Google Scholar] [CrossRef]
- Andrews, P.L.; Loftsgaarden, D.O.; Bradshaw, L.S. Evaluation of fire danger rating indexes using logistic regression and percentile analysis. Int. J. Wildland Fire 2003, 12, 213–226. [Google Scholar] [CrossRef]
- Hanley, J.A.; McNeil, B.J. The meaning and use of the area under a receiver operating characteristic (ROC) curve. Radiology 1982, 143, 29–36. [Google Scholar] [CrossRef] [PubMed]
- Swets, J.A. Measuring the accuracy of diagnostic systems. Science 1988, 240, 1285–1293. [Google Scholar] [CrossRef] [PubMed]
- Hosmer, D.W.; Lemeshow, S. Applied Logistic Regression, 2nd ed.; John Wiley & Sons: New York, NY, USA, 2000. [Google Scholar] [CrossRef]
- Borgonovo, E. A new uncertainty importance measure. Reliab. Eng. Syst. Saf. 2007, 92, 771–784. [Google Scholar] [CrossRef]
- Yu, G.; Feng, Y.; Wang, J.; Wright, D.B. Performance of fire danger indices and their utility in predicting future wildfire danger over the conterminous United States. Earth’s Future 2023, 11, e2023EF003823. [Google Scholar] [CrossRef]
- Herman, J.; Usher, W. SALib: An open-source Python library for sensitivity analysis. J. Open Source Softw. 2017, 2, 97. [Google Scholar] [CrossRef]
- Anderson, S.A.; Anderson, W.R.; Hollis, J.J.; Botha, E.J. A simple method for field-based grassland curing assessment. Int. J. Wildl. Fire 2011, 20, 804–814. [Google Scholar] [CrossRef]
- Cruz, M. The Vesta Mk 2 Rate of Fire Spread Model: A User’s Guide; CSIRO: Canberra, Australia, 2021. [Google Scholar]
- Davies, K.W.; Gearhart, A.; Boyd, C.S.; Bates, J.D. Grazing influence on fire ignitability. Int. J. Wildland Fire 2017, 26, 485–494. [Google Scholar] [CrossRef]
- Starrs, G.; Siegel, K.; Larson, S.; Butsic, V. Grazing impacts on burn probability. Ecol. Soc. 2024, 29, art10. [Google Scholar] [CrossRef]
- Cheney, N.P.; Gould, J.S.; Catchpole, W.R. Prediction of fire spread in grasslands. Int. J. Wildland Fire 1998, 8, 1–13. [Google Scholar] [CrossRef]
- Matthews, S.; Gould, J.; McCaw, L. Simple models for predicting dead fuel moisture. Int. J. Wildland Fire 2010, 19, 459–467. [Google Scholar] [CrossRef]
- Marsden-Smedley, J.B.; Catchpole, W.R. Dead fuel moisture in buttongrass moorlands. Int. J. Wildland Fire 2001, 10, 241–251. [Google Scholar] [CrossRef]
- Twidwell, D.; Wonkka, C.L.; Sindelar, M.T.; Weir, J.R. Prescribed fire risks. PLoS ONE 2015, 10, e0140410. [Google Scholar] [CrossRef] [PubMed]
Figure 1.
Framework of the hierarchical fire risk framework.
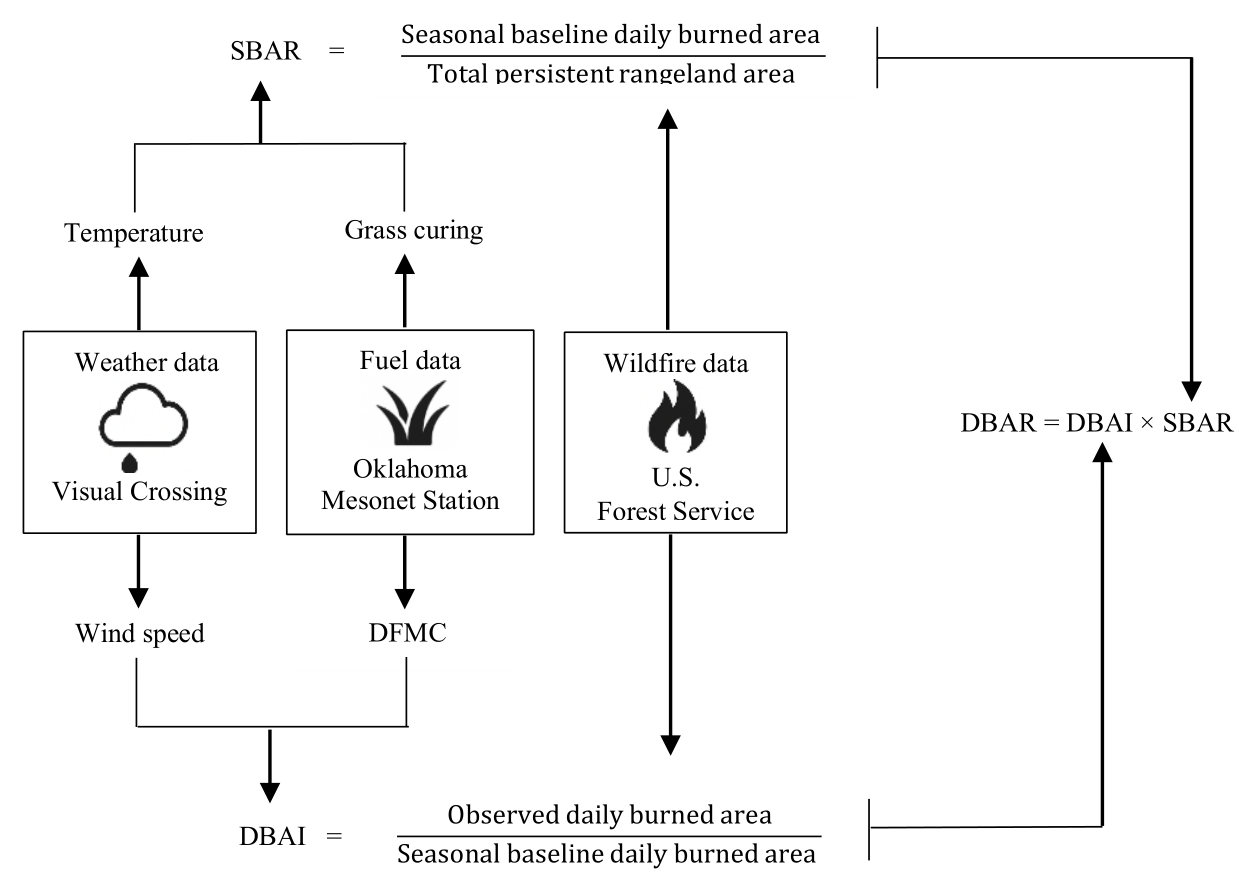
Figure 2.
Seasonal wildfire pattern across the Flint Hills region.
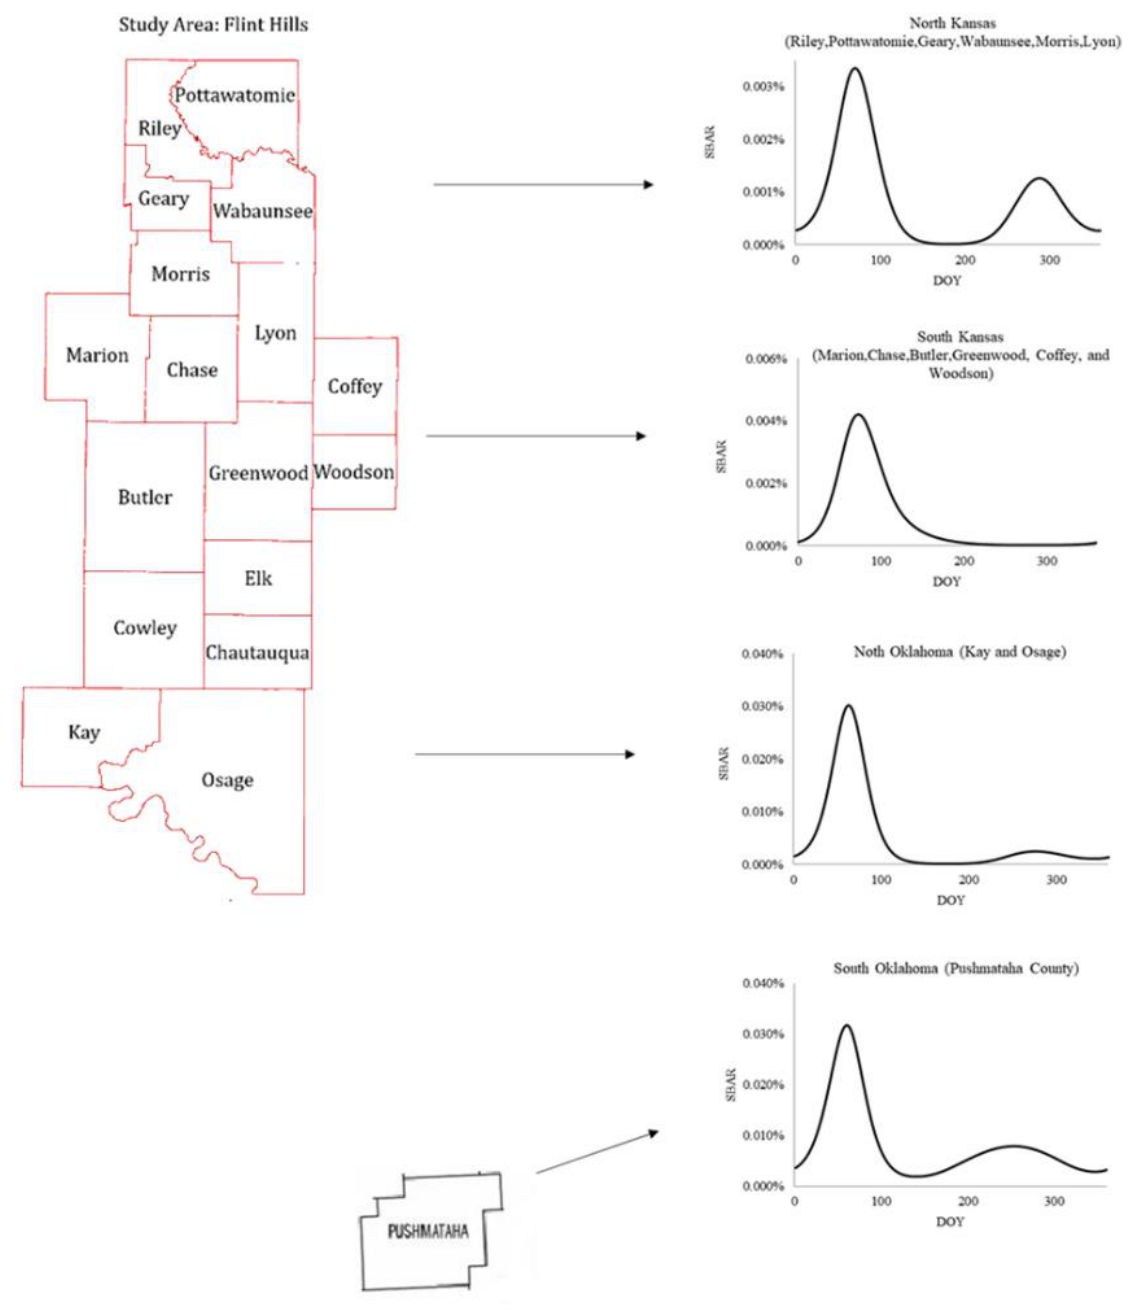
Figure 3.
SBAR as affected by grass curing and temperature in Osage and Kay counties in Oklahoma based on historical wildfire burned area and fire climatology from 1995 to 2020. DOY is the day of year.
Figure 3.
SBAR as affected by grass curing and temperature in Osage and Kay counties in Oklahoma based on historical wildfire burned area and fire climatology from 1995 to 2020. DOY is the day of year.
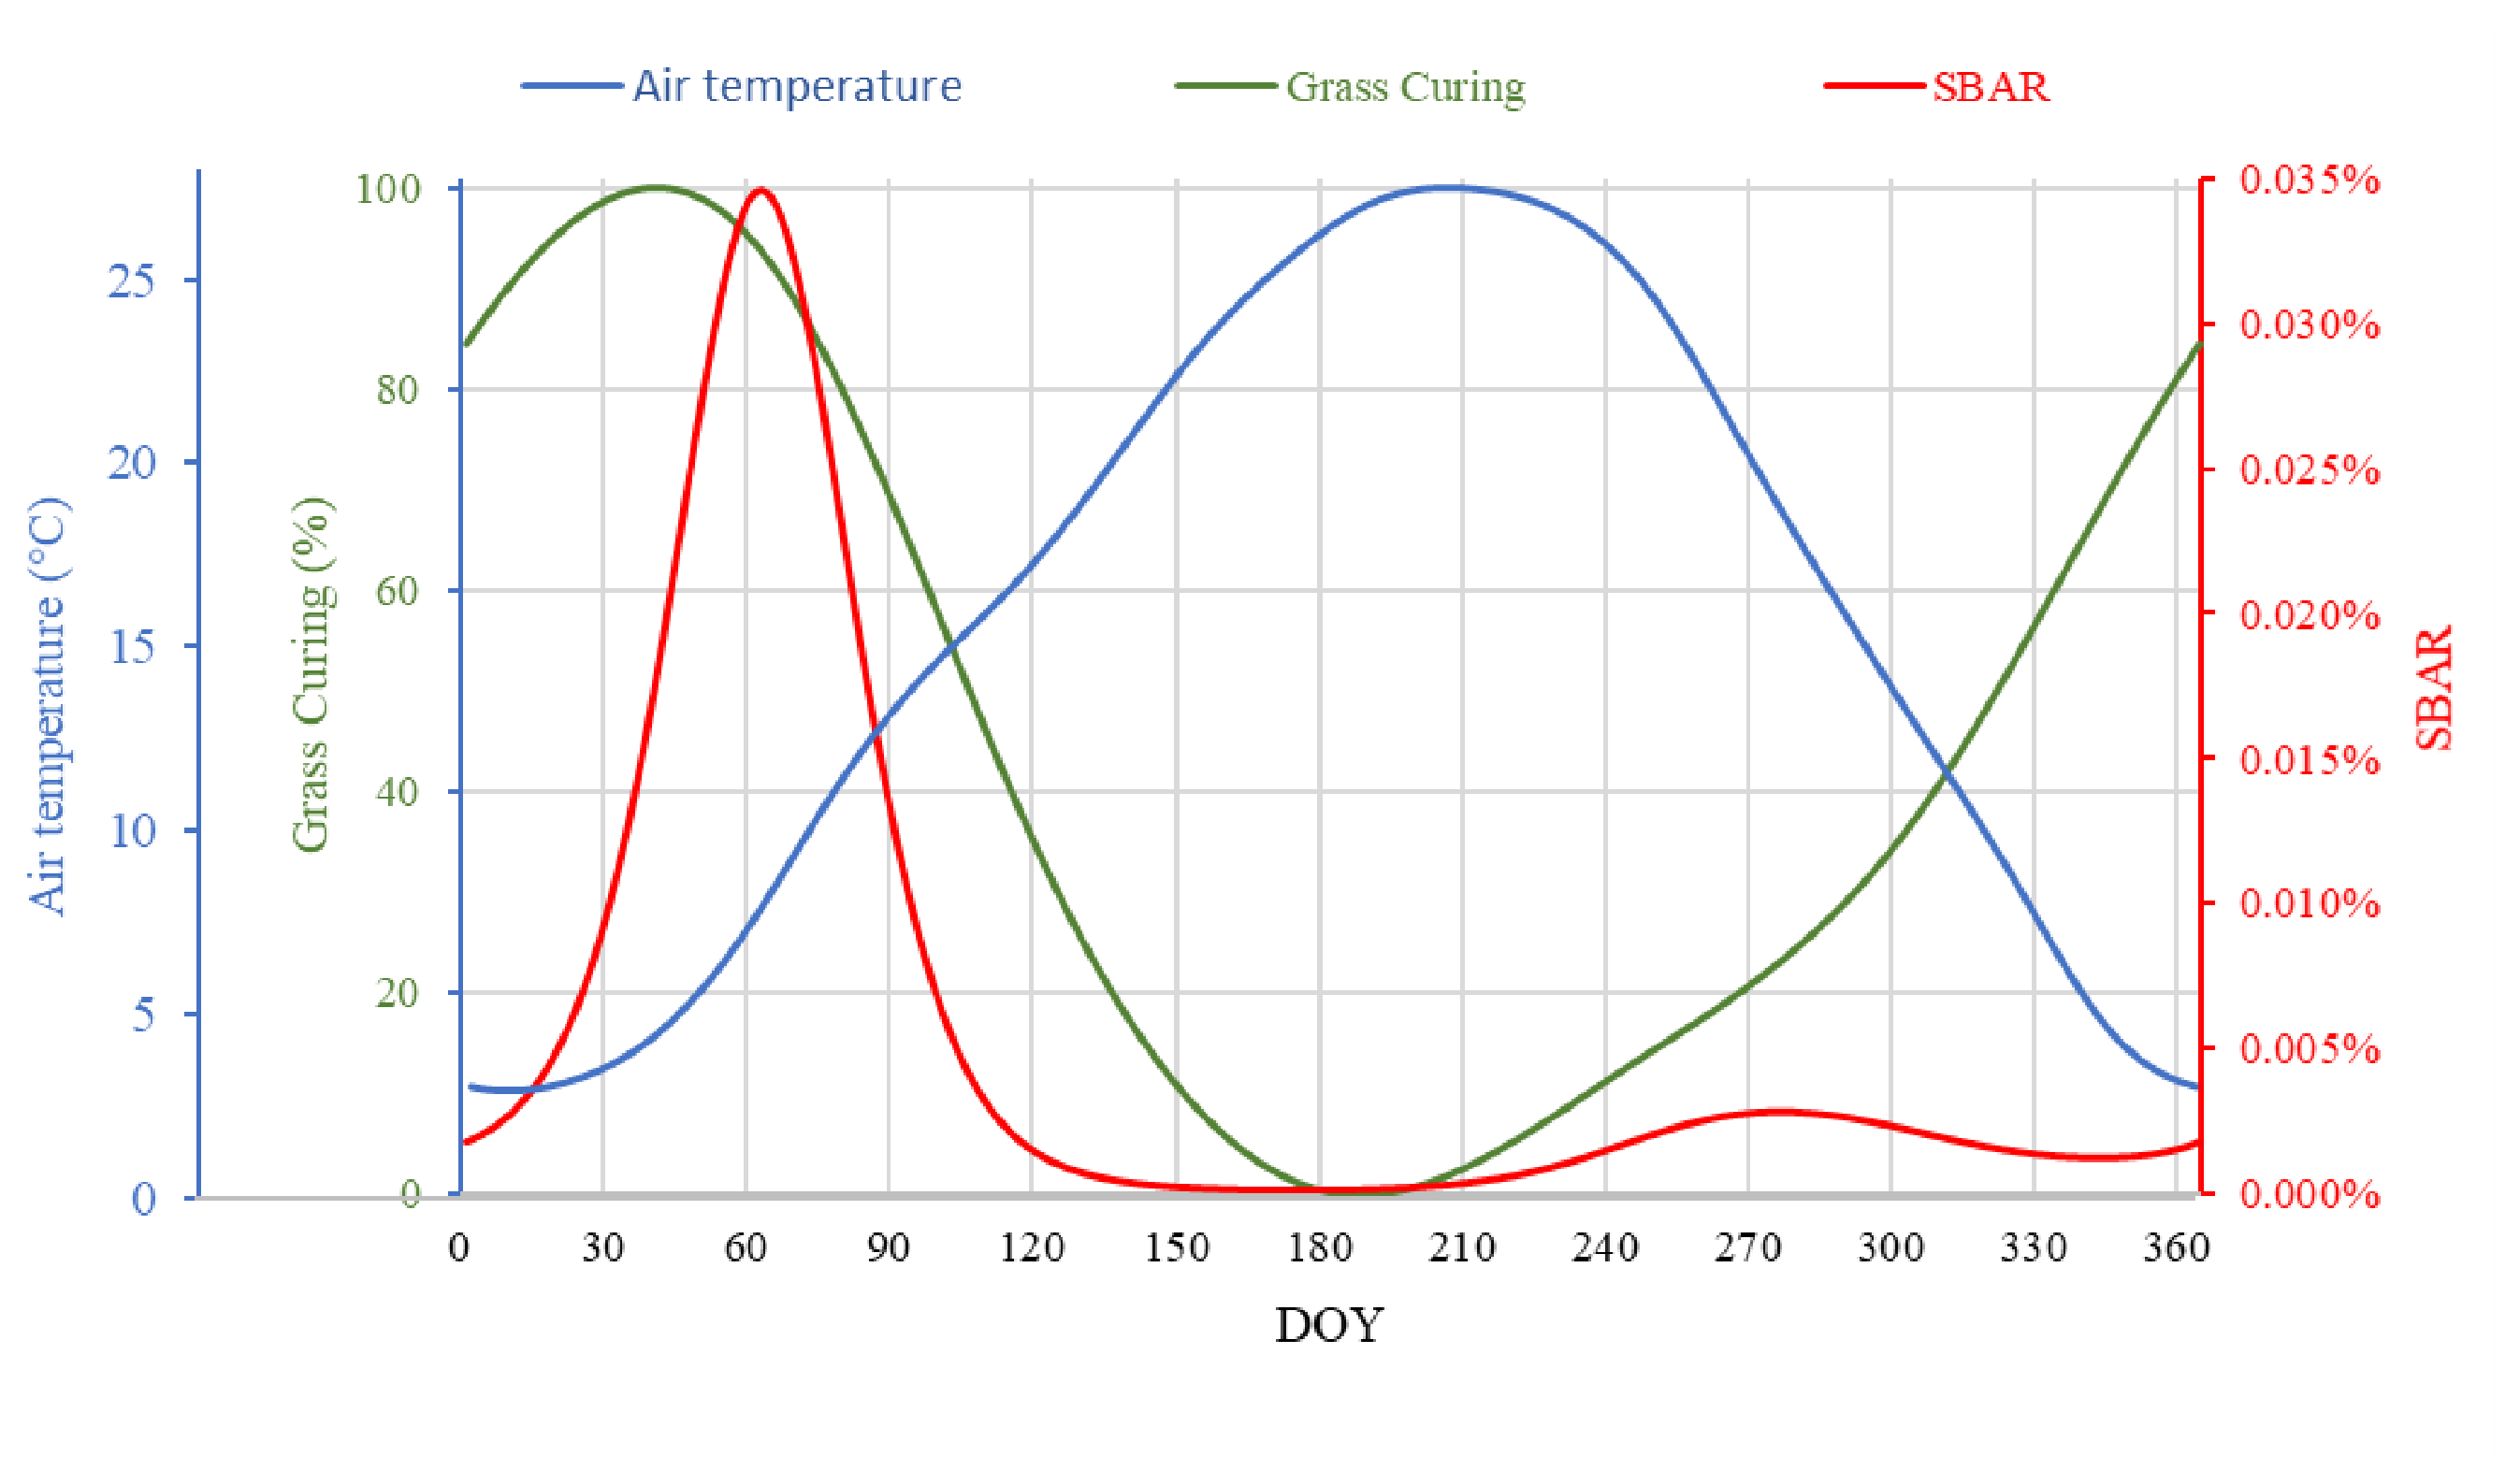
Figure 4.
ROC curve comparison for fire prediction using DBAR, BI and GFDI.
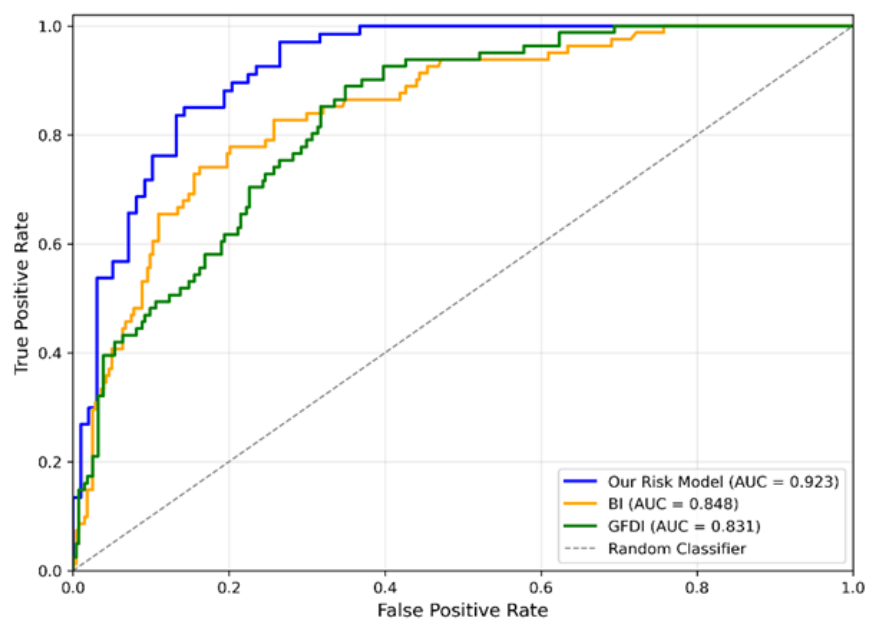
Figure 5.
Cumulative distribution curves for DBAR, BI and GFDI.
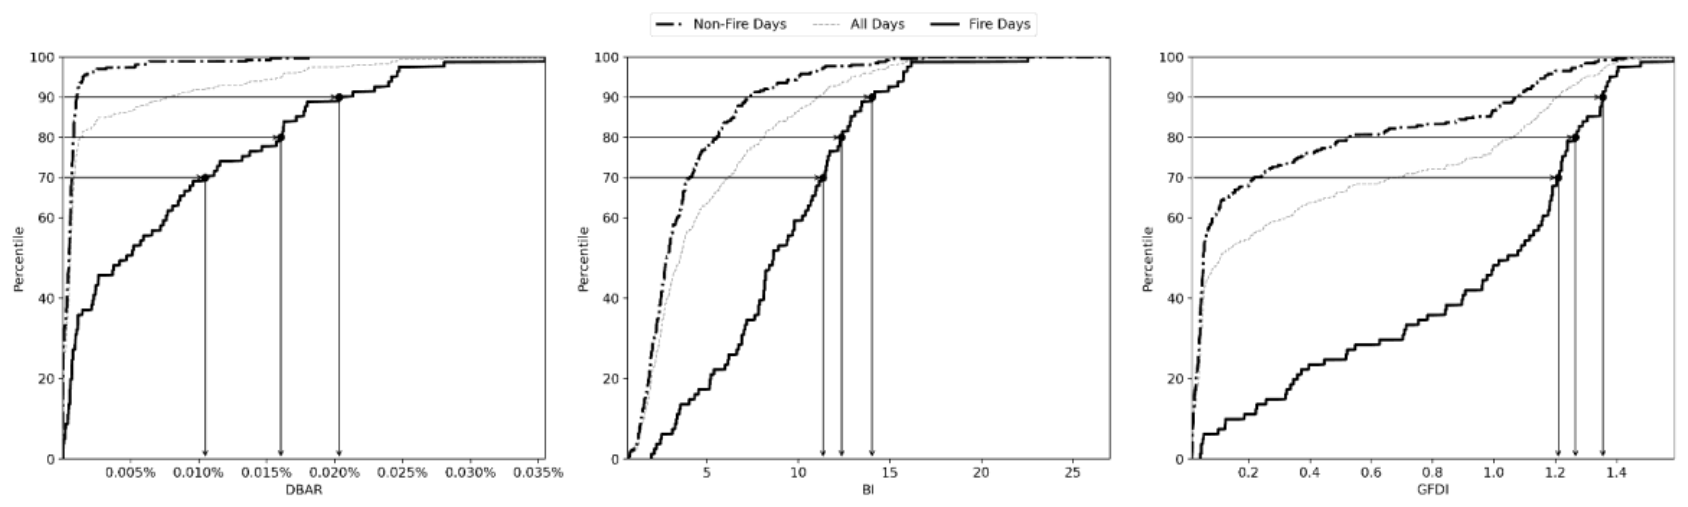
Figure 6.
Delta moment-independent sensitivity analysis of input variables for DBAR, BI, and GFDI.
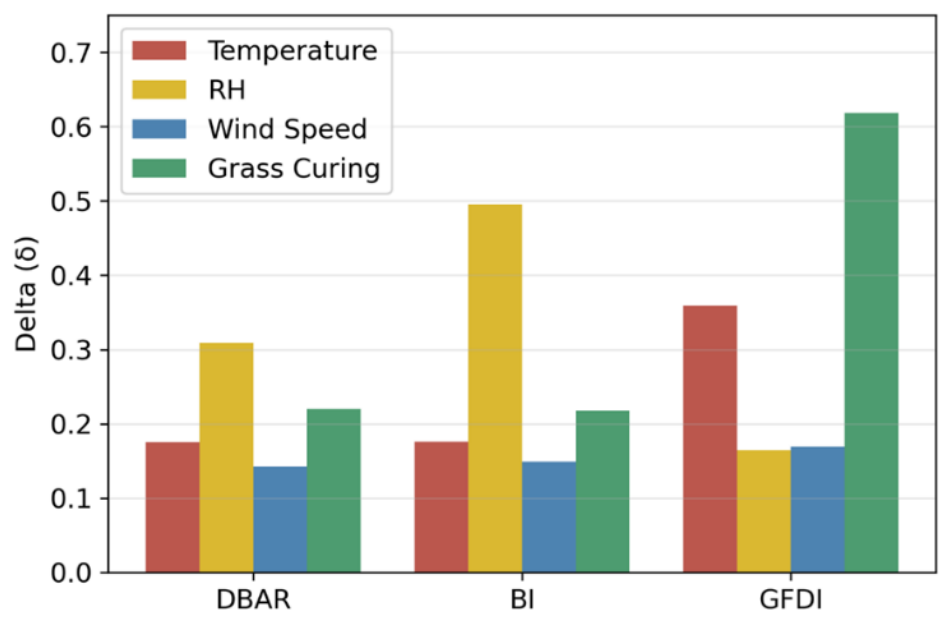

Table 1.
Framework of the hierarchical fire risk framework.
| Component | Time Scale | Predictors | Output | Ecological Meaning |
|---|---|---|---|---|
| SBAR | Seasonal | Grass curing, temperature | Seasonal baseline | Seasonal fire potential |
| DBAI | Daily | DFMC, wind speed | Daily modifier | Daily weather effect |
| DBAR | Daily | SBAR × DBAI | Overall wildfire risk | Realized fire risk |
Table 2.
Estimated parameters (mean ± SE) of the power-law model relating SBAR to smoothed grass curing and smoothed air temperature.
Table 2.
Estimated parameters (mean ± SE) of the power-law model relating SBAR to smoothed grass curing and smoothed air temperature.
| Season | Period | α (×10−6) | β1 (Grass Curing) | β2 (Temperature) |
|---|---|---|---|---|
| H1 | DOY ≤ 182 | 9.76 ± 0.49 | 6.45 ± 0.10 | 1.90 ± 0.03 |
| H2 | DOY > 182 | 2.09 ± 0.29 | 1.02 ± 0.06 | 1.34 ± 0.08 |
Table 3.
Estimated parameters (mean ± SE) of the exponential model relating the DBAI to DFMC and maximum sustained 10-m wind speed:.
Table 3.
Estimated parameters (mean ± SE) of the exponential model relating the DBAI to DFMC and maximum sustained 10-m wind speed:.
| Parameter | Estimate (Mean ± SE) | Interpretation |
|---|---|---|
| α | 1.314 ± 1.323 | Intercept |
| β1 | 0.368 ± 0.183 | Positive effect of wind speed |
| β2 | −0.183 ± 0.071 | Negative effect of fuel moisture |
Disclaimer/Publisher’s Note: The statements, opinions and data contained in all publications are solely those of the individual author(s) and contributor(s) and not of MDPI and/or the editor(s). MDPI and/or the editor(s) disclaim responsibility for any injury to people or property resulting from any ideas, methods, instructions or products referred to in the content. |
© 2026 by the authors. Licensee MDPI, Basel, Switzerland. This article is an open access article distributed under the terms and conditions of the Creative Commons Attribution (CC BY) license (http://creativecommons.org/licenses/by/4.0/).
Copyright: This open access article is published under a Creative Commons CC BY 4.0 license, which permit the free download, distribution, and reuse, provided that the author and preprint are cited in any reuse.


