

Submitted:
07 July 2026
Posted:
09 July 2026
You are already at the latest version
Abstract
Wrist-worn devices offer a practical means of monitoring gait, yet no validated end-to-end pipeline exists for deriving digital mobility outcomes (DMOs) including cadence, stride length (SL), and walking speed (WS) in people with multiple long-term conditions (MLTC, the coexistence of two or more long-term conditions). This study presents the first modular pipeline for wrist-worn devices for DMO estimation, validated in 45 older adults with MLTC (65–90 years), whose conditions spanned four multimorbidity clusters (cardiometabolic, painful conditions, pulmonary, and cancer), across laboratory tasks using stereophotogrammetry as the reference. Algorithms were selected independently for each block (gait sequence detection (GSD), initial contact detection (ICD), SL) using novel, fine-tuned, and adaptive versions of established methods developed on an independent cohort. Blocks were first validated independently before being integrated into a pipeline capturing cumulative error propagation. GSD achieved a recall of 0.90. ICD was robust across algorithms, with the best-performing algorithm achieving a recall of 0.77 and precision of 0.82. At the pipeline level, the best-performing pipeline achieved SL error of 0.15 m with near-zero bias, cadence absolute error of 8.58 steps/min, and WS absolute error of 0.14m/s. These findings support wrist-worn devices for objective gait assessment in multimorbid populations, establishing a validated open-source pipeline for real-world deployment.
Keywords:
wrist-worn devices
; digital biomarkers
; digital mobility outcomes
; gait analysis
; multiple long-term conditions
1. Introduction
Digital Mobility Outcomes (DMOs) have emerged as promising tools for the objective assessment of real-world mobility, with accumulating evidence linking real-world mobility performance to broader health status, and disease severity [1,2,3,4]. A critical prerequisite for their adoption as health biomarkers in clinical trials and routine care is robust technical validation [5], demonstrating accuracy and reliability across the full estimation pipeline rather than individual algorithmic components in isolation [6].
However, existing validation studies share critical limitations. First, they have focused on single long-term conditions, despite older adults commonly presenting with multiple long-term conditions that often span several disease domains and are associated with heterogeneous gait impairments [7,8]. Second, pipeline validations have assessed individual components (i.e., blocks) using reference-system inputs, rather than the full wearable pipeline where errors accumulate across stages. In our previous work, we validated gait sequence detection (GSD), initial contact detection (ICD), and stride length (SL) in individuals with a mild-to-moderate burden of multiple long-term conditions (MLTC), defined as the coexistence of two or more long-term conditions [9]. During that work we developed and validated novel wrist-adapted, fine-tuned versions of state-of-the-art algorithms specifically designed to accommodate the signal complexity of wrist-worn devices in populations with MLTC, providing the methodological foundation for the present study. Third, no study has yet derived composite digital mobility outcomes, including cadence (CAD), stride length, and walking speed (WS), within a fully integrated end-to-end pipeline operating on raw wrist-worn data in free-living conditions.
Despite widespread adoption of wrist technology, the above limitations represent a fundamental gap between accessibility and the technical validity required before these solutions can support clinical application.
The present study addresses all three limitations simultaneously, by presenting, to the authors’ knowledge, the first wrist-derived composite DMO pipeline and comprehensively validating it in individuals with a high clinical burden of MLTC. Specifically, we aimed to:
- (i)
- validate and rank GSD algorithms in a highly representative sample of individuals with MLTC, extending our previous findings as a baseline for downstream pipeline validation;
- (ii)
- validate all pipeline combinations for ICD, SL, cadence, and walking speed across all algorithmic combinations, establishing a best-performing pipeline;
- (iii)
- assess pipeline validity at the individual participant level, identifying which pipeline configurations perform best for each participant and whether performance varies systematically across the multimorbid sample.
2. Materials and Methods
Study Population
Fifty participants with MLTC were recruited from primary and secondary care clinics, as well as community-based health charities, as part of the MultiMobility study (ISRCTN25008143, NCT06473168). Eligible participants were adults aged ≥65 years who were able to provide written informed consent, could read and write in English, and were mobile (including those using walking aids). Inclusion required at least two co-occurring long-term conditions of equivalent clinical significance from a predefined list spanning cardiovascular, metabolic, respiratory, musculoskeletal, and neurological domains, including: arthritis, asthma, atrial fibrillation, bronchiectasis, cancer, chronic kidney disease, chronic obstructive pulmonary disease, coronary heart disease, anxiety, depression, diabetes mellitus, heart failure, hypertension, osteoporosis, Parkinson's disease, peripheral vascular disease, and stroke or transient ischaemic attack. Individuals were excluded if they were unable to provide informed consent, had severe mental health problems, or had active malignancy requiring chemotherapy, radiotherapy, or urgent surgery. Written informed consent was obtained from all participants prior to participation. Approval was granted by the NHS Health Research Authority (NHS Health Research Authority North East York Research Ethics Committee; IRAS: 340676,) and the Newcastle upon Tyne NHS Healthcare Foundation Trust (R&D 10877).
Experimental Protocol
Participants completed a laboratory-based assessment comprising eight motor tasks of increasing complexity: straight walking at preferred (comfortable), fast, and slow speeds; Timed Up and Go (TUG); L-Test; Surface Test; Continuous Walking Test (60 seconds); and Simulated Daily Activities (SDA) [10]. Task descriptions followed the Mobilise-D protocol [10] with modifications to accommodate frailer and slower-walking individuals with MLTC [10], and are detailed as follows:
- Straight Walking (Slow, Comfortable, Fast): participants walked 5 metres from a standing start at three self-selected speeds (comfortable, slow, fast, in this standardised order), each repeated twice for reproducibility.
- Timed Up and Go (TUG): participants rose from a chair, walked 3 metres at a comfortable pace, turned 180°, returned, and sat down.
- L-Test: participants rose from a chair, walked straight at a comfortable pace, turned 90° around a cone, walked to a second cone, turned 180°, then made a final 90° turn to return to the chair.
- Hallway Test: participants walked around a defined circuit twice (approximately 20 metres).
- Continuous Walking Test (CWT): participants walked continuously at a comfortable pace for 60 seconds around a 10×10 metres square circuit.
- Simulated Daily Activities (SDA): participants performed a series of daily living tasks while moving around the room from a seated starting position, simulating real-world transitions.
Inertial Measurement Unit Data
Wrist IMU data were collected using an Axivity AX6 sensor (23 x 32.5 x 8.9 mm, 11g, Axivity Ltd., Newcastle, UK) placed on the non-dominant wrist using an elastic strap. The device recorded triaxial acceleration and gyroscope data at a sampling frequency of 100 Hz, with a 16-bit resolution. The accelerometer range was configured to ±8 g and the gyroscope range to ±2000 degrees per second (dps), providing full 6-Degrees of Freedom motion data.
Reference Data
Reference spatiotemporal gait parameters were obtained using a stereophotogrammetry (SP) system (100 Hz), serving as the gold standard for laboratory-based tasks. The SP system was comprised of 14 Vicon Bonita cameras (100Hz) reconstructs the 3D trajectories of reflective markers attached to the feet and lower back, with systematic and random errors minimised to a few millimetres via calibration and filtering [10,11]. A bespoke marker set was adopted following the procedures described previously, including four markers on each foot for gait event detection [10]. Walking bouts were defined as continuous sequences containing at least two consecutive strides of both feet, with consecutive bouts separated by breaks greater than 3 seconds [12]. IMU and reference system data were synchronised using timestamps referred to a common clock. Synchronisation was additionally verified by comparing the movement of reflective markers placed on the wrist device with the corresponding IMU signal.
Algorithms
The algorithms used for GSD, ICD, and SL estimation are described in detail in our previous work [9] and are openly available in our implementation [13]. All algorithms are novel wrist-adapted, fine-tuned, and adaptive variants of established gait algorithms, specifically developed and optimised for wrist-worn IMUs in multimorbid populations using an independent development cohort, with no overlap between the development and the present validation cohort.
For the present study, GSD algorithms were evaluated and ranked in Aim 1. ICD, SL, cadence, and walking speed were evaluated as pipeline components in Aim 2 using wearable-derived inputs throughout. ICD performance was evaluated exclusively on true positive walking bouts, as wearable-derived gait sequence indices require alignment with reference walking bout indices to enable meaningful comparison of initial contact events. In terms of the composite DMOs, cadence was derived from initial contacts using a per-second cadence estimation algorithm based on inter-contact intervals with Hampel filtering for outlier suppression. Walking speed was computed per walking bout as the product of cadence and stride length, following Kirk et al. [6]:
All algorithms and the full pipeline, which extracts 40 DMOs as weekly aggregates, daily aggregates, and WB level DMOs across walking bouts of varying duration (all WBs, 10–30s, >10s, >30s, >60s), are publicly available as a Python package (PyPi) and on GitHub [13]. Beyond standard mean-level gait outcomes (walking speed, stride length, cadence) and accumulated mobility outcomes (number and duration of WBs, steps during WBs, total walking time), this includes within-bout variability measures for walking speed, cadence, and stride length using coefficient of variation and, to our knowledge, novel to gait analysis, root mean square of successive differences (RMSSD), previously used mainly in heart rate variability, which we hypothesise may capture novel information on gait variability.
Pipeline Construction
The full wearable pipeline cascades sequentially similar to the MobGap pipeline [14]: GSD detects walking bouts; ICD detects initial contacts within those bouts; SL and cadence are estimated from the detected contacts; walking speed is derived from cadence and stride length. A key methodological novelty of this study is the adoption of a scaled pipeline evaluation approach, in which algorithms are introduced and assessed progressively at each stage using only wearable-derived inputs. GSD was first evaluated independently against the reference system to identify the best-performing algorithm. ICD was then evaluated within the wearable pipeline, using detected walking bouts from the best GSD as input, thereby assessing pipeline rather than standalone algorithmic validity. SL and cadence were subsequently evaluated using the wearable GSD and all ICD combinations, and walking speed was derived from the full cascade of wearable-derived GSD, ICD, cadence, and stride length. This progressive approach ensures that errors accumulate naturally through the pipeline at each stage, providing a realistic assessment of end-to-end pipeline performance (Figure 1).
Sample Size
The required number of walking bouts for robust estimation of the intraclass correlation coefficient (ICC) was calculated using the Bonett et al. approximation [15]. Based on an expected ICC of 0.64 from the best performing GSD algorithm from our previous work [5], and a desired 95% confidence interval width of 0.2, approximately 100 walking bouts are needed to achieve sufficient precision.
Validation Approach
All pipeline inputs are wearable-derived, with no reference system inputs at any stage. A total of 27 pipeline combinations were evaluated for SL (9 ICD × 3 SL), 9 for cadence (9 ICD × 1 cadence algorithm), and 27 for walking speed (9 ICD × 3 SL). Two complementary evaluation approaches were employed following Kirk et al. [6]. The true positive evaluation served as the primary analysis for full ranking and selection of all algorithms and pipeline combinations. The combined evaluation was applied exclusively to the best-performing pipeline identified through the true positive evaluation, for verification and error quantification (Figure 1):
True Positive Evaluation: Only walking bouts detected by both systems with an overlap exceeding 85% were compared, enabling paired comparisons including ICC and Bland-Altman analysis. The 85% threshold yielded 154 true positive walking bouts, exceeding the pre-specified minimum of 100 required for robust statistical power.
Combined Evaluation: Mean DMO values were calculated across all detected walking bouts per participant per task, providing a traditional evaluation approach independent of the true positive evaluation.
Performance Metrics and Ranking
Performance metrics and the ranking methodology follow previous work [9,12], with the novel addition of pipeline-level ranking for cadence and walking speed. For GSD, the performance index, metrics, and weights are described in detail in Megaritis et al. [9] and summarised in Table S1. For ICD and SL evaluated within the pipeline context, the same weighting frameworks are applied [9] (Tables S2 and S3, respectively).
For cadence, the same weighting framework was applied [9], with the exception that absolute cadence error was normalised using min-max rather than exponential normalisation, as the unit scale of cadence (steps/min) renders the latter insensitive to meaningful differences between algorithms (Table S4). For walking speed, a novel performance index was developed comprising ICC(2,1), MAE, MARE, and limits of agreement (LoA), with weights presented in Table S5. All other error metrics were normalised using exponential normalisation. For presentation, pipeline performance metrics were aggregated across all laboratory tasks by averaging metric values and summing walking bout counts across tests. Full per-test results for all pipeline combinations are presented in the supplementary materials. All analyses were performed in Python (version 3.12).
Participant-Level Pipeline Analysis
To assess individual-level variation in algorithmic and pipeline validity, a simplified performance index was computed for each participant × algorithm or pipeline combination, averaged across all laboratory tasks. Since population-level metrics including ICC and limits of agreement require multiple participants and cannot be meaningfully computed at the individual level, these were excluded; all remaining metrics from the respective DMO performance indices were retained with weights redistributed proportionally. Algorithms and pipeline combinations were ranked within each participant based on this score. This data-mining approach was applied across GSD (Aim 1) and ICD, SL, cadence, and walking speed (Aim 2) to identify whether systematic variation in validity exists across participants, informing the potential development of personalised analytical pipelines.
To explore whether morbidity profile contributed to such variation, participants were assigned to one or more multimorbidity clusters including Cardiometabolic, Painful Conditions (arthritis, chronic pain, and neurological conditions), Pulmonary, and Cancer, following the disease categories identified via latent class analysis in the UK Biobank cohort by Steell et al. [16,17] for the oldest age strata (65+/74+), comparable to our sample, and cluster-level differences in algorithm rankings were examined.
3. Results
Participants
Laboratory data were valid for 45 of the 50 recruited participants; inclusion required at least one task with both wearable and reference system data available. Demographics and clinical characteristics are presented in Table 1. The most prevalent domains were cardiometabolic and painful conditions (both n = 44, 97%), followed by pulmonary conditions (n = 20, 44%) and cancer (n = 13, 28%). Most participants had conditions spanning multiple MLTC clusters (two clusters: n = 21; three clusters: n = 14; four clusters: n = 8), while only five participants (11%) were assigned to a single cluster.
Algorithmic validation
Gait Sequence Detection
Performance metrics for the GSD algorithms are presented in Table 2. The novel wrist-adapted and fine-tuned Ionescu method [18] achieved the highest performance index (0.72), demonstrating the strongest balance of accuracy (0.85) and recall (0.90) across all evaluated algorithms. Iluz method ranked second (PI=0.69), exhibiting the highest ICC (0.77) and precision (0.86), though with lower specificity (0.72) compared to the top-performing method. Ionescu was therefore selected as the fixed GSD component for all downstream pipeline analyses.
Pipeline True Positive Validation
Initial Contact Detection
Performance metrics for the ICD algorithms evaluated within the wearable pipeline are presented in Table 3. Zijlstra [24] and McCamley [25] achieved the highest performance indices (0.82), with Zijlstra demonstrating the highest precision (0.82) and McCamley the strongest recall (0.77) alongside the lowest absolute timing error (0.12s). Given the narrow performance range across algorithms (PI=0.79–0.82) and overlapping confidence intervals, all nine ICD algorithms were carried forward for downstream pipeline validation.
Cadence
Pipeline performance metrics for cadence estimation are presented in Table 4. The Zijlstra-based cadence estimation achieved the highest performance index (0.76), with the lowest absolute error (6.81 steps/min) and highest ICC (0.67), and a minimal overestimation bias of 2.02 steps/min. Notably, while McCamley ICD method ranked among the top ICD algorithms in isolation, its cadence pipeline performance was lower (0.70), highlighting that ICD accuracy in isolation does not directly translate to cadence estimation accuracy within the full wearable pipeline. The Zijlstra method was therefore identified as the best-performing ICD component for cadence estimation. Figure 2 presents the Bland-Altman plot for cadence estimation of the best-performing pipeline (Ionescu + Zijlstra), illustrating agreement between wearable and reference cadence across all true positive walking bouts. The pipeline demonstrated a small positive bias of 1.76 steps/min with limits of agreement of −16.15 to 19.68 steps/min, indicating a slight systematic overestimation of cadence. Errors were broadly distributed around the bias line with no clear proportional bias across the cadence range.
Stride Length
SL algorithms were first evaluated in isolation using reference-derived walking bouts and initial contacts (Supplementary Table S6); the top three performing algorithms including Weinberg adaptive, Weinberg, and Bylemans adaptive foot augmented versions were carried forward for pipeline evaluation. The top three algorithms achieved absolute errors ranging from 0.09 to 0.14 m. Pipeline performance metrics for SL estimation across all ICD × SL combinations are presented in Table 5. The Weinberg adaptive version consistently outperformed the standard version, with the Gu combination achieving the highest performance index (0.76), a mean absolute error of 0.16 m, and an ICC of 0.64. Notably, while Zijlstra was the top-performing ICD algorithm for cadence estimation, it ranked second for SL paired with the Weinberg adaptive version (performance index=0.75, MAE=0.15 m, ICC=0.63), representing a negligible difference compared to the top combination and with the second performing method having slightly lower error. The performance difference across the top combinations was marginal, with performance index values ranging from 0.74 to 0.76 and overlapping confidence intervals across all Weinberg-based pipelines. Figure 3 presents the Bland–Altman plot for stride length estimation of the best-performing pipeline (Ionescu + Zijlstra + Weinberg adaptive version), illustrating agreement between wearable and reference stride length across all true positive walking bouts. The pipeline demonstrated a negligible bias of −0.03 m with limits of agreement of −0.40 to 0.34 m, indicating minimal systematic error. A biphasic pattern is evident, with overestimation at shorter stride lengths and underestimation at longer stride lengths, consistent with the intensity-based nature of the Weinberg algorithm. Stride length relative error decreased with increasing walking speed and walking bout duration, consistent with an exponential decay pattern, with errors particularly elevated at very low walking speeds and stabilising from approximately 0.6 m/s onward, as shown in Figures S1 and S2.
Walking Speed
Pipeline performance metrics for walking speed estimation across all ICD × SL combinations are presented in Table 6. Consistent with the individual DMO rankings, the Zijlstra IC combined with Weinberg SL adaptive achieved the highest performance index (PI=0.75), with a mean absolute error of 0.14 m/s and an ICC of 0.65, confirming that the best-performing ICD algorithm for cadence and the best-performing SL algorithm together yielded the optimal walking speed pipeline. Performance declined progressively with lower-ranked ICD and SL combinations, with MicoAmigo IC-based pipelines performing substantially worse regardless of SL algorithm, reaching absolute errors of up to 0.61 m/s. Figure 4 presents the Bland–Altman plot for walking speed estimation of the best-performing pipeline (Ionescu + Zijlstra + Weinberg adaptive), illustrating agreement between wearable and reference walking speed across all true positive walking bouts. The pipeline demonstrated a negligible bias of −0.02 m/s with limits of agreement of −0.36 to 0.32 m/s, indicating minimal systematic error. A clear negative proportional bias is evident, with overestimation at slower walking speeds and underestimation at faster walking speeds, consistent with the known speed-dependent behaviour of intensity-based stride length algorithms. Figure 5 presents walking speed absolute error stratified by walking bout duration for the best-performing pipeline. Errors were highest for the shortest walking bouts (≤10s, median ≈0.14 m/s) and decreased progressively with longer bout durations, with the lowest errors observed for bouts between 60 and 120 seconds (median ≈0.06 m/s). The influence of task complexity on walking speed error is presented in Supplementary Figure S3.
Combined Evaluation
Combined evaluation performance metrics for the best-performing modular pipeline are presented in Table 7. The pipeline comprised Ionescu GSD, Zijlstra IC for step detection, cadence, and walking speed, and Weinberg adaptive variant SL throughout. Given that stride length estimation relies on initial contact detection, Gu IC was selected for this component as it demonstrated superior accuracy for SL estimation in the true positive evaluation, reflecting the modular nature of the pipeline.
Participant-Level Pipeline Analysis
Per-participant performance loss from the population-best modular pipeline across all DMOs is presented in Figure 6, with participants grouped by multimorbidity cluster combination. The population-best pipeline demonstrated low loss across many participants, with a substantial proportion of cells equal to 0%, indicating that the universal pipeline is near-optimal for a large part of the sample. Descriptively, participants with conditions confined to a single multimorbidity cluster showed higher mean performance loss across all DMOs compared with those spanning two, three, or four clusters (Supplementary Table S7), suggesting that the universal pipeline performs best in participants with more complex multimorbidity profiles. Cadence showed consistently low performance loss across all participants and cluster combinations, confirming its robustness as a universal pipeline output. Performance loss for ICD, SL, and WS was more variable across cluster groups, consistent with the population-level finding that initial contact detection and spatial estimation represent the primary sources of pipeline error.
4. Discussion
Main Findings
This study presents the first wrist-derived composite DMO pipeline capable of estimating cadence, stride length, and walking speed at the level of individual walking bouts, validated in older adults with multiple long-term conditions. The pipeline adopts a modular design in which the optimal signal processing algorithm is selected independently for each DMO, with Ionescu for GSD, Zijlstra for ICs, cadence and walking speed, and Gu IC with Weinberg adaptive SL for stride length estimation. All algorithms employed are novel wrist-adapted, fine-tuned versions of established methods developed and optimised in our previous work [9] using an independent sample, with fine-tuning conducted entirely independently of the present validation cohort. This modular approach extends our previous work [9], which validated individual components using reference-fed inputs, to a fully wearable cascade where errors accumulate naturally across pipeline stages. The best-performing pipeline achieved a walking speed MAE of 0.14 m/s, representing high agreement with stereophotogrammetry. Critically, in the context of longitudinal monitoring where DMOs are aggregated across multiple walking bouts (e.g., weekly aggregates), random error is expected to average out, leaving bias as the more representative indicator of accuracy for detecting change over time; here, the pipeline demonstrated a near-zero walking speed bias (−0.01 m/s), well within the 0.10–0.20 m/s range considered clinically meaningful for gait speed change across patient groups [34], supporting its potential for detecting real, clinically important change in pre-post or longitudinal deployment. Bland-Altman analysis revealed that cadence errors were well distributed with no systematic bias (Figure 2). Stride length errors fell within acceptable limits of agreement, though the Bland-Altman plot revealed a clear negative proportional bias with the pipeline overestimating at shorter stride lengths and underestimating at longer stride lengths, consistent with the speed-dependent nature of the intensity-based Weinberg algorithm (Figure 3). Walking speed showed a similar pattern, driven by the stride length component (Figure 4).
Novelty
This is the first study to derive and validate composite pipeline blocks including cadence, stride length, and walking speed, from a wrist-worn device, closing the gap between wrist accessibility and clinical validity. Previous work validated algorithms in isolation using reference-fed inputs [9]; the present study advances this to a full pipeline evaluation where wearable-derived inputs are used at every stage. A novel scaled pipeline evaluation approach ensures that error propagation is realistically captured, and a novel walking speed performance index incorporating ICC, MAE, MARE, and limits of agreement extends the previous ranking frameworks [6,35] to whole pipeline ranking.
Comparison with Previous Work in MLTCs
The per-participant analysis demonstrated that the population-best pipeline performed near-optimally for the majority of participants, with performance loss approaching zero for most individuals. Descriptively, participants with conditions confined to a single multimorbidity cluster showed higher mean loss across all DMOs compared with those spanning two or more clusters, suggesting that the pipeline is best suited to individuals with more complex multimorbidity profiles, consistent with the intended target population for which it was developed. The present sample was specifically recruited for this validation purpose and represents a real-world population of older adults with MLTC (age range 65 to 90 years), characterised by at least one multimorbidity cluster according to UK Biobank categories for this age range [16]. This cohort was more clinically impaired than that in our previous validation study [9], which included younger participants with a primary condition and at least one comorbidity. Consequently, algorithmic ranking and validity differed between the two studies, supporting the notion that algorithm optimisation is population-specific and that this more clinically impaired population requires a distinct algorithmic approach. Formal subsample analyses were not pursued as stratification would reduce walking bout counts below the pre-specified minimum of 100 required for adequate statistical power in the true positive evaluation.
In terms of the ICD analysis, although Zijlstra IC ranked first at the population level, it was the individual-level best performer for only one participant. This apparent discrepancy reflects the narrow performance range across all ICD algorithms (PI range 0.79–0.82) rather than true algorithmic superiority. Zijlstra IC demonstrated consistent, stable performance across all participants (albeit ranking first only in one participant), while other algorithms showed greater individual-level variability, despite ranking first in several participants. This stability justifies its selection as the universal ICD component.
Comparison with Mobilise-D Lower-Back Pipeline Validation
Pipeline performance was speed-dependent and task-complexity-dependent, consistent with Kirk et al. [6]. Our wrist-derived walking speed results (MAE 0.14 m/s) are slightly lower than those reported for lower-back sensors across multiple conditions (MAE 0.10–0.14 m/s, population average 0.12 m/s), which is expected given the inherently noisier wrist signal and the higher multimorbidity burden of the present sample. Cadence estimation showed the largest deviation from the validation work in Mobilise-D, with a MARE of approximately 10% compared to 4.1% reported by Kirk et al. [6] for lower-back sensors. This is consistent with the aforementioned challenge of detecting step timing from the wrist, where signal complexity and arm swing variability make precise initial contact detection inherently more difficult than from a lumbar-mounted device. Stride length estimation from the wrist achieved a bias of −0.02 m with limits of agreement of −0.32 to 0.28 m and an absolute error of 0.15 m; remarkably close to the lower-back Mobilise-D pipeline (bias 0.04 m, LoA −0.27 to 0.34 m, absolute error 0.12 m) [6]. It should be noted that the Mobilise-D pipeline uses biomechanics-based SL methods with direct vertical displacement signals from a lumbar sensor, while the present pipeline relies solely on intensity-based adaptive algorithms developed for the wrist. Achieving near-zero bias at the population level from a sensor with no direct biomechanical grounding for spatial estimation demonstrates that appropriately fine-tuned wrist-adapted methods can match lower-back accuracy in laboratory settings, with significant implications for the clinical adoption of accessible, unobtrusive wearable technology.
Comparison with Best Performing Wrist Algorithms
ElderNet is, to our knowledge, the only existing work beyond the present study to extract composite DMOs including walking speed, cadence, and stride length from a wrist-worn device [36]. It is a self-supervised deep learning model fine-tuned on the Mobilise-D TVS dataset. However, a critical methodological distinction applies to all ElderNet comparisons: validation was performed using reference-identified walking bouts of at least 10 seconds duration, rather than a fully wearable end-to-end pipeline. In the present multimorbid sample, the large majority of walking bouts are shorter than 10 seconds (Figure 4), meaning ElderNet's validation conditions do not reflect the real-world deployment scenario faced here. For walking speed, ElderNet reported a MAE of 0.088 m/s. The present pipeline reports an overall MAE of 0.14 m/s; however, when restricted to bouts exceeding 10 seconds (equivalent validation conditions), walking speed absolute error matches or exceeds (60-120s WBs, Figure 4) ElderNet's accuracy despite operating on a fully wearable cascade in a considerably more impaired population. For cadence, ElderNet achieved a MAE of 3.11 steps/min, outperforming the present pipeline and highlighting initial contact detection as the primary area where deep learning offers a clear advantage over traditional wrist-adapted signal processing. For stride length, ElderNet reported a MAE of 11.61 cm compared to 15 cm in the present study; however, this difference is further confounded by the healthier Mobilise-D TVS cohort. Notably, stride length error in the present pipeline drops and stabilises above the 10-second bout duration threshold (Supplementary Figure S1), suggesting that the overall error is disproportionately driven by very short bouts. Both approaches demonstrate that wrist-derived composite DMO estimation is now approaching clinical utility. However, this comparison should be interpreted cautiously, as ElderNet, a self-supervised learning foundation model with supervised deep learning training on free-living data, may have learned more generalisable gait features than those captured by the rule-based signal processing methods used in the present manuscript, which may not transfer as well to real-world deployment.
Limitations, future research directions, and contextualisation within prior single-condition cohorts
The present validation was conducted under laboratory conditions, where most walking bouts were very short, inflating overall error estimates. However, this reflects the genuine mobility capacity of the target population who have high multimorbidity burden and severely impaired gait, for whom prolonged instrumented assessments in real-world conditions are not clinically feasible. Indeed, comfortable walking speed in the present cohort was slower than in most previously validated Mobilise-D single-condition cohorts (CHF, COPD, MS, PD), with the exception of PFF [6], reflecting the compounded gait impairment associated with multimorbidity rather than a single disease process. Additionally, wrist movement patterns in a controlled laboratory setting may not fully reflect the complexity and variability of free-living arm swing, which could affect pipeline performance in real-world deployment [3,37]. The present study alongside the latest work by our team and Mobilise-D [6,9], may represent the ceiling of signal processing-based approaches for gait estimation. While population-level validity is encouraging, the observed limits of agreement and moderate ICC values for stride length and walking speed suggest that individual-level clinical deployment, which requires detecting meaningful change within a single patient, warrants further development and validation. The logical next step is the development of robust deep learning and transfer learning models designed to operate within the newly developed modular pipeline, to further improve accuracy and while capable of covering the full range of real-world gait analysis needs.
5. Conclusions
This study presents the first validated wrist-worn modular pipeline for the estimation of cadence, stride length, and walking speed in older adults with multiple long-term conditions. The pipeline achieves walking speed accuracy comparable to lower-back sensors and, for bouts exceeding 10 seconds, is comparable to deep learning approaches, despite being evaluated in a more clinically impaired population using a fully wearable cascade. Cadence estimation remains the primary bottleneck, reflecting the inherent challenge of initial contact detection from the wrist. The modular design, in which algorithms are independently optimised for each DMO, demonstrated robustness across a clinically heterogeneous sample, with the population-best pipeline performing near-optimally for the majority of participants. These findings support the clinical adoption of wrist-worn devices for objective gait assessment in multimorbid populations and establish a validated open-source pipeline as a foundation for real-world deployment and future personalised approaches to care.
Supplementary Materials
The following supporting information can be downloaded at the website of this paper posted on Preprints.org, Figure S1: Stride length relative error versus walking bout duration for the best-performing pipeline; Figure S2: Stride length relative error versus reference walking speed for the best-performing pipeline; Figure S3: Absolute walking speed error by laboratory task for the best-performing pipeline; Table S1: GSD performance index weights; Table S2: ICD performance index weights; Table S3: SL performance index weights; Table S4: CAD performance index weights; Table S5: WS performance index weights; Table S6: Stride length algorithm performance metrics evaluated using reference-derived walking bouts and initial contacts; Table S7: Mean and median percentage performance loss from the population-best modular pipeline by number of multimorbidity clusters.
Author Contributions
Conceptualization, D.M., I.V and S.D.D.; methodology, D.M., I.V and S.D.D.; software, D.M.; validation, D.M.; formal analysis, D.M.; investigation, L.A, K.S.; resources, D.M., L.A., K.S., H.H., I.V., S.D.D.; data curation, D.M., L.A., K.S., H.H.; writing—original draft preparation, D.M.; writing—review and editing, D.M., L.A., K.S., H.H., I.V., S.D.D.; visualization, D.M.; funding acquisition, D.M., L.A., K.S., H.H., I.V., S.D.D. All authors have read and agreed to the published version of the manuscript.
Funding
This work was supported by the Medical Research Council (UKRI/MR/B000091/1).
Institutional Review Board Statement
Institutional Review Board Statement: The study was conducted in accordance with the Declaration of Helsinki, and approved by the NHS Health Research Authority North East – York Research Ethics Committee (2 Redman Place, Stratford, London, E20 1JQ, United Kingdom; ref: 24/NE/0131; approval date: 11/07/2024).
Informed Consent Statement
Informed consent was obtained from all participants involved in the study.
Data Availability Statement
At the time of writing, the data presented in this study are not publicly available due to institutional and ethical restrictions, but may be made available in the future, subject to institutional approval.
Acknowledgments
The authors would like to acknowledge all participants for their generous contribution of their time. The authors would like to thank Professor Yifeng Zeng and Mr Christian Tucker for their support with computational infrastructure.
Conflicts of Interest
D.M., L.A., K.S., and I.V. have nothing to disclose. S.D.D., H.H. are shareholders in Enoda Health Ltd.
Abbreviations
The following abbreviations are used in this manuscript:
| DMO(s) | Digital Mobility Outcome(s) |
| MLTC | Multiple Long-Term Conditions |
| GSD | Gait Sequence Detection |
| ICD | Initial Contact Detection |
| IC(s) | Initial Contact(s) |
| SL | Stride Length |
| CAD | Cadence |
| WS | Walking Speed |
| WB(s) | Walking Bout(s) |
| IMU(s) | Inertial Measurement Unit(s) |
| SP | Stereophotogrammetry |
| ICC | Intraclass Correlation Coefficient |
| CI | Confidence Interval |
| MAE | Mean Absolute Error |
| MARE | Mean Absolute Relative Error |
| LoA | Limits of Agreement |
| PI | Performance Index |
| RMSSD | Root Mean Square of Successive Differences |
| CV | Coefficient of Variation |
| TUG | Timed Up and Go |
| CWT | Continuous Walking Test |
| SDA | Simulated Daily Activities |
| 4-MGS | 4-Metre Gait Speed |
| BMI | Body Mass Index |
| VAS | Visual Analogue Scale |
| FCI | Functional Comorbidity Index |
| TVS | Technical Validation Study |
| CHF | Chronic Heart Failure |
| COPD | Chronic Obstructive Pulmonary Disease |
| MS | Multiple Sclerosis |
| PD | Parkinson's Disease |
| PFF | Proximal Femur Fracture |
| SD | Standard Deviation |
| NHS | National Health Service |
| IRAS | Integrated Research Application System |
References
- Megaritis, D.; et al. The Construct Validity of Real-World Digital Mobility Outcomes in People with Chronic Obstructive Pulmonary Disease. ERJ Open Res. 2026, 00993–2025. [Google Scholar] [CrossRef]
- Brittain, G.; et al. Recruitment of the multiple sclerosis cohort within the European Mobilise-D clinical validation study-lessons learnt, baseline demographics and clinical characteristics. Trials 2026, 27(1), 74. [Google Scholar] [CrossRef] [PubMed]
- Warmerdam, E.; et al. Long-term unsupervised mobility assessment in movement disorders. Lancet Neurol. 2020, 19(5), 462–470. [Google Scholar] [CrossRef] [PubMed]
- Studenski, S.; et al. Gait speed and survival in older adults. Jama 2011, 305(1), 50–8. [Google Scholar] [CrossRef] [PubMed]
- Bakker, J.P.; et al. V3+ extends the V3 framework to ensure user-centricity and scalability of sensor-based digital health technologies. npj Digit. Med. 2025, 8(1), 51. [Google Scholar] [CrossRef] [PubMed]
- Kirk, C.; et al. Mobilise-D insights to estimate real-world walking speed in multiple conditions with a wearable device. Sci. Rep. 2024, 14(1), 1754. [Google Scholar] [CrossRef] [PubMed]
- Ryan, A.; et al. Multimorbidity and functional decline in community-dwelling adults: a systematic review. Health Qual. Life Outcomes 2015, 13, 168. [Google Scholar] [CrossRef] [PubMed]
- Barnett, K.; et al. Epidemiology of multimorbidity and implications for health care, research, and medical education: a cross-sectional study. The Lancet 2012, 380(9836), 37–43. [Google Scholar] [CrossRef]
- Megaritis, D.; et al. Real-World Wrist-Derived Digital Mobility Outcomes in People with Multiple Long-Term Conditions: A Comparison of Algorithms. Bioengineering 2025, 12(10). [Google Scholar] [CrossRef] [PubMed]
- Mazzà, C.; et al. Technical validation of real-world monitoring of gait: a multicentric observational study. BMJ Open 2021, 11(12), e050785. [Google Scholar] [CrossRef] [PubMed]
- Salis, F.; et al. A multi-sensor wearable system for the assessment of diseased gait in real-world conditions. Frontiers in Bioengineering and Biotechnology 2023, 11–2023. [Google Scholar]
- Micó-Amigo, M.E.; et al. Assessing real-world gait with digital technology? Validation, insights and recommendations from the Mobilise-D consortium. J. Neuroeng. Rehabil. 2023, 20(1), 78. [Google Scholar] [CrossRef] [PubMed]
- Megaritis, D. MultiGait: Real-World Gait Pipeline for Wrist-Worn Devices. Zenodo 2025. [Google Scholar]
- Küderle, A.; Tasca, P.; Bicer, M.; Kirk, C.; Megaritis, D.; Hinchliffe, C.; Stihi, A.; Muecke, A.; Babar, Z.; Kluge, F.; Mueller, M. A.; Del Din, C.; Cereatti, S.; Rochester, A.; Rooks, L.; Caulfield, D.B. MobGap - The Mobilise-D algorithm toolbox; Zenodo, 2025. [Google Scholar]
- Bonett, D.G. Sample size requirements for estimating intraclass correlations with desired precision. Stat. Med. 2002, 21(9), 1331–5. [Google Scholar] [CrossRef] [PubMed]
- Steell, L.; et al. Multimorbidity clusters and their associations with health-related quality of life in two UK cohorts. BMC Med. 2025, 23(1), 1. [Google Scholar] [CrossRef] [PubMed]
- Krauth, S.J.; et al. Association of latent class analysis-derived multimorbidity clusters with adverse health outcomes in patients with multiple long-term conditions: comparative results across three UK cohorts. EClinicalMedicine 2024, 74, 102703. [Google Scholar] [CrossRef] [PubMed]
- Paraschiv-Ionescu, A.; et al. Locomotion and cadence detection using a single trunk-fixed accelerometer: validity for children with cerebral palsy in daily life-like conditions. J. Neuroeng. Rehabil. 2019, 16(1), 24. [Google Scholar] [CrossRef] [PubMed]
- Iluz, T.; et al. Automated detection of missteps during community ambulation in patients with Parkinson's disease: a new approach for quantifying fall risk in the community setting. J. Neuroeng. Rehabil. 2014, 11, 48. [Google Scholar] [CrossRef] [PubMed]
- Keren, K.; et al. Quantification of Daily-Living Gait Quantity and Quality Using a Wrist-Worn Accelerometer in Huntington's Disease. Front Neurol. 2021, 12, 719442. [Google Scholar] [CrossRef] [PubMed]
- MacLean, M.K.; et al. Walking Bout Detection for People Living in Long Residential Care: A Computationally Efficient Algorithm for a 3-Axis Accelerometer on the Lower Back. Sensors 2023, 23(21). [Google Scholar] [CrossRef] [PubMed]
- Hickey, A.; et al. Detecting free-living steps and walking bouts: validating an algorithm for macro gait analysis. Physiol. Meas. 2017, 38(1), N1–n15. [Google Scholar] [PubMed]
- Kheirkhahan, M.; et al. Adaptive walk detection algorithm using activity counts. In 2017 IEEE EMBS International Conference on Biomedical & Health Informatics (BHI); IEEE, 2017. [Google Scholar]
- Zijlstra, W.; Hof, A.L. Assessment of spatio-temporal gait parameters from trunk accelerations during human walking. Gait Posture 2003, 18(2), 1–10. [Google Scholar] [CrossRef] [PubMed]
- McCamley, J.; et al. An enhanced estimate of initial contact and final contact instants of time using lower trunk inertial sensor data. Gait Posture 2012, 36(2), 316–8. [Google Scholar] [CrossRef] [PubMed]
- Ducharme, S.W.; et al. A Transparent Method for Step Detection using an Acceleration Threshold. J. Meas. Phys. Behav. 2021, 4(4), 311–320. [Google Scholar] [CrossRef] [PubMed]
- Gu, F.; et al. Robust and accurate smartphone-based step counting for indoor localization. IEEE Sens. J. 2017, 17(11), 3453–3460. [Google Scholar] [CrossRef]
- Micó-Amigo, M.E.; et al. A novel accelerometry-based algorithm for the detection of step durations over short episodes of gait in healthy elderly. J. Neuroeng. Rehabil. 2016, 13, 38. [Google Scholar] [CrossRef] [PubMed]
- Lee, H.-K.; et al. Computational methods to detect step events for normal and pathological gait evaluation using accelerometer. Electron. Lett. 2010, 46(17), 1185–1187. [Google Scholar] [CrossRef]
- Pham, M.H.; et al. Validation of a Step Detection Algorithm during Straight Walking and Turning in Patients with Parkinson's Disease and Older Adults Using an Inertial Measurement Unit at the Lower Back. Front Neurol. 2017, 8, 457. [Google Scholar] [CrossRef] [PubMed]
- Shin, S.H.; Park, C.G. Adaptive step length estimation algorithm using optimal parameters and movement status awareness. Med. Eng. Phys. 2011, 33(9), 1064–71. [Google Scholar] [CrossRef] [PubMed]
- Weinberg, H. Using the ADXL202 in Pedometer and Personal Navigation Applications. 2002. [Google Scholar]
- Bylemans, I.; Weyn, M.; Klepal, M. Mobile phone-based displacement estimation for opportunistic localisation systems. In 2009 Third International Conference on Mobile Ubiquitous Computing, Systems, Services and Technologies; IEEE, 2009. [Google Scholar]
- Bohannon, R.W.; Glenney, S.S. Minimal clinically important difference for change in comfortable gait speed of adults with pathology: a systematic review. J. Eval. Clin. Pract. 2014, 20(4), 295–300. [Google Scholar] [CrossRef] [PubMed]
- Bonci, T.; et al. An Objective Methodology for the Selection of a Device for Continuous Mobility Assessment. Sensors 2020, 6509. [Google Scholar] [CrossRef] [PubMed]
- Brand, Y.E.; et al. Continuous assessment of daily-living gait using self-supervised learning of wrist-worn accelerometer data. npj Digit Med. 2026, 9(1). [Google Scholar] [CrossRef] [PubMed]
- Mirelman, A.; et al. Effects of Aging on Arm Swing during Gait: The Role of Gait Speed and Dual Tasking. PLoS ONE 2015, 10(8), e0136043. [Google Scholar] [CrossRef] [PubMed]
Figure 1.
Visual presentation of the pipeline and validation structure. Pipeline blocks: sequential algorithmic blocks. Data input: wearable-derived inputs at each stage. True positive evaluation: algorithms assessed on walking bouts detected by both systems (≥85% overlap). Combined evaluation: algorithms assessed on mean DMO values across all detected bouts.
Figure 1.
Visual presentation of the pipeline and validation structure. Pipeline blocks: sequential algorithmic blocks. Data input: wearable-derived inputs at each stage. True positive evaluation: algorithms assessed on walking bouts detected by both systems (≥85% overlap). Combined evaluation: algorithms assessed on mean DMO values across all detected bouts.
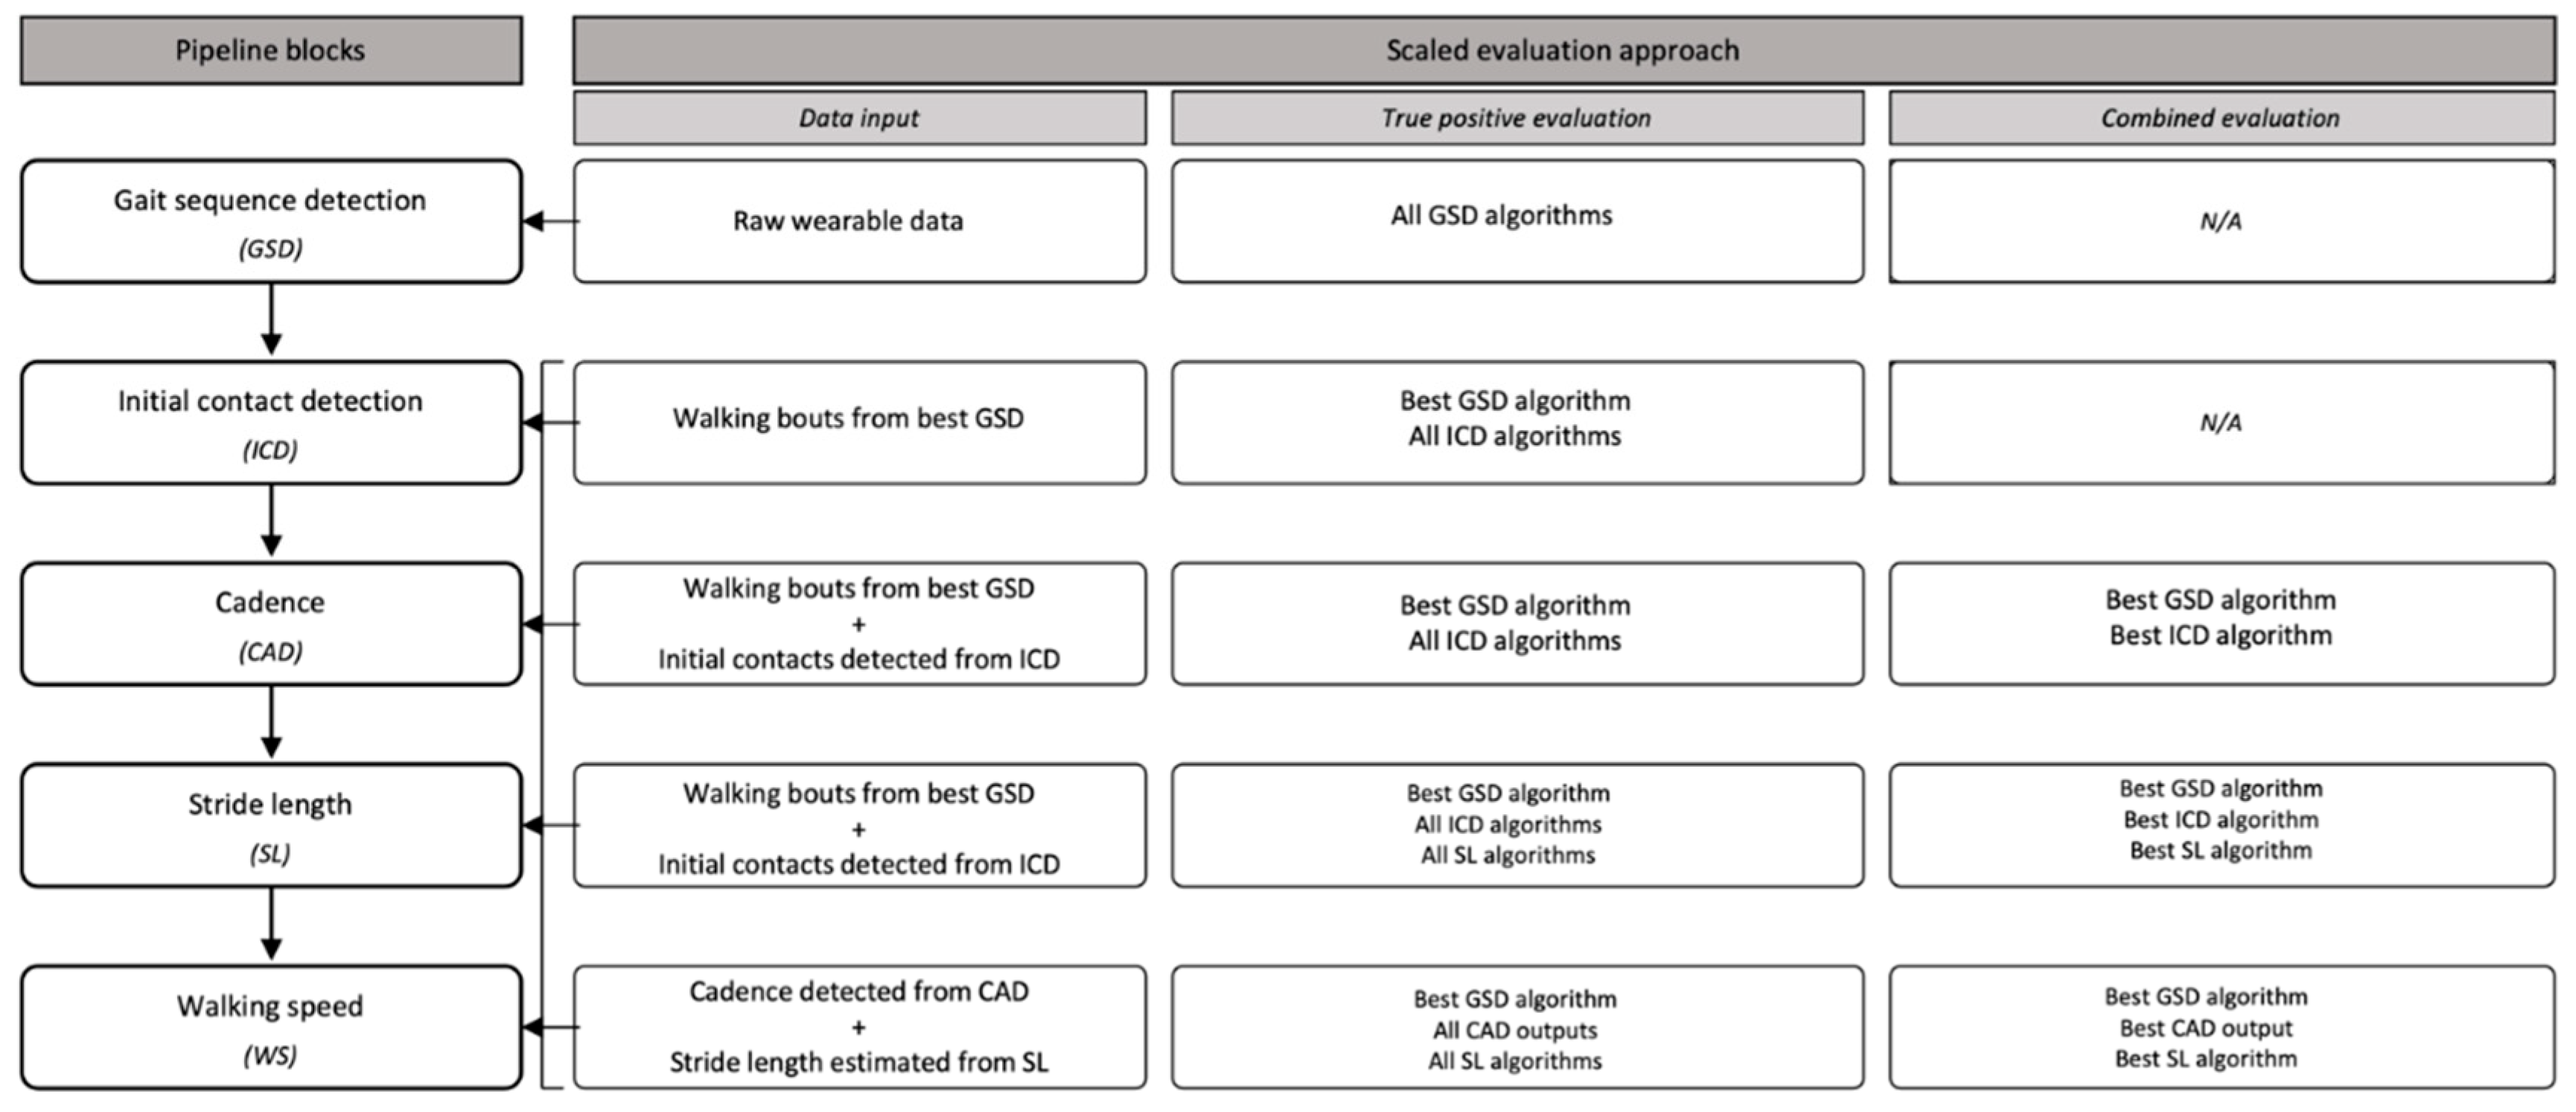
Figure 2.
Bland–Altman plot of cadence estimation for the best-performing pipeline (Ionescu GSD + Zijlstra ICD), showing the difference between wearable-derived and reference cadence against their mean across all true positive walking bouts. The dashed black line represents the mean bias and the dotted red lines represent the 95% limits of agreement. Each point represents one walking bout, colour-coded by laboratory task. SW: straight walking; Comf: comfortable speed; Slow: slow speed; Fast: fast speed; TUG: Timed Up and Go; LTest: L-shaped walking test; CWT: Continuous Walking Test; SDA: Simulated Daily Activities.
Figure 2.
Bland–Altman plot of cadence estimation for the best-performing pipeline (Ionescu GSD + Zijlstra ICD), showing the difference between wearable-derived and reference cadence against their mean across all true positive walking bouts. The dashed black line represents the mean bias and the dotted red lines represent the 95% limits of agreement. Each point represents one walking bout, colour-coded by laboratory task. SW: straight walking; Comf: comfortable speed; Slow: slow speed; Fast: fast speed; TUG: Timed Up and Go; LTest: L-shaped walking test; CWT: Continuous Walking Test; SDA: Simulated Daily Activities.
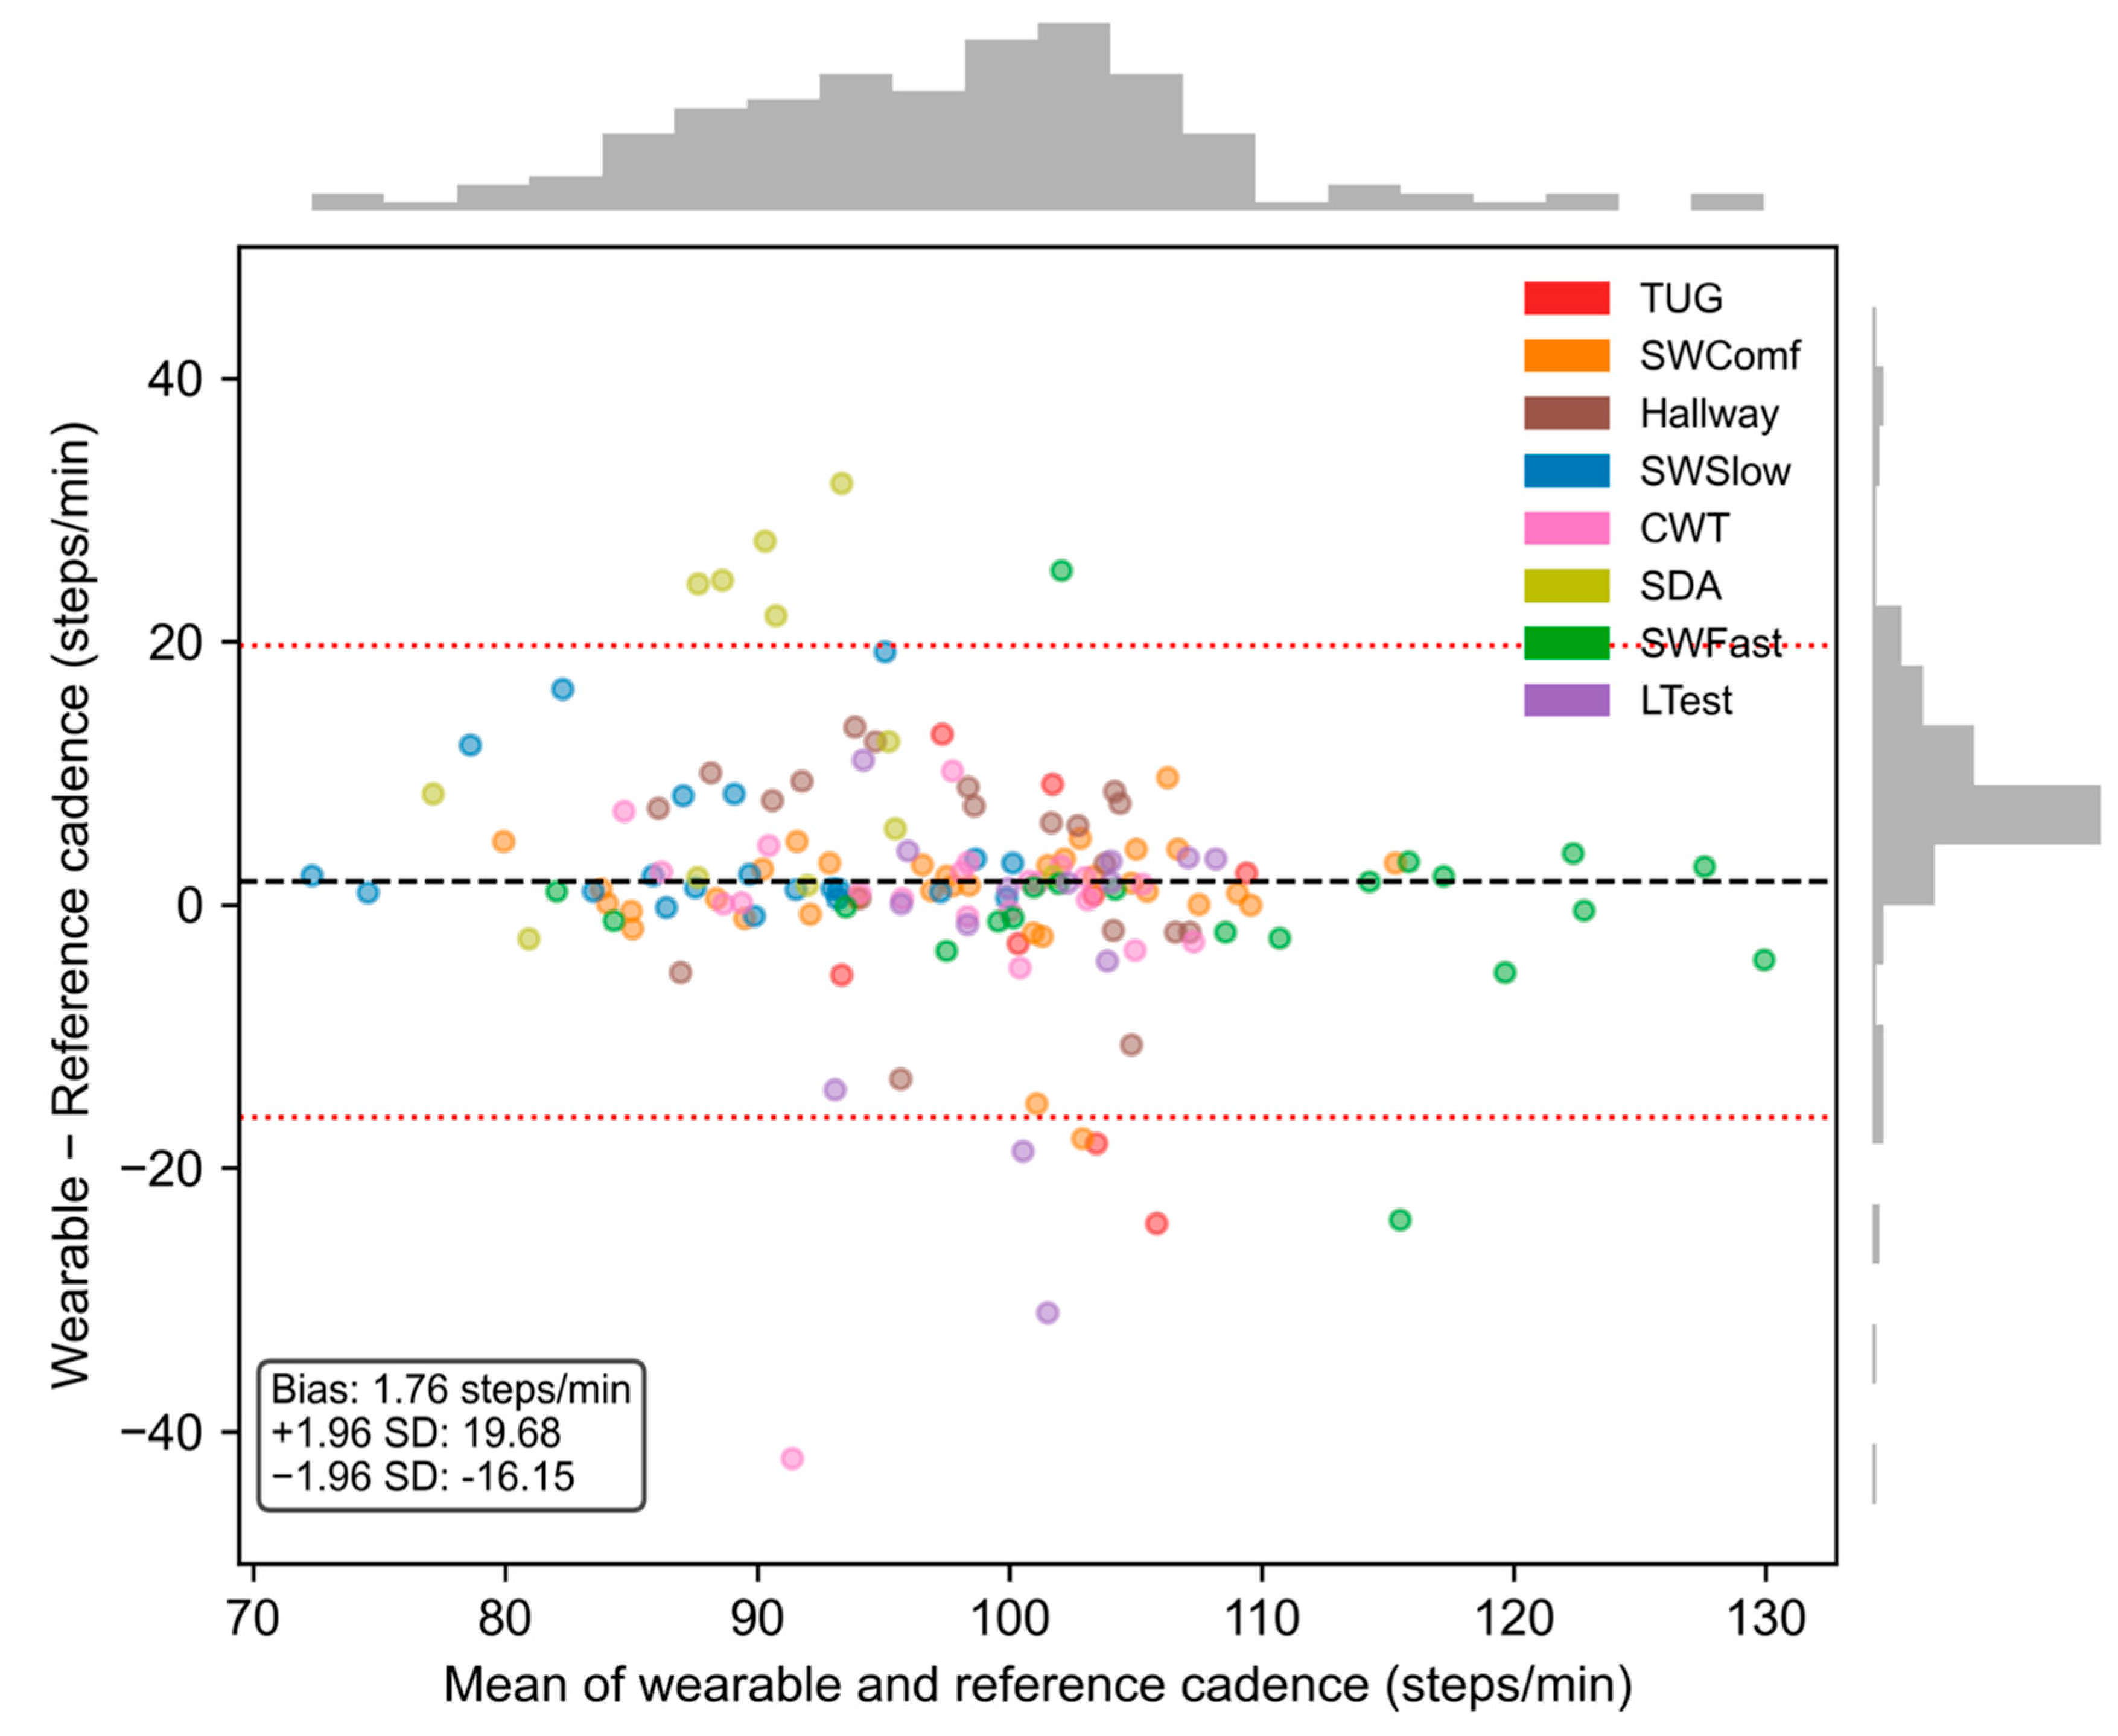
Figure 3.
Bland–Altman plot of stride length estimation for the best-performing pipeline (IonescuGSD + ZijlstraIC + WeinbergSL adaptive), showing the difference between wearable-derived and reference stride length against their mean across all true positive walking bouts. The dashed black line represents the mean bias and the dotted red lines represent the 95% limits of agreement. Each point represents one walking bout, colour-coded by laboratory task. SW: straight walking; Comf: comfortable speed; Slow: slow speed; Fast: fast speed; TUG: Timed Up and Go; LTest: L-shaped walking test; CWT: Continuous Walking Test; SDA: Simulated Daily Activities.
Figure 3.
Bland–Altman plot of stride length estimation for the best-performing pipeline (IonescuGSD + ZijlstraIC + WeinbergSL adaptive), showing the difference between wearable-derived and reference stride length against their mean across all true positive walking bouts. The dashed black line represents the mean bias and the dotted red lines represent the 95% limits of agreement. Each point represents one walking bout, colour-coded by laboratory task. SW: straight walking; Comf: comfortable speed; Slow: slow speed; Fast: fast speed; TUG: Timed Up and Go; LTest: L-shaped walking test; CWT: Continuous Walking Test; SDA: Simulated Daily Activities.
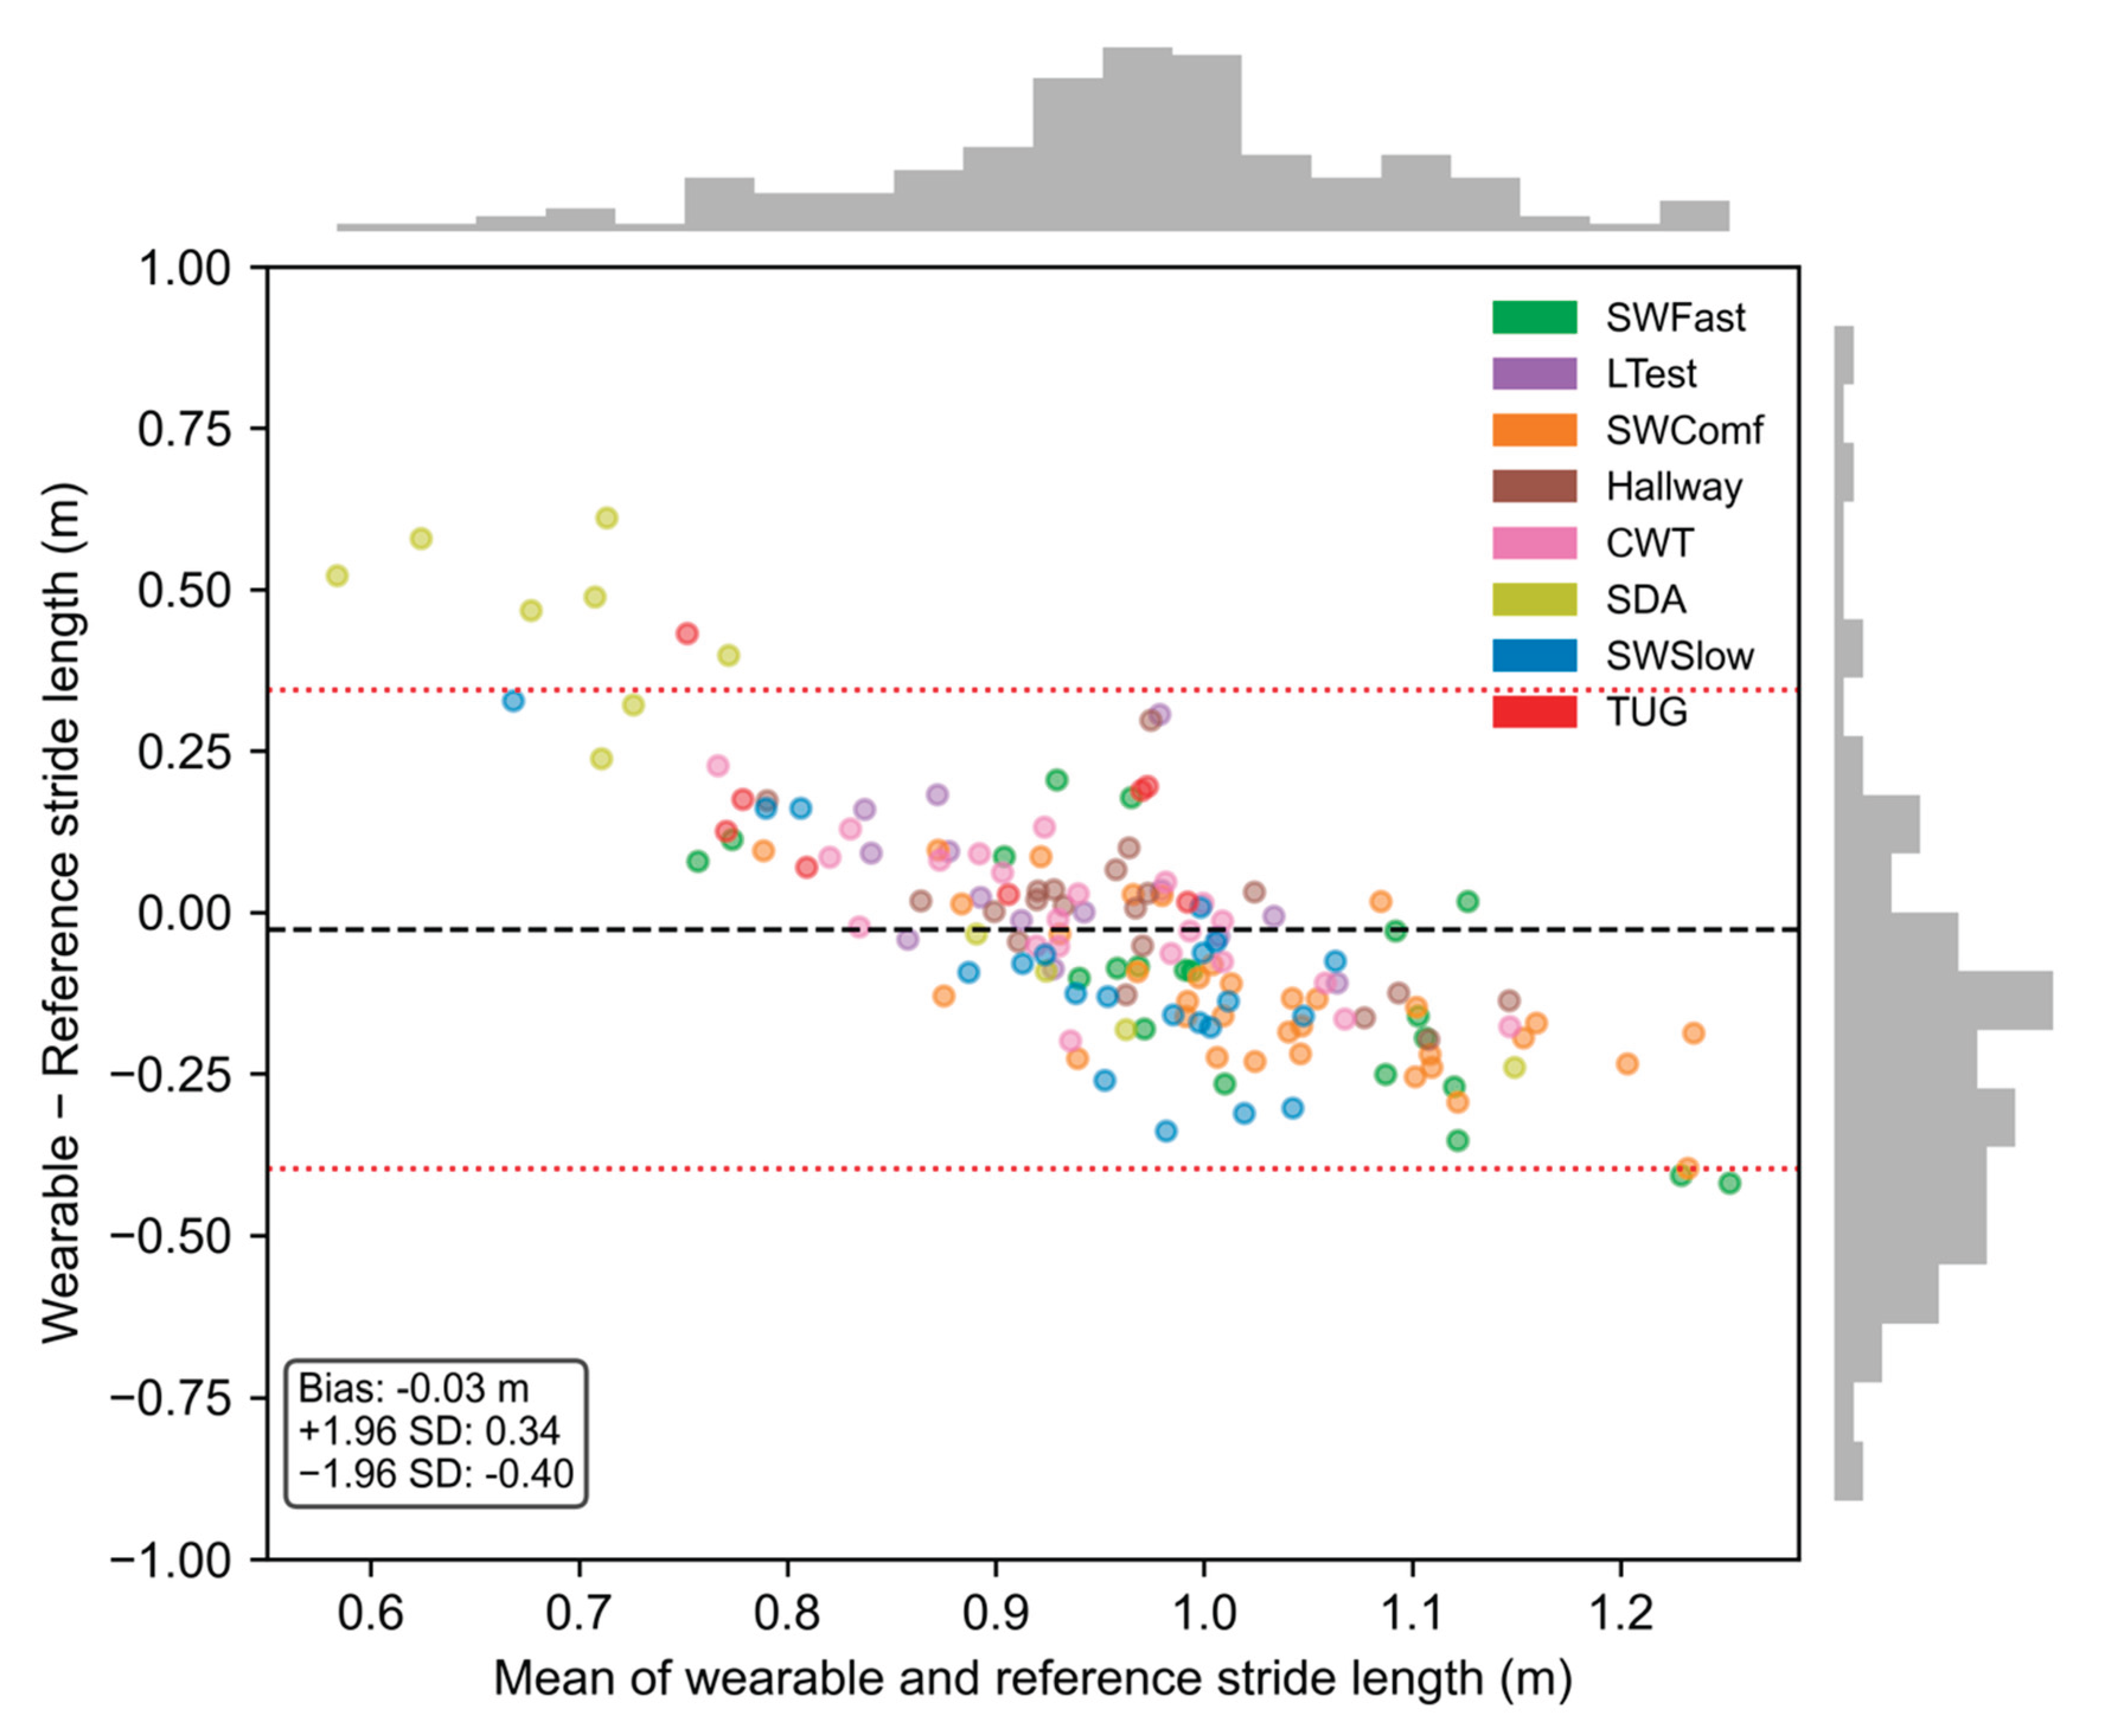
Figure 4.
Bland–Altman plot of walking speed estimation for the best-performing pipeline (Ionescu + Zijlstra + Weinberg adaptive), showing the difference between wearable-derived and reference walking speed against the reference walking speed across all true positive walking bouts. The dashed black line represents the mean bias and the dotted red lines represent the 95% limits of agreement. Each point represents one walking bout, colour-coded by laboratory task. SW: straight walking; Comf: comfortable speed; Slow: slow speed; Fast: fast speed; TUG: Timed Up and Go; LTest: L-shaped walking test; CWT: Continuous Walking Test; SDA: Simulated Daily Activities.
Figure 4.
Bland–Altman plot of walking speed estimation for the best-performing pipeline (Ionescu + Zijlstra + Weinberg adaptive), showing the difference between wearable-derived and reference walking speed against the reference walking speed across all true positive walking bouts. The dashed black line represents the mean bias and the dotted red lines represent the 95% limits of agreement. Each point represents one walking bout, colour-coded by laboratory task. SW: straight walking; Comf: comfortable speed; Slow: slow speed; Fast: fast speed; TUG: Timed Up and Go; LTest: L-shaped walking test; CWT: Continuous Walking Test; SDA: Simulated Daily Activities.
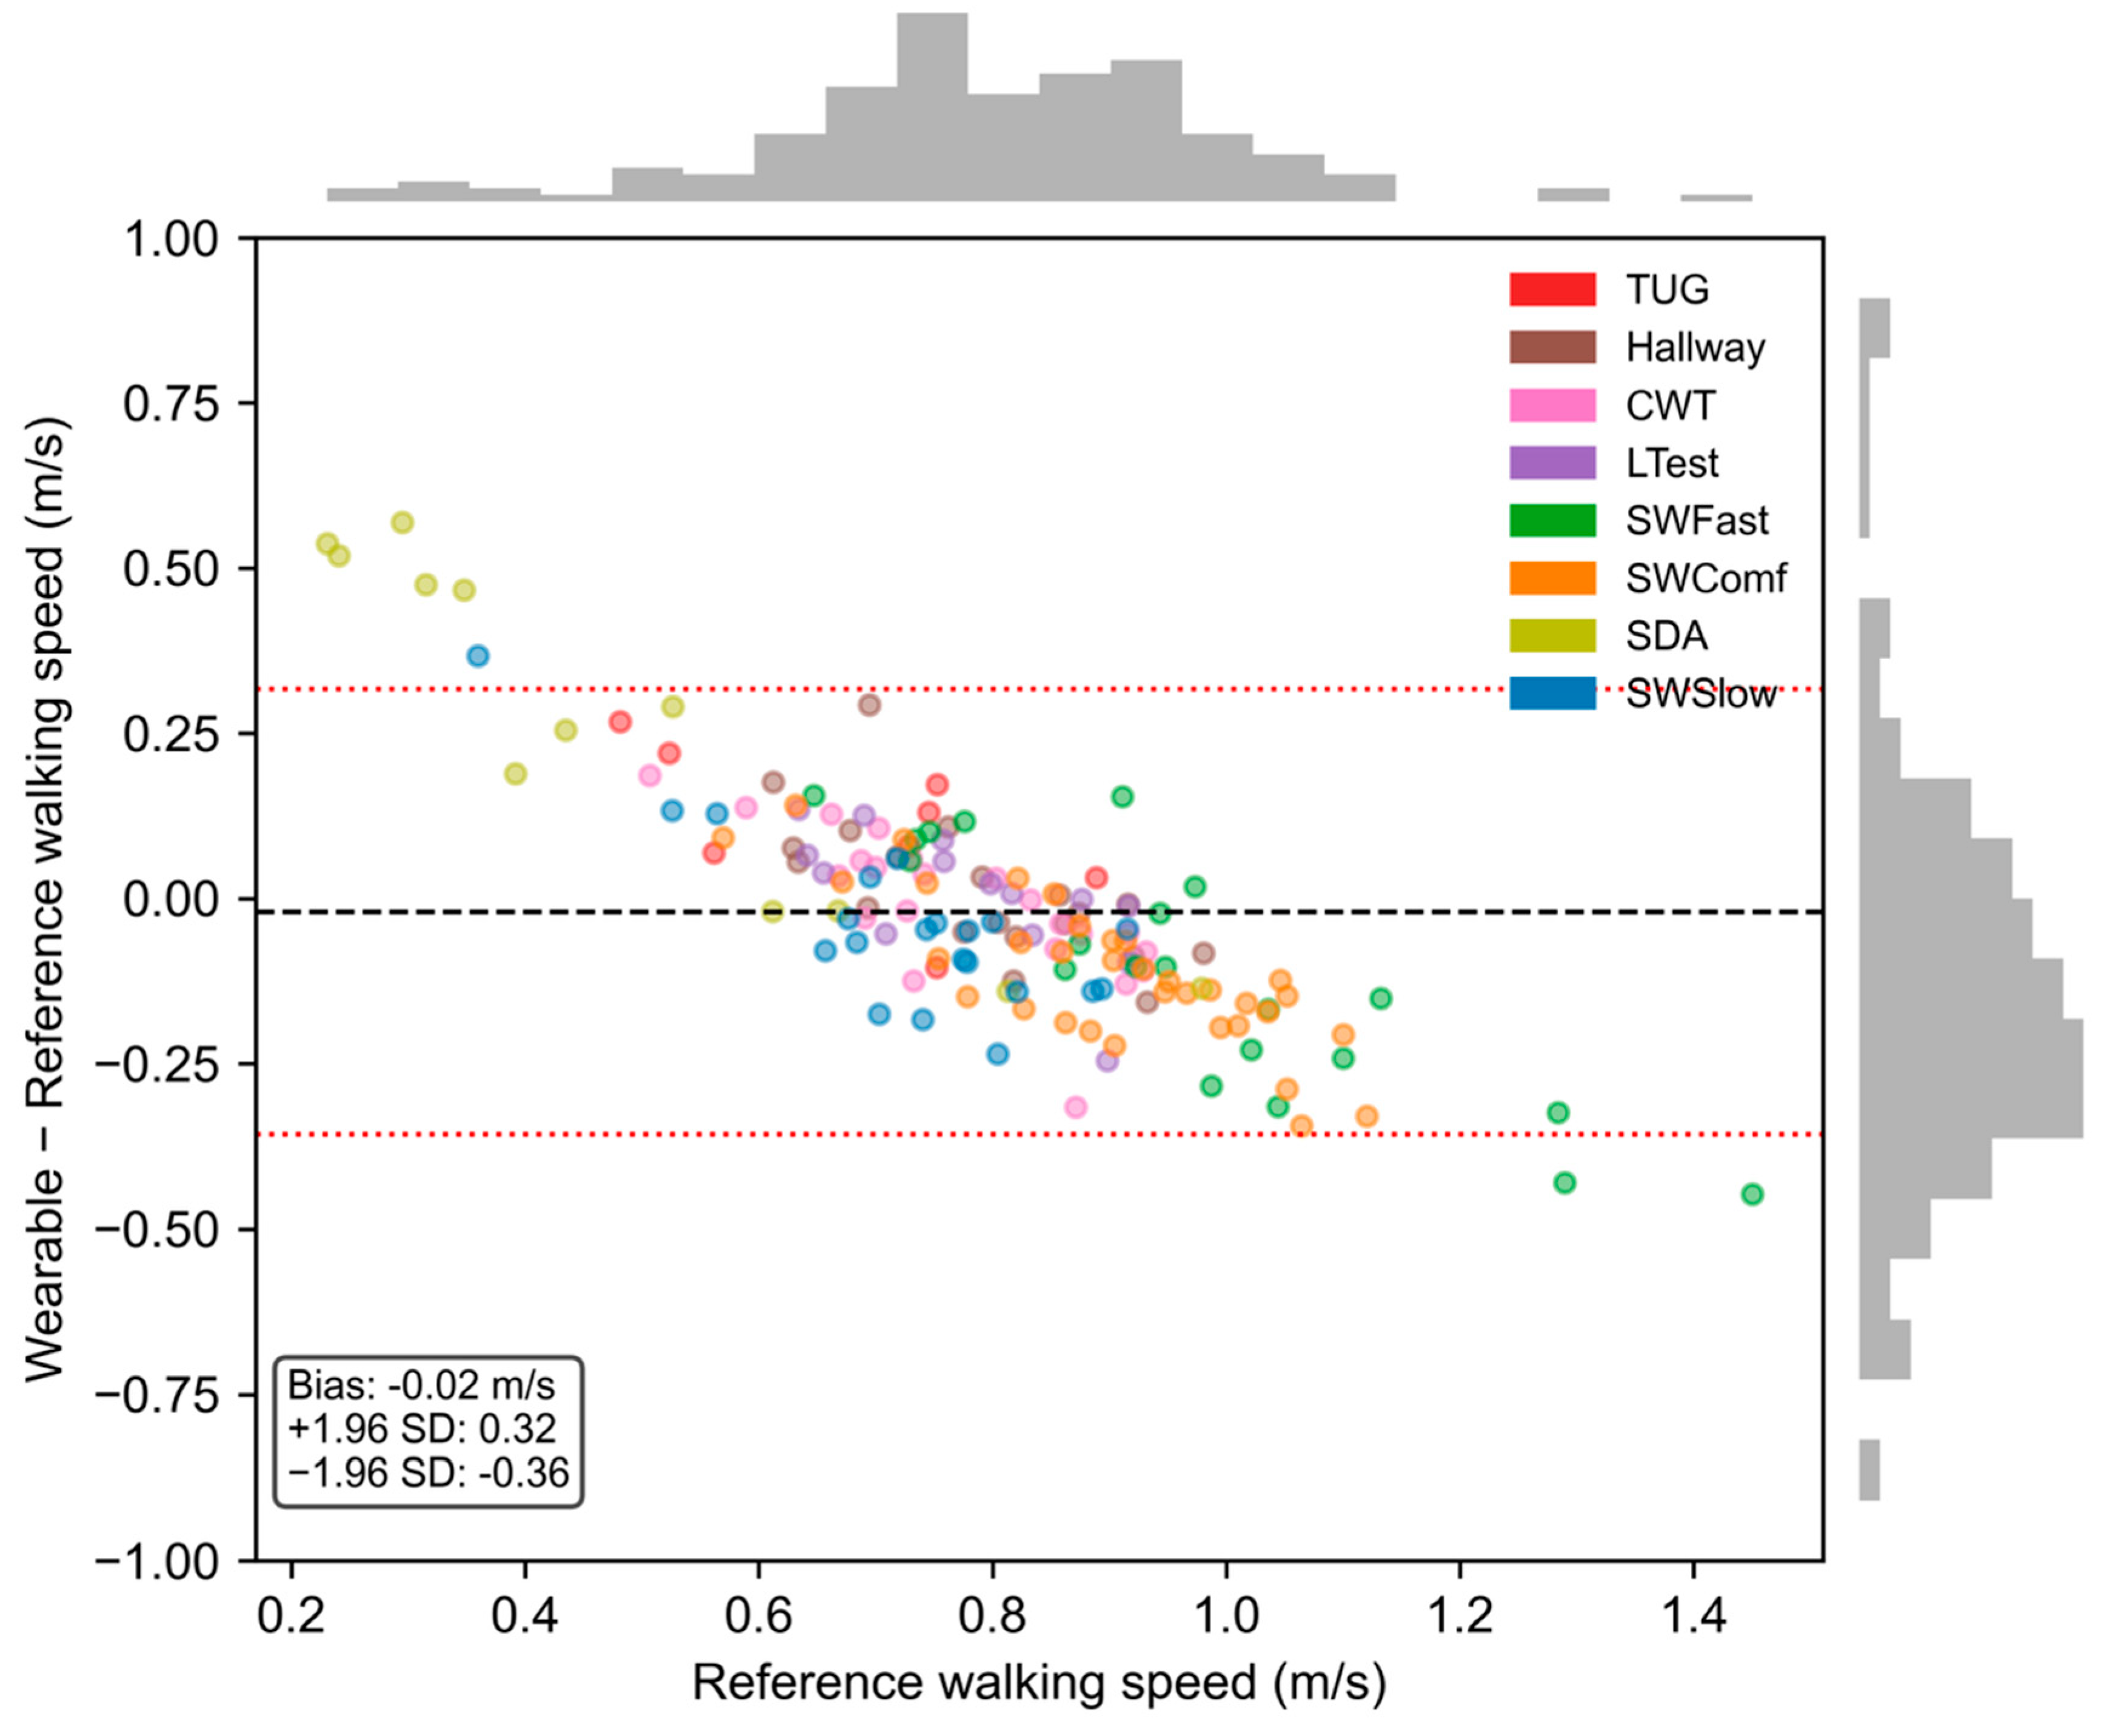
Figure 5.
Absolute walking speed error stratified by walking bout duration for the best-performing pipeline (Ionescu + Zijlstra + Weinberg adaptive). Upper panel shows boxplots of absolute error per duration category across all true positive walking bouts; the horizontal black line represents the median, boxes represent the interquartile range, whiskers extend to 1.5× IQR, and diamonds represent outliers. Lower panel shows the number of true positive walking bouts in each duration category. Walking bouts exceeding 120 seconds were excluded.
Figure 5.
Absolute walking speed error stratified by walking bout duration for the best-performing pipeline (Ionescu + Zijlstra + Weinberg adaptive). Upper panel shows boxplots of absolute error per duration category across all true positive walking bouts; the horizontal black line represents the median, boxes represent the interquartile range, whiskers extend to 1.5× IQR, and diamonds represent outliers. Lower panel shows the number of true positive walking bouts in each duration category. Walking bouts exceeding 120 seconds were excluded.
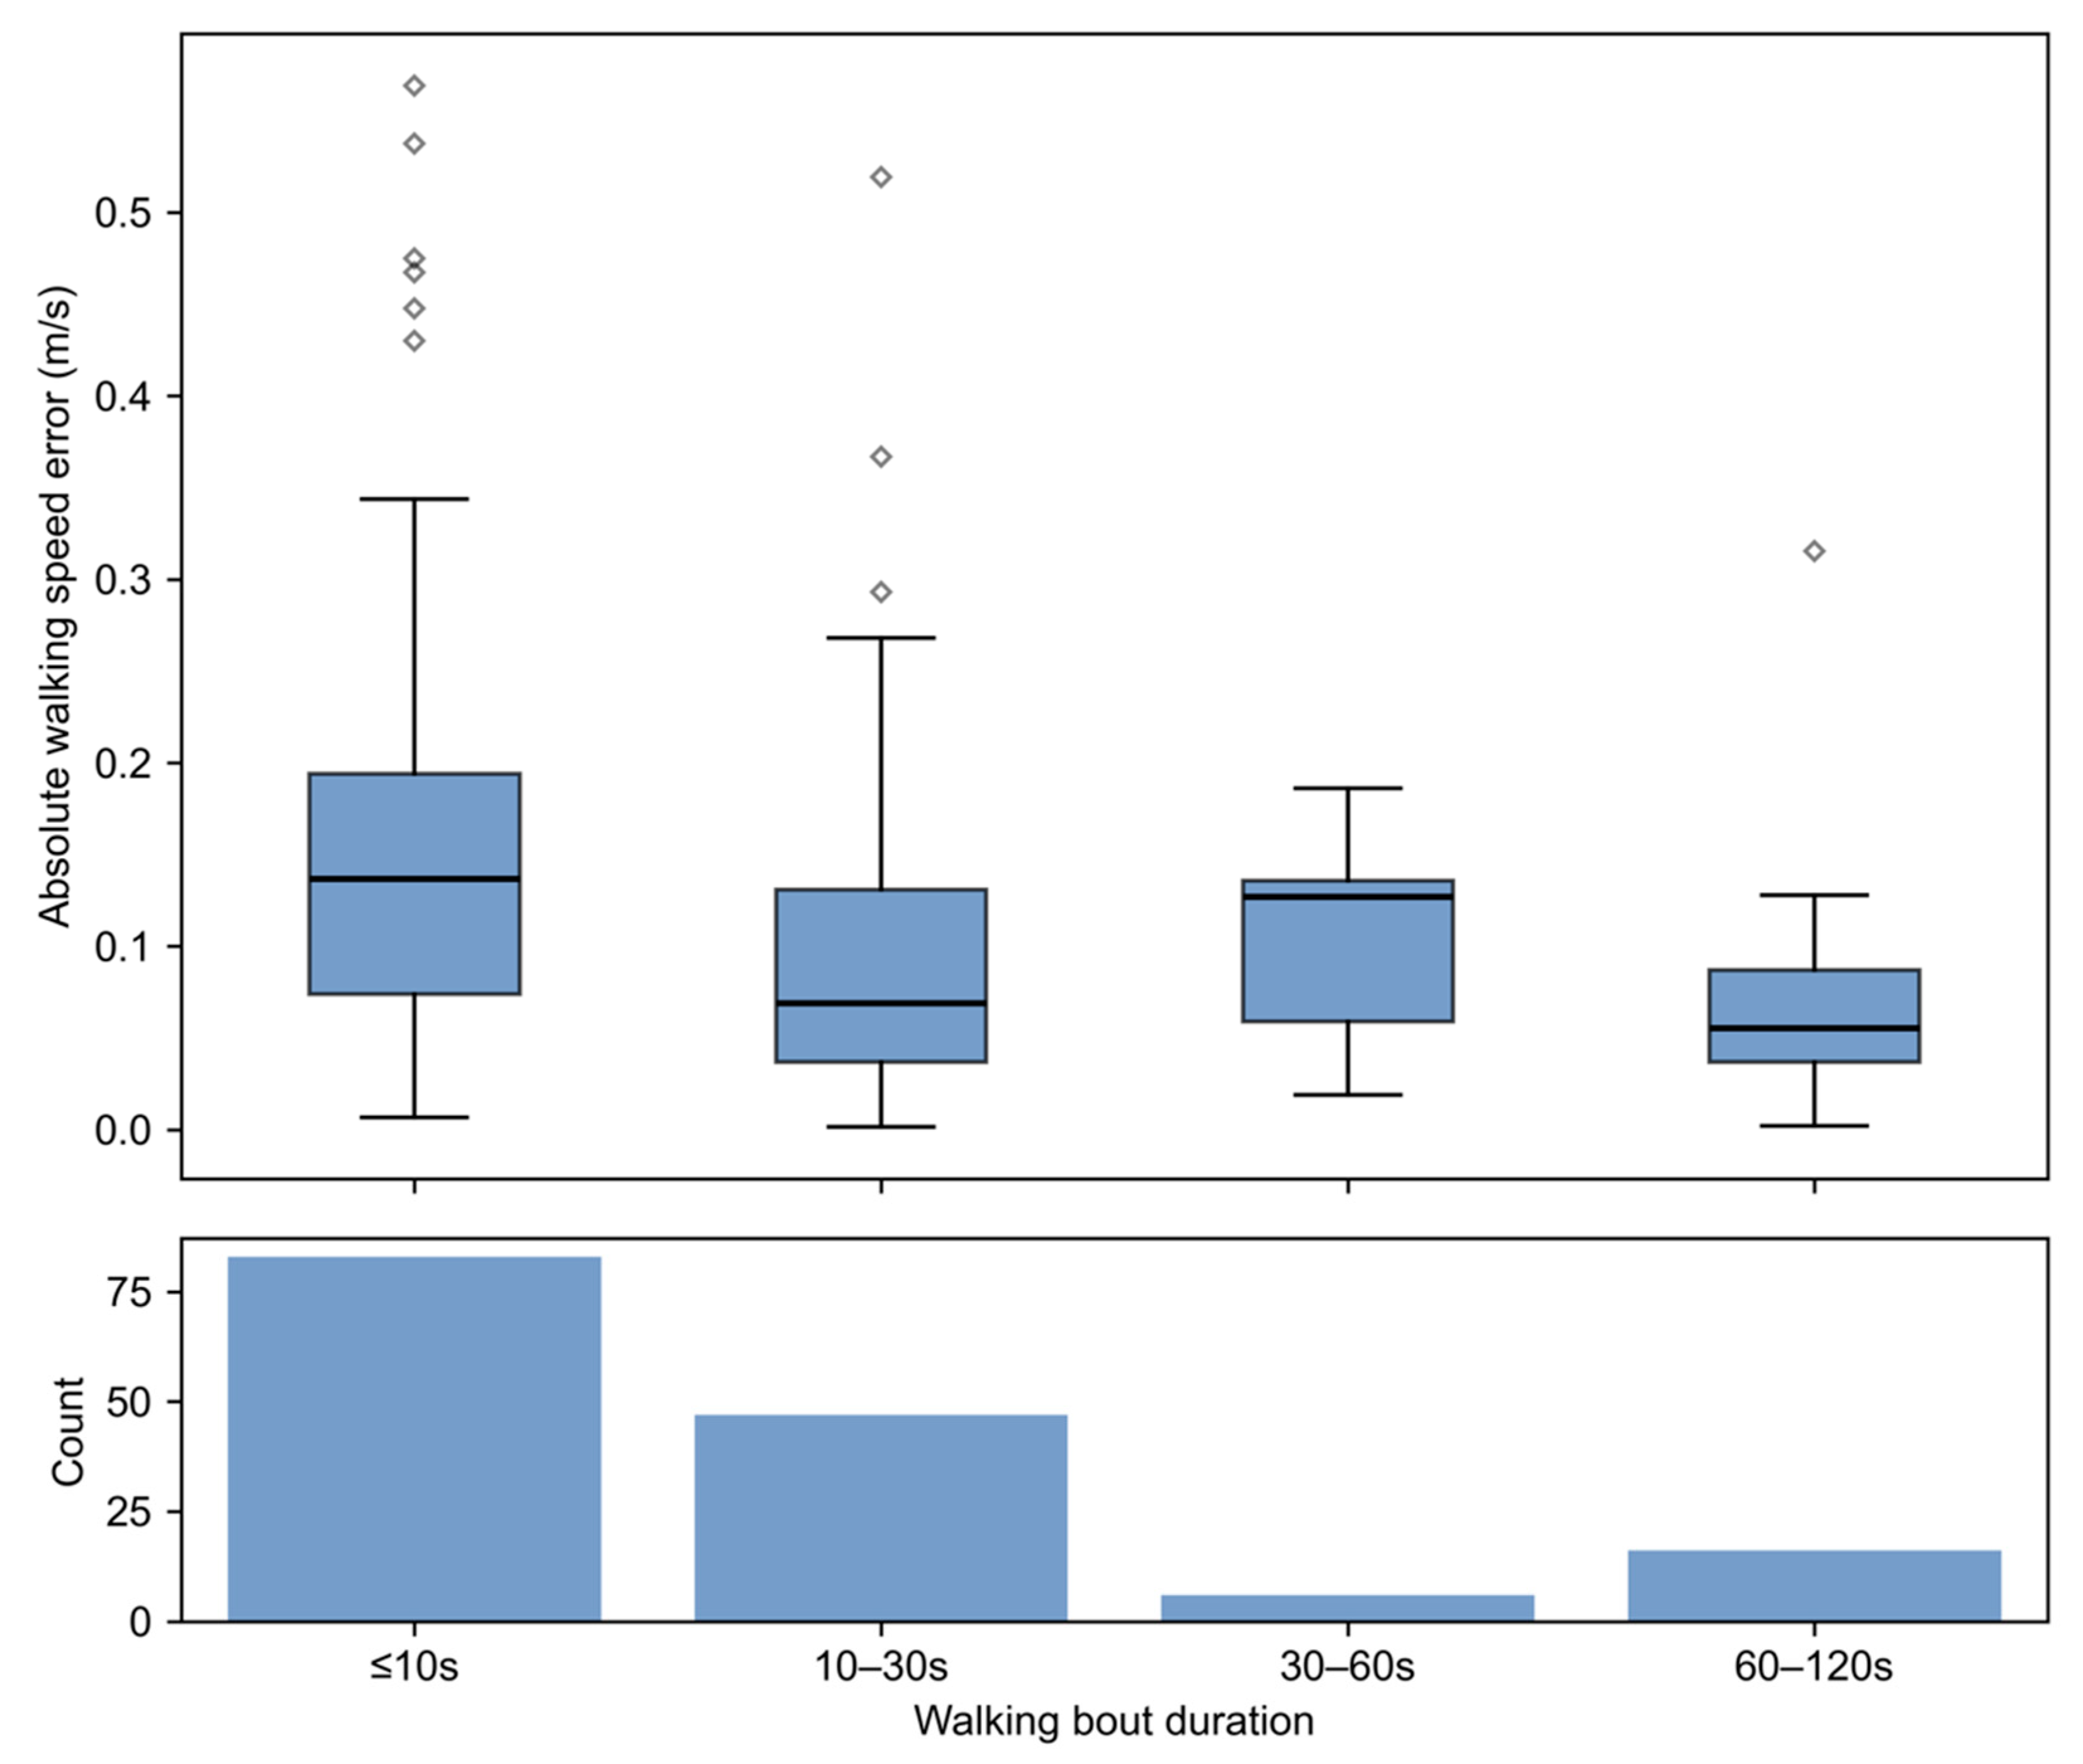
Figure 6.
Per-participant performance loss (%) from the population-best modular pipeline (Ionescu GSD; Zijlstra IC for ICD and cadence; Gu IC + Weinberg adaptive SL for stride length; Zijlstra IC + Weinberg adaptive SL for walking speed), expressed as the percentage difference between each participant's personal-best and population-best algorithm score. Participants are ordered by multimorbidity cluster combination (top to bottom: increasing number of clusters). Colour intensity reflects magnitude of loss (white = 0%, dark red = ≥10%). GSD: gait sequence detection; ICD: initial contact detection; SL: stride length; CAD: cadence; WS: walking speed; CM: cardiometabolic; PC: painful conditions; PU: pulmonary; CA: cancer.
Figure 6.
Per-participant performance loss (%) from the population-best modular pipeline (Ionescu GSD; Zijlstra IC for ICD and cadence; Gu IC + Weinberg adaptive SL for stride length; Zijlstra IC + Weinberg adaptive SL for walking speed), expressed as the percentage difference between each participant's personal-best and population-best algorithm score. Participants are ordered by multimorbidity cluster combination (top to bottom: increasing number of clusters). Colour intensity reflects magnitude of loss (white = 0%, dark red = ≥10%). GSD: gait sequence detection; ICD: initial contact detection; SL: stride length; CAD: cadence; WS: walking speed; CM: cardiometabolic; PC: painful conditions; PU: pulmonary; CA: cancer.
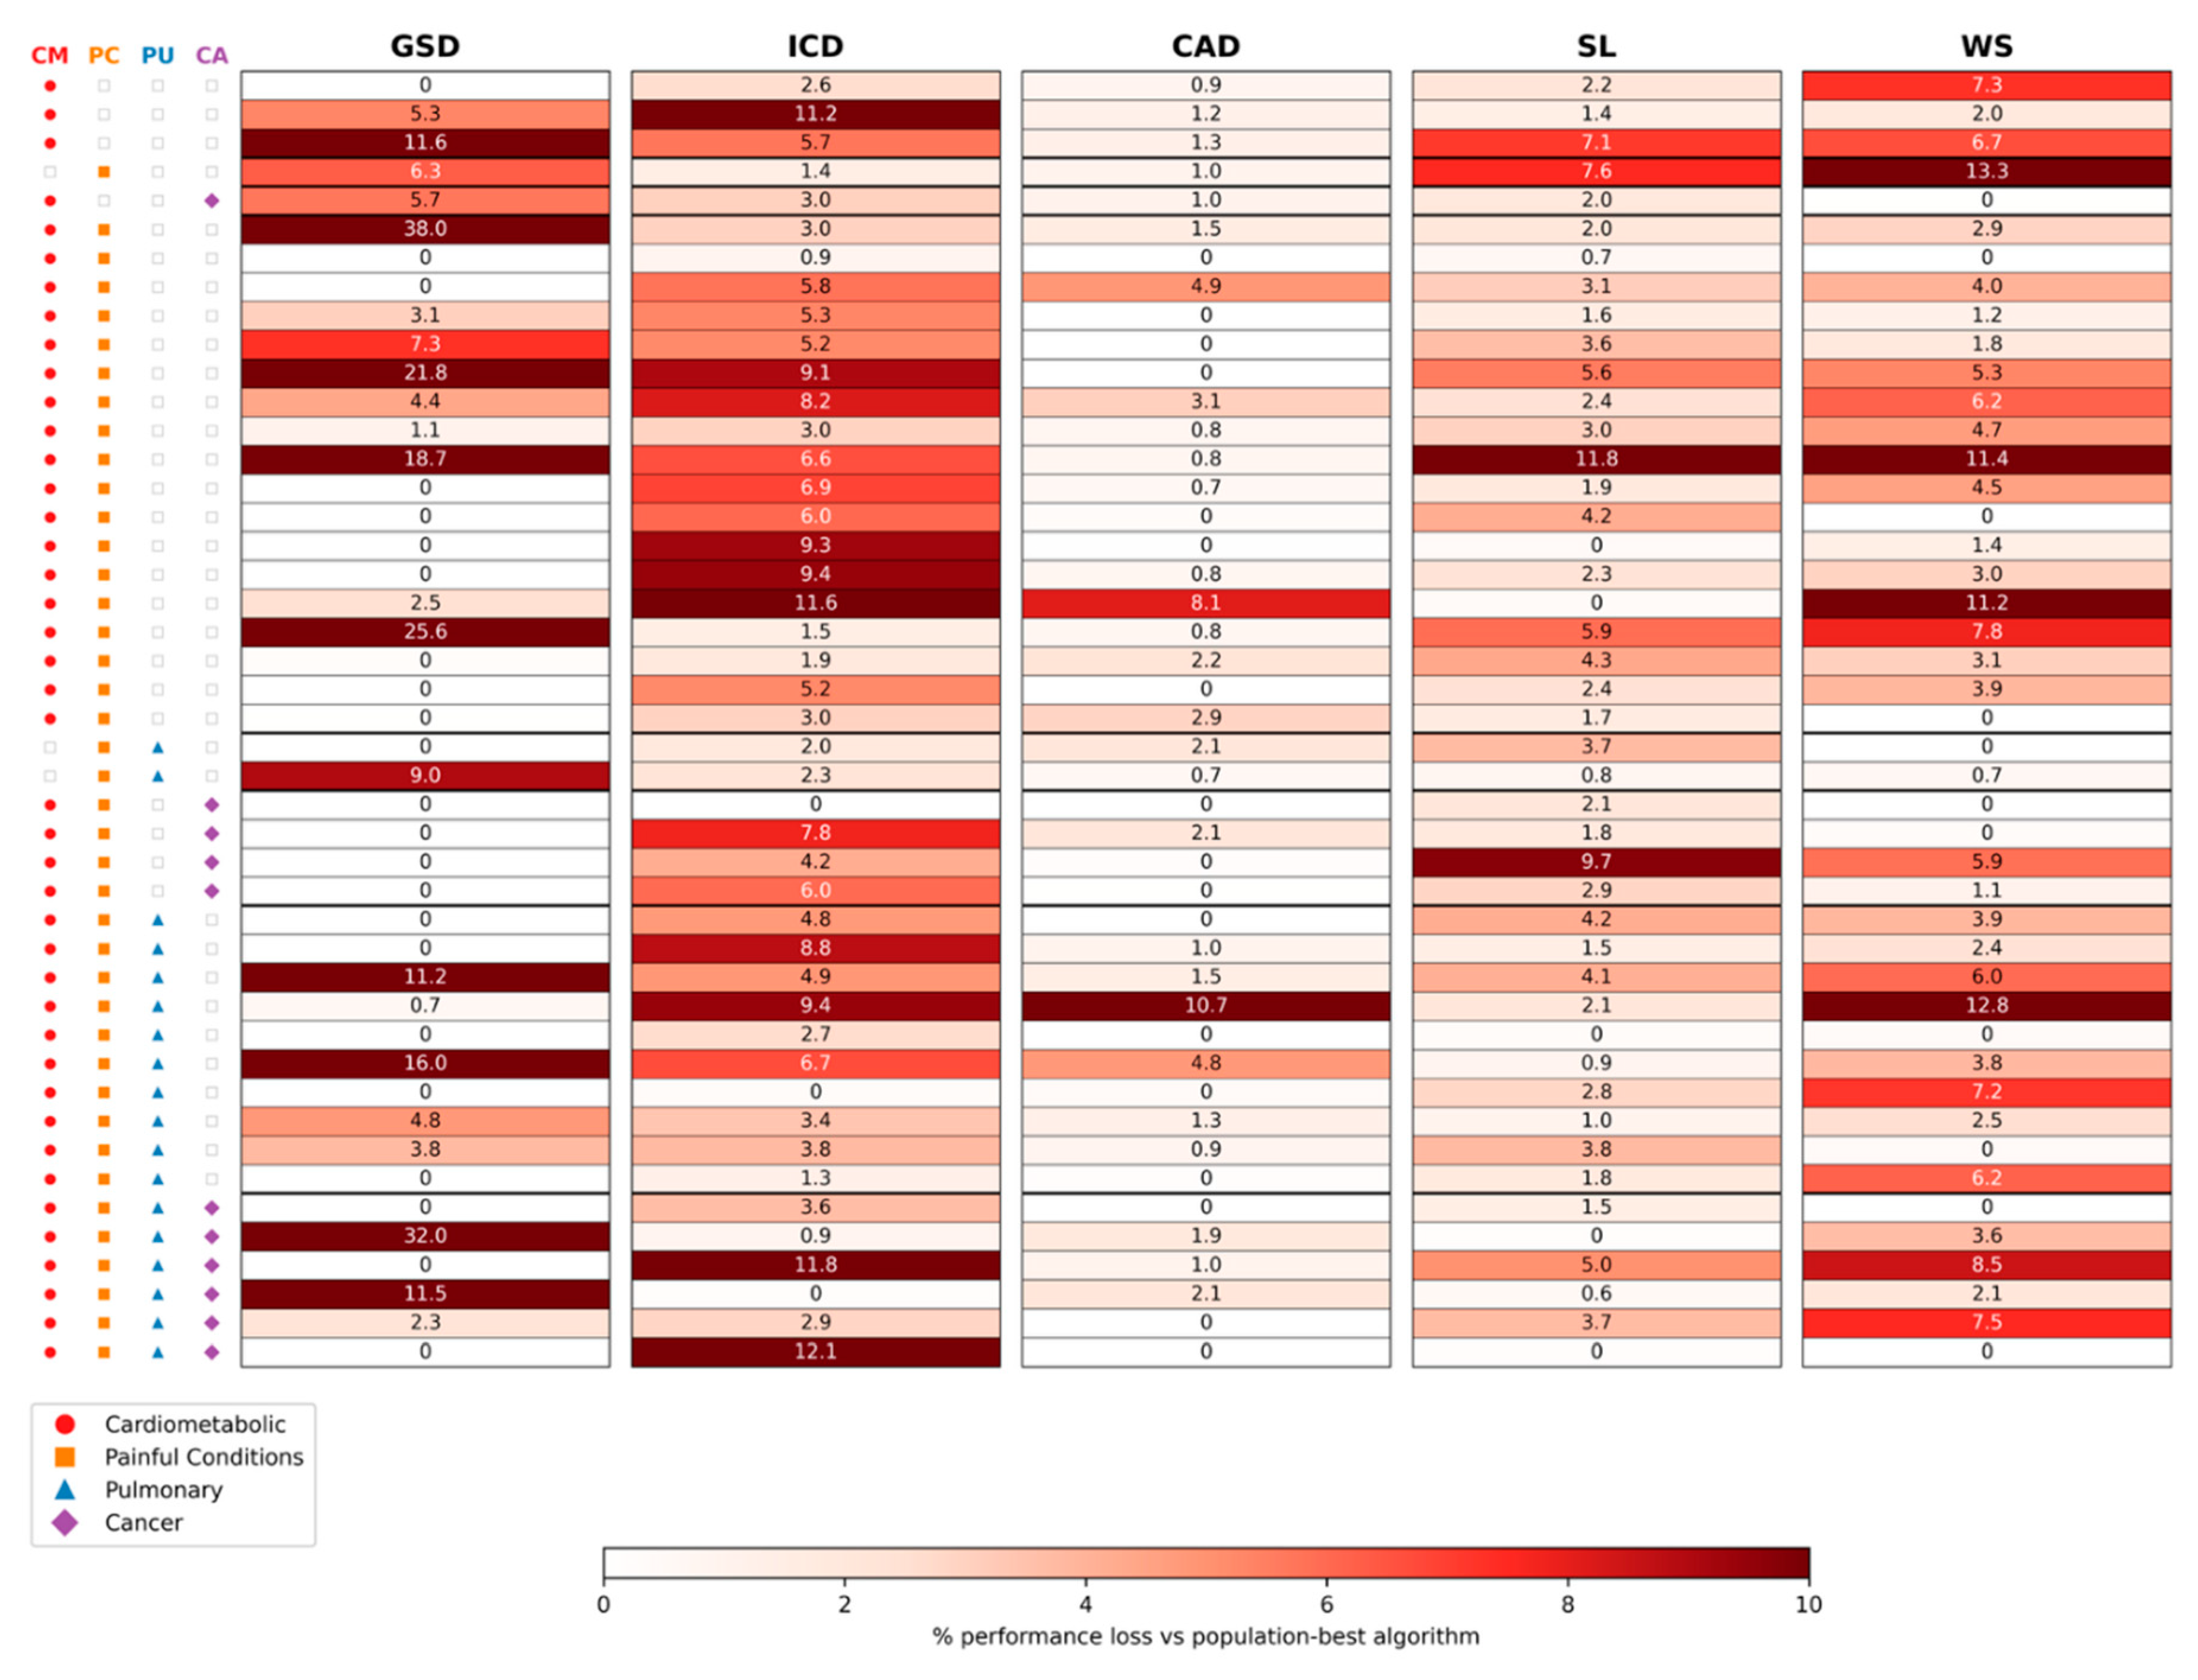

Table 1.
Sociodemographic and clinical characteristics of 46 people with MLTC.
| Variable | Value |
| Participants, n | 45 |
| Age (years) | 75.2 (6.5) |
| Height (cm) | 164.6 (13.3) |
| Weight (kg) | 86.9 (18.0) |
| BMI (kg/m2) | 33.0 (11.8) |
| Male sex, n (%) | 17 (37.0%) |
| 4-MGS (s) | 5.01 (1.38) |
| 5x Sit-to-Stand time (s) | 18.7 (6.4) |
| VAS pain while walking (0-100) | 34.9 (26.3) |
| VAS resting pain (0-100) | 31.8 (25.0) |
| FCI total score | 4 (0-11) |
| Number of medications | 6 (0-13) |
| Fallers in past 12 months, n (%) | 17 (37.7%) |
| Walking aid use outdoors, n (%) | 12 (26.6%) |
| Multimorbidity clusters (non-mutually exclusive), n (%) | |
| - Cardiometabolic | 44 (97.7%) |
| - Painful Conditions | 44 (97.7%) |
| - Pulmonary | 20 (44.4%) |
| - Cancer | 13 (28.8%) |
| Number of clusters per participant | 2 (1-4) |
| Number of clusters per participant, n (%) | |
| - 1 cluster | 5 (11.1%) |
| - 2 clusters | 21 (46.6%) |
| - 3 clusters | 14 (31.1%) |
| - 4 clusters | 8 (17.7%) |
BMI, body mass index; 4-MGS, four-metre gait speed; VAS, visual analogue scale; FCI, Functional Comorbidity Index. Values are presented as mean (SD), n (%), or median (range), as appropriate.
Table 2.
Gait sequence detection algorithm performance metrics ranked by performance index, with all metrics reported as mean values with 95% confidence intervals [95% CI]; algorithm versions are wrist-optimised adaptations from [9].
Table 2.
Gait sequence detection algorithm performance metrics ranked by performance index, with all metrics reported as mean values with 95% confidence intervals [95% CI]; algorithm versions are wrist-optimised adaptations from [9].
| Algo | Mean Performance Index | n WBs | ICC | Specificity | Accuracy | Recall | Precision |
| Ionescu [18] | 0.72 | 500 | 0.62 [0.51, 0.71] | 0.80 [0.77, 0.83] | 0.85 [0.82, 0.87] | 0.90 [0.84, 0.96] | 0.74 [0.68, 0.79] |
| Iluz [19] | 0.69 | 650 | 0.77 [0.62, 0.86] | 0.72 [0.65, 0.80] | 0.84 [0.80, 0.88] | 0.89 [0.83, 0.95] | 0.86 [0.80, 0.91] |
| Ionescu* [18] | 0.68 | 469 | 0.61 [0.51, 0.70] | 0.88 [0.86, 0.91] | 0.83 [0.80, 0.86] | 0.78 [0.71, 0.85] | 0.78 [0.71, 0.84] |
| Keren* [20] | 0.68 | 645 | 0.55 [0.45, 0.65] | 0.90 [0.87, 0.92] | 0.79 [0.76, 0.83] | 0.69 [0.60, 0.77] | 0.74 [0.66, 0.81] |
| Keren [20] | 0.68 | 646 | 0.55 [0.45, 0.65] | 0.90 [0.87, 0.92] | 0.79 [0.76, 0.83] | 0.69 [0.60, 0.77] | 0.73 [0.66, 0.81] |
| MacLean [21] | 0.67 | 514 | 0.58 [0.45, 0.70] | 0.80 [0.74, 0.85] | 0.81 [0.73, 0.89] | 0.81 [0.72, 0.91] | 0.92 [0.86, 0.99] |
| Hickey [22] | 0.6 | 447 | 0.46 [0.36, 0.56] | 0.91 [0.87, 0.94] | 0.80 [0.75, 0.84] | 0.69 [0.61, 0.78] | 0.70 [0.61, 0.78] |
| Kheirkhahan [23] | 0.6 | 380 | 0.52 [0.41, 0.64] | 0.67 [0.58, 0.76] | 0.73 [0.65, 0.82] | 0.73 [0.63, 0.84] | 0.86 [0.78, 0.95] |
*Adaptive version. ICC: intraclass correlation coefficient; n WBs: number of detected gait sequences. Variation in n WBs across algorithms reflects differences in wearable gait sequence detection outputs.
Table 3.
Initial contact detection algorithm performance metrics evaluated within the wearable pipeline utilising the Ionescu GSD algorithm, ranked by performance index, with all metrics reported as mean values with 95% confidence intervals [95% CI]; algorithm versions are wrist-optimised adaptations from [9].
Table 3.
Initial contact detection algorithm performance metrics evaluated within the wearable pipeline utilising the Ionescu GSD algorithm, ranked by performance index, with all metrics reported as mean values with 95% confidence intervals [95% CI]; algorithm versions are wrist-optimised adaptations from [9].
| Algo | Mean Performance Index | n WBs | Recall | Precision | Absolute Timing Error (s) | Relative Timing Error (%) |
| Zijlstra [24] | 0.82 | 144 | 0.76 [0.66, 0.85] | 0.82 [0.72, 0.92] | 0.13 [0.10, 0.17] | 0.22 [0.16, 0.27] |
| McCamley [25] | 0.82 | 144 | 0.77 [0.67, 0.88] | 0.78 [0.69, 0.86] | 0.12 [0.10, 0.15] | 0.21 [0.15, 0.25] |
| Ducharme [26] | 0.81 | 144 | 0.77 [0.67, 0.88] | 0.79 [0.70, 0.89] | 0.13 [0.10, 0.17] | 0.21 [0.16, 0.27] |
| Gu* [27] | 0.81 | 144 | 0.75 [0.66, 0.84] | 0.78 [0.69, 0.87] | 0.13 [0.10, 0.16] | 0.21 [0.16, 0.26] |
| Gu [27] | 0.81 | 144 | 0.74 [0.66, 0.84] | 0.78 [0.70, 0.86] | 0.13 [0.10, 0.16] | 0.21 [0.16, 0.26] |
| Micó-Amigo [28] | 0.81 | 134 | 0.81 [0.69, 0.93] | 0.69 [0.59, 0.78] | 0.11 [0.09, 0.14] | 0.18 [0.14, 0.22] |
| HKLee [29] | 0.8 | 144 | 0.72 [0.60, 0.84] | 0.80 [0.69, 0.91] | 0.13 [0.10, 0.17] | 0.22 [0.17, 0.27] |
| Pham [30] | 0.8 | 144 | 0.73 [0.61, 0.85] | 0.77 [0.66, 0.89] | 0.13 [0.10, 0.17] | 0.21 [0.16, 0.27] |
| Shin [31] | 0.79 | 142 | 0.67 [0.53, 0.81] | 0.78 [0.64, 0.92] | 0.13 [0.10, 0.16] | 0.20 [0.15, 0.26] |
*Adaptive version; n WBs: number of true positive walking bouts. Minor variation in n WBs across algorithms reflects cases where one algorithm detected no initial contacts within a walking bout, resulting in exclusion from downstream metric computation.
Table 4.
Cadence pipeline performance metrics for each ICD algorithm combined with Ionescu GSD, ranked by performance index, with all metrics reported as mean values with 95% confidence intervals [95% CI]; algorithm versions are wrist-optimised adaptations from [9].
Table 4.
Cadence pipeline performance metrics for each ICD algorithm combined with Ionescu GSD, ranked by performance index, with all metrics reported as mean values with 95% confidence intervals [95% CI]; algorithm versions are wrist-optimised adaptations from [9].
| ICD method | Mean Performance Index | N WBs | Absolute Error | Relative Error (%) | ICC | Bias [LoA] (steps/min) | Wearable CAD (steps/min) | Reference CAD (steps/min) |
| Zijlstra [24] | 0.75 | 144 | 7.31 [1.88, 12.75] | 8 [2,14] | 0.67 [0.49, 0.85] | 2.58 [-14.94, 20.11] | 99.49 [94.78, 104.20] | 96.90 [91.14, 102.67] |
| Ducharme [26] | 0.73 | 144 | 8.23 [1.14, 15.33] | 9 [1,17] | 0.60 [0.45, 0.76] | 2.32 [-19.57, 24.20] | 99.22 [93.06, 105.38] | 96.90 [91.14, 102.67] |
| Gu* [27] | 0.73 | 144 | 10.14 [1.36, 18.92] | 11 [1,21] | 0.60 [0.41, 0.81] | 2.77 [-23.05, 28.58] | 99.67 [91.55, 107.80] | 96.90 [91.14, 102.67] |
| Gu [27] | 0.72 | 144 | 9.92 [1.47, 18.37] | 11 [1,20] | 0.58 [0.39, 0.79] | 1.45 [-24.34, 27.23] | 98.35 [90.78, 105.92] | 96.90 [91.14, 102.67] |
| McCamleyc[25] | 0.69 | 144 | 10.67 [3.69, 17.64] | 11 [4,18] | 0.56 [0.36, 0.79] | -0.06 [-27.09, 26.98] | 96.85 [88.97, 104.72] | 96.90 [91.14, 102.67] |
| Pham [30] | 0.69 | 144 | 17.10 [-3.17, 37.37] | 17 [-4, 39] | 0.50 [0.29, 0.75] | 5.54 [-66.67, 77.76] | 102.45 [82.44, 122.46] | 96.90 [91.14, 102.67] |
| HKLee [29] | 0.67 | 144 | 13.11 [4.45, 21.77] | 12 [4,21] | 0.52 [0.35, 0.72] | -11.16 [-41.24, 18.92] | 85.74 [78.70, 92.78] | 96.90 [91.14, 102.67] |
| Shin [31] | 0.66 | 144 | 11.35 [3.03, 19.66] | 11 [3,19] | 0.48 [0.32, 0.71] | -8.10 [-38.01, 21.81] | 88.81 [81.78, 95.84] | 96.90 [91.14, 102.67] |
| Micó-Amigo [28] | 0.6 | 134 | 46.34 [16.29, 76.39] | 49 [17,81] | 0.50 [0.31, 0.74] | 32.50 [-72.93, 137.94] | 129.01 [93.97, 164.04] | 96.50 [90.41, 102.59] |
ICC: intraclass correlation coefficient; CAD: cadence; LoA: limits of agreement; n WBs: number of true positive walking bouts; 95% CI: 95% confidence interval. *Adaptive version.
Table 5.
Stride length pipeline performance metrics for each ICD and SL algorithm combination with Ionescu GSD, ranked by performance index, with all metrics reported as mean values with 95% confidence intervals [95% CI]; algorithm versions are wrist-optimised adaptations from [9].
Table 5.
Stride length pipeline performance metrics for each ICD and SL algorithm combination with Ionescu GSD, ranked by performance index, with all metrics reported as mean values with 95% confidence intervals [95% CI]; algorithm versions are wrist-optimised adaptations from [9].
| SL method | ICD method | Mean Performance Index | N WBs | Absolute Error | Relative Error (%) | ICC | Bias [LoA] (m) | Detected Stride Length (m) | Reference Stride Length (m) |
| Weinberg* [32] | Gu [27] | 0.76 | 144 | 0.16 [0.08, 0.24] | 24.6 [2.6, 46.2] | 0.64 [0.42, 0.84] | 0.02 [-0.30, 0.34] | 0.94 [0.89, 1.00] | 0.93 [0.77, 1.08] |
| Weinberg* [32] | Zijlstra [24] | 0.76 | 144 | 0.16 [0.08, 0.24] | 24.1 [2.5, 46.0] | 0.64 [0.42, 0.84] | 0.02 [-0.31, 0.34] | 0.94 [0.89, 1.00] | 0.93 [0.77, 1.08] |
| Weinberg [32] | Pham [30] | 0.76 | 144 | 0.16 [0.09, 0.23] | 23.6 [4.2, 43.1] | 0.66 [0.42, 0.84] | -0.00 [-0.32, 0.31] | 0.93 [0.88, 0.97] | 0.93 [0.77, 1.08] |
| Weinberg* [32] | Pham [30] | 0.76 | 144 | 0.16 [0.09, 0.23] | 23.6 [3.6, 44.0] | 0.65 [0.43, 0.84] | 0.01 [-0.30, 0.33] | 0.93 [0.89, 0.98] | 0.93 [0.77, 1.08] |
| Weinberg* [32] | McCamley [25] | 0.75 | 144 | 0.16 [0.09, 0.23] | 23.6 [3.9, 43.5] | 0.64 [0.41, 0.83] | -0.02 [-0.34, 0.29] | 0.91 [0.86, 0.95] | 0.93 [0.77, 1.08] |
| Weinberg* [32] | Gu* [27] | 0.75 | 144 | 0.16 [0.09, 0.24] | 24.0 [4.1, 43.8] | 0.64 [0.41, 0.83] | -0.01 [-0.33, 0.32] | 0.92 [0.87, 0.97] | 0.93 [0.77, 1.08] |
| Weinberg [32] | Ducharme [26] | 0.75 | 144 | 0.16 [0.09, 0.24] | 24.8 [3.3, 46.6] | 0.63 [0.41, 0.83] | 0.01 [-0.32, 0.35] | 0.94 [0.90, 0.98] | 0.93 [0.77, 1.08] |
| Weinberg* [32] | Ducharme [26] | 0.75 | 144 | 0.16 [0.09, 0.23] | 23.6 [4.3, 42.8] | 0.65 [0.42, 0.83] | -0.00 [-0.32, 0.31] | 0.92 [0.88, 0.97] | 0.93 [0.77, 1.08] |
| Weinberg [32] | Gu* [27] | 0.75 | 144 | 0.17 [0.10, 0.23] | 23.8 [5.3, 42.1] | 0.64 [0.41, 0.84] | -0.03 [-0.33, 0.29] | 0.90 [0.86, 0.94] | 0.93 [0.77, 1.08] |
| Weinberg [32] | Zijlstra [24] | 0.75 | 144 | 0.17 [0.10, 0.23] | 23.5 [5.4, 41.8] | 0.64 [0.41, 0.83] | -0.03 [-0.34, 0.28] | 0.90 [0.86, 0.93] | 0.93 [0.77, 1.08] |
| Weinberg* [32] | Shin [31] | 0.75 | 144 | 0.17 [0.09, 0.24] | 24.1 [3.8, 44.2] | 0.64 [0.41, 0.83] | -0.02 [-0.33, 0.30] | 0.91 [0.87, 0.95] | 0.93 [0.77, 1.08] |
| Weinberg* [32] | Micó-Amigo [28] | 0.74 | 134 | 0.17 [0.10, 0.25] | 24.8 [4.8, 44.5] | 0.61 [0.38, 0.82] | -0.03 [-0.37, 0.32] | 0.90 [0.85, 0.95] | 0.93 [0.77, 1.09] |
| Weinberg* [32] | HKLee [29] | 0.74 | 144 | 0.17 [0.09, 0.24] | 25.1 [3.1, 46.8] | 0.63 [0.41, 0.83] | 0.02 [-0.31, 0.35] | 0.95 [0.90, 1.00] | 0.93 [0.77, 1.08] |
| Weinberg [32] | Shin [31] | 0.74 | 144 | 0.17 [0.10, 0.24] | 23.9 [5.8, 42.5] | 0.62 [0.39, 0.82] | -0.04 [-0.35, 0.28] | 0.89 [0.85, 0.93] | 0.93 [0.77, 1.08] |
| Weinberg [32] | McCamley [25] | 0.74 | 144 | 0.17 [0.10, 0.24] | 24.5 [4.8, 44.5] | 0.62 [0.40, 0.82] | -0.02 [-0.35, 0.30] | 0.91 [0.87, 0.94] | 0.93 [0.77, 1.08] |
| Weinberg [32] | HKLee [29] | 0.74 | 144 | 0.17 [0.10, 0.24] | 24.5 [4.6, 44.6] | 0.62 [0.40, 0.82] | -0.01 [-0.33, 0.31] | 0.91 [0.88, 0.95] | 0.93 [0.77, 1.08] |
| Weinberg [32] | Gu* [27] | 0.74 | 144 | 0.17 [0.11, 0.23] | 23.5 [5.6, 41.3] | 0.63 [0.40, 0.83] | -0.04 [-0.35, 0.28] | 0.89 [0.86, 0.93] | 0.93 [0.77, 1.08] |
| Weinberg [32] | Micó-Amigo [28] | 0.73 | 134 | 0.18 [0.11, 0.25] | 24.5 [6.4, 42.9] | 0.60 [0.37, 0.81] | -0.06 [-0.39, 0.29] | 0.87 [0.83, 0.91] | 0.93 [0.77, 1.09] |
| Bylemans*^ [33] | Shin [31] | 0.72 | 144 | 0.19 [0.10, 0.28] | 25.4 [5.0, 46.1] | 0.58 [0.34, 0.80] | -0.06 [-0.46, 0.35] | 0.87 [0.79, 0.94] | 0.93 [0.77, 1.08] |
| Bylemans*^ [33] | McCamley [25] | 0.71 | 144 | 0.20 [0.11, 0.29] | 27.7 [5.1, 50.1] | 0.57 [0.33, 0.80] | 0.00 [-0.44, 0.45] | 0.93 [0.85, 1.01] | 0.93 [0.77, 1.08] |
| Bylemans*^ [33] | HKLee [29] | 0.71 | 144 | 0.19 [0.10, 0.28] | 26.8 [4.9, 48.7] | 0.58 [0.34, 0.80] | -0.01 [-0.43, 0.41] | 0.92 [0.84, 0.99] | 0.93 [0.77, 1.08] |
| Bylemans*^ [33] | Gu* [27] | 0.7 | 144 | 0.19 [0.10, 0.29] | 26.5 [4.4, 48.5] | 0.56 [0.33, 0.79] | -0.07 [-0.46, 0.32] | 0.86 [0.79, 0.93] | 0.93 [0.77, 1.08] |
| Bylemans*^ [33] | Zijlstra [24] | 0.7 | 144 | 0.20 [0.11, 0.30] | 28.0 [6.1, 49.7] | 0.55 [0.32, 0.79] | -0.01 [-0.47, 0.47] | 0.92 [0.84, 1.00] | 0.93 [0.77, 1.08] |
| Bylemans*^ [33] | Pham [30] | 0.7 | 134 | 0.21 [0.09, 0.34] | 29.7 [3.2, 56.5] | 0.57 [0.34, 0.78] | 0.06 [-0.46, 0.57] | 0.98 [0.87, 1.10] | 0.93 [0.77, 1.09] |
| Bylemans*^ [33] | Micó-Amigo [28] | 0.7 | 144 | 0.20 [0.10, 0.30] | 27.1 [3.2, 51.0] | 0.55 [0.33, 0.78] | -0.07 [-0.46, 0.32] | 0.85 [0.78, 0.92] | 0.93 [0.77, 1.08] |
| Bylemans*^ [33] | Gu* [27] | 0.69 | 144 | 0.20 [0.10, 0.29] | 26.8 [4.6, 49.2] | 0.53 [0.30, 0.77] | -0.00 [-0.45, 0.45] | 0.93 [0.84, 1.01] | 0.93 [0.77, 1.08] |
| Bylemans*^ [33] | Ducharme [26] | 0.69 | 144 | 0.19 [0.09, 0.30] | 27.5 [3.1, 51.6] | 0.54 [0.30, 0.77] | 0.00 [-0.45, 0.46] | 0.93 [0.85, 1.01] | 0.93 [0.77, 1.08] |
SL: stride length; ICC: intraclass correlation coefficient; LoA: limits of agreement; 95% CI: 95% confidence interval. *Adaptive version; ^foot length-augmented version. n WBs: number of true positive walking bouts; Minor variation in n WBs across algorithms reflects cases where one algorithm detected no initial contacts within a walking bout, resulting in exclusion from downstream metric computation.
Table 6.
Walking speed pipeline performance metrics for each ICD and SL algorithm combination with Ionescu GSD, ranked by performance index, with all metrics reported as mean values with 95% confidence intervals [95% CI]; algorithm versions are wrist-optimised adaptations from [9].
Table 6.
Walking speed pipeline performance metrics for each ICD and SL algorithm combination with Ionescu GSD, ranked by performance index, with all metrics reported as mean values with 95% confidence intervals [95% CI]; algorithm versions are wrist-optimised adaptations from [9].
| CAD method | SL method | Mean Performance Index | N WBs | Absolute Error | Relative Error (%) | ICC | Bias [LoA] (m/s) | Wearable WS (m/s) | Reference WS (m/s) |
| Zijlstra [24] | Weinberg* [32] | 0.74 | 144 | 0.15 [0.07, 0.23] | 27.75 [2.13, 53.75] | 0.65 [0.42, 0.84] | -0.03 [-0.33, 0.26] | 0.73 [0.66, 0.79] | 0.76 [0.63, 0.89] |
| Gu [27] | Weinberg* [32] | 0.74 | 144 | 0.14 [0.06, 0.22] | 27.75 [0.75, 54.87] | 0.67 [0.43, 0.86] | -0.01 [-0.30, 0.29] | 0.75 [0.68, 0.83] | 0.76 [0.63, 0.89] |
| Zijlstra [24] | Weinberg [32] | 0.74 | 144 | 0.15 [0.07, 0.22] | 28.62 [2.38, 55.25] | 0.65 [0.42, 0.84] | -0.01 [-0.30, 0.28] | 0.75 [0.70, 0.79] | 0.76 [0.63, 0.89] |
| McCamley [25] | Weinberg* [32] | 0.74 | 144 | 0.14 [0.07, 0.22] | 29.12 [1.75, 56.62] | 0.67 [0.43, 0.85] | 0.02 [-0.27, 0.31] | 0.78 [0.72, 0.83] | 0.76 [0.63, 0.89] |
| Ducharme [26] | Weinberg [32] | 0.73 | 144 | 0.15 [0.08, 0.23] | 29.62 [2.38, 56.75] | 0.63 [0.41, 0.84] | 0.01 [-0.30, 0.33] | 0.77 [0.72, 0.83] | 0.76 [0.63, 0.89] |
| McCamley [25] | Weinberg [32] | 0.73 | 144 | 0.15 [0.08, 0.23] | 30.87 [2.13, 59.25] | 0.62 [0.41, 0.83] | 0.00 [-0.32, 0.32] | 0.76 [0.71, 0.82] | 0.76 [0.63, 0.89] |
| Ducharme [26] | Weinberg* [32] | 0.73 | 144 | 0.15 [0.08, 0.22] | 28.75 [3.00, 54.62] | 0.62 [0.40, 0.83] | -0.02 [-0.33, 0.30] | 0.74 [0.70, 0.79] | 0.76 [0.63, 0.89] |
| Gu* [27] | Weinberg [32] | 0.72 | 144 | 0.16 [0.08, 0.23] | 30.63 [2.88, 57.88] | 0.60 [0.38, 0.81] | -0.02 [-0.34, 0.30] | 0.74 [0.69, 0.79] | 0.76 [0.63, 0.89] |
| Gu [27] | Weinberg* [32] | 0.72 | 144 | 0.16 [0.09, 0.24] | 27.88 [4.50, 51.37] | 0.62 [0.40, 0.80] | -0.06 [-0.39, 0.26] | 0.70 [0.63, 0.77] | 0.76 [0.63, 0.89] |
| HKLee [29] | Weinberg [32] | 0.72 | 144 | 0.16 [0.07, 0.24] | 30.63 [1.12, 60.00] | 0.59 [0.38, 0.81] | -0.01 [-0.33, 0.32] | 0.75 [0.70, 0.80] | 0.76 [0.63, 0.89] |
| HKLee [29] | Weinberg* [32] | 0.71 | 144 | 0.18 [0.11, 0.25] | 28.50 [8.88, 48.12] | 0.62 [0.40, 0.79] | -0.11 [-0.42, 0.21] | 0.65 [0.59, 0.72] | 0.76 [0.63, 0.89] |
| McCamley [25] | Bylemans*^ [33] | 0.71 | 144 | 0.16 [0.07, 0.26] | 30.25 [1.50, 59.25] | 0.65 [0.42, 0.84] | 0.00 [-0.38, 0.38] | 0.76 [0.66, 0.86] | 0.76 [0.63, 0.89] |
| Gu [27] | Weinberg [32] | 0.71 | 144 | 0.17 [0.10, 0.25] | 28.50 [6.12, 51.12] | 0.60 [0.39, 0.78] | -0.09 [-0.41, 0.24] | 0.67 [0.61, 0.74] | 0.76 [0.63, 0.89] |
| Shin [31] | Weinberg* [32] | 0.71 | 144 | 0.16 [0.08, 0.24] | 30.75 [2.63, 58.88] | 0.57 [0.35, 0.79] | -0.03 [-0.36, 0.29] | 0.73 [0.68, 0.78] | 0.76 [0.63, 0.89] |
| Shin [31] | Weinberg [32] | 0.7 | 144 | 0.18 [0.08, 0.28] | 34.38 [-0.87, 69.25] | 0.58 [0.35, 0.80] | -0.04 [-0.41, 0.33] | 0.72 [0.63, 0.81] | 0.76 [0.63, 0.89] |
| Gu* [27] | Bylemans*^ [33] | 0.7 | 144 | 0.17 [0.08, 0.26] | 30.87 [2.62, 59.25] | 0.60 [0.36, 0.82] | 0.01 [-0.38, 0.41] | 0.78 [0.69, 0.85] | 0.76 [0.63, 0.89] |
| Zijlstra [24] | Bylemans*^ [33] | 0.7 | 144 | 0.20 [0.12, 0.27] | 29.88 [10.88, 48.88] | 0.59 [0.39, 0.77] | -0.13 [-0.44, 0.19] | 0.63 [0.57, 0.69] | 0.76 [0.63, 0.89] |
| Ducharme [26] | Bylemans*^ [33] | 0.7 | 144 | 0.17 [0.08, 0.26] | 29.75 [3.75, 55.38] | 0.59 [0.37, 0.80] | -0.03 [-0.44, 0.38] | 0.73 [0.65, 0.81] | 0.76 [0.63, 0.89] |
| HKLee [29] | Bylemans*^ [33] | 0.7 | 144 | 0.17 [0.07, 0.26] | 30.00 [2.75, 57.63] | 0.60 [0.37, 0.81] | 0.00 [-0.41, 0.42] | 0.76 [0.67, 0.85] | 0.76 [0.63, 0.89] |
| Pham [30] | Weinberg [32] | 0.69 | 144 | 0.18 [0.09, 0.27] | 29.50 [6.75, 52.62] | 0.59 [0.33, 0.80] | -0.08 [-0.47, 0.31] | 0.68 [0.60, 0.77] | 0.76 [0.63, 0.89] |
| Pham [30] | Weinberg* [32] | 0.68 | 144 | 0.20 [0.11, 0.29] | 30.63 [9.88, 51.00] | 0.59 [0.36, 0.78] | -0.14 [-0.51, 0.24] | 0.63 [0.55, 0.71] | 0.76 [0.63, 0.89] |
| Gu [27] | Bylemans*^ [33] | 0.68 | 144 | 0.18 [0.08, 0.27] | 33.25 [1.25, 65.00] | 0.57 [0.34, 0.81] | 0.01 [-0.40, 0.43] | 0.78 [0.69, 0.87] | 0.76 [0.63, 0.89] |
| Shin [31] | Bylemans*^ [33] | 0.67 | 144 | 0.19 [0.08, 0.30] | 35.12 [-1.62, 72.12] | 0.53 [0.32, 0.77] | -0.06 [-0.45, 0.34] | 0.70 [0.61, 0.80] | 0.76 [0.63, 0.89] |
| Pham [30] | Bylemans*^ [33] | 0.62 | 144 | 0.26 [0.05, 0.47] | 43.88 [-2.75, 90.50] | 0.54 [0.30, 0.78] | 0.06 [-0.81, 0.93] | 0.82 [0.60, 1.04] | 0.76 [0.63, 0.89] |
| Micó-Amigo [28] | Weinberg [32] | 0.58 | 134 | 0.33 [0.16, 0.51] | 56.62 [9.00, 104.38] | 0.57 [0.36, 0.79] | 0.19 [-0.49, 0.87] | 0.95 [0.71, 1.19] | 0.76 [0.62, 0.89] |
| Micó-Amigo [28] | Weinberg* [32] | 0.58 | 134 | 0.32 [0.15, 0.48] | 54.37 [7.88, 100.88] | 0.57 [0.35, 0.79] | 0.16 [-0.50, 0.82] | 0.92 [0.69, 1.15] | 0.76 [0.62, 0.89] |
| Micó-Amigo [28] | Bylemans*^ [33] | 0.51 | 134 | 0.53 [0.15, 0.89] | 81.38 [4.87, 157.25] | 0.55 [0.35, 0.77] | 0.37 [-1.06, 1.80] | 1.13 [0.68, 1.58] | 0.76 [0.62, 0.89] |
WS: walking speed; ICC: intraclass correlation coefficient; LoA: limits of agreement; N WBs: number of true positive walking bouts; 95% CI: 95% confidence interval. *Adaptive version; ^foot length-augmented version.
Table 7.
Combined evaluation performance metrics for the best-performing pipeline (Ionescu GSD + Zijlstra IC + Weinberg SL adaptive) across stride length, cadence, and walking speed estimation, with all metrics reported as mean values with 95% confidence intervals [95% CI].
Table 7.
Combined evaluation performance metrics for the best-performing pipeline (Ionescu GSD + Zijlstra IC + Weinberg SL adaptive) across stride length, cadence, and walking speed estimation, with all metrics reported as mean values with 95% confidence intervals [95% CI].
| DMO | N WBs | Absolute Error | Relative Error (%) | ICC | Bias [LoA] |
| Cadence (steps/min) | 447 | 8.58 [5.86, 11.30] | 10 [7,12] | 0.70 [0.56, 0.81] | 1.72 [-19.69, 23.12] |
| Stride Length (m) | 447 | 0.15 [0.12, 0.18] | 0.18 [0.13, 0.22] | 0.67 [0.51, 0.79] | -0.02 [-0.32, 0.28] |
| Walking Speed (m/s) | 447 | 0.14 [0.11, 0.17] | 0.23 [0.16, 0.28] | 0.67 [0.52, 0.79] | -0.01 [-0.29, 0.27] |
N WBs: total wearable-detected walking bouts; ICC: intraclass correlation coefficient; LoA: limits of agreement; 95% CI: 95% confidence interval. Combined evaluation includes all wearable-detected walking bouts regardless of reference system overlap.
Disclaimer/Publisher’s Note: The statements, opinions and data contained in all publications are solely those of the individual author(s) and contributor(s) and not of MDPI and/or the editor(s). MDPI and/or the editor(s) disclaim responsibility for any injury to people or property resulting from any ideas, methods, instructions or products referred to in the content. |
© 2026 by the authors. Licensee MDPI, Basel, Switzerland. This article is an open access article distributed under the terms and conditions of the Creative Commons Attribution (CC BY) license (http://creativecommons.org/licenses/by/4.0/).
Copyright: This open access article is published under a Creative Commons CC BY 4.0 license, which permit the free download, distribution, and reuse, provided that the author and preprint are cited in any reuse.


