

Submitted:
07 July 2026
Posted:
08 July 2026
You are already at the latest version
Abstract
Background: While many studies indicate a bidirectional relationship between type 2 diabetes (T2DM) and depression, its precise nature remains unclear. The aim of the study was to determine the levels of inflammatory markers in the oldest-old diabetic patients with depressive symptoms, and identify the risk factors associated with late-life depressive symptoms. Methods: The 195 diabetic participants, aged 85 and above, were screened for depressive symptoms. Several clinical and biochemical data were also collected. Results: Serum levels of TNF-α, IL-1β, and IL-6 were increased in depressive individuals and correlated with each other, and with HbA1c level, GDS score, FBG and BMI. Univariate logistic regression found the following parameters to predict depressive symptoms in elderly T2DM patients: older age, female sex, living alone, smoking habit, no physical activity, higher BMI, longer duration of T2DM, increased number of co-morbidities, presence of cardiovascular disease, retinopathy, neuropathy, hypertension and hyperlipidaemia, insulin treatment, higher levels of HbA1c, total cholesterol, LDL and TG, lower concentrations of HDL, and higher levels of TNF-α, IL-1β, and IL-6. Conclusion: Low grade inflammation could be one of the mechanisms underlying co-morbid depression and diabetes. Hence, cytokines such as TNF-α, IL-1β, and IL-6 might serve as diagnostic biomarkers and potential therapeutic targets.
Keywords:
IL-1β
; IL-6
; late-life depressive symptoms
; oldest-old
; TNF-α
; type 2 diabetes
Introduction
One of the most common chronic diseases worldwide is type 2 diabetes (T2DM). Its prevalence is expected to grow from 588.7 million in 2024 to 852.5 million by 2050 [1]. The condition primarily affects older adults, with 28.8% of people aged 65 and above in the United States being recognised as diabetic [2]. It is known to be associated with a number of long-term complications that affect various organs, such as the cardiovascular system, eyes, kidneys, brain and nervous system. In addition, elderly patients also often experience late-life depression and difficulties with cognitive function which may have a bidirectional relationship with diabetes [3,4]: depression can increase the risk of developing diabetes due to behavioural changes, such as unhealthy diet or lack of physical activity, and conversely, the psychological burdens associated with managing a chronic disease can often trigger or exacerbate depressive episodes.
However, the nature of this relationship is not completely understood, although neurotransmitter imbalances and neuroendocrine dysregulation may play roles [5]. Chronic stress is known to induce hormonal disturbances, such as elevated cortisol level and disrupted insulin and GLP-1 signalling, which in turn activate of the hypothalamic–pituitary–adrenal axis (HPA) [5]. Persistent stimulation of the HPA, associated with both depression and diabetes, as well as obesity, is related to the dysfunction of neurotransmitters such as noradrenalin, dopamine and serotonin, and changes in monoaminergic pathways [6]. It has also been hypothesised that both depression and diabetes share a common neurobiological background associated which changes in brain white matter and impaired neuroplasticity [7].
The pathogenesis of depression could be linked with that of diabetes, and with its co-morbidities, such as obesity, dyslipidaemia and hypertension, by low-grade chronic systemic inflammation. Chronic hyperglycaemia is associated with increased pro-inflammatory cytokines, elevated synthesis of advanced glycation end products (AGEs), and overproduction of reactive oxygen species (ROS). Furthermore, elevated oxidative stress, inflammatory responses, and disturbed blood-brain barrier permeability increases the leakage of proteins and other mediators into the perivascular space. This can allow various cytokines, such as IL-6, tumour necrosis factor (TNF-α), and IL-1β to influence neurotransmitter metabolism, impair neuroendocrine function or neuroplasticity, and decrease neurogenesis, which plays a crucial role in the pathogenesis of depression [8,9,10,11]. Also, a body of research suggests that depression arises from neuroinflammation resulting from the stimulation of microglia or astrocytes and the secretion of pro-inflammatory cytokines. Neuroinflammation leads to structural and functional changes in brain and HPA activation [12,13].
It has also been hypothesised that seniors may be more at risk of mood disorders as a result of the aging process. Aging is believed to transition the body into a pro-inflammatory state, which is driven by raised immune reaction at peripheral level, disrupted immune signalling between the central and periphery nervous systems, and the central nervous system providing more intense and inconsistent responses [14]. However, the evidence regarding a relationship between inflammatory mediators and late-life depression is contradictory [15] and little concrete data exists concerning these issues in the oldest-old diabetic population. This population could also be subject to certain atypical vascular and lifestyle factors, and the predictive model of depression becomes more complex in late life. Therefore the aims of this study were to compare the levels of inflammatory markers (TNF-α, IL-1β, and IL-6) between oldest-old diabetic patients with depressive symptoms and those without, and to identify the risk factors associated with depressive symptoms in this group.
Results
Demographic and Clinical Profile of Patients with T2DM
The demographic and clinical profile of the study group are presented in Table 1 and Table 2. Subjects with depressive symptoms were more likely to be female, living alone and smoking, with no physical activity; in addition, they were more likely to be diagnosed with cardiovascular disease, retinopathy, neuropathy, hypertension and hyperlipidaemia, and a higher proportion was treated with insulin (χ2 test; Table 1). No significant differences between depressive and non-depressive groups were found with regard to the presence of stroke, nephropathy, prevalence of mild cognitive impairment, or treatment with OAD. Also, patients with depressive symptoms tended to be older, with a longer duration of diabetes, increased number of co-morbidities, higher BMI, and fasting blood glucose; they also tended to present elevated levels of HbA1c, total cholesterol, LDL cholesterol and triglycerides, lower concentrations of HDL cholesterol, and higher GDS score (T-test or Mann–Whitney U-test; Table 2). Lastly, no significant differences were found between the two groups with regard to years of education, MoCA score, systolic or diastolic blood pressure.
Inflammatory Marker Levels in Depressive Patients and Controls
The group of patients with depressive symptoms was characterised by significantly higher serum levels of TNF-α IL-1β, and IL-6 compared to controls (Figure 1a, Figure 1b and Figure 1c). More precisely, the measured TNF-α level was 14.59 ± 4.27 pg/ml compared to 9.69 ± 3.03 pg/ml in controls; IL-1β 13.38 ± 4.47 pg/ml compared to 9.5 ± 3.2 pg/ml in controls; IL-6 4.72 ± 1.13 pg/ml compared to 3.71 ± 0.91 pg/ml in controls. When considering both groups, i.e. all subjects, mean TNF-α level was 11.45 ± 4.24 pg/ml, IL-1β was 10.88 ± 4.15 pg/ml, and IL-6 was 4.07 ± 1.11 pg/ml.
Correlation Analyses
Correlation analysis confirmed a significant positive relationship between the levels of all inflammatory markers in T2DM patients with depressive symptoms (Table 3). Furthermore, the concentrations of TNF-α, IL-1β, and IL-6 were highly correlated with HbA1c level, GDS score, FBG and BMI. Also a week positive association was noted between TNF-α or IL-6 level and the duration of diabetes, between TNF-α or IL-1β level and triglyceride level or number of co-morbidities, and finally, a weak negative relationship between TNF-α or IL-1β level and HDL cholesterol level (Table 3).
Interestingly, in the group of patients with depressive symptoms, elevated HbA1c levels were associated with higher GDS score (r=0.72, p<0.001), BMI (r=0.47 p<0.001), and number of comorbidities (r=0.65, p<0.001). Also, higher GDS score was correlated with BMI (r=0.63 p<0.001), and number of co-morbidities (r=0.64, p<0.001) (data not presented in tables).
Risk Factor for Depressive Symptoms
According to the univariate logistic regression models, the following variables are predictive of depressive symptoms in oldest old patients with type 2 diabetes: older age, female sex, living alone, smoking habit, no physical activity, higher BMI, longer duration of T2DM, increased number of comorbidities, presence of cardiovascular disease, retinopathy, neuropathy, hypertension and hyperlipidaemia, insulin treatment, higher levels of HbA1c, total cholesterol, LDL and TG, lower concentrations of HDL, and higher levels of TNF-α, IL-1β, and IL-6 (Table 4).
Discussion
The studied elderly patients with T2DM and depressive symptoms demonstrated significantly elevated levels of inflammatory mediators such as TNF-α, IL-1β, and IL-6 compared to subjects without depressive symptoms. Furthermore, univariate analysis confirmed that TNF-α, IL-1β, and IL-6 are predictive of depressive symptoms in the tested oldest-old diabetic population.
These results are consistent with previous studies indicating systemic inflammation as a mechanism linking depression and diabetes [10,20,21]. A large meta-analysis found markers such as TNF-α, C-reactive protein (CRP), and IL-6 to be elevated in subjects with depression compared to those without [22]. It has also been confirmed that aging is associated with an increase in the levels of cytokines, particularly IL-6 and TNF-α, even in healthy individuals; this could be party explained by rise in adiposity and the reduction of sex hormone levels following menopause and andropause [23]. One longitudinal study confirmed associations between depression and IL-6 levels [24]; elevated IL-6 level is believed to play a role in vascular damage by enhancing oxidative stress, impairing endothelial function and facilitating the progression of atherosclerosis [25]. In addition, elevated TNF-α is also associated with a greater prevalence of atherosclerosis [26], and IL-6, TNF-α and CRP are independent predictors of cardiovascular events in older adults [23]. Also, increased secretion of pro-inflammatory cytokines such as TNF-α, IL-1β, IL-6 and adipokines has been implicated in endothelial dysfunction induced by hyperglycaemia, oxidative stress and AGE overproduction. This mechanism is believed to link diabetes with its complications and the development of atherosclerosis [27].
A number of human population studies confirm that TNF-α plays an essential part in IL-6 production, and that its levels correlate with IL-6 concentration [23]. This is in line with our present findings, which confirm a significant correlation between all studied pro-inflammatory parameters. In addition, increased levels of TNF-α, IL-1β, and IL-6 were found to be related to higher GDS score, indicating that the severity of inflammation corresponds to more severe depressive symptoms. Indeed, previous studies in older populations also report that increased IL-1β or CPR [28], IL-6 [29] or TNF-α levels [30] were significantly related to depression severity. One large analysis indicates that inflammatory parameters, especially IL-6 and TNF-α may represent biomarkers for the development of late-life depression [31].
A significant finding of the present study is that patients with both depression and T2DM tended to demonstrate higher levels of TNF-α, IL-1β, and IL-6. In addition, pro-inflammatory marker concentrations demonstrated significant correlations with other tested parameters, such as FBG or HbA1c levels, in the subjects with depression; also, elevated HbA1c levels were associated with higher GDS score, BMI and number of co-morbidities. These observations suggest a bidirectional link between depression and diabetes. This is supported by a recent systemic review and meta-analysis of longitudinal large-scale studies, which concludes that increased HbA1c levels are associated with a higher risk for depression and vice versa [32]. It presents several biological mechanism that could account for the relationship between hyperglycaemia and the development of depression; for instance, when present at high levels, plasma glucose can easily cross the blood brain barrier and induce oxidative stress in neurons, leading to brain atrophy via neural apoptosis [32]. Alternatively, low-grade inflammation, decreased brain-derived neutrophic factor and vascular pathology may be induced in areas of the brain connected to mood [32]. Our present findings indicate that inter alia previous CVD, hypertension, hyperlipidaemia, microvascular complications, higher levels of TNF-α, IL-1β, or IL-6, and poorer glycaemic control (higher HbA1c level) increased the likelihood of depressive symptoms. Furthermore, the participants with both depression and diabetes exhibit elevated levels of inflammatory markers, which may be associated with vascular diseases; as a result, inflammation may occur after vascular incidents, or even trigger or worsen them. Clearly, inflammation plays a manifold role in the relationship between depression, diabetes and vascular diseases. This is supported in large epidemiological studies, which have reported an association between depression and vascular pathology [33,34], or a greater prevalence of micro and macro complications in diabetic patients [35], as well as higher morbidity [36].
Among patients with diabetes, the onset of depressive symptoms might be also be associated with the psychological burden connected to difficulties in self-management, fear of complications, unhealthy lifestyle, loneliness and chronic stress [37,38]. Our present findings indicate the risk of depressive symptoms to be associated with older age, increased number of co-morbidities, longer duration of diabetes, female sex, living alone, smoking, lack of physical activity, higher BMI and insulin treatment; all these parameters are widely described in the literature [39,40,41]. Female sex is a known risk factor for depression and anxiety. Single relationship status has been found to promote loneliness and poorer mood, and is more common in the older population. Also, while most studies report older age as a risk factor for depression, data obtained from a diabetic cohort yielded contradictory results [42]. Interestingly, one large report indicates that while older individuals are less likely to experience severe depression, they are more than ten times more likely to demonstrate milder symptoms, such as minor depression, compared to the younger population [43].
Older patients typically report a longer duration of diabetes, with a greater number of complications and comorbidities, as well as a more complex treatment regimen (e.g. insulin). These factors directly increase disease burden and may contribute to psychological distress and a poorer quality of life.
Our findings indicate that patients with depressive symptoms were less physically active and demonstrated higher BMI. This is in line with a previous large meta-analysis, which confirmed a longitudinal bidirectional association between obesity and depression [44]. Our data also indicate that BMI is related to the levels of all three tested inflammatory markers, as well as with GDS score and HbA1c concentration. We therefore hypothesise that the mechanism underlying the pathologic circle of coexisting obesity, poor glycaemic control and more severe depressive symptoms could be based around systemic inflammation.
However studies on the interaction between cytokine level, obesity and depression provide contradictory results [45,46,47]. While IL-6 levels were found to be elevated in obese subjects with depression [45,46], no such correlation was observed between TNF-α and obesity [47]. In the present study, a positive correlation was observed between triglyceride levels and TNF-α or IL-1β concentration, and negative associations between these mediators and HDL levels. Hyperlipidaemia was also identified as a risk factor for depressive symptoms in elderly diabetic patients in univariate analysis. These observations imply a complex relationship that encompasses, among others, inflammatory markers, dysregulation of adipose tissue in obesity, dyslipidaemia, insulin resistance and beta cell dysfunction [48].
Our study provides a significant contribution to the understanding of oldest-old diabetic patients, either with or without depressive symptoms. Among this group, those with symptoms of depression presented significantly increased serum levels of TNF-α, IL-1β and IL-6. Furthermore, all these inflammatory markers demonstrated significant correlations with HbA1c level, GDS score or BMI in patients with depressive symptoms. The levels of TNF-α, IL-1β, and IL-6, HbA1c, or GDS score were also related to the number of comorbidities. Finally, univariate analysis was used to identify the key risk factors associated with depressive symptoms in this population.
The research is not without its limitations. As the study used a cross-sectional approach, it is not possible to establish casual links between the variables examined and depressive symptoms. Also, the study was based on a single centre, which might restrict the applicability of the findings to other groups. Lastly because of the limited group size and relatively high number of variables, only a univariate analysis was performed, rather than a multivariable analysis; as a result, it is not possible to account for confounding factors, and certain findings might be false positive due to type 1 errors.
Conclusions
Our findings confirm that elevated TNF-α, IL-1β, and IL-6 levels play a critical role in the onset of depressive symptoms in the oldest-old patients with T2DM. In this group, the following parameters predicted a higher likelihood of depressive symptoms: older age, female sex, living alone, smoking habit, no physical activity, higher BMI, longer duration of T2DM, increased number of co-morbidities, presence of cardiovascular disease, retinopathy, neuropathy, hypertension and hyperlipidaemia, insulin treatment, higher levels of HbA1c, total cholesterol, LDL and TG, lower concentrations of HDL, and higher levels of TNF-α, IL-1β, and IL-6. Low-grade inflammation could also be one of the mechanisms underlying co-morbid depression and diabetes; as such, the cytokines TNF-α, IL-1β, and IL-6 might serve as diagnostic biomarkers and potential therapeutic targets. Further longitudinal cohort studies and randomized controlled trials are needed to provide novel pathways for research, therapy and prevention of these diseases.
Materials and Methods
Participant Selection and Setting
A cross-sectional study was performed of individuals with T2DM aged 85 and above. All subjects were consecutively recruited from the outpatient Diabetology clinic affiliated with the University Teaching Hospital No 1 in Lodz, Poland. Written informed consent was obtained from the participants at the beginning of the study.
The inclusion criteria were as follows: age 85 and over, diagnosis with T2D minimum one year earlier, full ability to understand and cooperate with study procedures and provision of written informed consent. The exclusion criteria included the following: pre-existing psychiatric disorders (e.g., bipolar disorder, schizophrenia or dementia), use of possible drugs with known psychotropic effects, active neoplasm or infectious disease, constant alcohol or substance abuse, severe visual, hearing, or motor coordination impairment, history of brain injuries, inflammatory or infectious brain disease.
Data Collection and Procedures
General demographic information was collected: sex, age, and years of education, living alone (single/widowed/divorced). A detailed medical history was obtained from each patient via interview. This included smoking habit, any physical activity, diabetes duration, number of comorbid diseases, micro and macro complications of diabetes (hypertension, cardiovascular diseases, hyperlipidaemia, stroke, retinopathy, neuropathy, nephropathy), currant treatment for diabetes (oral or insulin). Body mass index (BMI) was determined by measuring height and weight, and using the following formula: Kg/ m2. Systolic and diastolic blood pressure (mmHg), were taken with the patient seated after resting for 10 minutes. The diagnosis of hypertension was made based on either a past history of hypertension or the intake of any antihypertensive medications. Hyperlipidaemia was diagnosed based on either the use of any lipid lowering drug, or the presence of untreated triglyceride level of 1.7 mmol/l or serum LDL cholesterol 2.6 mmol/l or higher.
Blood samples were collected though a blood draw in the morning following 10 to 12-hour overnight fast. The participants received a snack afterward to confirm they were not experiencing hypoglycaemia during the neuropsychological assessment. The participants then moved to a different, peaceful room, where they gave a detailed medical history, and received the full physical examination and psychological test battery.
Neuropsychological Assessment
Depressive symptoms were evaluated using the 30-item Geriatric Depression Scale (GDS) [16]. Scores ranging from 0 to 9 are considered non-depressive, while those between 10 and 19 indicate the presence of depressive symptoms. A score of 20 or more is classified as severe depression, and individuals with such stores were referred to a psychiatrist for additional evaluation.
Mild cognitive impairment (MCI) was evaluated using the Montreal Cognitive Assessment (MoCA) [17], which is known as the most effective screening instrument for MCI in elderly, diabetic patients [18]. The MoCA test comprises eight areas: visuospatial/executive reasoning, memory, naming, abstraction attention, language, and orientation skills. The highest possible score is 30 points, and a result of ≥26 is evaluated as cognitively normal. An additional point is granted for those who have less than 12 years of formal education. For this research, the diagnosis of MCI was established based on criteria set forth by the 2006 European Alzheimer’s Disease Consortium [19]. These guidelines include absence of dementia. As indicated by findings from epidemiological studies, MoCA scores under 19 points were interpreted as indicative of dementia; such subjects were excluded from the study and referred to a psychiatrist for further assistance.
Biochemical Analyses
Blood samples were collected, centrifuged and kept in storage at -80˚C. The levels of TNF-α (Human TNF-α; DTA00C), IL-1β (Human IL-1β; DLB50), and IL-6 (Human IL-6; D6050) were determined by Quantikine Human Immunoassay ELISA kit (Bio-techne, Minneapolis, MN, USA) according to the manufacturer’s instructions. For TNF-α, the intra-assay coefficient of variation was 5.2% and the inter-assay coefficient 7.4%. For IL-1β, the intra-assay coefficient was 8.5% and the inter-assay coefficient 8.4%. For IL-6, the intra-assay coefficient was 1.8% and the inter-assay coefficient 4.2%. The minimum detectable concentrations were 1 pg/mL for IL-1β, 1.6 pg/mL for TNF-α, and 0.626 pg/mL for IL-6.
Glycosylated haemoglobin (HbA1c), fasting blood glucose (FBG), total cholesterol, triglycerides, low-density lipoprotein cholesterol (LDL) and high-density lipoprotein cholesterol (HDL) were measured in a centralized laboratory.
Group Selection
The 195 T2DM participants recruited to the study were divided into two groups: 70 (35.9%) patients with depressive symptoms, and 125 (64.1%) subjects without depressive symptoms. The second group acted as controls.
Ethics
The study was carried out in full compliance with the guidelines given in the Helsinki declaration. Every patient received a specific identification number to maintain confidentiality. The purpose, nature, and potential risks of the experiments were fully explained to the participants. All participating patients provided their written informed consent to take part at the start of the study. Ethical approval was obtained from the independent local ethics committee of the Medical University of Lodz (Approval No. RNN/420/13/KB).
Statistical Analysis
The statistical analysis was performed using Statistica 13.1 (StatSoft, Poland). Categorical variables were expressed as numbers and percentages, whereas continuous variables were reported as means with standard deviations (SD). Normality was determined by the Shapiro-Wilk test. Among the continuous variables, normally-distributed ones were compared using the independent t-test, and non-normally distributed ones with the Mann–Whitney U-test. Categorical data were analysed using the chi-square (χ2) test. The relationships were assessed using Pearson’s correlation analysis, for normally-distributed variables, or Spearman’s rank correlation for non-normally distributed ones. A simple logistic regression model was developed to identify the independent factors that increase the selection risk of depressive symptoms in elderly patients with T2DM. Odds ratios (OR) were computed and presented with the 95% interval of confidence (CI). P-values of < 0.05 were considered statistically significant.
Author Contributions
Conceptualization, M.G-C. and M.C.; methodology, M.G-C. and M.C. formal analysis, M.G-C.; investigation, M.G-C. and M.C.; resources, M.G-C. and M.C.; data curation, M. G-C.; writing—original draft preparation, M.G-C. and M.C.; writing—review and editing, M.G-C. and M.C.; visualization, M.G-C. and M.C.; supervision, M.G-C.; project administration, M.G-C. and M.C. All authors have read and agreed to the published version of the manuscript.
Funding
The study was supported by a non-profit grant of the Medical University of Lodz No: 503/8-072-04/503-81-001.
Institutional Review Board Statement
The study was conducted in accordance with the Declaration of Helsinki, and approved by the independent local Ethics Committee of the Medical University of Lodz No RNN/420/13/KB.
Informed Consent Statement
Informed consent was obtained from all subjects involved in the study.
Data Availability Statement
The data presented in this study are available on request from the corresponding author.
Conflicts of Interest
The authors declare no conflict of interest.
References
- International Diabetes Federation. IDF Diabetes Atlas, 11th ed.; IDF: Brussels, Belgium, 2025; Available online: https://diabetesatlas.org/resources/idf-diabetes-atlas-2025/ (accessed on 7 Jan 2025).
- Centers for Disease Control and Prevention. National Diabetes Statistics Report Website. Available online: https://usdss.cdc.gov/diabetes/report.html (accessed on 20 June 2026).
- Xu, H.; Chen, Q. The Bidirectional Influence between Type 2 Diabetes Mellitus and the State of Depression and Anxiety. J. Affect Disord. 2025, 386, 119467. [Google Scholar] [CrossRef] [PubMed]
- Sharma, V.K.; Singh, T.G. Chronic Stress and Diabetes Mellitus: Interwoven Pathologies. Curr. Diabetes Rev. 2020, 16, 546–556. [Google Scholar] [CrossRef] [PubMed]
- Subba, R.; Sandhir, R.; Singh, S.P.; Mallick, B.N.; Mondal, A.C. Pathophysiology Linking Depression and Type 2 Diabetes: Psychotherapy, Physical Exercise, and Fecal Microbiome Transplantation as Damage Control. Eur. J. Neurosci. 2021, 53, 2870–2900. [Google Scholar] [CrossRef] [PubMed]
- Borgland, S. L. Can treatment of obesity reduce depression or vice versa? J. Psychiatry Neurosci. 2021, 46, E313–E318. [Google Scholar] [CrossRef] [PubMed]
- Chow, Y.Y.; Verdonschot, M.; McEvoy, C.T.; Peeters, G. Associations between Depression and Cognition, Mild Cognitive Impairment and Dementia in Persons with Diabetes Mellitus: A Systematic Review and Meta-Analysis. Diabetes Res. Clin. Pract. 2022, 185, 109227. [Google Scholar] [CrossRef] [PubMed]
- Kim, D.J.; Yu, J.H.; Shin, M.S.; Shin, Y.W.; Kim, M.S. Hyperglycemia Reduces Efficiency of Brain Networks in Subjects with Type 2 Diabetes. PLoS ONE. 2016, 11, e0157268. [Google Scholar] [CrossRef] [PubMed]
- Jacobs, B.L.; Praag, H.; Gage, F.H. Adult brain neurogenesis and psychiatry: a novel theory of depression. Mol. Psychiatry 2000, 5, 262–269. [Google Scholar] [CrossRef] [PubMed]
- Maydych, V. The Interplay Between Stress, Inflammation, and Emotional Attention: Relevance for Depression. Front. Neurosci. 2019, 13, 384. [Google Scholar] [CrossRef] [PubMed]
- Gorska-Ciebiada, M.; Saryusz-Wolska, M.; Borkowska, A.; Ciebiada, M.; Loba, J. Serum Levels of Inflammatory Markers in Depressed Elderly Patients with Diabetes and Mild Cognitive Impairment. PLoS ONE. 2015, 10, e0120433. [Google Scholar] [CrossRef] [PubMed]
- Kiecolt-Glaser, J.K.; Derry, H.M.; Fagundes, C.P. Inflammation: Depression Fans the Flames and Feasts on the Heat. Am. J. Psychiatry. 2015, 172, 1075–1091. [Google Scholar] [CrossRef] [PubMed]
- Chang, J.; Jiang, T.; Shan, X.; Zhang, M.; Li, Y.; Qi, X.; Bian, Y.; Zhao, L. Pro-Inflammatory Cytokines in Stress-Induced Depression: Novel Insights into Mechanisms and Promising Therapeutic Strategies. Prog. Neuropsychopharmacol. Biol. Psychiatry. 2024, 131, 110931. [Google Scholar] [CrossRef] [PubMed]
- Alexopoulos, G.S.; Morimoto, S.S. The Inflammation Hypothesis in Geriatric Depression. Int. J. Geriatr. Psychiatry. 2011, 26, 1109–1118. [Google Scholar] [CrossRef] [PubMed]
- Disabato, B.M.; Sheline, Y.I. Biological Basis of Late Life Depression. Curr. Psychiatry Rep. 2012, 14, 273–279. [Google Scholar] [CrossRef] [PubMed]
- Yesavage, J.A.; Brink, T.L.; Rose, T.L.; Lum, O.; Huang, V.; Adey, M.; Leirer, V.O. Development and Validation of a Geriatric Depression Screening Scale: A Preliminary Report. J. Psychiatr. Res. 1982, 17, 37–49. [Google Scholar] [CrossRef] [PubMed]
- Nasreddine, Z.S.; Phillips, N.A.; Bédirian, V.; Charbonneau, S.; Whitehead, V.; Collin, I.; Cummings, J.L.; Chertkow, H. The Montreal Cognitive Assessment, MoCA: A Brief Screening Tool for Mild Cognitive Impairment. J. Am. Geriatr. Soc. 2005, 53, 695–699. [Google Scholar] [CrossRef] [PubMed]
- Alagiakrishnan, K.; Zhao, N.; Mereu, L.; Senior, P.; Senthilselvan, A. Montreal Cognitive Assessment Is Superior to Standardized Mini-Mental Status Exam in Detecting Mild Cognitive Impairment in the Middle-Aged and Elderly Patients with Type 2 Diabetes Mellitus. BioMed Re.s Int. 2013, 186106. [Google Scholar] [CrossRef] [PubMed]
- Portet, F.; Ousset, P.J.; Visser, P.J.; Frisoni, G.B.; Nobili, F.; Scheltens, P.; Vellas, B.; Touchon, J.; Alzheimer’s Disease, M.C.I.W.G. Mild Cognitive Impairment (MCI) in Medical Practice: A Critical Review of the Concept and New Diagnostic Procedure. Report of the MCI Working Group of the European Consortium on Alzheimer’s Disease. J. Neurol. Neurosurg. Psychiatry. 2006, 77, 714–718. [Google Scholar] [CrossRef] [PubMed]
- Cătălina, G.R.; Gheorman, V.; Gheorman, V.; Forțofoiu, M.C. The Role of Neuroinflammation in the Comorbidity of Psychiatric Disorders and Internal Diseases. Healthcare 2025, 13, 837. [Google Scholar] [CrossRef] [PubMed]
- Khawagi, W.Y.; Al-Kuraishy, H.M.; Hussein, N.R.; Al-Gareeb, A.I.; Atef, E.; Elhussieny, O.; Alexiou, A.; Papadakis, M.; Jabir, M.S.; Alshehri, A.A.; et al. Depression and Type 2 Diabetes: A Causal Relationship and Mechanistic Pathway. Diabetes Obes. Metab. 2024, 26, 3031–3044. [Google Scholar] [CrossRef] [PubMed]
- Dowlati, Y.; Herrmann, N.; Swardfager, W.; Liu, H.; Sham, L.; Reim, E.K.; Lanctôt, K.L. A meta-analysis of cytokines in major depression. Biol. Psychiatry. 2010, 67, 446–457. [Google Scholar] [CrossRef] [PubMed]
- Singh, T.; Newman, A.B. Inflammatory Markers in Population Studies of Aging. Ageing Res. Rev. 2011, 10, 319–329. [Google Scholar] [CrossRef] [PubMed]
- Lamers, F.; Milaneschi, Y.; Smit, J.H.; Schoevers, R.A.; Wittenberg, G.; Penninx, B.W.J.H. Longitudinal Association Between Depression and Inflammatory Markers: Results From the Netherlands Study of Depression and Anxiety. Biol. Psychiatry. 2019, 85, 829–837. [Google Scholar] [CrossRef] [PubMed]
- Didion, S. P. Cellular and Oxidative Mechanisms Associated with Interleukin-6 Signaling in the Vasculature. Int. J. Mol. Sci. 2017, 18, 2563. [Google Scholar] [CrossRef] [PubMed]
- Bruunsgaard, H.; Skinhøj, P.; Pedersen, A.N.; Schroll, M.; Pedersen, B.K. Ageing, Tumour Necrosis Factor-Alpha (TNF-Alpha) and Atherosclerosis. Clin. Exp. Immunol. 2000, 121, 255–260. [Google Scholar] [CrossRef] [PubMed]
- Tripathy, M.; Swain, J.; Das, S. The Association of Diabetes and Atherosclerosis: Understanding the Molecular Mechanism of the Double Burden. Curr. Med. Chem. 2026. [Google Scholar] [CrossRef] [PubMed]
- Biggelaar, A.H.; Gussekloo, J.; Craen, A.J.; Frölich, M.; Stek, M.L.; Mast, R.C.; Westendorp, R.G. Inflammation and Interleukin-1 Signaling Network Contribute to Depressive Symptoms but Not Cognitive Decline in Old Age. Exp. Gerontol. 2007, 42, 693–701. [Google Scholar] [CrossRef] [PubMed]
- Baune, B.T.; Smith, E.; Reppermund, S.; Air, T.; Samaras, K.; Lux, O.; Brodaty, H.; Sachdev, P.; Trollor, J.N. Inflammatory Biomarkers Predict Depressive, but Not Anxiety Symptoms during Aging: The Prospective Sydney Memory and Aging Study. Psychoneuroendocrinology 2012, 37, 1521–1530. [Google Scholar] [CrossRef] [PubMed]
- Forti, P.; Rietti, E.; Pisacane, N.; Olivelli, V.; Mariani, E.; Chiappelli, M.; Licastro, F.; Ravaglia, G. Blood Inflammatory Proteins and Risk of Incident Depression in the Elderly. Dement. Geriatr. Cogn. Disord. 2010, 29, 11–20. [Google Scholar] [CrossRef] [PubMed]
- Martínez-Cengotitabengoa, M.; Carrascón, L.; O’Brien, J.T.; Díaz-Gutiérrez, M.J.; Bermúdez-Ampudia, C.; Sanada, K.; Arrasate, M.; González-Pinto, A. Peripheral Inflammatory Parameters in Late-Life Depression: A Systematic Review. Int.J. Mol. Sci. 2016, 17. [Google Scholar] [CrossRef] [PubMed]
- Beran, M.; Muzambi, R.; Geraets, A.; Albertorio-Diaz, J.R.; Adriaanse, M.C.; Iversen, M.M.; Kokoszka, A.; Nefs, G.; Nouwen, A.; Pouwer, F.; et al. The Bidirectional Longitudinal Association between Depressive Symptoms and HbA1c : A Systematic Review and Meta-Analysis. Diab. Med. 2022, 39, 14671. [Google Scholar] [CrossRef] [PubMed]
- Camus, V.; Kraehenbühl, H.; Preisig, M.; Büla, C.J.; Waeber, G. Geriatric Depression and Vascular Diseases: What Are the Links? J. Affect. Disord. 2004, 81, 1–16. [Google Scholar] [CrossRef] [PubMed]
- Tiemeier, H.; Dijck, W.; Hofman, A.; Witteman, J.C.; Stijnen, T.; Breteler, M.M. Relationship between Atherosclerosis and Late-Life Depression: The Rotterdam Study. Arch. Gen. Psychiatry. 2004, 61, 369–376. [Google Scholar] [CrossRef] [PubMed]
- Groot, M.; Anderson, R.; Freedland, K.E.; Clouse, R.E.; Lustman, P.J. Association of Depression and Diabetes Complications: A Meta-Analysis. Psychosom. Med. 2001, 63, 619–630. [Google Scholar] [CrossRef] [PubMed]
- Zhang, X.; Norris, S.L.; Gregg, E.W.; Cheng, Y.J.; Beckles, G.; Kahn, H.S. Depressive Symptoms and Mortality among Persons with and without Diabetes. Am. J. Epidemiol. 2005, 161, 652–660. [Google Scholar] [CrossRef] [PubMed]
- Snoek, F.J.; Bremmer, M.A.; Hermanns, N. Constructs of Depression and Distress in Diabetes: Time for an Appraisal. Lancet Diabetes Endocrinol. 2015, 3, 450–460. [Google Scholar] [CrossRef] [PubMed]
- Mhalla, H.; Ben Mbarek, M.; Ounaissa, K.; Betbout, I.; Ben Haouala, A.; Zaafrane, F.; Amrouche, C.; Amamou, B.; Mhalla, A. Depressive comorbidity in type 2 Diabetes: Prevalence and associated factors. Tunis. Med. 2026, 104, 10 62438 104 01 5434. [Google Scholar] [CrossRef] [PubMed]
- Lloyd, C.E.; Nouwen, A.; Sartorius, N.; Ahmed, H.U.; Alvarez, A.; Bahendeka, S.; Basangwa, D.; Bobrov, A.E.; Boden, S.; Bulgari, V.; et al. Prevalence and Correlates of Depressive Disorders in People with Type 2 Diabetes: Results from the International Prevalence and Treatment of Diabetes and Depression (INTERPRET-DD) Study, a Collaborative Study Carried out in 14 Countries. Diabet. Med. 2018, 35, 760–769. [Google Scholar] [CrossRef] [PubMed]
- Alajmani, D.S.A.; Alkaabi, A.M.; Alhosani, M.W.; Folad, A.A.; Abdouli, F.A.; Carrick, F.R.; Abdulrahman, M. Prevalence of Undiagnosed Depression in Patients With Type 2 Diabetes. Front. Endocrinol. . 2019, 10, 259. [Google Scholar] [CrossRef] [PubMed]
- Engum, A.; Mykletun, A.; Midthjell, K.; Holen, A.; Dahl, A.A. Depression and Diabetes: A Large Population-Based Study of Sociodemographic, Lifestyle, and Clinical Factors Associated with Depression in Type 1 and Type 2 Diabetes. Diabetes Care 2005, 28, 1904–1909. [Google Scholar] [CrossRef] [PubMed]
- Katon, W.; Fan, M.Y.; Unützer, J.; Taylor, J.; Pincus, H.; Schoenbaum, M. Depression and Diabetes: A Potentially Lethal Combination. J. Gen. Intern. Med. 2008, 23, 1571–1575. [Google Scholar] [CrossRef] [PubMed]
- Beekman, A.T.; Geerlings, S.W.; Deeg, D.J.; Smit, J.H.; Schoevers, R.S.; Beurs, E.; Braam, A.W.; Penninx, B.W.; Tilburg, W. The Natural History of Late-Life Depression: A 6-Year Prospective Study in the Community. Arch. Gen. Psychiatr. 2002, 59, 605–611. [Google Scholar] [CrossRef] [PubMed]
- Luppino, F.S.; Wit, L.M.; Bouvy, P.F.; Stijnen, T.; Cuijpers, P.; Penninx, B.W.; Zitman, F.G. Overweight, Obesity, and Depression: A Systematic Review and Meta-Analysis of Longitudinal Studies. Arch. Gen. Psychiatry 2010, 67, 220–229. [Google Scholar] [CrossRef] [PubMed]
- Mac Giollabhui, N.; Swistun, D.; Murray, S.; Moriarity, D.P.; Kautz, M.M.; Ellman, L.M.; Olino, T.M.; Coe, C.L.; Abramson, L.Y.; Alloy, L.B. Executive Dysfunction in Depression in Adolescence: The Role of Inflammation and Higher Body Mass. Psychol. Med. 2020, 50, 683–691. [Google Scholar] [CrossRef] [PubMed]
- Ninla-Aesong, P.; Puangsri, P.; Kietdumrongwong, P.; Jongkrijak, H.; Noipha, K. Being Overweight and Obese Increases Suicide Risk, the Severity of Depression, and the Inflammatory Response in Adolescents with Major Depressive Disorders. Front. Immunol. 2023, 14, 1197775. [Google Scholar] [CrossRef] [PubMed]
- Hallab, A. Health and Aging Brain Study (HABS-HD) Study Team. Mediating Effect of Pro-Inflammatory Cytokines in the Association between Depression, Anxiety, and Cardiometabolic Disorders in an Ethnically Diverse Community-Dwelling Middle-Aged and Older US Population. Prepr. medRxiv. 2025, 2025.04.14, 25325836. [Google Scholar] [CrossRef] [PubMed]
- Obeagu, E. I. Unraveling the connection: Inflammatory markers and diabetes mellitus pathogenesis. Medicine 2026, 105, e47338. [Google Scholar] [CrossRef] [PubMed]
Figure 1.
Serum levels of TNF-α (pg/mL) (a), IL-1β (pg/mL) (b), and IL-6 (pg/ml) (c) in the oldest-old diabetic patients with and without depressive symptoms.
Figure 1.
Serum levels of TNF-α (pg/mL) (a), IL-1β (pg/mL) (b), and IL-6 (pg/ml) (c) in the oldest-old diabetic patients with and without depressive symptoms.
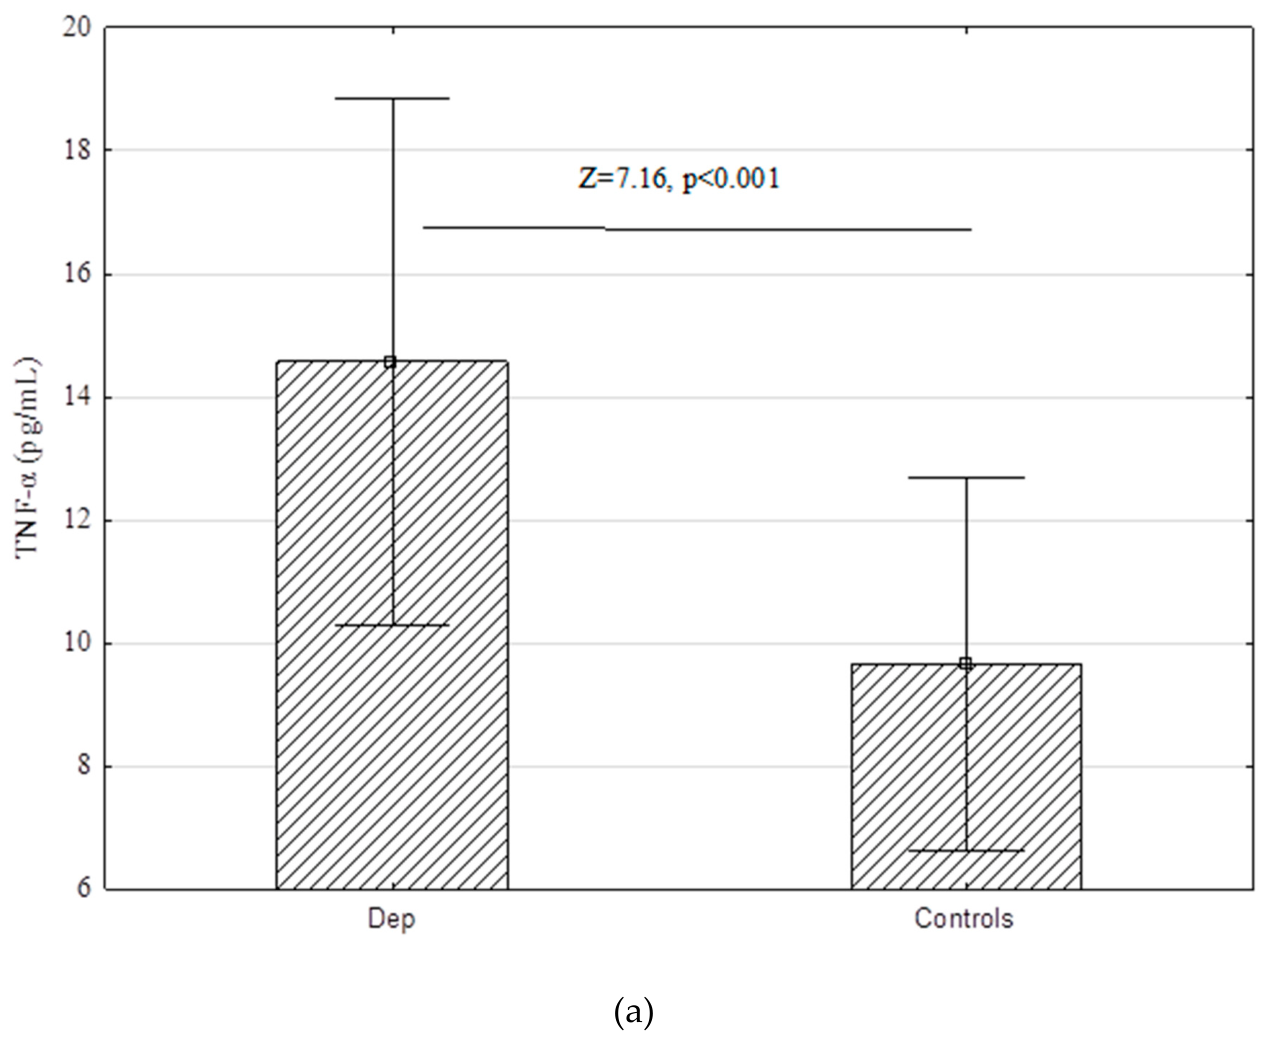
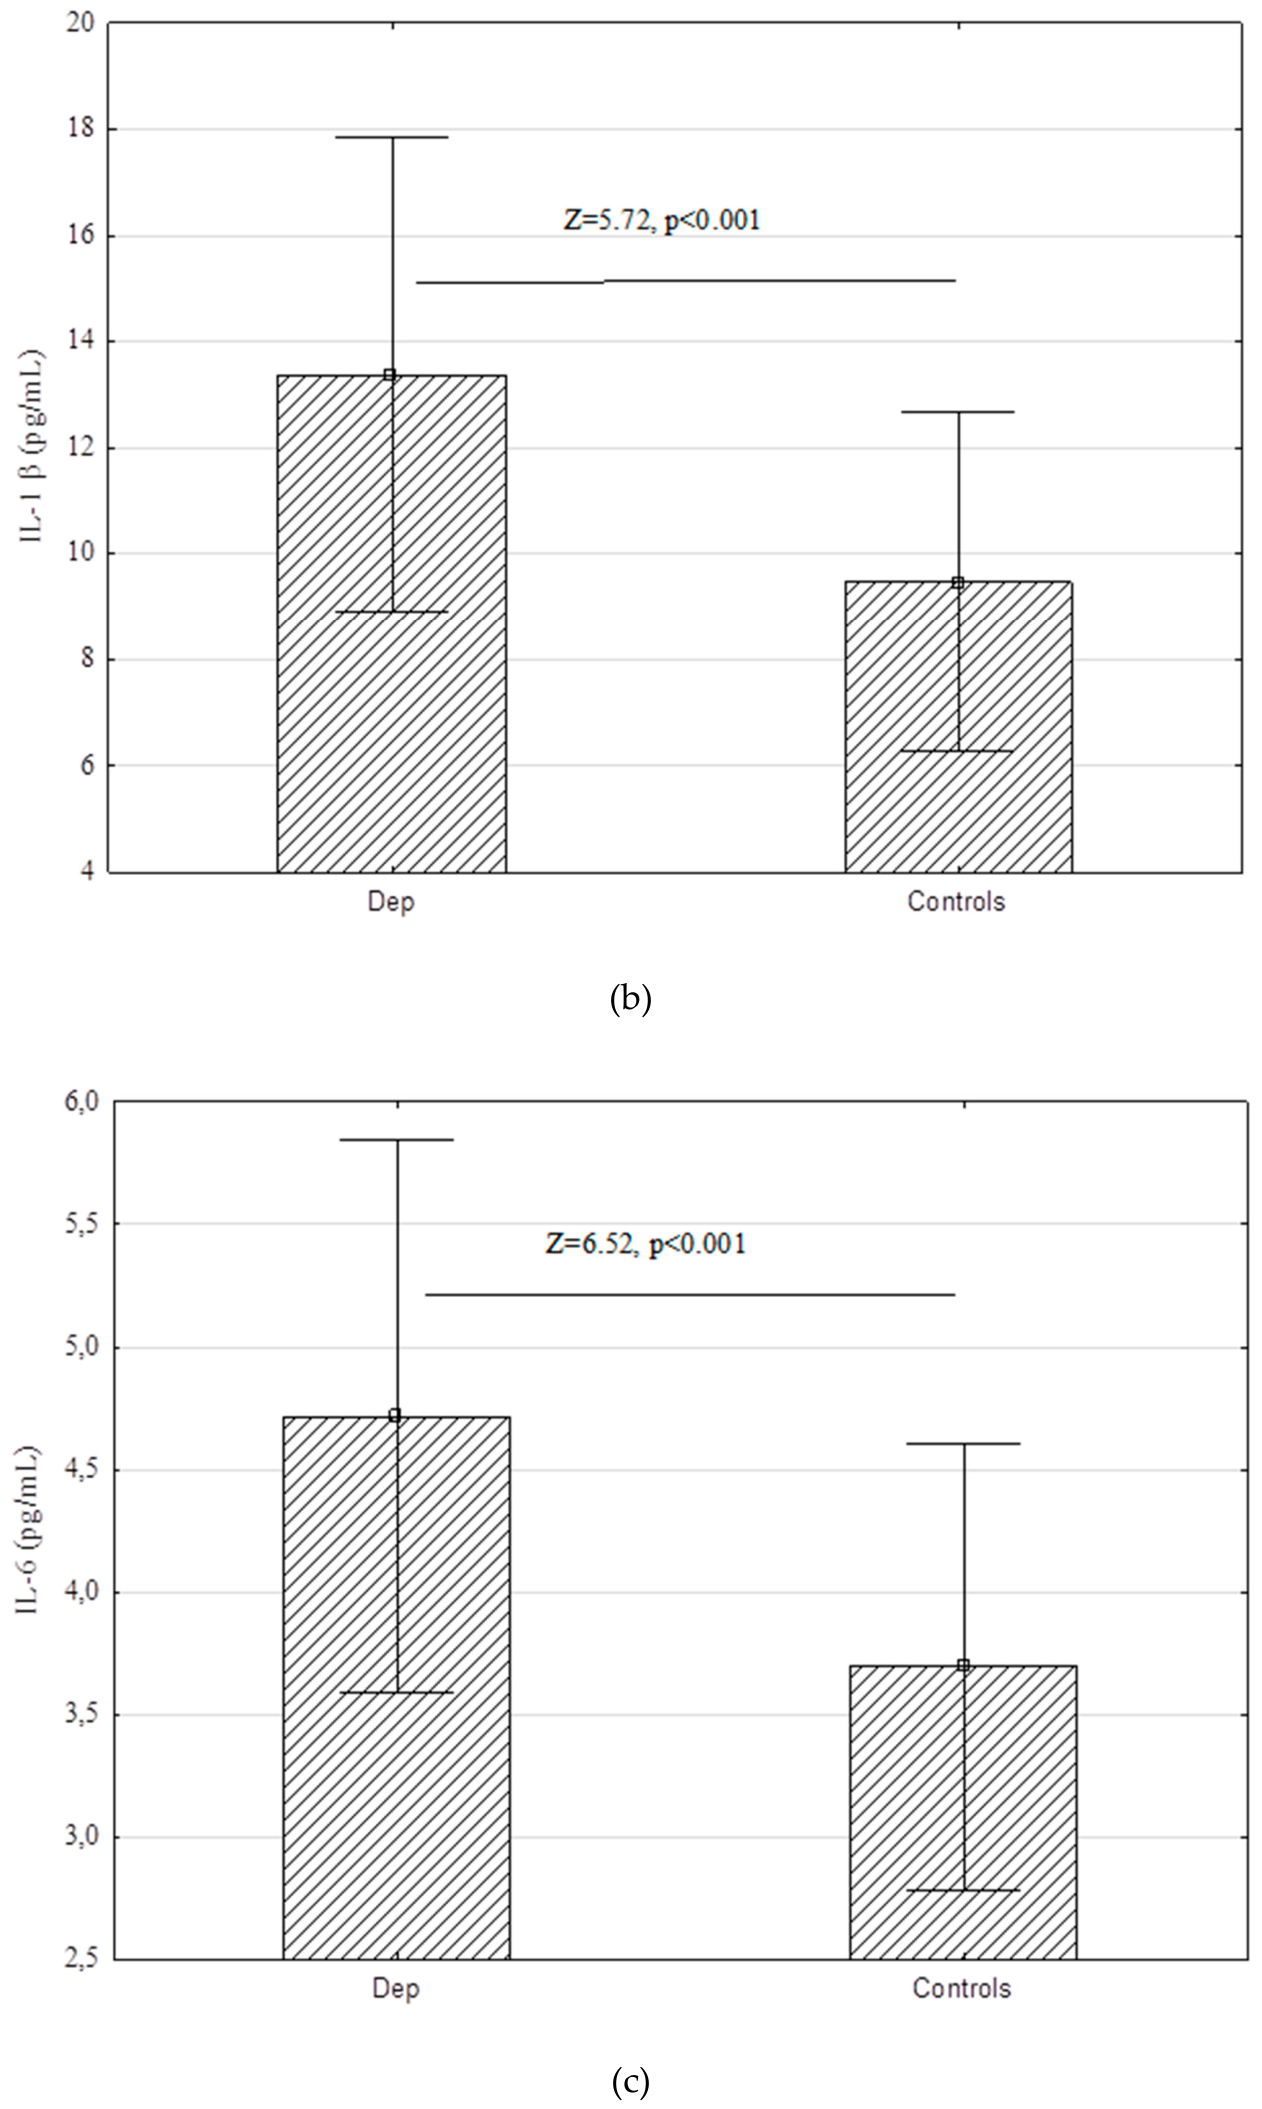

Table 1.
Baseline demographic and clinical characteristics by study group.
| Characteristic | All patients | T2DM with depressive symptoms |
T2DM without depressive symptoms (Controls) |
χ2 |
P value |
| Number of patients | 195 | 70 (35.9%) | 125 (64.1%) | ||
| Sex, female* | 107 (54.8%) | 49 (70%) | 58 (46.4%) | 10.1 | 0.0015 |
| Living alone* | 90 (46.2%) | 47 (67.14%) | 43 (34.4%) | 19.4 | <0.001 |
| Smoked tobacco regularly* | 56 (28.7%) | 27 (38.6%) | 29 (23.2%) | 5.18 | 0.02 |
| No physical activity* | 143 (73.2%) | 64 (91.4%) | 79 (63.2%) | 17.7 | <0.001 |
| Macrovascular complications CVD* |
124 (63.6%) | 58 (82.6%) | 66 (52.8%) | 17.5 | <0.001 |
| Stroke | 9 (4.6%) | 5 (7.1%) | 4 (3.2%) | 1.58 | 0.21 |
| Previous HA/ use of HA drugs* | 162 (83.1%) | 64 (91.4%) | 98 (78.4%) | 4.99 | 0.025 |
| Hyperlipidemia* | 164 (84.1%) | 66 (94.3%) | 98 (78.4%) | 7.96 | 0.0048 |
| Microvascular complications Retinopathy* |
126 (85.7%) | 60 (85.7%) | 66 (52.8%) | 21.26 | <0.001 |
| Nephropathy | 95 (48.7%) | 35 (50%) | 60 (48%) | 0.07 | 0.78 |
| Neuropathy* | 34 (17.4%) | 19 (27.1%) | 15 (12%) | 7.42 | 0.006 |
| MCI | 90 (46.6%) | 38 (54.3%) | 52 (41.6) | 1.05 | 0.3 |
| Treatment OAD |
181 (92.8%) | 64 (91.4%) | 117 (93.6%) | 0.61 | 0.43 |
| Insulin* | 77 (39.5%) | 37 (52.8%) | 40 (32%) | 35.8 | <0.001 |
Abbreviations: T2DM – type 2diabetes, MCI - mild cognitive impairment, CVD - cardiovascular disease, HA - hypertension, OAD - oral antidiabetic drugs, Values are presented as numbers (percentages), χ2 test was used to test for significant differences, *significance p<0.05.
Table 2.
Characteristics and biochemical parameters by study group.
| All patients | T2DM with depressive symptoms |
T2DM without depressive symptoms (Controls) |
Z/t |
P value |
|
| Number of patients | 195 | 70 (35.9%) | 125 (64.1%) | ||
| Age [years]* | 87.3 ± 2.6 | 88.2 ± 2.6 | 86.8 ± 2.6 | 4.34 | <0.001 |
| Education-years | 10.9 ± 2.7 | 10.7 ± 2.8 | 11.1 ± 2.6 | -1.2 | 0.22 |
| Duration of T2DM [years]* | 20.1± 8 | 25.3 ± 7.2 | 17.2 ± 6.8 | 7.4 | <0.001 |
| BMI [kg/m2]* | 29.7 ± 3.8 | 32.5 ± 2.9 | 28.1 ± 3.4 | 7.7 | <0.001 |
| HbA1c [%]* | 7.5 ± 0.9 | 8.19 ± 0.7 | 7.1 ± 0.7 | 8.34 | <0.001 |
| CHOL [mmol/L]* | 191.2 ± 38.4 | 210.8 ± 36.2 | 180.2 ± 35.1 | 5.7 | <0.001 |
| LDL [mmol/L]* | 111.2 ± 30.9 | 125.6 ± 31.5 | 103.2 ± 27.6 | 5.1 | <0.001 |
| TG [mmol/L]* | 181.2 ± 35.6 | 191.1 ± 32.9 | 175.6 ± 36.1 | 3.1 | 0.002 |
| HDL [mmol/L]* | 43.3 ± 8.8 | 41.2 ± 8.2 | 44.4 ± 8.9 | -2.5 | 0.01 |
| Co-morbidity [n]* | 6.2 ± 3.6 | 9.1 ± 2.7 | 4.6 ± 2.9 | 8.1 | <0.001 |
| GDS score* | 7.9 ± 6.9 | 16.34 ± 2.5 | 3.1 ± 2.7 | 11.6 | <0.001 |
| MoCA score | 24.6 ± 3.2 | 24.3 ± 3.3 | 24.7 ± 3.1 | -0.8 | 0.4 |
| Systolic blood pressure [mm Hg] | 133.7 ± 15.6 | 132.8 ± 17.1 | 134.3 ± 14.7 | -1.5 | 0.12 |
| Diastolic blood pressure [mm Hg] | 75.1 ± 7.5 | 74.6 ± 7.2 | 75.3 ± 7.6 | -0.5 | 0.6 |
| Fasting blood glucose [mmol/l]* | 132.5 ± 23.8 | 137 ± 25.6 | 130.1 ± 22.6 | 2.1 | 0.03 |
Abbreviations: T2DM – type 2 diabetes, BMI – body mass index, HbA1c - glycosylated hemoglobin, CHOL - total cholesterol, LDL - low density lipoprotein cholesterol HDL - high-density lipoprotein cholesterol, TG - triglycerides, GDS – Geriatric Depression Scale, MoCA - Montreal Cognitive Assessment Values are presented as mean ± standard deviations, Mann-Whitney U test (Z), or t test was used to test for significant differences, *significance p<0.05.
Table 3.
Quantitative relationship between serum levels of TNF-α (pg/mL), IL-1β (pg/mL), and IL-6 (pg/ml) on other selected parameters among elderly diabetic patients with depressive symptoms.
Table 3.
Quantitative relationship between serum levels of TNF-α (pg/mL), IL-1β (pg/mL), and IL-6 (pg/ml) on other selected parameters among elderly diabetic patients with depressive symptoms.
| Parameter | TNF-α (pg/mL) | IL-1β (pg/mL) | IL-6 (pg/ml) | |||
| r | p | r | p | r | p | |
| Duration of T2DM [years] | 0.25* | 0.03 | - | - | 0.44* | <0.001 |
| BMI [kg/m2] | 0.62* | <0.001 | 0.46* | <0.001 | 0.47* | <0.001 |
| HbA1c [%] | 0.8* | <0.001 | 0.66* | <0.001 | 0.49* | <0.001 |
| CHOL mmol/l) | - | - | - | - | - | - |
| LDL (mmol/l) | - | - | - | - | - | - |
| TG [mmol/L] | 0.27* | 0.02 | 0.42* | <0.001 | - | - |
| HDL [mmol/L] | -0.28* | 0.02 | -0.43 | <0.001 | - | - |
| Co-morbidity [n] | 0.51* | <0.001 | 0.43* | <0.001 | - | - |
| GDS score | 0.69* | <0.001 | 0.45* | <0.001 | 0.56* | <0.001 |
| Fasting blood glucose [mmol/l] | 0.5* | <0.001 | 0.38* | 0.001 | 0.28* | 0.02 |
| TNF-α (pg/mL) | - | - | 0.79* | <0.001 | 0.61* | <0.001 |
| IL-1β (pg/mL) | 0.79* | <0.001 | - | 0.47* | <0.001 | |
| IL-6 (pg/ml) | 0.61* | <0.001 | 0.47* | <0.001 | - | - |
*statistically significant difference, p<0.05; r-correlation coefficient Abbreviations: T2DM – type 2 diabetes, BMI – body mass index, HbA1c - glycosylated haemoglobin, CHOL - total cholesterol, LDL - low density lipoprotein cholesterol HDL - high-density lipoprotein cholesterol, TG - triglycerides, GDS – Geriatric Depression Scale,.
Table 4.
Univariate logistic regression analysis of risk factors for depressive symptoms in the oldest-old diabetic patients.
Table 4.
Univariate logistic regression analysis of risk factors for depressive symptoms in the oldest-old diabetic patients.
| Parameter | ß | SE of ß | p value | OR | 95% CI |
| Age [years]* | 0.2 | 0.63 | <0.001 | 1.24 | 1.09-1.39 |
| Education-years | -0.06 | 0.05 | 0.26 | 0.9 | 0.84-1.04 |
| Duration of T2DM (years)* | 0.15 | 0.02 | <0.001 | 1.16 | 1.1-1.2 |
| BMI [kg/m2]* | 0.38 | 0.05 | <0.001 | 1.46 | 1.3-1.6 |
| HbA1c (%)* | 1.9 | 0.26 | <0.001 | 6.9 | 4.1-11.7 |
| CHOL [mmol/L]* | 0.02 | 0.005 | <0.001 | 1.02 | 1.01-1.03 |
| LDL [mmol/L]* | 0.02 | 0.005 | <0.001 | 1.03 | 1.01-1.04 |
| TG [mmol/L]* | 0.01 | 0.005 | 0.005 | 1.01 | 1.004-1.03 |
| HDL [mmol/L]* | -0.044 | 0.018 | 0.01 | 0.96 | 0.92-0.99 |
| Co-morbidity [n]* | 0.46 | 0.07 | <0.001 | 1.6 | 1.4-1.8 |
| MoCA score | -0.04 | 0.05 | 0.38 | 0.9 | 0.8-1.1 |
| Systolic blood pressure [mm Hg] | -0.006 | 0.01 | 0.53 | 0.9 | 0.97-1.01 |
| Diastolic blood pressure [mm Hg] | -0.012 | 0.02 | 0.56 | 0.98 | 0.95-1.03 |
| Fasting blood glucose [mmol/l] | 0.01 | 0.006 | 0.052 | 1.03 | 1.0-1.025 |
| Sex, female* | 0.99 | 0.3 | 0.002 | 2.69 | 1.45-5.01 |
| Living alone* | 0.36 | 0.31 | <0.001 | 3.8 | 2.09-7.25 |
| Smoked tobacco regularly* | 0.73 | 0.32 | 0.02 | 2.1 | 1.1-3.9 |
| No physical activity* | 1.79 | 0.46 | <0.001 | 6.0 | 2.4-14.9 |
| Macrovascular complications CVD* |
1.46 | 0.36 | <0.001 | 4.32 | 2.1-8.8 |
| Stroke | 0.84 | 0.68 | 0.21 | 2.3 | 0.6-8.9 |
| Previous HA/ use of HA drugs * | 1.03 | 0.48 | 0.03 | 2.8 | 1.09-7.18 |
| Hyperlipidaemia* | 1.46 | 0.56 | 0.008 | 4.3 | 1.4-12.9 |
| Microvascular complications Retinopathy* |
1.69 | 0.38 | <0.001 | 5.36 | 2.5-11.4 |
| Nephropathy | 0.08 | 0.2 | 0.78 | 1.08 | 0.6-1.9 |
| Neuropathy* | 1.08 | 0.38 | 0.005 | 2.9 | 1.38-6.2 |
| MCI | 0.5 | 0.3 | 0.08 | 1.6 | 0.9-3.0 |
| Treatment OAD |
-0.45 | 0.57 | 0.42 | 0.6 | 0.2-1.9 |
| Insulin* | 0.83 | 0.3 | 0.006 | 2.29 | 1.2-4.18 |
| TNF-α (pg/mL)* | 0.32 | 0.04 | <0.001 | 1.38 | 1.2-1.5 |
| IL-1β (pg/mL)* | 0.25 | 0.04 | <0.001 | 1.28 | 1.17-1.39 |
| IL-6 (pg/ml)* | 0.99 | 0.17 | <0.001 | 2.69 | 1.8-3.8 |
*Statistically significant difference, p<0.05; ß: regression coefficient; CI: confidence interval for odds ratio; OR: odds ratio; SE: standard error; Abbreviations: T2DM – type 2 diabetes, MCI - mild cognitive impairment, BMI – body mass index, HbA1c - glycosylated haemoglobin, CHOL - total cholesterol, LDL - low density lipoprotein cholesterol HDL - high-density lipoprotein cholesterol, TG - triglycerides, GDS – Geriatric Depression Scale, MCI - mild cognitive impairment, CVD - cardiovascular disease, HA - hypertension, OAD - oral antidiabetic drugs,.
Disclaimer/Publisher’s Note: The statements, opinions and data contained in all publications are solely those of the individual author(s) and contributor(s) and not of MDPI and/or the editor(s). MDPI and/or the editor(s) disclaim responsibility for any injury to people or property resulting from any ideas, methods, instructions or products referred to in the content. |
© 2026 by the authors. Licensee MDPI, Basel, Switzerland. This article is an open access article distributed under the terms and conditions of the Creative Commons Attribution (CC BY) license (http://creativecommons.org/licenses/by/4.0/).
Copyright: This open access article is published under a Creative Commons CC BY 4.0 license, which permit the free download, distribution, and reuse, provided that the author and preprint are cited in any reuse.


