

Submitted:
07 July 2026
Posted:
08 July 2026
You are already at the latest version
Abstract
Understanding tourist behaviour requires analytical frameworks capable of capturing both symmetric relationships among motivational constructs and asymmetric causal effects on behavioural intentions. Conventional segmentation approaches, particularly those based on structural equation modelling, primarily estimate directional relationships and provide limited insight into the multivariate interaction structures underlying tourist decision-making. To address this limitation, this study proposes an integrated analytical framework that combines GH-Biplot, Co-Inertia Analysis (COIA), STATICO, and Neutrosophic Psychology to analyse tourist motivations under uncertainty. The proposed framework was applied to a sample of 400 tourists participating in poverty-reducing tourism research. Measurement models were validated using confirmatory factor analysis and Partial Least Squares Structural Equation Modelling (PLS-SEM), while the proposed multivariate approach was employed to identify latent symmetric and asymmetric structures linking behavioural intentions, motivational constructs, and personal values. Results show that biospheric values exhibit the strongest association with intentions to participate in poverty-reducing tourism. More importantly, the proposed framework reveals multivariate relationships and behavioural patterns that remain hidden when conventional asymmetric causal models are applied independently. The incorporation of neutrosophic psychology further extends the analysis by explicitly representing indeterminacy in tourist motivations through truth, falsity, and indeterminacy components. The study contributes by introducing a novel analytical framework that integrates complementary multivariate techniques to improve tourism segmentation, enhance the interpretation of complex behavioural relationships, and support evidence-based decision-making for sustainable tourism management under uncertainty.
Keywords:
multivariate analysis
; tourism segmentation
; sustainable tourism
; neutrosophic psychology
1. Introduction
Tourism has evolved from a purely economic activity into a multidimensional phenomenon that requires balancing economic development, environmental conservation, and social well-being. Consequently, tourism managers increasingly require analytical tools capable of identifying visitor profiles that support sustainable destination management and facilitate evidence-based decision-making [1]. Rather than maximizing tourist flows, contemporary tourism policies emphasize attracting visitors whose motivations, values, and behavioural intentions are consistent with sustainability principles.
Tourist segmentation has therefore become one of the principal analytical strategies for understanding heterogeneous behavioural patterns and designing differentiated management policies [2]. Traditional segmentation approaches generally rely on latent variable models, clustering techniques, or Structural Equation Modelling (SEM) to explain the relationships among psychological constructs and behavioural intentions [5,6]. Although these approaches provide statistically robust estimates of causal effects, they often behave as "black boxes," making it difficult to interpret the underlying multivariate structures that generate those relationships. Consequently, researchers frequently obtain significant statistical models without fully understanding how questionnaire items, latent constructs, and respondent profiles interact simultaneously [3].
This limitation becomes particularly relevant when analysing complex behavioural phenomena such as sustainable tourism. Tourist decisions are rarely determined by linear causal relationships alone; instead, they emerge from the interaction of multiple motivational dimensions, personal values, subjective norms, and contextual factors. These interactions frequently include reciprocal associations, latent covariance structures, and uncertain psychological states that are not explicitly represented in conventional asymmetric modelling approaches [4].
To address these challenges, multivariate graphical methods provide an attractive alternative because they allow researchers to explore the internal structure of complex datasets before estimating causal models. GH-Biplot facilitates the simultaneous representation of observations and variables, revealing latent relationships among questionnaire items and constructs [5]. Likewise, Co-Inertia Analysis (COIA) enables the identification of common multivariate structures shared by different groups of variables by maximizing their covariance without imposing directional assumptions [17,18,19,20]. When multiple related datasets must be analysed simultaneously, the STATICO method extends this analysis by identifying consensus structures and variability across different conditions through Partial Triadic Analysis [21,22,23,24,25,26]. Together, these complementary techniques provide considerably richer information than traditional exploratory procedures based solely on dimensionality reduction.
Despite these methodological advances, an important gap remains in tourism research. Existing studies generally apply these multivariate techniques independently or use them exclusively for exploratory visualization, while behavioural relationships are subsequently analysed through asymmetric causal models such as PLS-SEM. Consequently, little attention has been paid to integrating symmetric multivariate structures with asymmetric causal modelling into a unified analytical framework capable of improving both the interpretation of tourist behaviour and the segmentation process itself [6].
An additional challenge concerns the representation of uncertainty in tourist decision-making. Individual attitudes and values are not always expressed as completely positive or negative positions; instead, they frequently involve ambiguity, hesitation, and partial commitment. Conventional statistical models generally represent these responses through deterministic measurements, overlooking the indeterminate component that characterizes many psychological processes. Neutrosophic Psychology provides an alternative theoretical perspective by representing attitudes through simultaneous degrees of truth, falsity, and indeterminacy, thereby offering a more realistic interpretation of behavioural uncertainty in tourism contexts [7].
Within this context, the present study proposes an integrated multivariate analytical framework that combines GH-Biplot, Co-Inertia Analysis, STATICO, and Neutrosophic Psychology to investigate tourist segmentation under uncertainty. Unlike conventional approaches, the proposed methodology explicitly distinguishes between symmetric multivariate relationships, represented through covariance-based exploratory techniques, and asymmetric behavioural relationships, represented through structural equation modelling. This complementary perspective enables a more comprehensive interpretation of the interactions among motivational constructs, personal values, and behavioural intentions [8].
The proposed framework is illustrated through the analysis of tourists' intentions to participate in poverty-reducing tourism using a sample of 400 respondents. The multivariate results are subsequently contrasted with Partial Least Squares Structural Equation Modelling (PLS-SEM), allowing the strengths and complementary nature of both analytical perspectives to be evaluated [9].
The main contributions of this study are fourfold. First, it introduces an integrated analytical framework that combines complementary multivariate techniques rarely used together in tourism segmentation research. Second, it demonstrates how distinguishing symmetric and asymmetric structures provides a deeper understanding of tourist behaviour than conventional causal modelling alone. Third, it incorporates Neutrosophic Psychology as an interpretative layer for explicitly modelling uncertainty and indeterminacy in tourist motivations. Finally, it provides a practical decision-support methodology that enhances tourist segmentation, facilitates the interpretation of complex behavioural relationships, and supports sustainable tourism planning through evidence-based analysis.
2. Materials and Methods
2.1. Research Design
This study adopts a quantitative, explanatory, and cross-sectional research design to investigate the complex relationships among tourists' motivations, personal values, and behavioural intentions toward poverty-reducing tourism. The research follows a non-experimental approach because all variables were observed without manipulation.
Unlike conventional tourism segmentation studies that rely primarily on Structural Equation Modelling (SEM), this research proposes an integrated multivariate analytical framework that combines exploratory multivariate techniques with confirmatory modelling. The rationale behind this framework is that tourist behaviour simultaneously contains symmetric relationships, represented by covariance structures among variables, and asymmetric relationships, represented by directional causal effects between latent constructs.
Consequently, the methodological strategy was designed to analyse these complementary dimensions sequentially, allowing hidden multivariate structures to be identified before estimating structural relationships. This approach improves both the interpretation of behavioural patterns and the robustness of subsequent confirmatory analyses.
2.2. Population and Sample
The data used in this study correspond to a sample of 400 tourists, collected through a structured survey conducted by a Spanish market research company. The survey employed a questionnaire based on the Theory of Planned Behavior (TPB) proposed by [10], specifically adapted to poverty alleviation tourism (PPT). This theoretical framework comprises three key dimensions: attitude towards the behavior [11], subjective norms [12] and perceived behavioral control. Items corresponding to these constructs were assessed using a five-point Likert scale, where 1 represents total disagreement and 5 represents total agreement. These dimensions were hypothesized as explanatory variables. Additionally, tourists were surveyed regarding several items describing their intention to participate in PPT, which was hypothesized as the dependent variable.
Furthermore, since the TPB has been integrated with the Value-Belief-Norm (VBN) Model [13], additional items were included to assess tourists’ orientation towards egoistic, altruistic and biospheric values. Items from this construct were also assessed using a five-point Likert scale, where 1 represents total opposition to the value and 5 indicates full identification with it. These dimensions were hypothesized to be moderating variables within the possible relationships between the constructs described previously.
2.4. Measurement Instrument
The survey consisted of thirty observed variables representing the latent constructs included in the conceptual model. A 30-item questionnaire was administered using a five-point Likert scale (1-5) to assess latent constructs, including attitudes, subjective norms, perceived behavioral control, intention to participate in PPT, and value orientation.
Prior to the multivariate analysis, the psychometric quality of the measurement instrument was evaluated through standard reliability and validity procedures commonly recommended for behavioural research.
The following indicators were assessed:
Cronbach's Alpha
Dillon–Goldstein's rho
Composite Reliability
Average Variance Extracted (AVE)
Fornell–Larcker Criterion
Heterotrait–Monotrait Ratio (HTMT)
Standardized Root Mean Square Residual (SRMR)
Only constructs satisfying the accepted thresholds reported in the literature were retained for the subsequent analyses.
This preliminary validation ensured that the proposed multivariate framework operated on statistically reliable latent constructs.
3. Proposed Methodology
The principal methodological contribution of this study is the development of an integrated analytical framework capable of combining complementary multivariate techniques to analyse tourist segmentation from three analytical perspectives:
- the internal structure of each construct,
- the multivariate relationships between constructs,
- the uncertainty underlying tourist motivations.
Instead of analysing these dimensions independently, the proposed framework integrates them into a sequential analytical process in which the output of one technique constitutes the input of the next stage. This sequential integration allows researchers to move from exploratory visualization to confirmatory modelling while preserving the multivariate information contained in the original data.
The methodological framework explicitly considers potential symmetry and asymmetry in the relationships among motivational constructs, values, and behavioral intentions. The methodology proposed in this study begins with the use of the GH biplot, one of the biplot methods used as a graphical representation of multivariate data [14]. It is based on a rank two approximation of the original data matrix [15]. The application of this technique provides an initial understanding of the structure of the relationships between variables and between observations, prioritizing the variables.
According to [14], the elements of any matrix of dimensions n×p, where n represents the observations and p the variables, result from the inner product of the vectors representing the rows and columns. Therefore, following the same concept proposed by Gabriel [14], any matrix can be factored into two matrices of equal rank r, representing the rows and columns (), respectively, of the original matrix, such that the dot product between these matrices reconstructs the original matrix. That is, let , and be three matrices of rank r, with dimensions , and , respectively; and let the transpose of the matrix be , then:
that is, the factorization can be expressed in terms of the elements of the matrix for each ith row and jth column as
where corresponds to the ith row of and is the rank r vector assigned to the ith row of ; while corresponds to the jth row of, and is the rank r vector assigned to the jth column of. That is, the vectors g₁…, gₙ and h₁, …, hₚ are of rank r and hence equation (2) represents the original matrix via n + p vectors in an r- dimensional space.
In this sense, the elements of G are considered the "row effects" of , while those of are the "column effects". Here, "effect" refers to the idea that, depending on the value of r, the ith row of and the jth row of are each multiplied by a scalar or vector of rank r [14]. Thus, by plotting the vectors n + p on a plane, a biplot is obtained, which simultaneously shows the row and column effects on the same graph, providing a visual representation of the structure of the original matrix .
According to [14], the relationship between vectors can be interpreted by the inner product, defined as the length of a vector multiplied by the length of the projection of another vector onto the first. In this way, it is possible to determine whether two row or column vectors are proportional or independent (i.e., they form an angle of 0°).
Of course, the factorization proposed in (1) is not unique; therefore, the corresponding bigeometry is not unique either [15]. Thus, if the matrix is decomposed by singular value decomposition:
where is an orthonormal matrix containing the eigenvectors of , is a diagonal matrix containing the eigenvalues of , and is an orthogonal matrix whose columns are the eigenvectors of . If we consider the first r columns of, then it can be represented in r dimensional space as in (1), where and [15] This can be interpreted, as mentioned above, as a projection of the column vectors onto the first eigenvectors or principal components r. Moreover, in this case, the vectors h retain the same configuration as the columns of , and , indicating that the vectors g represent the row configuration of X in a standard way; that is, the row configuration remains unchanged even when rotating the orthogonal axes [15].
In this sense, this type of biplot, unlike others in the same family, is characterized by a better representation of the columns of the original matrix and their interrelations [16]. This is because, by seeking the uniqueness of the factorization and representing the relationships of the g vectors, it is possible to assume that , which results in [14]. Hence, for two rows of , , the projections of the vectors g (i.e., the lengths of the projection vectors) are proportional to the variances of the columns of ; and the correlations between each pair of columns are equivalent to the cosine of the angle between the projected columns (i.e., the angle between the projected vectors) [14] . Further details are shown in Figure 1.
Once the information has been obtained using GH-Biplot, a co-inertia analysis (COIA) is performed. This is a multivariate statistical technique developed by [17] and [18], within the category of cross-tabulation methods. It is based on the Euclidean model and is used to study the common structure or agreement between two data sets. In our case, the analysis focuses on the observational and variable dimensions within each of the two groups of variables under study; temporal and spatial dimensions are not considered.
Let and be two data sets with the same n observations (rows), with p variables (columns) in and q variables (columns) in , both centered around a reference vector and , respectively. That is, and , where and are the original data matrices; and are the reference vectors of and , respectively. Various types of centering or reference points can be used; however, it should be understood that a reference point is a hypothetical observation, such as the vector of means for each data set or a zero vector [19]. The objective of centering is to extract information about the deviation of the data from this reference point. In this way, each observation can be represented as a point in a p-dimensional hyperspace () or q dimensional (), respectively, where each axis corresponds to one of the variables in or .
We also define a diagonal matrix of row weights, whose elements can vary depending on the sample's ability to represent the population [19]. These weights allow the methodology to control bias [20], which in turn affects the total inertia. Next, let and be the metrics of the hyperspaces formed by the variables (columns) of and, respectively. Then, co-inertia analysis is defined based on the triplet to obtain the maximum co-inertia vectors, u₁ and v₁, of the spaces and, respectively [19]. In other words, co-inertia analysis searches for an axis in each data set that maximizes the covariance between the projections of each data set onto its respective axis. Maximum covariance is understood as the simultaneous maximization of the correlation and the standard deviation between the two data sets, thus extracting as much information as possible about their relationships and variability [18]. Further details are provided in Figure 2. Therefore, co-inertia is a global measure of the co-structure between two data sets, which can be interpreted in a similar way to bivariate correlation coefficients: it has a high value when the two structures vary simultaneously or inversely, and a low value when they vary independently or not at all [19]. This measure is defined as:
If and are centered, i.e., and , then co-inertia analysis maximizes the squared covariance between the projection of each data set onto its respective maximum co-inertia vector, i.e., onto and onto [19].
For the second pair of maximum co-inertia vectors, and , from the spaces of and , respectively, the maximization process is the same; however, these vectors are subject to orthogonality constraints with respect to the first vectors [19]. The purpose of the orthogonality constraint is to ensure independence between the orthogonal vectors, which in turn ensures that these vectors provide additional information to that offered by the first pair, thus maximizing the amount of information extracted by the proposed methodology.
To obtain co-inertia axes it is necessary to diagonalize the matrix W [18], which is defined as:
COIA has been widely applied in various fields, primarily in the life sciences. Furthermore, several adaptations of this technique have been developed to extend its applicability to a larger number of data sets with specific characteristics [20].
STATICO method is applied, which is a generalization of the three-way methods and belongs to the family of multi-block methods. STATICO seeks to analyze the relationships between two series of k data tables or data cubes [21]. This method requires that the number of rows in each pair of tables be the same, although this condition does not apply between different tables in the rest of the series. However, the number of columns must be the same within each data cube, although it may vary between cubes [22]. That is, let and be two data cubes, each composed of k data tables, where and , it holds that . This feature allows for data sets with different sample sizes at each kth time point, i.e., under each condition of a hypothetical moderating factor. This versatility allows for the analysis of the third dimension not considered in co-inertia analysis (COIA), which provides highly relevant complementary information for our analysis.
The underlying procedure of the method consists of performing a co-inertia analysis on each pair of matched tables, resulting in a series of k maximum covariance tables. The co-inertia analysis process has been detailed in the previous section and in [18]. Thus, a sequence of cross-tabs is obtained, where the observation dimension is removed. Consequently, the sequence of cross-tabs has dimensions defined by the number of columns of the original data cubes (), on which a Partial Triadic Analysis (PTA) is finally performed [23]. belongs to the STATIS family of methods, since it performs three-way dataset analysis, or its equivalent, two-way data table sequences, based on variance, covariance, and correlation vectors, provided that all tables in the sequence share the same number of rows and columns [24], which is achieved through the co-inertia step, by removing the heterogeneous row dimension.
Like other methods in its family, PTA has the general objective of summarizing the multivariate structure present in the k tables. It follows three main stages: interstructure, which identifies the importance and relationships between tables; commitment, which captures the common structure of all tables; and trajectories, which summarizes the variability of the sequence of tables projected onto the common structure obtained in the previous step [24].
Let be the element located at the r-th row and s-th column of the k-th table in the cube , where and be a statistical triplet consisting of the k-th table in the cube Z and two positive definite diagonal matrices representing the weights of the variables in and, respectively, whose positive diagonal elements sum to 1.
The first step in PTA is to obtain a matrix of dot products between the tables in , i.e.,
From this matrix, a singular value decomposition is performed, where the coefficients of the first eigenvectors of the decomposition are used as weights for the tables of the commitment matrix [25]. Alternatively, the covariance matrix can be replaced by a vector correlation matrix ().
Based on this result, a Principal Component Analysis (PCA) is performed, in which each table is projected onto a reduced-dimensional plane and represented as a vector to define the order, structure, and relationships between the different data tables [25]. This stage is known as interstructure.
To construct the trade-off matrix, it is important to understand that it essentially consists of the "weighted average" matrix of the series of tables. This matrix captures the maximum inertia and optimally summarizes the similarities between the tables in the series, using the coefficients as weights [24], i.e.,
As a result, the compromise matrix retains the same structure as any of the individual tables in the series [23], allowing for a consensual interpretation for both the variables in and those in . This result is one of the most relevant aspects of the proposed methodology, since the compromise matrix contains the maximum amount of information about the relationships between the variables in both data cubes, aggregated across all data matrices. The compromise matrix is then represented using PCA, once again.
The third step is trajectories, where the rows and columns of the original tables are projected onto the commitment matrix, providing insight into the variability of individual tables relative to the consensus table [21]. This projection is performed using the eigenvectors derived from the analysis of the commitment matrix. Therefore, following the notation of [24], if we denote this matrix as , the row coordinates of are calculated as:
Meanwhile, the coordinates for projecting the columns of are defined as:
where It is a diagonal matrix containing the inverse square roots of the eigenvalues obtained from the compromise analysis [21]. Both the projected rows and columns are represented as points on the consensus plane for each table in the series. Figure 3 illustrates the flow of the procedure described above.
Owing to its origins, this technique has been applied mainly in ecology and only rarely in other domains [26].
3.1. Comparative Analysis with the Standard Method
To evaluate the advantages of our proposed approach, a comparative analysis was conducted using Structural Equation Modeling (SEM). This analysis allowed us to strengthen the segmentation of tourists into the studied tourist typology, comparing the results obtained with our multivariate approach with those of the standard method.
Table 1. Comparison between the conventional PLS-SEM approach and the proposed integrated analytical framework. The proposed methodology extends structural modelling by incorporating complementary multivariate techniques capable of identifying symmetric relationships, hidden covariance structures, and behavioural uncertainty.
The comparison focuses on the analytical capabilities of each approach rather than their statistical performance. Table 1 summarizes the principal analytical differences between the conventional PLS-SEM approach and the proposed framework. Rather than replacing structural equation modelling, the proposed methodology complements it by incorporating exploratory multivariate techniques capable of identifying latent covariance structures, reciprocal associations, and behavioural uncertainty prior to confirmatory modelling. This integration provides a richer analytical basis for tourist segmentation and decision-making.
3.2. Software Used
The analysis was performed using R (FactoMineR and plspm packages) and SmartPLS 4 for structural modeling.
3.3. Neutrosophic Psychology to Assess Tourist Motivations
All significant findings regarding tourist intentions are contextualized through the application of neutrosophic psychology, which enables a more comprehensive assessment of tourist motivations. This methodological approach offers a holistic framework for analyzing uncertainty, acknowledging that tourists may present varying levels of strength in their attitudes and values. By doing so, it contributes to a deeper understanding of nuanced decision-making under uncertain conditions and highlights potential gaps and future opportunities for segmentation in tourism research.
Building on this framework, the assessment of tourist motivations is modeled as a multi-attribute decision-making problem using single-valued neutrosophic information.
In a multi-attribute decision-making problem with single-valued neutrosophic information, each alternative (i=1, 2, …, ) is assessed in relation to a set of attributes (j=1, 2, …, ). The evaluation of on attribute is expressed through a single-valued neutrosophic value (SVNV) where , and frepresent the degrees of truth-membership, indeterminacy, and falsity, respectively. Collectively, these evaluations form the decision matrix .
All these values together form the decision matrix .
The evaluation of alternative on attribute is given by a neutrosophic value:
where:
- represents the degree of truth,
- the degree of indeterminacy, and
- the degree of falsity.
To identify the best alternative, the concept of an ideal point is introduced. Although it does not exist in practice, it provides a useful benchmark. In this framework, the ideal neutrosophic value for each attribute is defined as corresponding to the theoretical alternative with full truth, no indeterminacy and no falsity across all criteria.
The degree of closeness between any real alternative and the ideal alternative is measured by the weighted trade-off coefficient, which balances the differences across all attributes according to their importance (weights ):
where , and denote the deviations of from the ideal alternative on each dimension.
The scaling factors , , , normalize these deviations by accounting for their minimum and maximum values across all attributes, ensuring comparability.
These scaling factors adjust the deviations by their minimum and maximum values across all attributes, so that differences are measured on the same scale and can be compared fairly.
Finally, by computing for all i=1, …, the alternatives can be ranked. The larger the coefficient, the closer the alternative is to the ideal solution, and the one with the highest value is identified as the best choice.
3.4. Symmetry and Asymmetry in the Analytical Framework
The framework separates two complementary ways in which the constructs can be related, and the distinction is one of symmetry. Co-Inertia Analysis couples the value table and the behavioural table symmetrically: it maximizes the squared covariance between their projections without designating either table as predictor or response, so exchanging the roles of the two tables leaves the solution unchanged. The operator is built from the symmetric cross-covariance structure, and the matrix W that is diagonalized to obtain the co-inertia axes is symmetric, so its eigenstructure is real and its axes orthogonal; the GH-Biplot that precedes COIA rests on the same symmetric cross-product matrix of the singular value decomposition. This symmetric coupling measures association in the way a correlation does, treating both sides on an equal footing.
The standard PLS-SEM model used for comparison imposes the opposite, asymmetric structure. It fixes a direction from the predictor constructs to the intention construct, so the relation is not invariant under an exchange of the variables, and the path coefficients are inherently directional. Reading the two analyses together therefore separates the symmetric co-structure that links motivations and values from the asymmetric, directional effect on intention. The neutrosophic layer adds a third, deliberate departure from symmetry: by representing each attitude with a truth, indeterminacy and falsity degree, it breaks the symmetric true and false dichotomy of classical logic and lets the analysis carry the asymmetry between what tourists affirm, deny and leave undetermined.
4. Results
4.1. Analysis of the Proposed Methodology
The proposed analytical framework was evaluated to determine its ability to reveal multivariate structures that complement conventional behavioural modelling in tourism segmentation. Rather than replacing established approaches such as Partial Least Squares Structural Equation Modelling (PLS-SEM), the framework incorporates an exploratory multivariate stage that enables the identification of latent relationships before causal modelling is performed.
Figure 4 presents the conceptual architecture of the proposed framework. The analysis begins with a hypothetical model describing the expected relationships among behavioural constructs. GH-Biplot is first employed to examine the internal structure of the constructs and identify latent associations among questionnaire items. Subsequently, Co-Inertia Analysis (COIA) investigates the common multivariate structure shared by explanatory and response variables, while STATICO extends this analysis by evaluating the stability of these relationships across different value orientations. Finally, the multivariate findings are contrasted with PLS-SEM to validate the directional relationships, and the overall results are interpreted through a neutrosophic perspective that explicitly incorporates behavioural uncertainty.
This sequential organization allows each analytical stage to contribute complementary information. Instead of analysing tourist behaviour exclusively through asymmetric causal relationships, the framework integrates symmetric covariance structures, multivariate exploratory analysis, and confirmatory modelling into a unified methodological strategy for tourism segmentation.
Figure 5 operationalizes the conceptual framework presented in Figure 4 by illustrating the analytical workflow followed in this study. While Figure 4 defines the logical sequence of the proposed methodology, Figure 5 details how each multivariate technique contributes to the progressive extraction of information from the original data. The framework begins with the formulation of a behavioural hypothesis and sequentially applies GH-Biplot, COIA, STATICO, and PLS-SEM, allowing exploratory, confirmatory, and uncertainty-based analyses to be integrated into a single decision-support process.
4.2. Application of the Methodology to the Proposed Framework
4.2.1. GH-Biplot Analysis
GH-Biplot constitutes the exploratory stage of the proposed framework. Its objective is not only to visualize the latent structure of each construct but also to identify potential redundancies, correlations, and multidimensional relationships among questionnaire items before confirmatory modelling is undertaken. Figure 6 illustrates the multivariate configuration obtained for each construct. Panel A illustrates the multivariate configuration of the constructs associated with attitudes, subjective norms, and personal norms toward poverty-reducing tourism. The graphical distribution confirms that the questionnaire items are organized into coherent latent dimensions, providing empirical support for the theoretical structure assumed before confirmatory modelling.
For the construct "Intent to Participate in PPT" (Panel B), with 81.7% of the total variance explained, the graph suggests the presence of two factors separating items related to financial participation from those involving other activities in the implementation of PPT. However, the axis reflecting this separation (Dim 2) explains less than 10% of the total variance.
Furthermore, the GH biplot for the Values Orientation construct (Panel C), which accounts for 64.4% of the total variance, shows that the items hypothesized to reflect egocentric values orientation (orange) are highly correlated with each other and distinguishable from the others, suggesting the formation of a distinct factor. In contrast, the items hypothesized to represent altruistic orientation (purple) are primarily correlated with several items related to biospheric values orientation (green), making it difficult to distinguish between these two factors. Furthermore, the plot indicates a possible independence between the hypothesized egocentric values orientation factor and the other two.
These results can help researchers refine the construct structure by eliminating elements in the search for the first-order confirmatory model that best fits the sample under study.
4.2.2. Co-Inertia Analysis
The second stage of the proposed framework applies Co-Inertia Analysis to investigate the common multivariate structure shared by the behavioural constructs and tourists' value orientations. Unlike directional structural models, COIA treats both datasets symmetrically, allowing reciprocal associations to emerge without imposing causal assumptions.
Meanwhile, altruistic (W2. Altruistic) and egoistic (W1. Egoistic) value orientations are related to subjective norms, personal standards, and attitude toward PPT, but are not clearly differentiated in terms of which specific value orientation drives respondents' planned behavior.
Figure 7.
Co-inertia analysis between the dimensions of value orientation (Panel A) and those of the theory of planned behavior (Panel B). The estimated correlation coefficient between both groups of variables was 0.227, statistically different from zero (p-value = 0.01).
Figure 7.
Co-inertia analysis between the dimensions of value orientation (Panel A) and those of the theory of planned behavior (Panel B). The estimated correlation coefficient between both groups of variables was 0.227, statistically different from zero (p-value = 0.01).
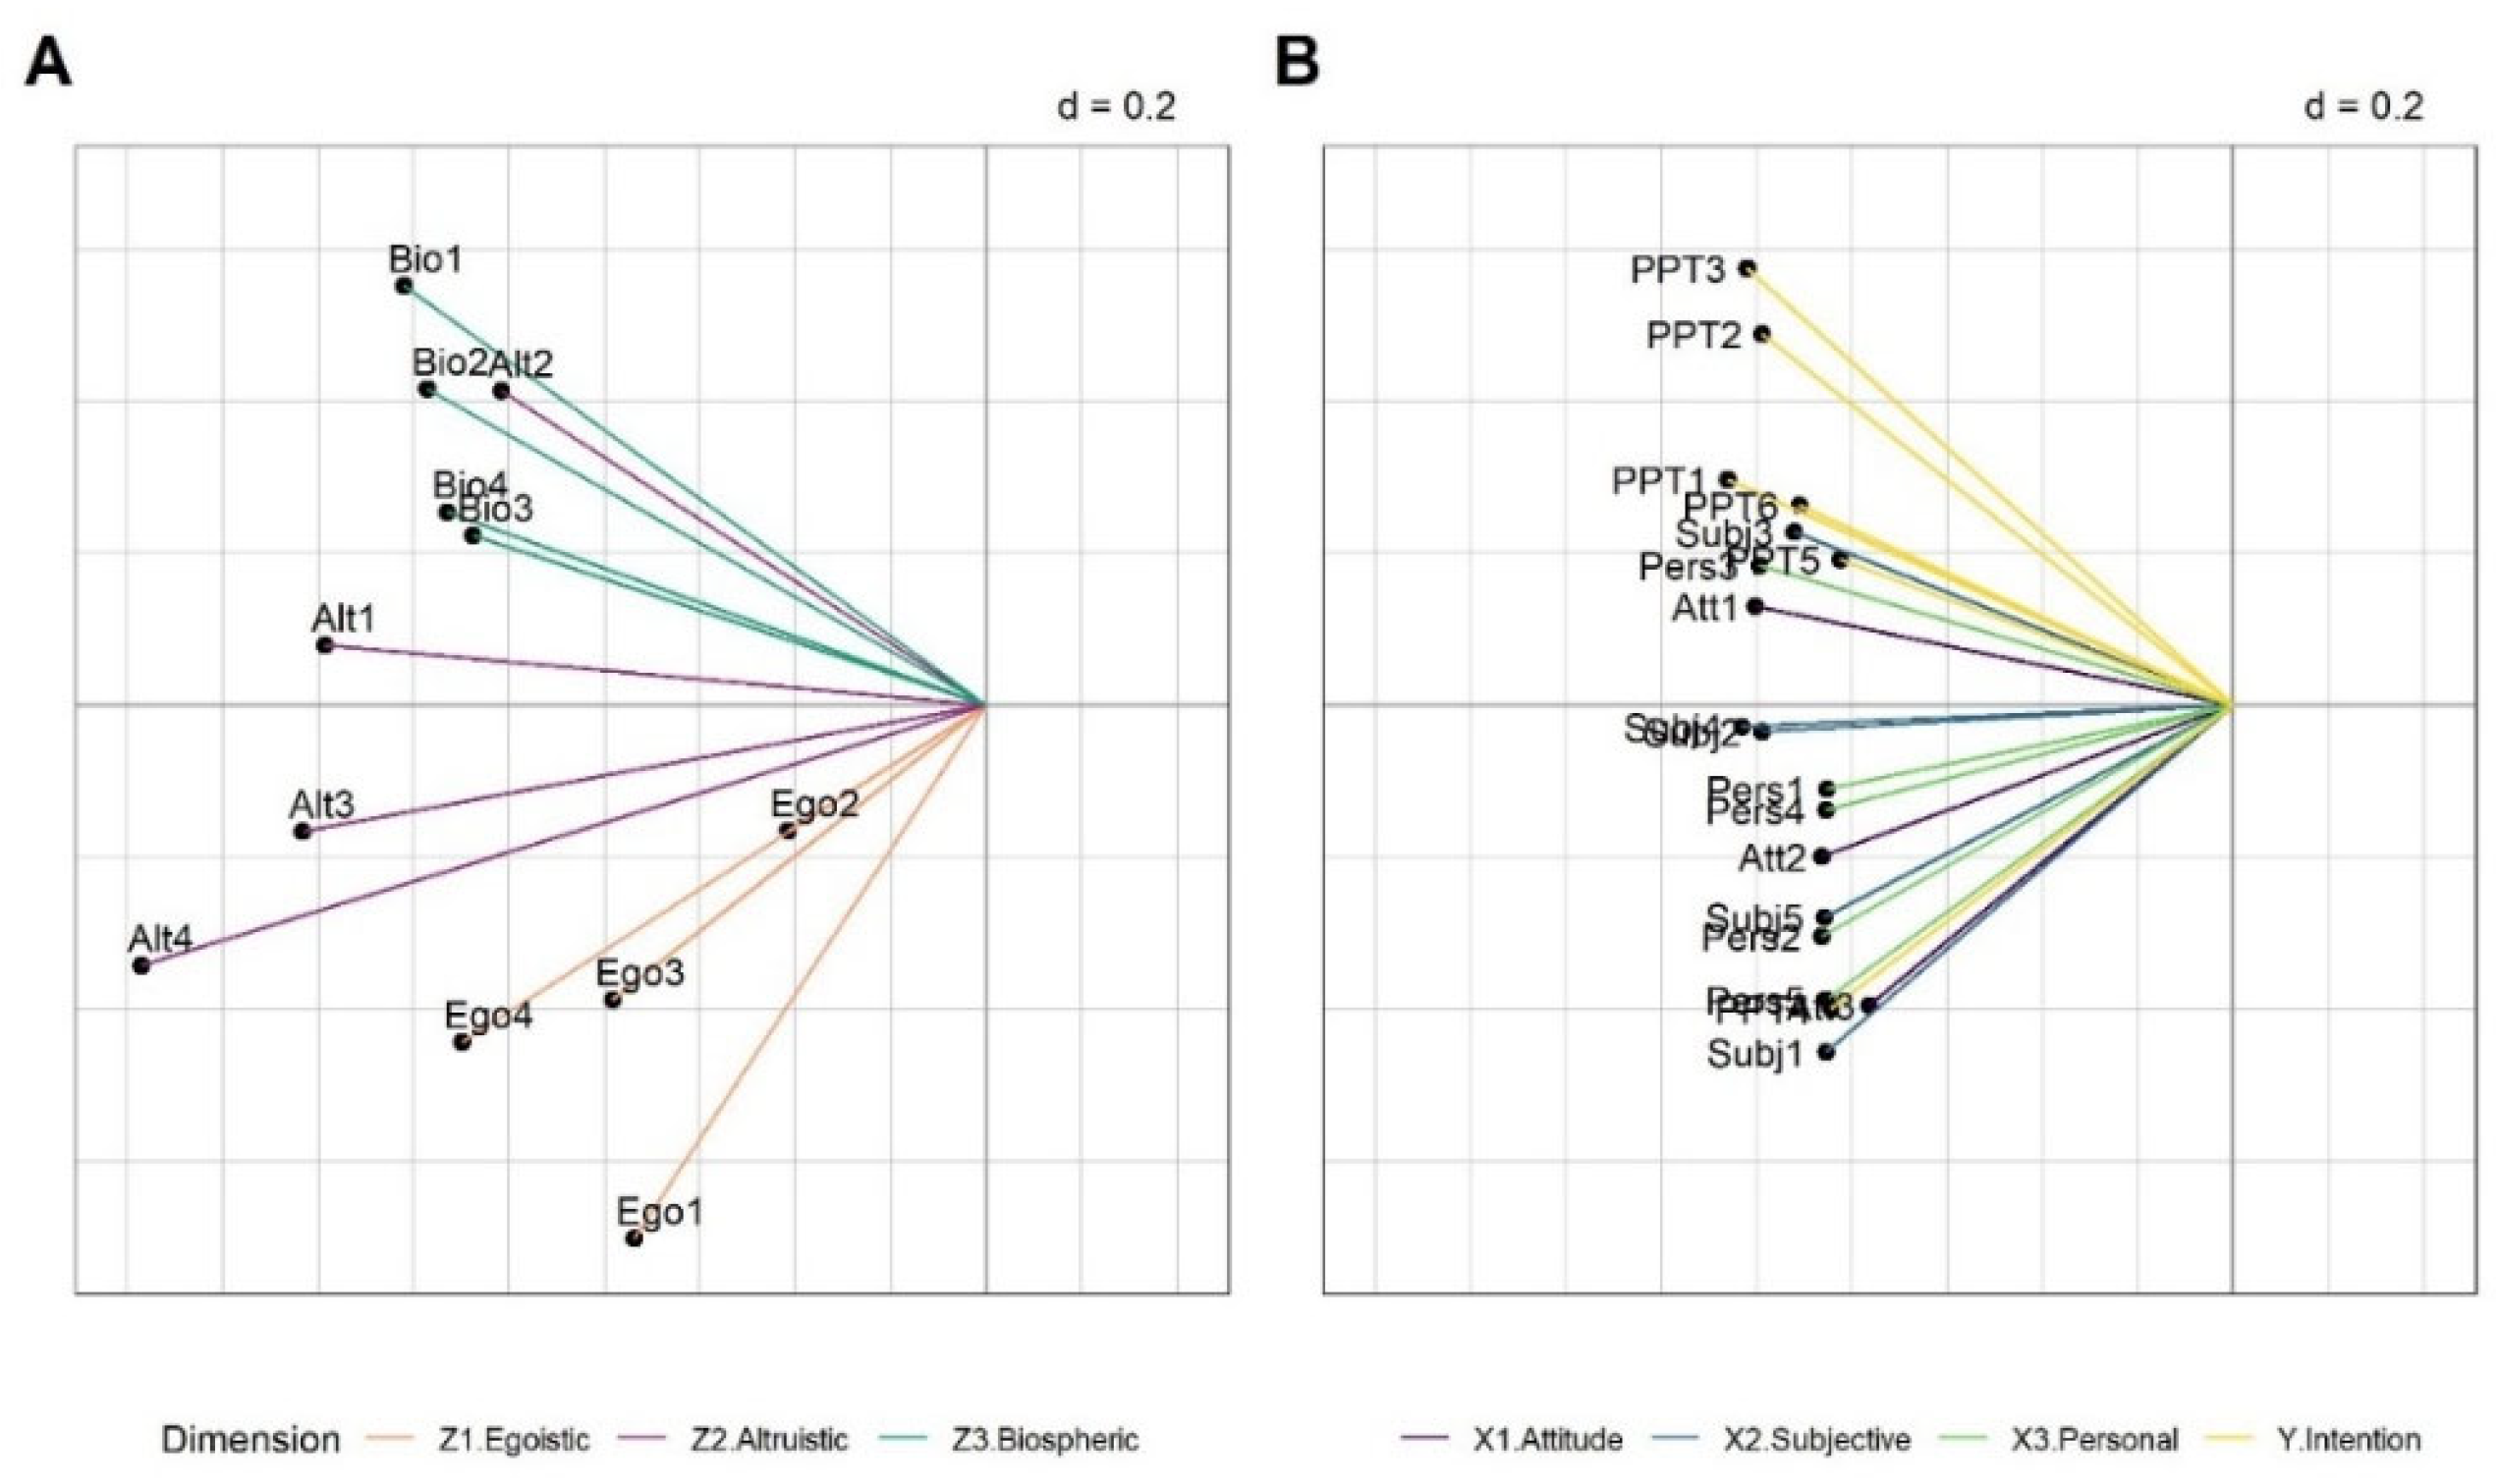
This analysis allows researchers to discern which first-order elements or factors might drive the potential relationship between explanatory and response constructs at a higher hierarchical level.
To proceed with the next statistical technique, k-means clustering was performed on each factor of the value orientation construct, and the centroids of each group were obtained. It was observed that the high-orientation groups obtained an average score of four out of five. Therefore, these groups represented respondents with a high orientation toward egoistic, biospheric, and altruistic values, respectively. According to the centroid values summarized in Table 2, the values with the highest mean scores in the sample were: equality, a peaceful world, pollution prevention, respect for the Earth, and environmental protection, that is, mainly values related to biospheric orientation.
Furthermore, Table 2 shows that a higher percentage of individuals were classified into the high biospheric values orientation group (60.8%) and the high altruistic orientation group (52.0%), while less than 30% of respondents reported a high egoistic values orientation.
It should be noted that the sample size for the moderator variable categories is not the same, which makes this analytical flow flexible.
These findings illustrate one of the principal methodological advantages of the proposed framework. COIA reveals multivariate associations that complement the directional effects estimated through structural equation modelling, thereby providing a more comprehensive understanding of tourist segmentation.
4.2.3. STATICO Analysis
The third stage of the framework evaluates whether the multivariate relationships identified previously remain stable across different value orientations. STATICO summarizes these relationships through a consensus structure while simultaneously identifying the variability associated with each behavioural profile.
Figure 8 summarizes the consensus structure obtained after integrating the three value orientations through the STATICO methodology. The figure presents the interstructure, compromise, and contribution analyses, illustrating how the common multivariate relationships remain stable across the different behavioural profiles.
Then, in the construction of consensus (commitment), the value orientation with the greatest weight and contribution in the construction of the commitment matrix were altruistic values, although all types of values showed similar weights and contributions (Panel D).
The consensus among value orientations produced a vertical configuration for both the construct "norms and attitudes toward PPT" (Panel B) and the construct "intention to participate in PPT" (Panel C), although the horizontal axis still explains most of the total variability. This indicates that the commitment matrix explains the consensus relationships between the explanatory and response variables across value types.
As seen in Panel B of Figure 8, several items related to personal norms are located on the negative side of the Y-axis, while those associated with subjective norms are located on the positive side. On the other hand, attitudes toward PPT are located around zero, indicating that this factor contributes some variability to the analysis.
In Panel C, the items most closely related to intentions to financially participate in PPT are located in the negative region of the vertical axis; for example, "I would be willing to financially support projects and activities aimed at reducing poverty in the destinations I visit." "I would be willing to pay more for tourism activities if I knew the additional cost would have a positive impact on poverty reduction." On the other hand, intentions related to active participation, not directly linked to financial aspects, are located in the positive region of the vertical axis; for example, "I would be willing to participate in activities that help reduce the lack of opportunities for some groups in the destination I visit." "I would be willing to spend more on activities aimed at reducing poverty than on regular tourism activities." Finally, items related to short-term or near-future intentions to participate in PPT are located around the center; for example, "I would be willing to visit a destination to participate in activities aimed at reducing poverty and improving local well-being." "I would be willing to participate in tourism activities aimed at reducing poverty on my next trip." See Panel C for more information.
When analyzing the results of the relevant data sets simultaneously within the consensus matrix, Figure 9 shows that the intention to financially participate in PPT is associated with certain elements of the personal norm that reflect a deep internal obligation. For example:
- “People like me should do everything possible to participate in tourism that helps reduce poverty in the destinations they visit,” and
- “I feel morally obligated to participate in activities that promote poverty reduction in the destinations I visit, regardless of what others do.”
Meanwhile, active participation in PPT, not directly related to financial contributions, is more closely associated with subjective norms based on close friends and acquaintances, for example:
- “My friends would appreciate it if I participated in poverty-reducing activities when I travel.”
In turn, short-term intentions to participate in PPT are more closely aligned with attitudinal elements toward PPT, particularly those that refer to a perceived obligation to participate in this type of tourism.
Figure 10 presents the trajectory analysis obtained from the STATICO framework, illustrating how the relationships between behavioural constructs evolve according to each dominant value orientation. Unlike the consensus representation shown previously, these trajectories reveal the specific multivariate configurations associated with egoistic, altruistic, and biospheric tourist profiles.
Analyzing the interstructure of the tables representing a stronger orientation toward each type of value, along with the relevant data sets, Figure 10 shows that, among respondents with a strong egocentric orientation toward values, the most prominent intentions to engage in PPT were non-financial activities. Furthermore, with less variability, financial participation in PPT was primarily associated with the personal norm related to self-enhancement, for example:
- “I would be a better person if, as a tourist, I participated in activities aimed at reducing poverty in the destinations I visit,” accompanied by an attitude of social responsibility toward the PPT, for example:
- “As a socially responsible tourist, I feel obliged to participate in activities that reduce poverty in the most disadvantaged destinations I visit.”
Other intentions to participate in PPT among respondents with egocentric orientation did not show a clear relationship with norms or attitudes toward PPT.
For individuals oriented toward altruistic values, the relationship between norms and attitudes toward PPT and the intention to participate was not clearly defined, as all elements appeared to be highly correlated. In fact, the variables showed little variability compared to other types of values, suggesting a more moderate or average stance toward planned behavior among these individuals. The main intentions that stood out were those related to nonfinancial participation, both active and short-term, such as:
- “I would be willing to participate in activities that help reduce the lack of opportunities for certain groups in the destination I am visiting,”
- “I would be willing to visit a destination to participate in activities aimed at reducing poverty and improving the well-being of its residents.”
For individuals with a biospheric values orientation, the most prominent intentions were those related to financial participation in PPT, along with a slight association with certain personal norms. Furthermore, a decrease in the relationship between subjective norms and the intention to participate in PPT appeared to be observed.
The STATICO results demonstrate that tourist segmentation cannot be fully explained through a single global behavioural model. Instead, the proposed framework identifies stable consensus structures together with orientation-specific variations, providing additional evidence for designing differentiated sustainability strategies.
4.3. Application of the Standard Method
To evaluate the additional information provided by the proposed framework, the results were contrasted with those obtained through Partial Least Squares Structural Equation Modelling (PLS-SEM), one of the most widely adopted analytical techniques in tourism behavioural research [31]. Rather than representing an alternative methodology, PLS-SEM serves here as a benchmark against which the complementary contribution of the proposed multivariate framework can be assessed.
Figure 11.
Diagram of the model evaluated using PLS-SEM, analyzing how the factors of attitude toward PPT (X1. Att), subjective norms (X2.Sub) and personal norms (X3.Per) relate to the intention to participate in PPT (Y.Int), and how each type of value orientation (Zᵢ, where i = {Egoistic, Altruistic, Biospheric}) moderates these relationships.
Figure 11.
Diagram of the model evaluated using PLS-SEM, analyzing how the factors of attitude toward PPT (X1. Att), subjective norms (X2.Sub) and personal norms (X3.Per) relate to the intention to participate in PPT (Y.Int), and how each type of value orientation (Zᵢ, where i = {Egoistic, Altruistic, Biospheric}) moderates these relationships.
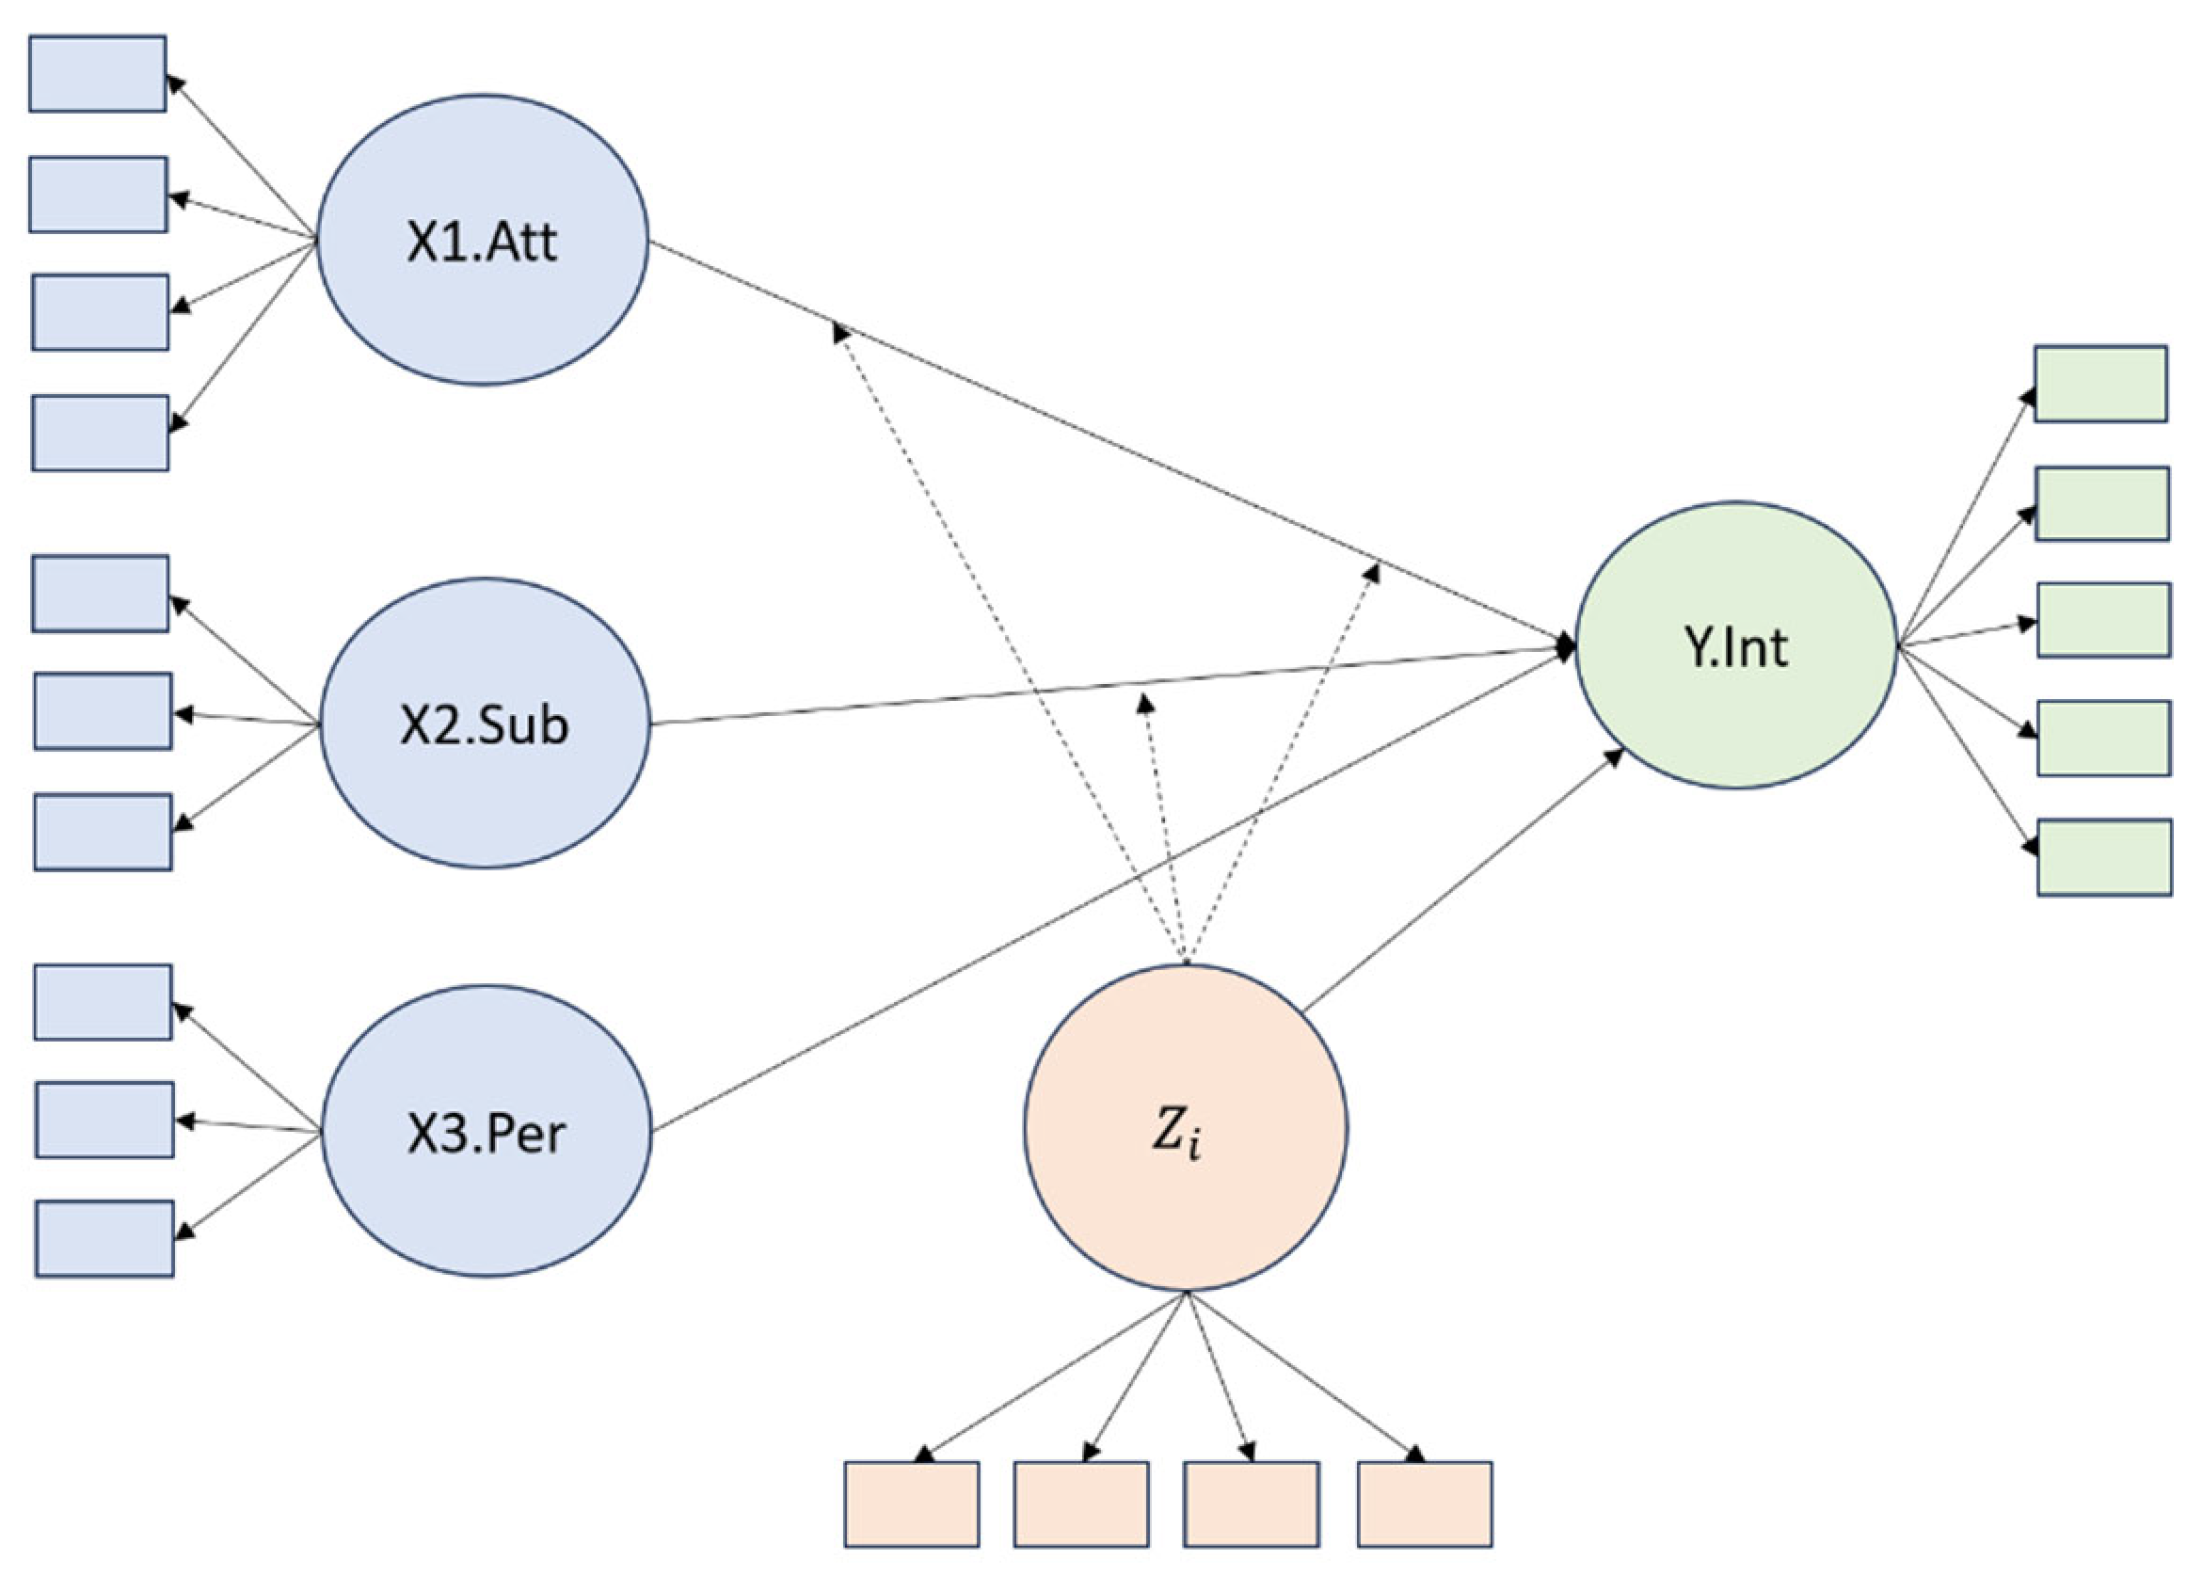
To build the models, a two-stage approach was followed, as recommended in the literature [24]. The first stage, known as measurement model assessment, evaluates the construction of each latent variable, including reliability, convergent validity and discriminant validity of the constructs. The second stage, known as structural model assessment, examines the relationships between the constructs, as specified in the structure of the diagram.
Overall, the comparison confirms that both analytical perspectives are complementary rather than competing. While PLS-SEM quantifies directional causal relationships among latent constructs, the proposed framework provides an additional exploratory layer that reveals hidden multivariate structures, reciprocal associations, and behavioural variability that remain inaccessible through asymmetric modelling alone.
4.3.1. Measurement Model
When building the hypothetical models, and following the recommendations of the PLS-SEM literature [28], we observed that all models yielded high values of Average Variance Extracted (AVE > 0.70) for all indicators of each hypothetical construct, in the three types of principles. See Table 3. These indicators meet the minimum thresholds suggested in the literature for their retention in the model [32].
This high level of variance extracted from the items was also observed in the GH-Biplot in Figure 6, represented as the length of the vectors.
4.3.2. Validity and Reliability Indicators
As suggested in the scientific literature [32], we analyzed the validity and reliability indicators of each construct and summarized them in Table 4, where it is observed that all constructs are valid and reliable according to the cited references. These metrics refer to the cohesion in the formation of the constructs, which was also evidenced in the GH biplot in Figure 6, through the proximity of the vectors.
4.3.3. Discriminant Validity
Regarding discriminant validity, Table 4 summarizes the results of the Hetero -Mono-Trait Ratio (HTMT). According to the literature, values below 0.90 indicate adequate discriminant validity [32]. Based on this criterion, all constructs present valid discriminant validity, except for Attitude towards PPT (X1.Att) and Perceived Control or Personal Norms (X3.Per), which exceed the threshold of 0.90.
For this pair of constructs, we also examined construct correlation and average cross-loadings (also known as item-level discriminant validity) as alternative measures of discriminant ability, as suggested [33]. According to the results, the correlation between Attitude Toward PPT (X1.Att) and Perceived Control or Personal Norms (X3.Per) is 0.882, and the average cross-loading between items is 0.710. All pairs of indicators between both constructs exceed 0.60, indicating low discriminant ability, as also observed in the GH-Biplot in Figure 6.
Of course, Table 5 does not show possible problems of discriminant validity between the types of value orientations, since they were not hypothesized together in the same model, but in three different models.
4.3.4. Structural Model
The results in Table 6, referring to the relationships between constructs, show that Attitude towards PPT (X1.Att), Subjective Norms (X2.Sub) and Personal Norms or Perceived Control (X3.Per) have a statistically significant positive effect on the Intention to Participate in PPT ( Y.Int ) across the different value orientations. This is consistent with the results observed in the STATICO commitment matrix (Figure 7), where, along the horizontal axis (which explains the greatest variability), the independent variables showed a close association with the items in the dependent factor.
Regarding the effect of each value orientation (Zᵢ) on the dependent construct (Y.Int ), Table 6 shows that only the biospheric value orientation (Z₃) has a statistically significant positive effect (0.139) on the intention to participate in PPT. This finding corroborates the results obtained with the proposed methodology, specifically with the co-inertia analysis illustrated in Figure 8.
Furthermore, none of the value types (Zᵢ) showed a significant moderating effect on the relationship between the independent constructs and the dependent construct, except for biospheric values, which showed a slight negative effect (−.087) on the relationship between Subjective Norms (X².Sub) and Intention to Participate in PPT (Y.Int ). This pattern was also observed in the STATICO analysis section of the proposed methodology (Figure 11).
4.4. Comparison of Both Approaches
Table 7 below summarizes the differences in how the various criteria are analyzed in the context of a complex model.
Read through this distinction, the two approaches recover complementary structures. The symmetric Co-Inertia coupling shows biospheric values and the intention to participate in poverty-reducing tourism sharing a strong common co-structure, an association that holds whichever table is placed first. The asymmetric PLS-SEM model, by contrast, isolates the directional effect and retains only the biospheric orientation as a significant predictor of intention. That the two agree on the biospheric dimension, despite their opposite treatment of symmetry, is what makes the finding robust, while their divergence on the weaker value orientations marks where a symmetric association does not translate into a directional effect.
4.5. Neutrosophic Analysis of Tourist Motivations
To complement multivariate and multidimensional analysis, neutrosophic psychology is incorporated, which allows to model the indeterminacy in tourist motivations, capturing the degrees of truth, indeterminacy and falsity in tourists' attitudes and values [34]. This approach is particularly useful to analyze the complexity of tourist decisions, where value orientations (egoistic, altruistic and biospheric) may not be entirely positive or negative but present a degree of ambiguity or uncertainty [35].
Using the results from Table 7 and Figure 12, the Single Value Neutrosophic Sets (SVNS) framework and weighted evaluation coefficient [36] are applied to assess the motivations towards poverty alleviation tourism (PPT).
4.5.1. Definition of the Neutrosophic Model
Each value orientation (egoistic, altruistic, biospheric) is modeled as a single-valued neutrosophic set (SVNS), where each tourist x ∈ X (with X as the universe of discourse, the 400 tourists in the sample) is characterized by a triplet representing the degrees of truth (T), indeterminacy (I), and falsity (F) in their orientation toward a specific value [30]. The values of T, I, and F are derived from the mean high-orientation scores reported in Table 1, normalized to the interval [0, 1]. The sum of T, I, and F satisfies
For each value orientation, the following criteria are assigned based on the mean scores in Table 1:
- Truth (T): Represents the intensity of value orientation (high average score divided by 5).
- Indeterminacy (I): Captures ambiguity in orientation, calculated as the relative difference between high and low scores, weighted by the proportion of tourists in the high orientation.
- Falsehood (F): Represents the opposition to the value, derived from the normalized low average score.
4.5.2. Calculation of Neutrosophic Triplets
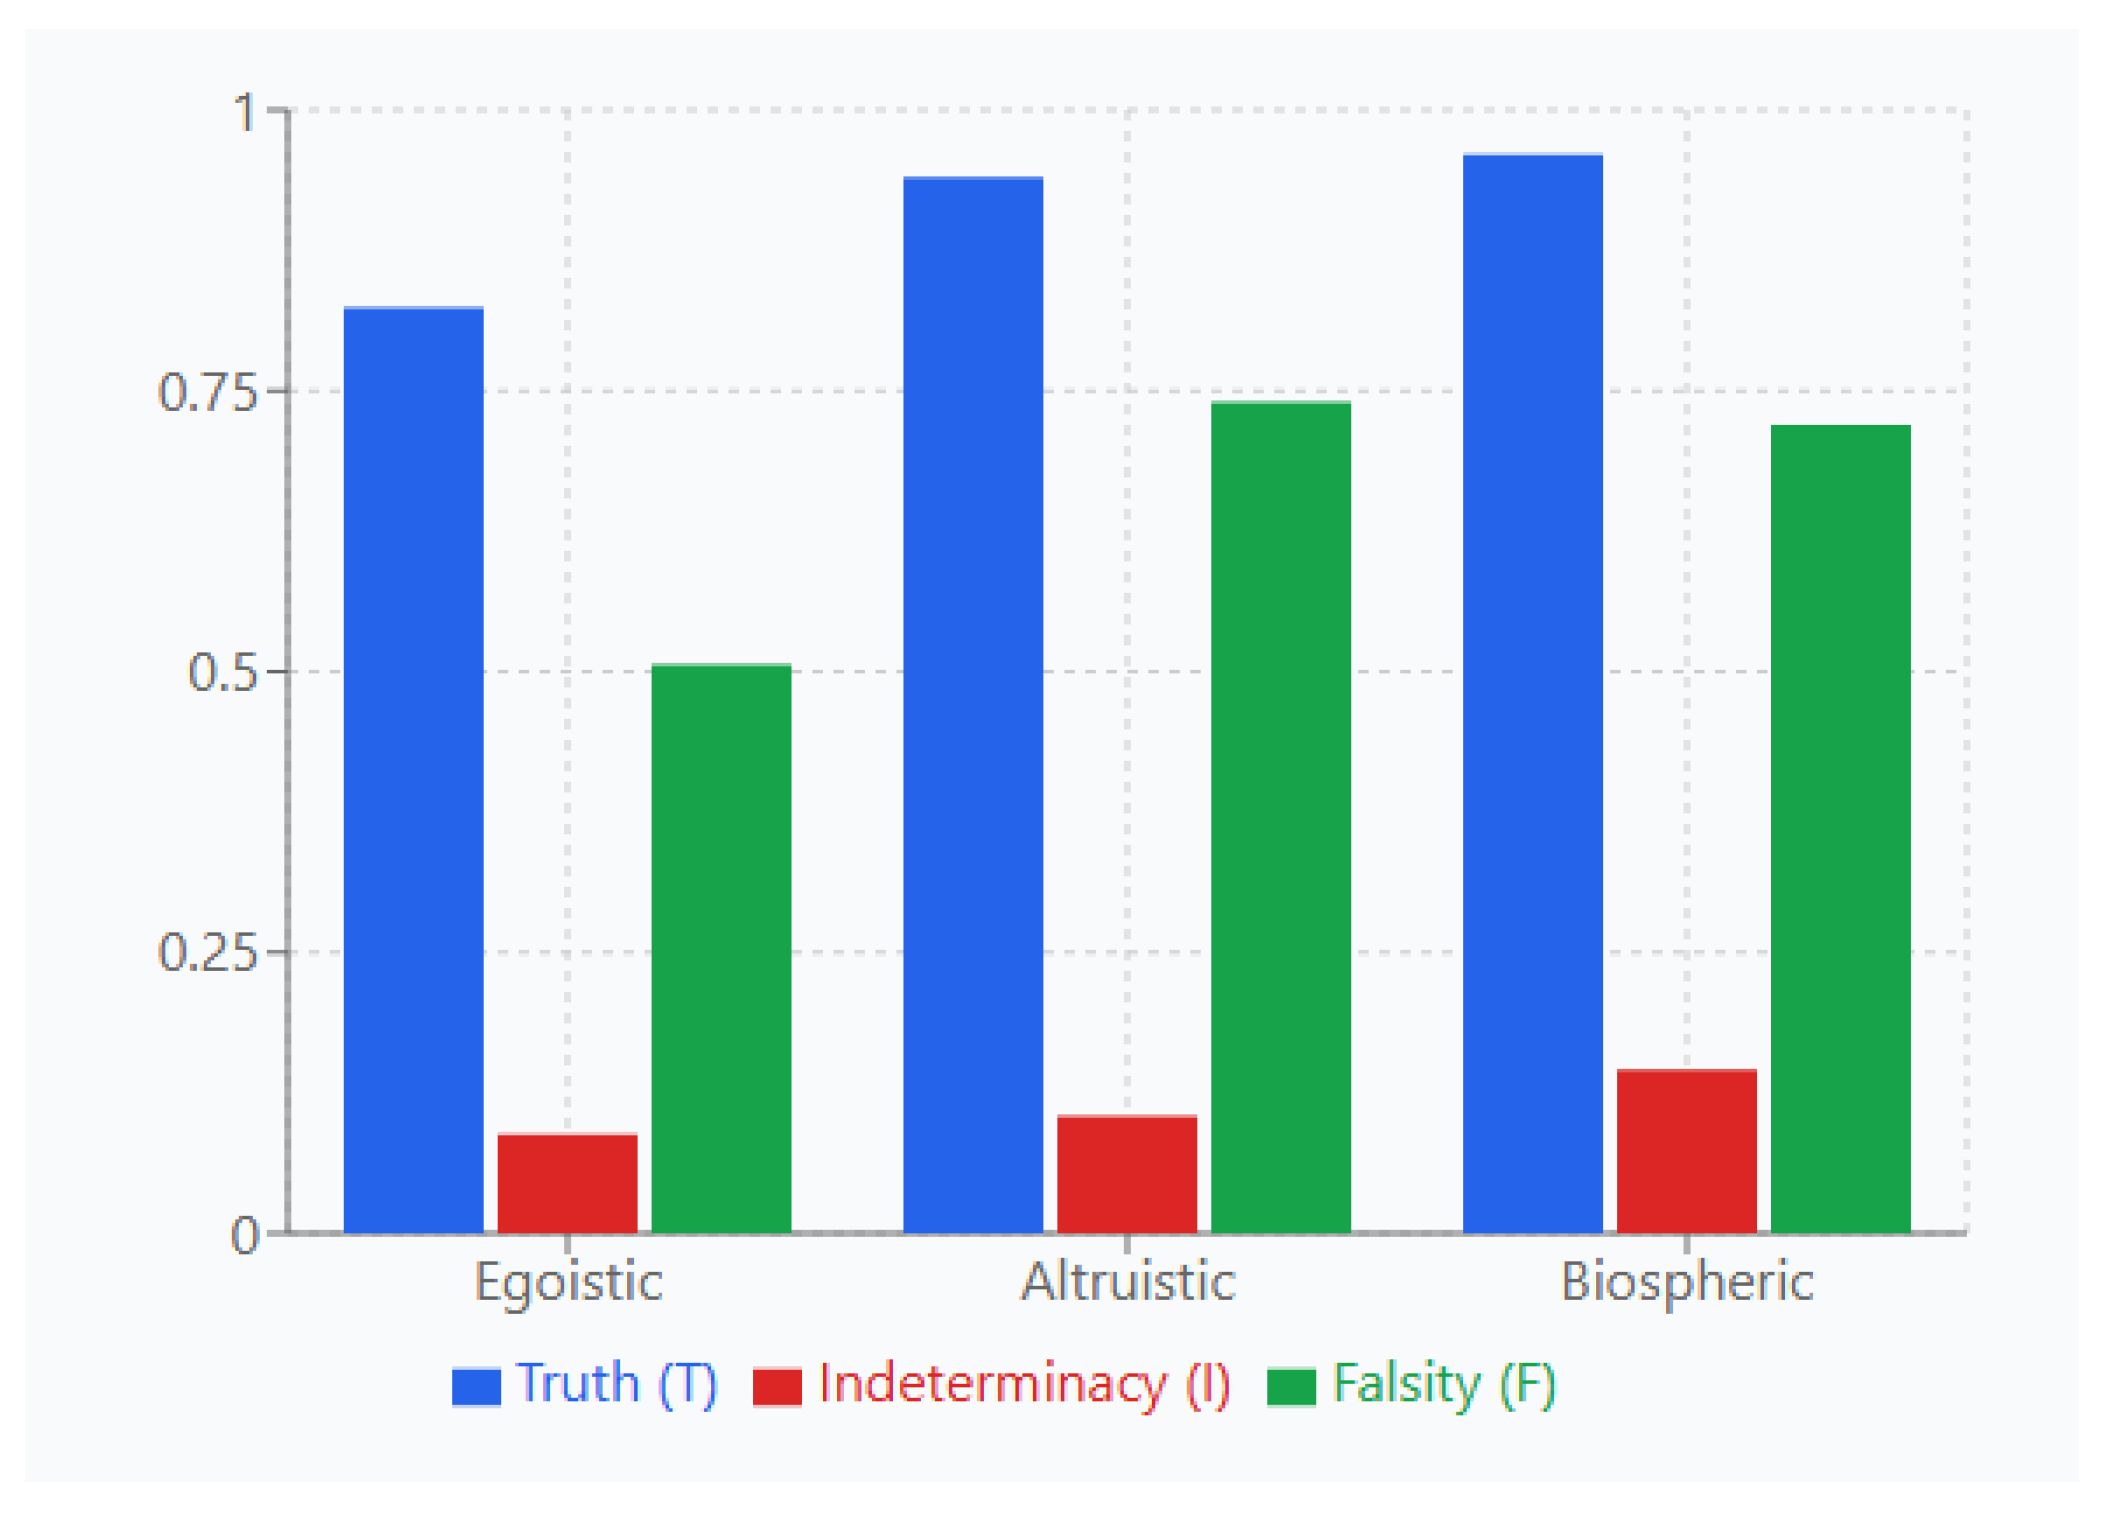
Using the scores in Table 8, the triplets for each value orientation are calculated. For example, for the biospheric orientation (243 tourists, 60.8%):
- High average score: 4.8 (average of the items: preventing pollution, respecting the earth, unity with nature, protecting the environment).
- Low average score: 3.6 (average of the same items).
- Calculation of T
- Calculation of I:
- Calculation of
Therefore, the neutrosophic triplet for biospheric orientation is
Similarly, for the altruistic and egoistic orientations:
Altruistic Orientation (208 tourists, 52.0%):
- High average score: 4.7
- Low average score: 3.7
- ; ;
- Triplet:
Egoistic Orientation (111 tourists, 27.7%):
- High average score: 4.12
- Low average score: 2.53
- ; ;
- ;
- Triplet:
Figure 12.
Neutrosophic Triplets Comparison by Value Orientation.
4.5.3. Neutrosophic Trait Operator Assessment
The Neutrosophic Trait Operator [37] is used to classify tourists according to their orientation towards each value (Trait) and its opposite (antiTrait). For each orientation, thresholds are defined based on the literature [38]:
- Trait Threshold (Thr): 0.85 (indicates strong identification with the value)
- AntiTrait Threshold (antiThr): 0.55 (indicates significant opposition to the value)
- Indeterminacy neighborhood , that is,
The Neutrosophic Trait Operator is calculated as:
where and . Applying this to each orientation:
Results by Orientation:
Biospheric:
- Since 0.24 > 0.1, tourists are classified as primarily biospheric.
Altruistic:
- As , tourists are classified as primarily altruistic.
Egoistic:
- Like , tourists classify themselves as mainly egoistic, although with a lower proportion (27.7%).
4.5.4. Weighted Evaluation Coefficient with SVNS
To assess the relationship between value orientations and the intention to participate in PPT, the weighted evaluation coefficient between the SVNS of the orientations and an ideal SVNS is calculated [39]. The ideal SVNS is defined as , representing an ideal orientation towards PPT (maximum truth, minimum indeterminacy and falsity).
The weights () are derived from the proportions of tourists in each orientation (Table 1):
The weighted evaluation coefficient between an SVNS A (for each orientation) and the ideal SVNS A* is calculated using Equation (2) [30]:
Calculations by Orientation:
Biospheric:
- Cw (Biospheric, A*) =
Altruistic:
- Cw (Altruistic, A*)
Egoistic:
- Cw (Selfish, A*)
Figure 13.
Neutrosophic Profile Radar Chart.
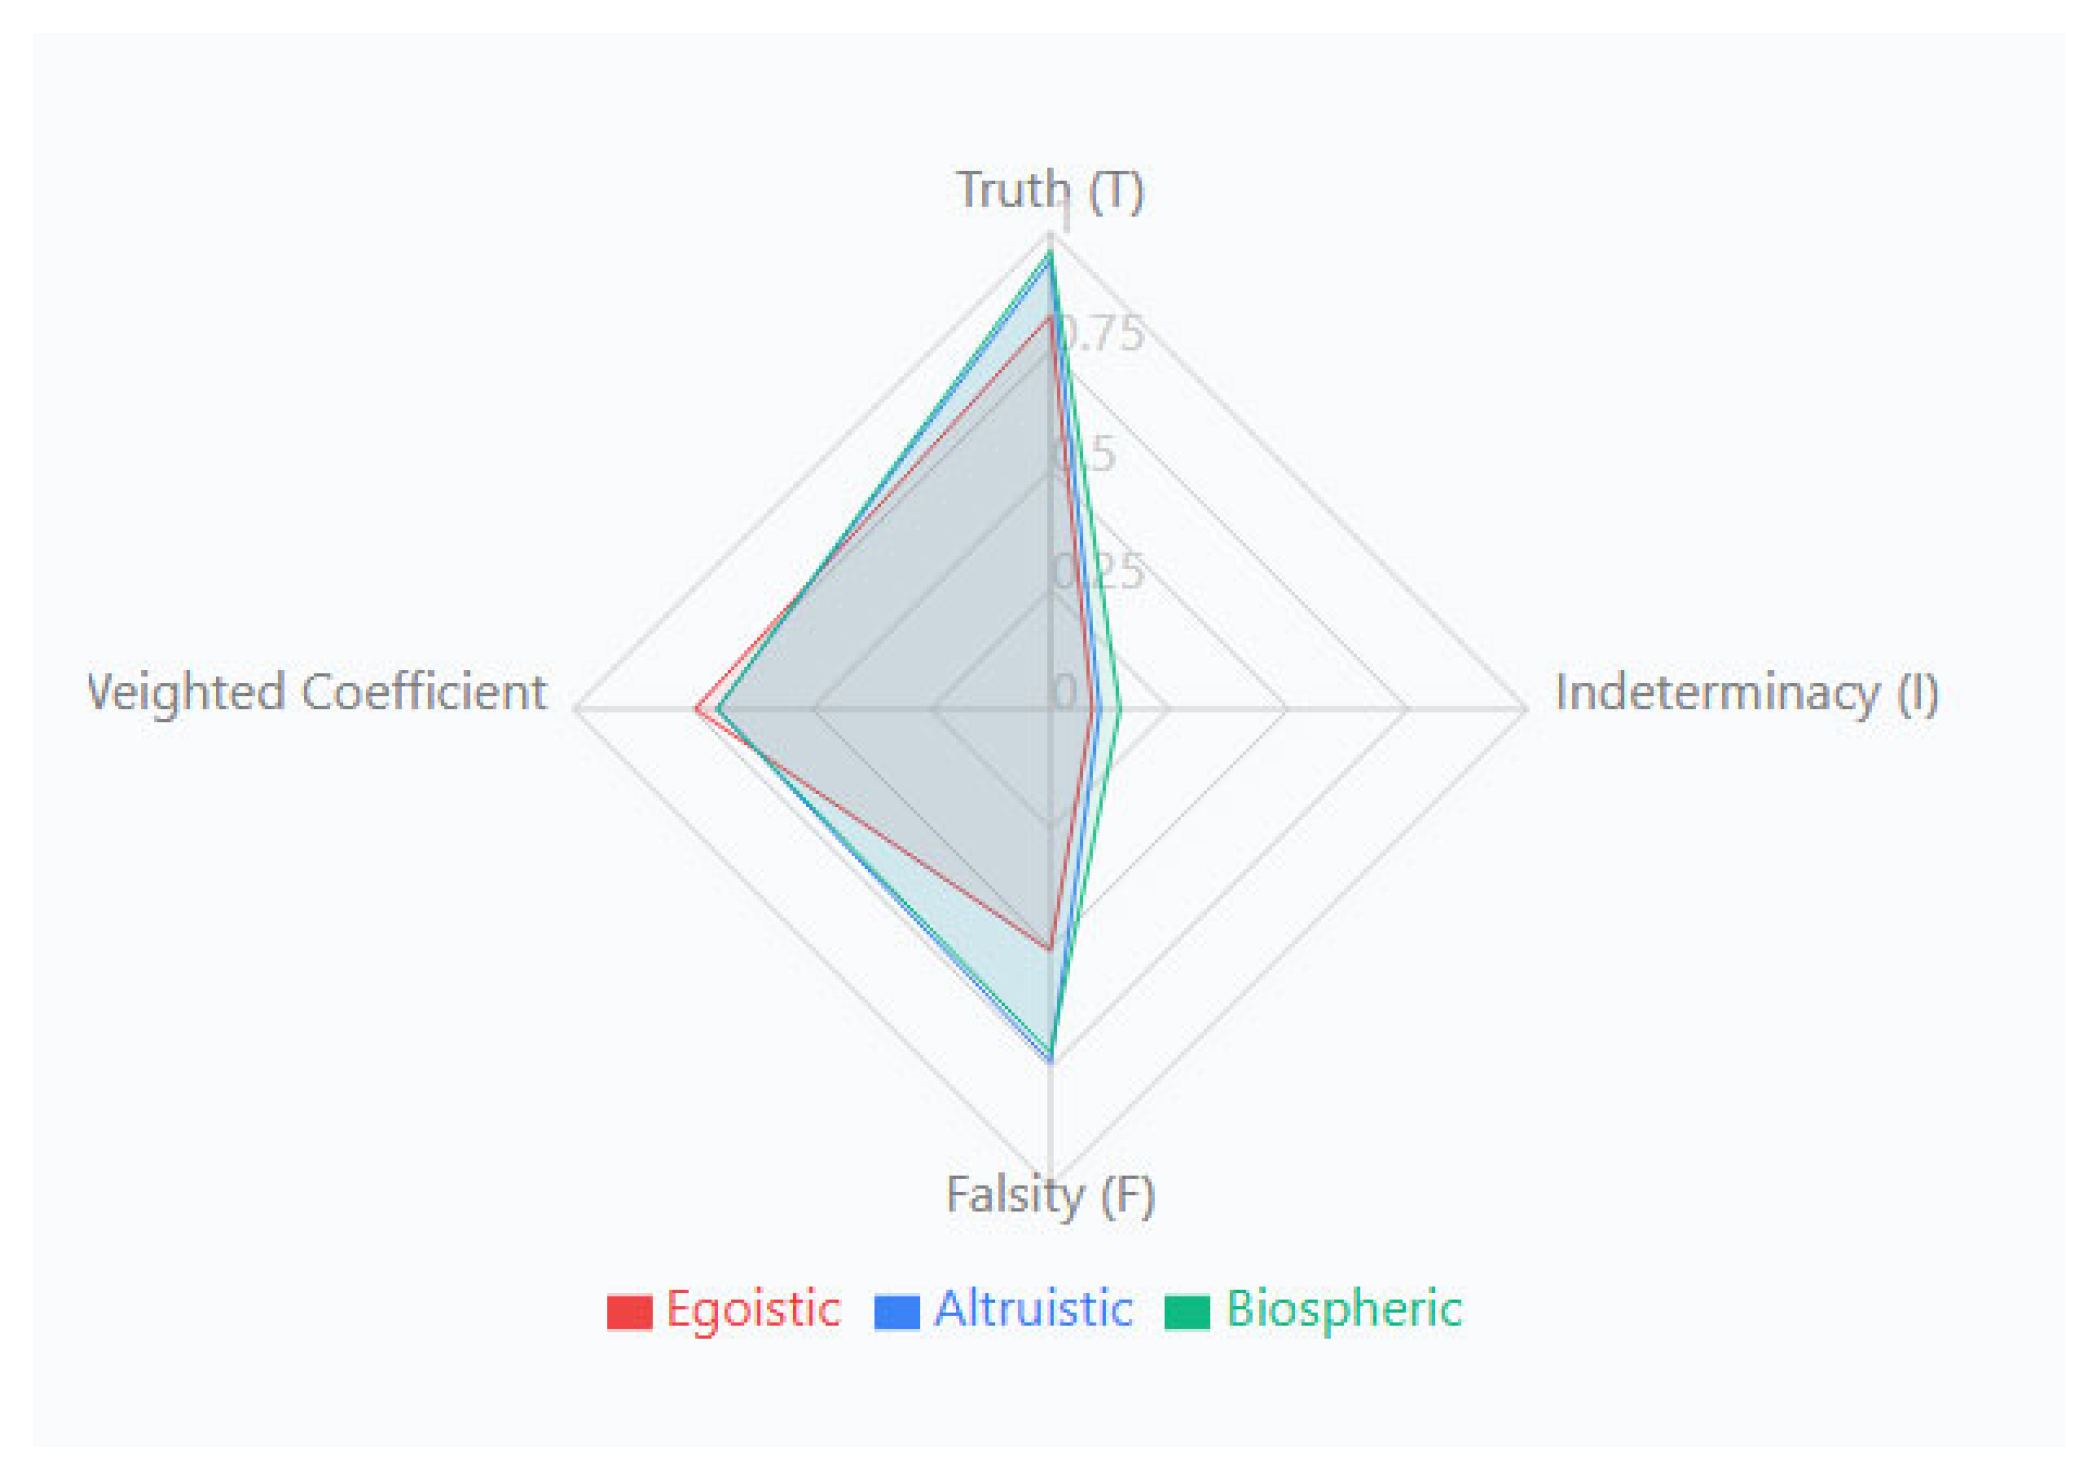

Table 9.
Weighted Evaluation Coefficients for Value Orientations.
| Orientation | Cw (A, A*) | Classification |
|---|---|---|
| Selfish | 0.744 | 1 |
| Altruistic | 0.699 | 2 |
| Biospheric | 0.698 | 3 |
Note: Coefficients are calculated using Equation (2) with weights based on the proportions in Table 7. A higher value indicates greater similarity to the ideal PPT orientation.
4.5.5. Interpretation of Neutrosophic Results
The results in Table 8 show that egoistic orientation has the highest weighted evaluation coefficient, followed by altruistic and biospheric orientations . This suggests that, from a neutrosophic perspective, tourists with an egoistic orientation show the greatest similarity with an ideal intention to participate in PPT, even though only 27.7% of the sample belong to this group (Table 1).
This finding contrasts with the results of the co-inertia analysis (Figure 7) and STATICO (Figure 10), where biospheric orientation showed a greater association with the intention to participate in PPT, especially in financial contributions.
From a neutrosophic perspective, the high indeterminacy in the egoistic orientation (I = 0.088) and the lower falseness suggest that egoistic tourists have a less clear motivation, but with less opposition to PPT compared to altruistic and biospheric orientations. This could reflect a perception of personal benefits (such as improved social image) from participating in PPT, which increases the degree of truthfulness [40].
On the other hand, the biospheric orientation, with a high degree of truth and a higher proportion of tourists (60.8%), confirms its strong relationship with the intention to participate in PPT, especially in financial contributions, as observed in Figure 10 [41].
The overlap between altruistic and biospheric orientations, observed in the GH-Biplot (Figure 6, Panel C) and in the high correlation of its items, indicates a high degree of indeterminacy in the distinction between these values [40]. This is reflected in their similar neutrosophic triplets , suggesting that tourists perceive altruistic and biospheric actions as interconnected, which could explain the lack of a clear motivational pattern in the altruistic group (Figure 14).
4.5.6. Neutrosophic Implications
Neutrosophic psychology enriches the analysis by modeling the indeterminacy of tourist motivations, revealing that intentions to participate in PPT are not unidirectional. For example, the lower variance explained in non-financial activities (Figure 6, Panel B) suggests a higher degree of indeterminacy in these intentions, possibly due to their contextual or less defined nature [41].
biospheric orientation, with strong truth and low indeterminacy, supports marketing strategies that emphasize environmental benefits, while the egoistic orientation, with high indeterminacy, suggests the need for campaigns that highlight personal benefits for this segment [42].
This neutrosophic analysis complements the multivariate findings, offering a more nuanced perspective on tourism segmentation and public policymaking in Ecuador.
Following the methodological framework described above, the proposed analytical sequence was applied to the tourist database. The results are presented according to the same order in which the framework operates, beginning with the exploratory multivariate analyses (GH-Biplot and COIA), followed by STATICO, confirmatory PLS-SEM, and finally the neutrosophic interpretation of tourist behavioural profiles.
5. Discussion
5.1. Interpretation of the Main Findings
The present study demonstrates that tourist behaviour cannot be fully understood through conventional causal modelling alone. Although Partial Least Squares Structural Equation Modelling (PLS-SEM) successfully validates the statistical relationships among latent constructs, it does not reveal the multivariate interaction structures underlying those relationships [43]. The proposed framework addresses this limitation by integrating complementary exploratory and confirmatory techniques that progressively uncover the internal organization of tourist motivations, values, and behavioural intentions [34].
The empirical results consistently indicate that biospheric values represent the strongest motivational orientation associated with the intention to participate in poverty-reducing tourism [40]. However, the multivariate analyses further reveal that this relationship is not isolated but emerges from a network of interactions involving personal norms, subjective norms, and behavioural attitudes. Consequently, tourist segmentation should not be interpreted exclusively through direct causal effects but also through the covariance structures linking behavioural dimensions [38].
Furthermore, the sequential application of GH-Biplot, Co-Inertia Analysis, and STATICO demonstrates that different multivariate techniques contribute complementary information rather than redundant evidence. Each analytical stage progressively increases the understanding of tourist behaviour before the confirmatory structural model is estimated, producing a richer interpretation of behavioural complexity [33].
5.2. Comparison with Previous Research
Previous studies on tourist segmentation have predominantly employed Structural Equation Modelling, clustering algorithms, or traditional multivariate techniques independently to explain behavioural intentions. These approaches have demonstrated considerable effectiveness for estimating latent relationships; however, they generally analyse either causal effects or exploratory patterns separately [39].
The proposed framework extends this analytical perspective by integrating exploratory multivariate visualization, covariance-based analysis, multiblock data analysis, and structural modelling within a single methodological strategy. Consequently, the present research complements rather than replaces existing approaches, demonstrating that exploratory multivariate techniques can substantially improve the interpretation of structural models [41].
Similarly, the integration of Co-Inertia Analysis and STATICO provides additional information regarding reciprocal relationships and consensus structures among behavioural constructs that conventional asymmetric models are unable to identify directly. This complementary perspective contributes to a more comprehensive understanding of tourist segmentation under complex behavioural conditions [42].
5.3. Methodological Contribution
The principal scientific contribution of this study is the development of an integrated analytical framework that explicitly combines symmetric multivariate analysis, asymmetric structural modelling, and neutrosophic uncertainty representation.
Unlike conventional tourism segmentation methodologies, the proposed framework distinguishes two complementary analytical perspectives. The first corresponds to the exploration of symmetric covariance structures through GH-Biplot, Co-Inertia Analysis, and STATICO, where behavioural constructs are analysed without imposing directional assumptions. The second corresponds to asymmetric causal modelling through PLS-SEM, where directional effects among latent variables are estimated and validated.
This integration allows researchers to move from exploratory visualization toward confirmatory modelling while preserving the multivariate information contained in the original dataset. Consequently, the framework not only improves statistical interpretation but also facilitates hypothesis generation and behavioural understanding prior to structural model estimation.
An additional methodological contribution is the incorporation of Neutrosophic Psychology as an interpretative layer capable of explicitly representing behavioural indeterminacy. Rather than assuming that tourist attitudes are exclusively positive or negative, the proposed framework incorporates uncertainty as an inherent characteristic of human decision-making, thereby extending the explanatory capacity of conventional behavioural models.
An additional contribution of the proposed framework is its explicit integration of symmetric and asymmetric analytical perspectives within a single methodological strategy. While GH-Biplot, Co-Inertia Analysis, and STATICO characterize reciprocal covariance structures without imposing directional assumptions, PLS-SEM estimates asymmetric causal effects among latent constructs. The combined interpretation of both perspectives enables a more complete understanding of tourist behaviour than either approach applied independently. Consequently, the framework contributes not only a methodological integration but also a conceptual perspective consistent with the study of symmetry and asymmetry in complex behavioural systems.
5.4. Practical Implications
Beyond its methodological contribution, the proposed framework provides several practical advantages for tourism researchers, destination management organizations, and public policy makers.
First, the methodology facilitates the identification of behavioural profiles that cannot be detected through conventional causal modelling alone, enabling more accurate market segmentation strategies.
Second, the graphical representation provided by GH-Biplot, Co-Inertia Analysis, and STATICO considerably improves the interpretation of complex behavioural relationships, making statistical evidence more accessible to tourism managers and decision-makers.
Third, the identification of biospheric values as the principal motivational driver suggests that sustainability-oriented tourism policies should prioritize environmentally committed visitor segments when designing promotional campaigns and destination management strategies.
Finally, the incorporation of behavioural uncertainty through Neutrosophic Psychology provides an additional decision-support component, allowing managers to recognize situations in which tourists simultaneously express favourable attitudes, hesitation, and contradictory motivations. This richer interpretation can improve the design of sustainable tourism policies under conditions of incomplete or uncertain information.
From an operational perspective, the proposed framework can assist destination management organizations in identifying priority tourist segments according to their motivational profiles, environmental commitment, and behavioural intentions. The integration of exploratory multivariate visualization with structural modelling facilitates evidence-based decision-making, supports the design of differentiated sustainability campaigns, improves the allocation of promotional resources, and enables managers to recognize behavioural uncertainty when planning tourism policies. These practical advantages demonstrate that the proposed framework constitutes not only a statistical methodology but also an effective decision-support tool for sustainable tourism management.
5.5. Limitations and Future Research
Although the proposed framework demonstrates considerable analytical potential, several limitations should be acknowledged.
First, the empirical application was conducted using a cross-sectional sample collected within a specific tourism context. Consequently, caution should be exercised when generalizing the findings to other tourism destinations or cultural settings.
Second, the proposed methodology was evaluated using behavioural constructs associated with poverty-reducing tourism. Future studies should examine its applicability to other forms of sustainable tourism, ecotourism, cultural tourism, and smart tourism environments.
Third, although the integration of GH-Biplot, Co-Inertia Analysis, STATICO, and PLS-SEM proved effective, additional multivariate methodologies could be incorporated into future extensions of the framework. In particular, robust multivariate techniques, longitudinal multiblock methods, machine learning algorithms, and artificial intelligence approaches may further improve behavioural prediction and tourist segmentation.
Finally, future research could evaluate the framework using longitudinal datasets, larger international samples, and dynamic behavioural models to investigate how tourist motivations evolve over time under different sustainability contexts.
6. Conclusions
This study proposed and validated an integrated multivariate analytical framework for tourist profile segmentation that combines GH-Biplot, Co-Inertia Analysis (COIA), STATICO, Structural Equation Modelling (PLS-SEM), and Neutrosophic Psychology. Unlike conventional tourism segmentation approaches that primarily focus on directional causal relationships, the proposed framework integrates complementary exploratory and confirmatory techniques to reveal both symmetric multivariate structures and asymmetric behavioural relationships, providing a more comprehensive interpretation of tourist decision-making under uncertainty.
The empirical application demonstrated that the sequential combination of these techniques provides information that cannot be obtained through the isolated application of a single analytical method. GH-Biplot facilitated the exploration of the internal structure of the behavioural constructs and the identification of latent relationships among questionnaire items. Co-Inertia Analysis revealed common multivariate structures between tourists' value orientations and behavioural intentions without imposing directional assumptions, while STATICO identified both consensus patterns and behavioural variability across different value orientations. Finally, PLS-SEM confirmed the structural relationships identified during the exploratory stages, reinforcing the complementary nature of the proposed analytical framework.
The results also confirm that biospheric values represent the strongest behavioural orientation associated with tourists' intentions to participate in poverty-reducing tourism. However, the proposed framework demonstrates that these intentions emerge from the interaction of multiple motivational dimensions rather than from isolated causal relationships. This finding highlights the importance of integrating covariance-based exploratory analyses with structural modelling to better understand the complexity of tourist behaviour.
A further methodological contribution of this research lies in the incorporation of Neutrosophic Psychology as an interpretative layer for behavioural analysis. By representing tourist motivations through simultaneous degrees of truth, indeterminacy, and falsity, the framework extends conventional behavioural models and explicitly incorporates uncertainty into the interpretation of tourist decision-making. This perspective provides a richer understanding of situations in which tourists simultaneously express commitment, hesitation, and contradictory motivations.
From a practical perspective, the proposed framework offers a valuable decision-support tool for tourism researchers, destination management organizations, and public policy makers. The methodology facilitates the identification of behavioural profiles aligned with sustainability principles, improves the interpretation of complex motivational structures, and supports the design of evidence-based segmentation strategies. Furthermore, the graphical representation provided by the multivariate techniques enhances the communication of analytical results, making them more accessible for strategic planning and management.
Despite these contributions, several limitations should be acknowledged. The empirical analysis was conducted using a cross-sectional sample of tourists within a specific tourism context, which may limit the generalizability of the findings. Future research should evaluate the proposed framework using longitudinal data, different tourism typologies, and larger international samples. Additional studies could also explore the integration of the proposed framework with machine learning techniques, artificial intelligence algorithms, and other multiblock multivariate methods to further improve behavioural prediction and decision-support capabilities.
Overall, this research demonstrates that tourist segmentation can benefit substantially from the integration of symmetric multivariate analysis, asymmetric structural modelling, and neutrosophic uncertainty representation within a unified analytical framework. Beyond its application to poverty-reducing tourism, the proposed methodology offers a flexible and interpretable approach that can be extended to other areas of behavioural research where complex multivariate relationships and uncertainty play a central role.
More broadly, the proposed framework is not restricted to poverty-reducing tourism and may be extended to other complex behavioural systems where symmetric multivariate structures, directional relationships, and uncertainty coexist.
Author Contributions
Conceptualization, H.V.-C. and P.G.-V.; methodology, H.V.-C., O.R.-B. and P.G.-V.; formal analysis, H.V.-C. and O.R.-B.; data curation, H.V.-C.; writing, original draft preparation, H.V.-C.; writing, review and editing, O.R.-B. and P.G.-V.; supervision, P.G.-V. All authors have read and agreed to the published version of the manuscript.
Funding
This research received no external funding.
Institutional Review Board Statement
Ethical review and approval were waived for this study because it involved an anonymous survey of adult participants that collected no sensitive personal data, in accordance with the applicable institutional research-ethics policy. All participants gave informed consent before taking part.
Informed Consent Statement
Informed consent was obtained from all subjects involved in the study.
Data Availability Statement
The anonymized data supporting the reported results are available from the corresponding author upon reasonable request. The data are not publicly archived because they contain individual survey responses.
Conflicts of Interest
The authors declare no conflicts of interest.
References
- López- Sánchez, Y.; Pulido-Fernández, J.I. In search of the pro-sustainable tourist: A segmentation based on tourism sustainable intelligence. Tour. Manag. Perspect. 2016, 17, 59–71. [CrossRef]
- Lu, J.; Nepal, S.K. Sustainable tourism research: An analysis of articles published in the Journal of Sustainable Tourism. J. Sustain. Tour. 2009, 17, 5–16. [CrossRef]
- World Tourism Organization. Guide for Local Authorities on the Development of Sustainable Tourism; UNWTO: Madrid, Spain, 1998.
- Miller, G.; Rathouse, K.; Scarles, C.; Holmes, K.; Tribe, J. Public Understanding of Sustainable Tourism. Ann. Tour. Res. 2010, 37, 627–645. [CrossRef]
- Gabriel, K.R. Biplot display of multivariate matrices for data inspection and diagnosis. Technical Report, University of Rochester, 1980, ADA091821.
- Elsawy, T.M. Harnessing Appreciative Inquiry in Tourism Planning. Int. J. Tour. Cities, 2024, 10, 925–956. [CrossRef]
- Peñafiel, K.M.; Suaste, D.I.; Valencia, A.R. Neutrosophical statistical analysis of behavioral medicine knowledge. Neutrosophic Sets Syst. 2022, 52, 227-234.
- Guesdon, S.; Stachowski-Haberkorn, S.; Lambert, C.; et al. Effect of local hydroclimate on phytoplankton groups. Estuar. Coast. Shelf Sci. 2016, 181, 325-337. [CrossRef]
- Hair, J.F.; Risher, J.J.; Sarstedt, M.; Ringle, C.M. When to Use and How to Report Results from PLS-SEM. Eur. Bus. Rev. 2019, 31, 2-24. [CrossRef]
- Ajzen, I. The theory of planned behavior. Organ. Behav. Hum. Decis. Process. 1991, 50, 179-211. [CrossRef]
- Wang, L.-H.; Yeh, S.-S.; Chen, K.-Y.; Huan, T.-C. Tourists' Travel Intention: Revisiting the TPB Model. Tour. Rev. 2022, 77, 1-20. [CrossRef]
- Ji, Z.; Xu, H.; Cui, Q. Tourism and poverty alleviation in Tibet, China. Asia Pac. J. Tour. Res. 2022, 27, 173-191. [CrossRef]
- Schwartz, S. Normative influences on altruism. Adv. Exp. Soc. Psychol. 1992, 10, 221-279. [CrossRef]
- Gabriel, K.R. Graphical representation of matrices using biplot. Biometrika. 1971, 58, 453-467. [CrossRef]
- Galindo-Villardón, P. An alternative for simultaneous representation: HJ-Biplot. Qüestiió, 1986, 10(1), 13-23.
- Huson, L.W. A graphical aid to multivariate sensitivity analysis. Ecol. Model. 1982, 16, 91-98. [CrossRef]
- Frutos Bernal, E.; Martín del Rey, A.; Galindo-Villardón, P. Analysis of the Madrid Metro Network. Appl. Sci. 2020, 10, 5689. [CrossRef]
- Ajedrez, D.; Mercier, P. Coupling of triplets statistics. In Biometrics Environ; 1993; pp. 15-44.
- Dolédec, S.; Chessel, D. Coinertia analysis. Freshw. Biol. 1994, 31, 277-294. [CrossRef]
- Dray, S.; Chessel, D.; Thioulouse, J. Coinertia analysis and linkage of ecological data. Ecology 2003, 84, 3078-3089. [CrossRef]
- Cao, Y.; Larsen, D.P.; Hughes, R.M.; Angermeier, P.L.; Patton, T.M. Sampling effort affects multivariate comparisons of stream assemblages. J. N. Am. Benthol. Soc. 2002, 21, 701-714. [CrossRef]
- Kissita, G.; Kibangou, C.D.N.; Niéré, L.; Nkiet, G.M. Multiple CO inertia analysis. Commun. Stat. Theor. Methods. 2022, 51, 1-25. [CrossRef]
- Slimani, N.; Guilbert, E.; Ayni, F.; et al. The use of STATICO and COSTATIS. Ecol. Stat. 2017, 24, 269-295. [CrossRef]
- Thioulouse, J.; Simier, M.; Chessel, D. Simultaneous analysis of paired tables. Ecology. 2004, 85, 272-283. [CrossRef]
- Simier, M.; Blanco, L.; Pellegrín, F.; Nandris, D. Simultaneous approach to K pairs of frames. Revue Stat. Appl. 1999, 47, 31-46.
- Lavit, C. Presentation of the STATIS method. Cah. Rech. Dev. 1988, 18, 49-60.
- Villanueva, L.K.B.; Mendoza, M.A.; Salcedo, R.; Morán, A.M.I. Transformational leadership and its impact on organizational performance. Neutrosophic Sets Syst. 2020, 34, 143-152.
- Mondal, K.; Pramanik, S. Group decision-making approach under neutrosophic environment. Neutrosophic Sets Syst. 2014, 6, 28-34.
- Ye, J. Another form of correlation coefficient under neutrosophic statistics. Neutrosophic Sets Syst. 2013, 1, 8-12.
- Chicaiza, C.V.V.; Paspuel, O.G.A.; Yesenia, P.; Cuesta, C.; Hernández, S.D.R.Á. Neutrosophic Psychology: A new approach to human behavior. Neutrosophic Sets Syst. 2020, 34, 1-8.
- Mendes, S.; Gómez, J.; Pereira, M.J.; Azeiteiro, U.M.; Galindo-Villardón, M.P. The efficiency of Partial Triadic Analysis. Biom. Lett. 2010, 47, 83-106.
- Duarte Santos, A.; Ribeiro, S.; Castela, G.; Tavares da Silva, N. Economic growth and standard of living. Estud. Econ. Apl. 2017, 35, 629-652.
- Hair, J.F., Jr.; Hult, G.T.M.; Ringle, C.M.; Sarstedt, M. A Primer on Partial Least Squares Structural Equation Modeling (PLS-SEM); Sage: Thousand Oaks, CA, USA, 2021.
- Cheung, G.W.; Cooper-Thomas, H.D.; Lau, R.S.; Wang, L.C. Reliability Reports in Management Research: A Comprehensive Review. Asia Pac. J. Manag. 2023, 40, 1-25. [CrossRef]
- Sarstedt, M.; Hair, J.F., Jr.; Cheah, J.-H.; Becker, J.-M.; Ringle, C.M. Higher order constructs in PLS-SEM. Australas. Mark. J. 2019, 27, 197-211. [CrossRef]
- Afzal, U.; Alrweili, H.; Ahmad, N.; Aslam, M. Neutrosophic Statistical Analysis of Resistance Depending on the Temperature Variance of Conducting Material. Sci. Rep. 2021, 11, 23939. [CrossRef]
- Aslam, M. Neutrosophical Statistical Test for Counts counts in climatology. Sci. Rep. 2021, 11, 23940. [CrossRef]
- Perkins, H.E.; Brown, P.R. Environmental Values and the Authentic Ecotourist. J. Travel Res. 2012, 51, 793-803. [CrossRef]
- Sharma, R.; Gupta, A. Pro-environmental behavior among tourists. Asia Pac. J. Tour. Res. 2020, 25, 829-840. [CrossRef]
- Li, S.; Saayman, A.; Stienmetz, J.; Tussyadiah, I. Willingness to pay for tourism products. J. Travel Res. 2022, 61, 1791-1807. [CrossRef]
- Durán Román, J.L.; Cárdenas García, P.J.; Pulido-Fernández, J.I. Tourists' Willingness to Pay for Sustainable Tourism Experiences. J. Dest. Mark. Manag. 2021, 19, 100540. [CrossRef]
- López-Mosquera, N.; Sánchez, M. Theory of planned behavior and environmental values: A study on recycling behavior. J. Environ. Manag. 2012, 113, 251-262.
- Pulido-Fernández, J.I.; López-Sánchez, Y. Are tourists willing to pay more for sustainable destinations? Sustainability. 2016, 8, 1240. [CrossRef]
- Vicente-Galindo, P. Analysis of the Evolution of Expert Opinion on Sustainability Policies through the Neutrosophic STATIS Method. NSS. 2025. 89(1).
Figure 1.
GH Biplot process. The data matrix is subjected to a singular value decomposition to obtain the axes that explain the greatest variance and covariance of the columns of X, onto which the rows and columns of the original matrix are projected. Authors own elaboration.
Figure 1.
GH Biplot process. The data matrix is subjected to a singular value decomposition to obtain the axes that explain the greatest variance and covariance of the columns of X, onto which the rows and columns of the original matrix are projected. Authors own elaboration.
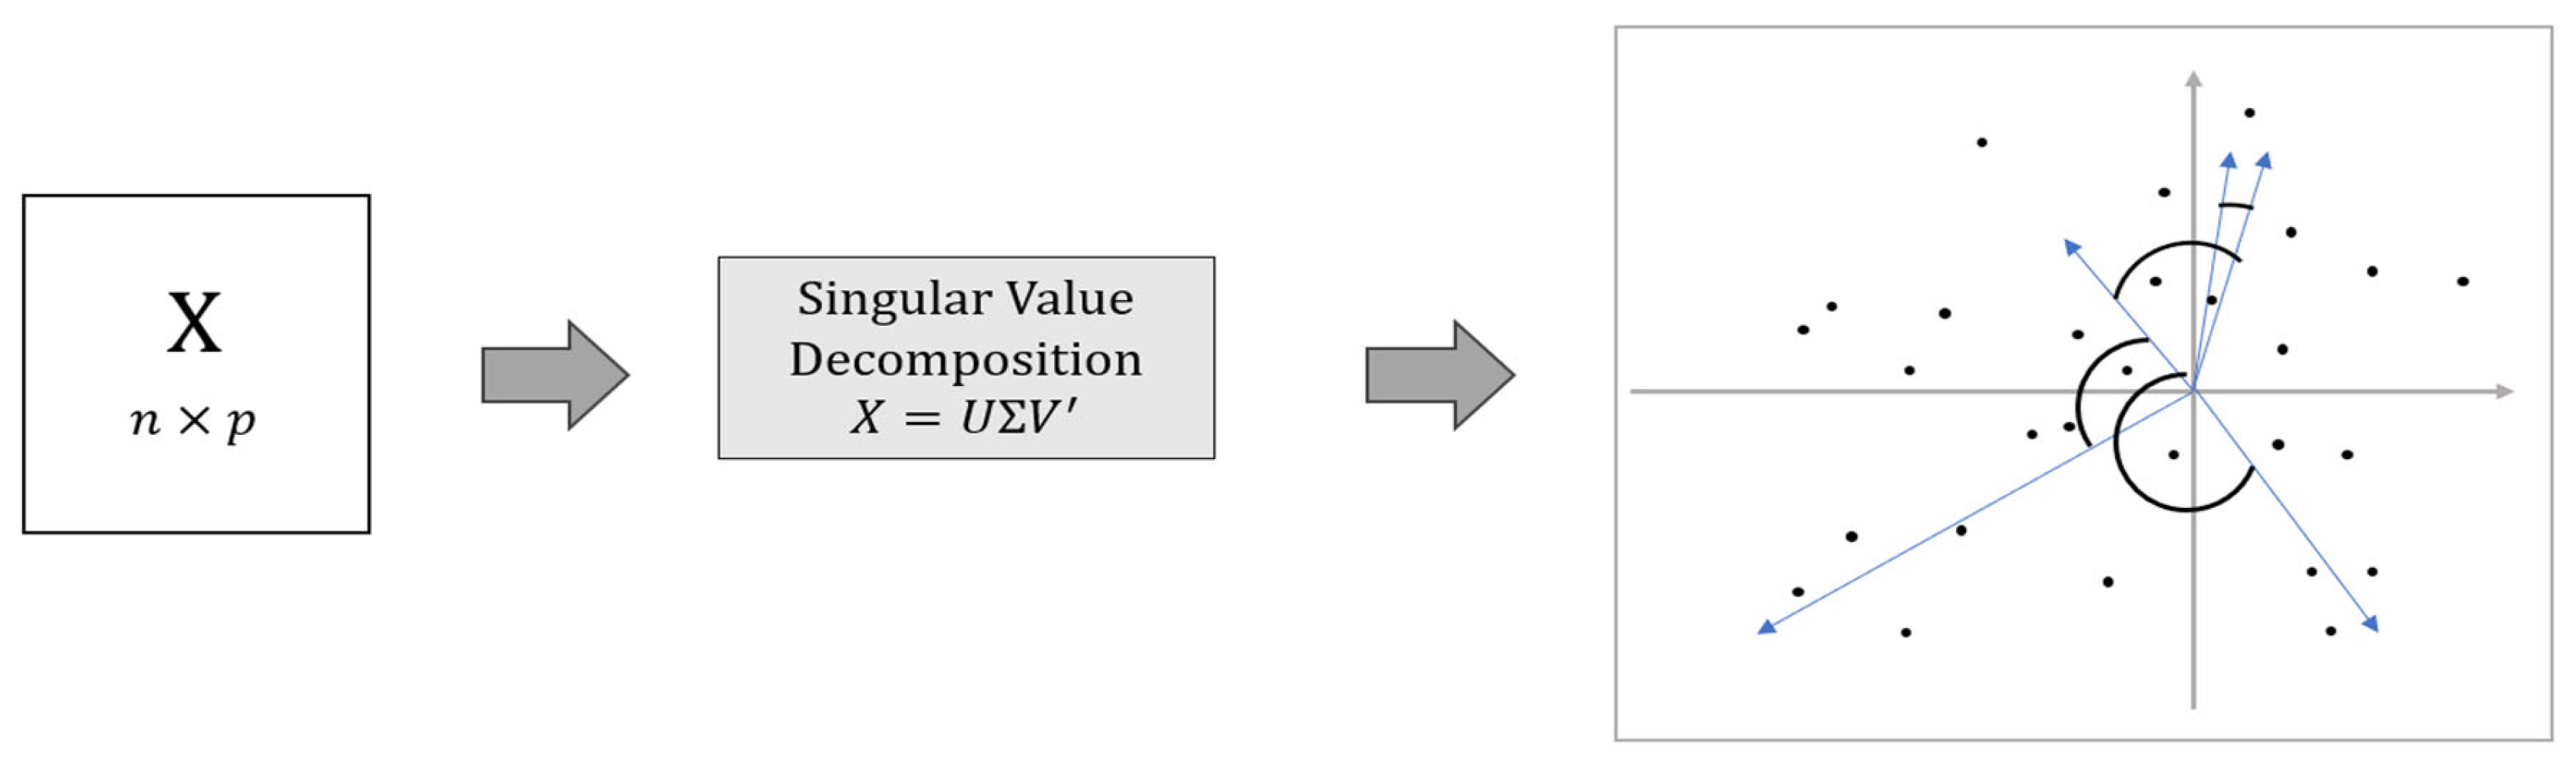
Figure 2.
Co-inertia analysis process. The process starts with the transformed (e.g., centered, normalized) data sets, which are subsequently projected onto their respective hyperspaces and . In these hyperspaces, there is a principal axis (blue) that represents the maximum variance of each data set, as in principal component analysis. However, co-inertia analysis identifies a vector in each hyperspace such that the intersection of their respective projections produces the maximum covariance between both data sets. Source: Own elaboration based on [18] and [19].
Figure 2.
Co-inertia analysis process. The process starts with the transformed (e.g., centered, normalized) data sets, which are subsequently projected onto their respective hyperspaces and . In these hyperspaces, there is a principal axis (blue) that represents the maximum variance of each data set, as in principal component analysis. However, co-inertia analysis identifies a vector in each hyperspace such that the intersection of their respective projections produces the maximum covariance between both data sets. Source: Own elaboration based on [18] and [19].
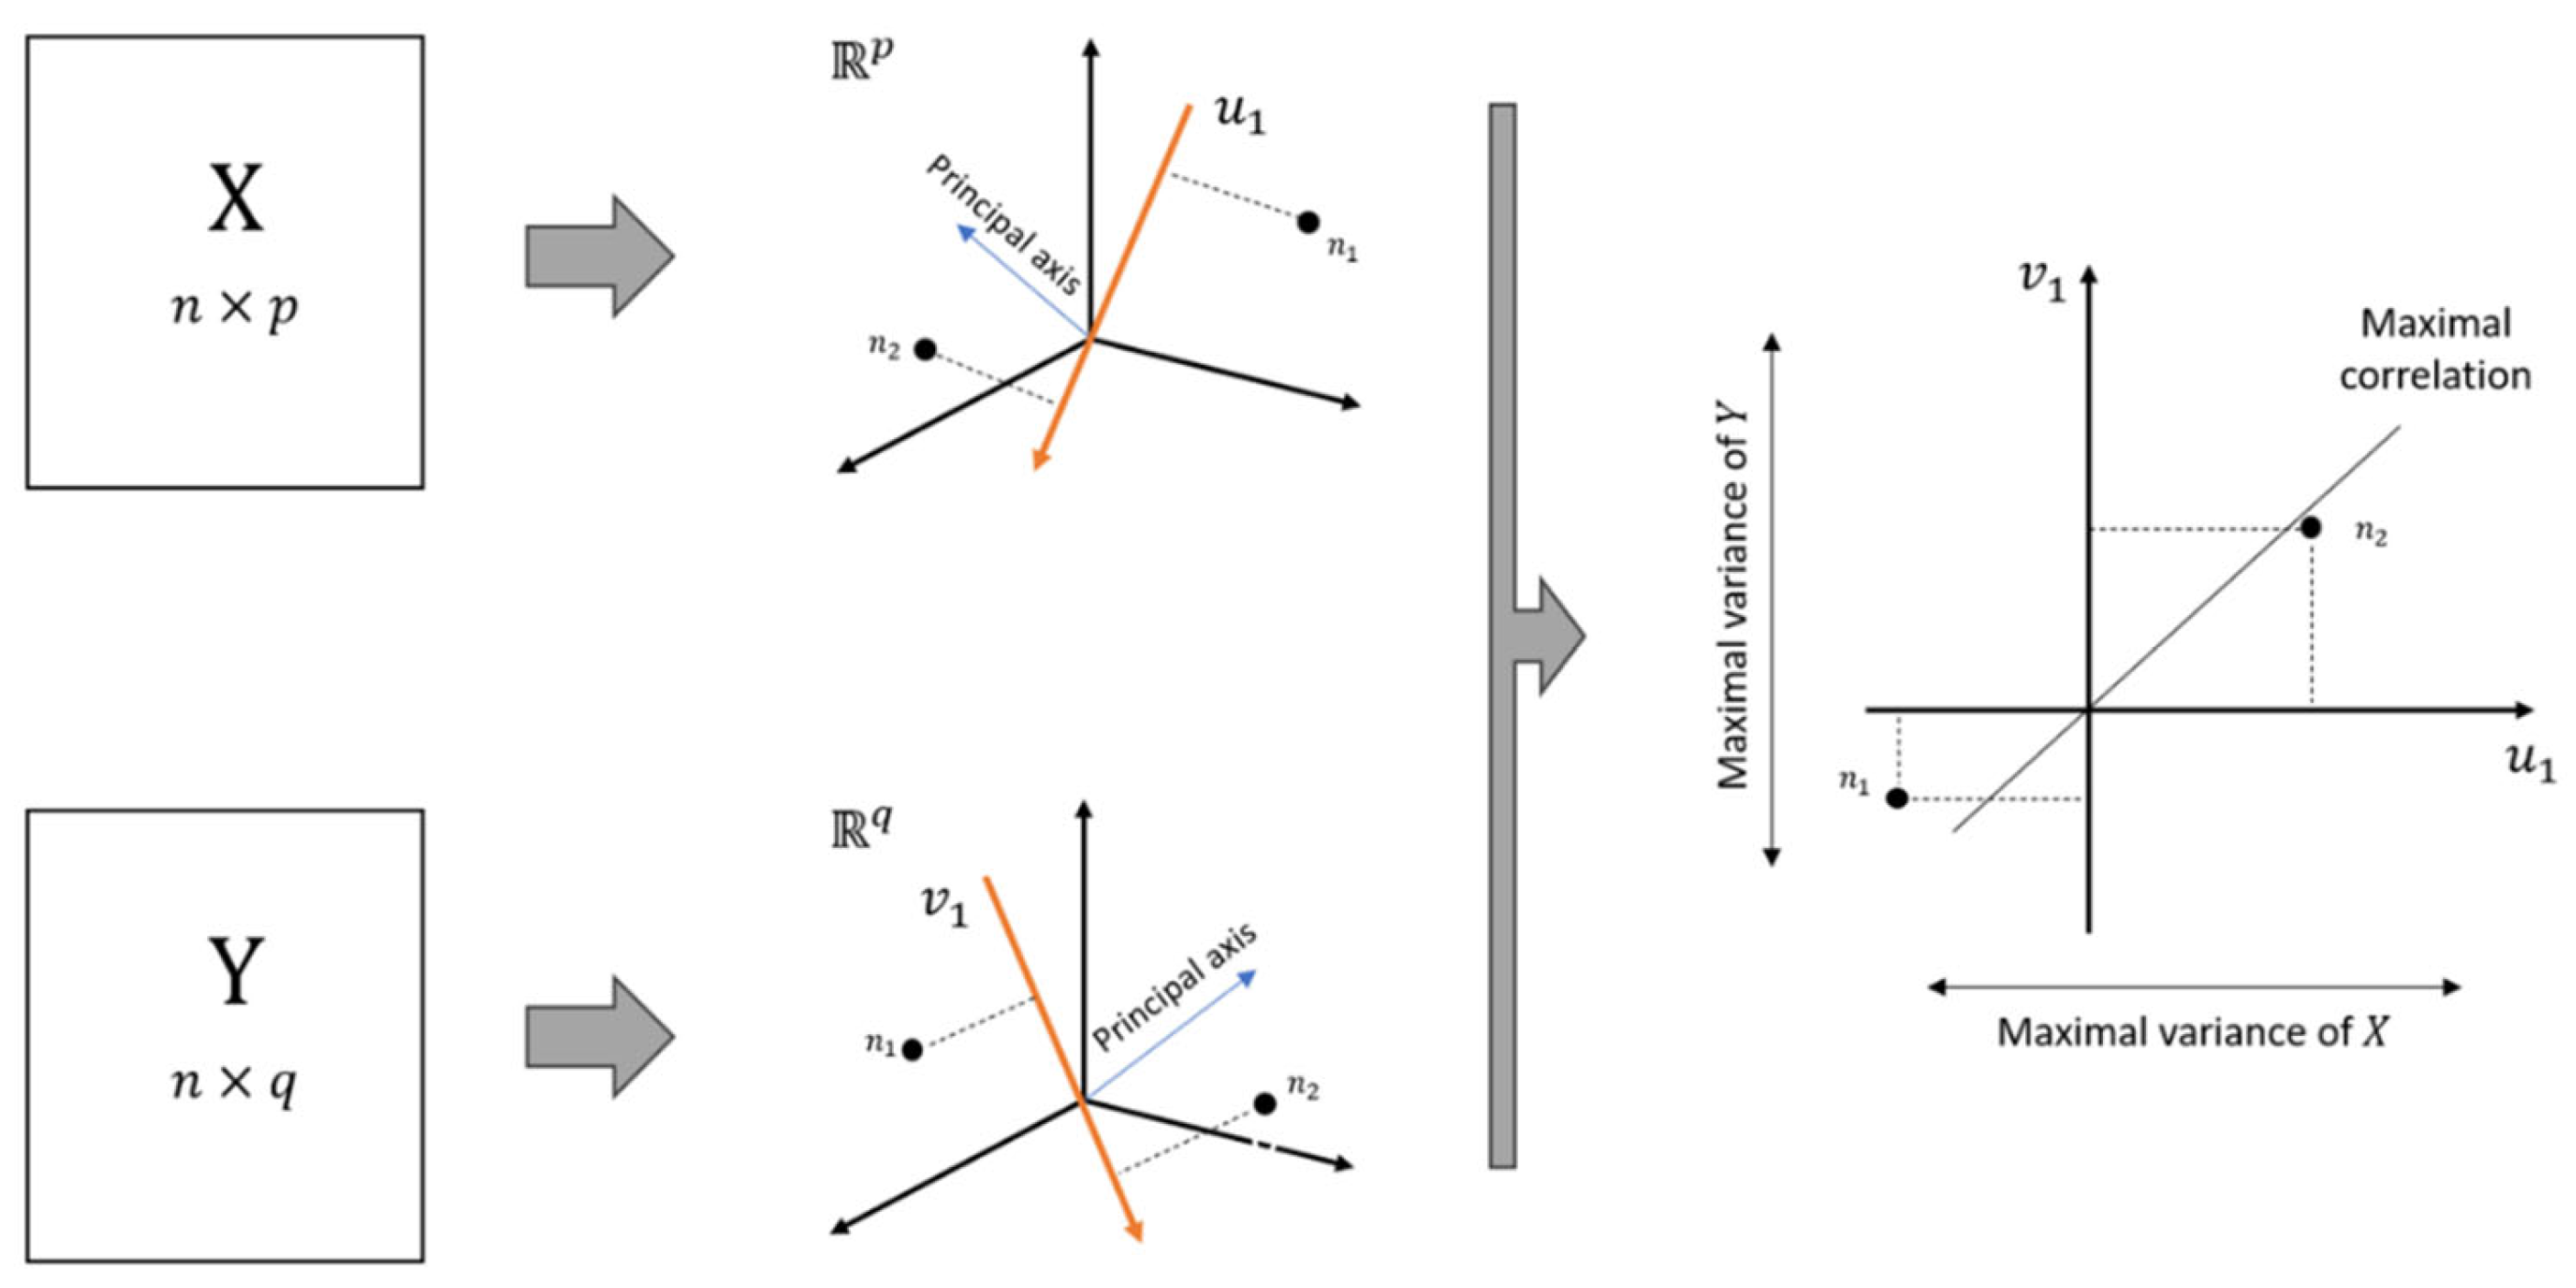
Figure 3.
Flowchart of the STATICO process. The analysis begins with two data cubes ( and ), on which a co-inertia analysis is performed for each matched table. A partial triadic analysis is then applied to the sequence of k tables, which is divided into three phases: interstructure, commitment, and intrastructure.
Figure 3.
Flowchart of the STATICO process. The analysis begins with two data cubes ( and ), on which a co-inertia analysis is performed for each matched table. A partial triadic analysis is then applied to the sequence of k tables, which is divided into three phases: interstructure, commitment, and intrastructure.
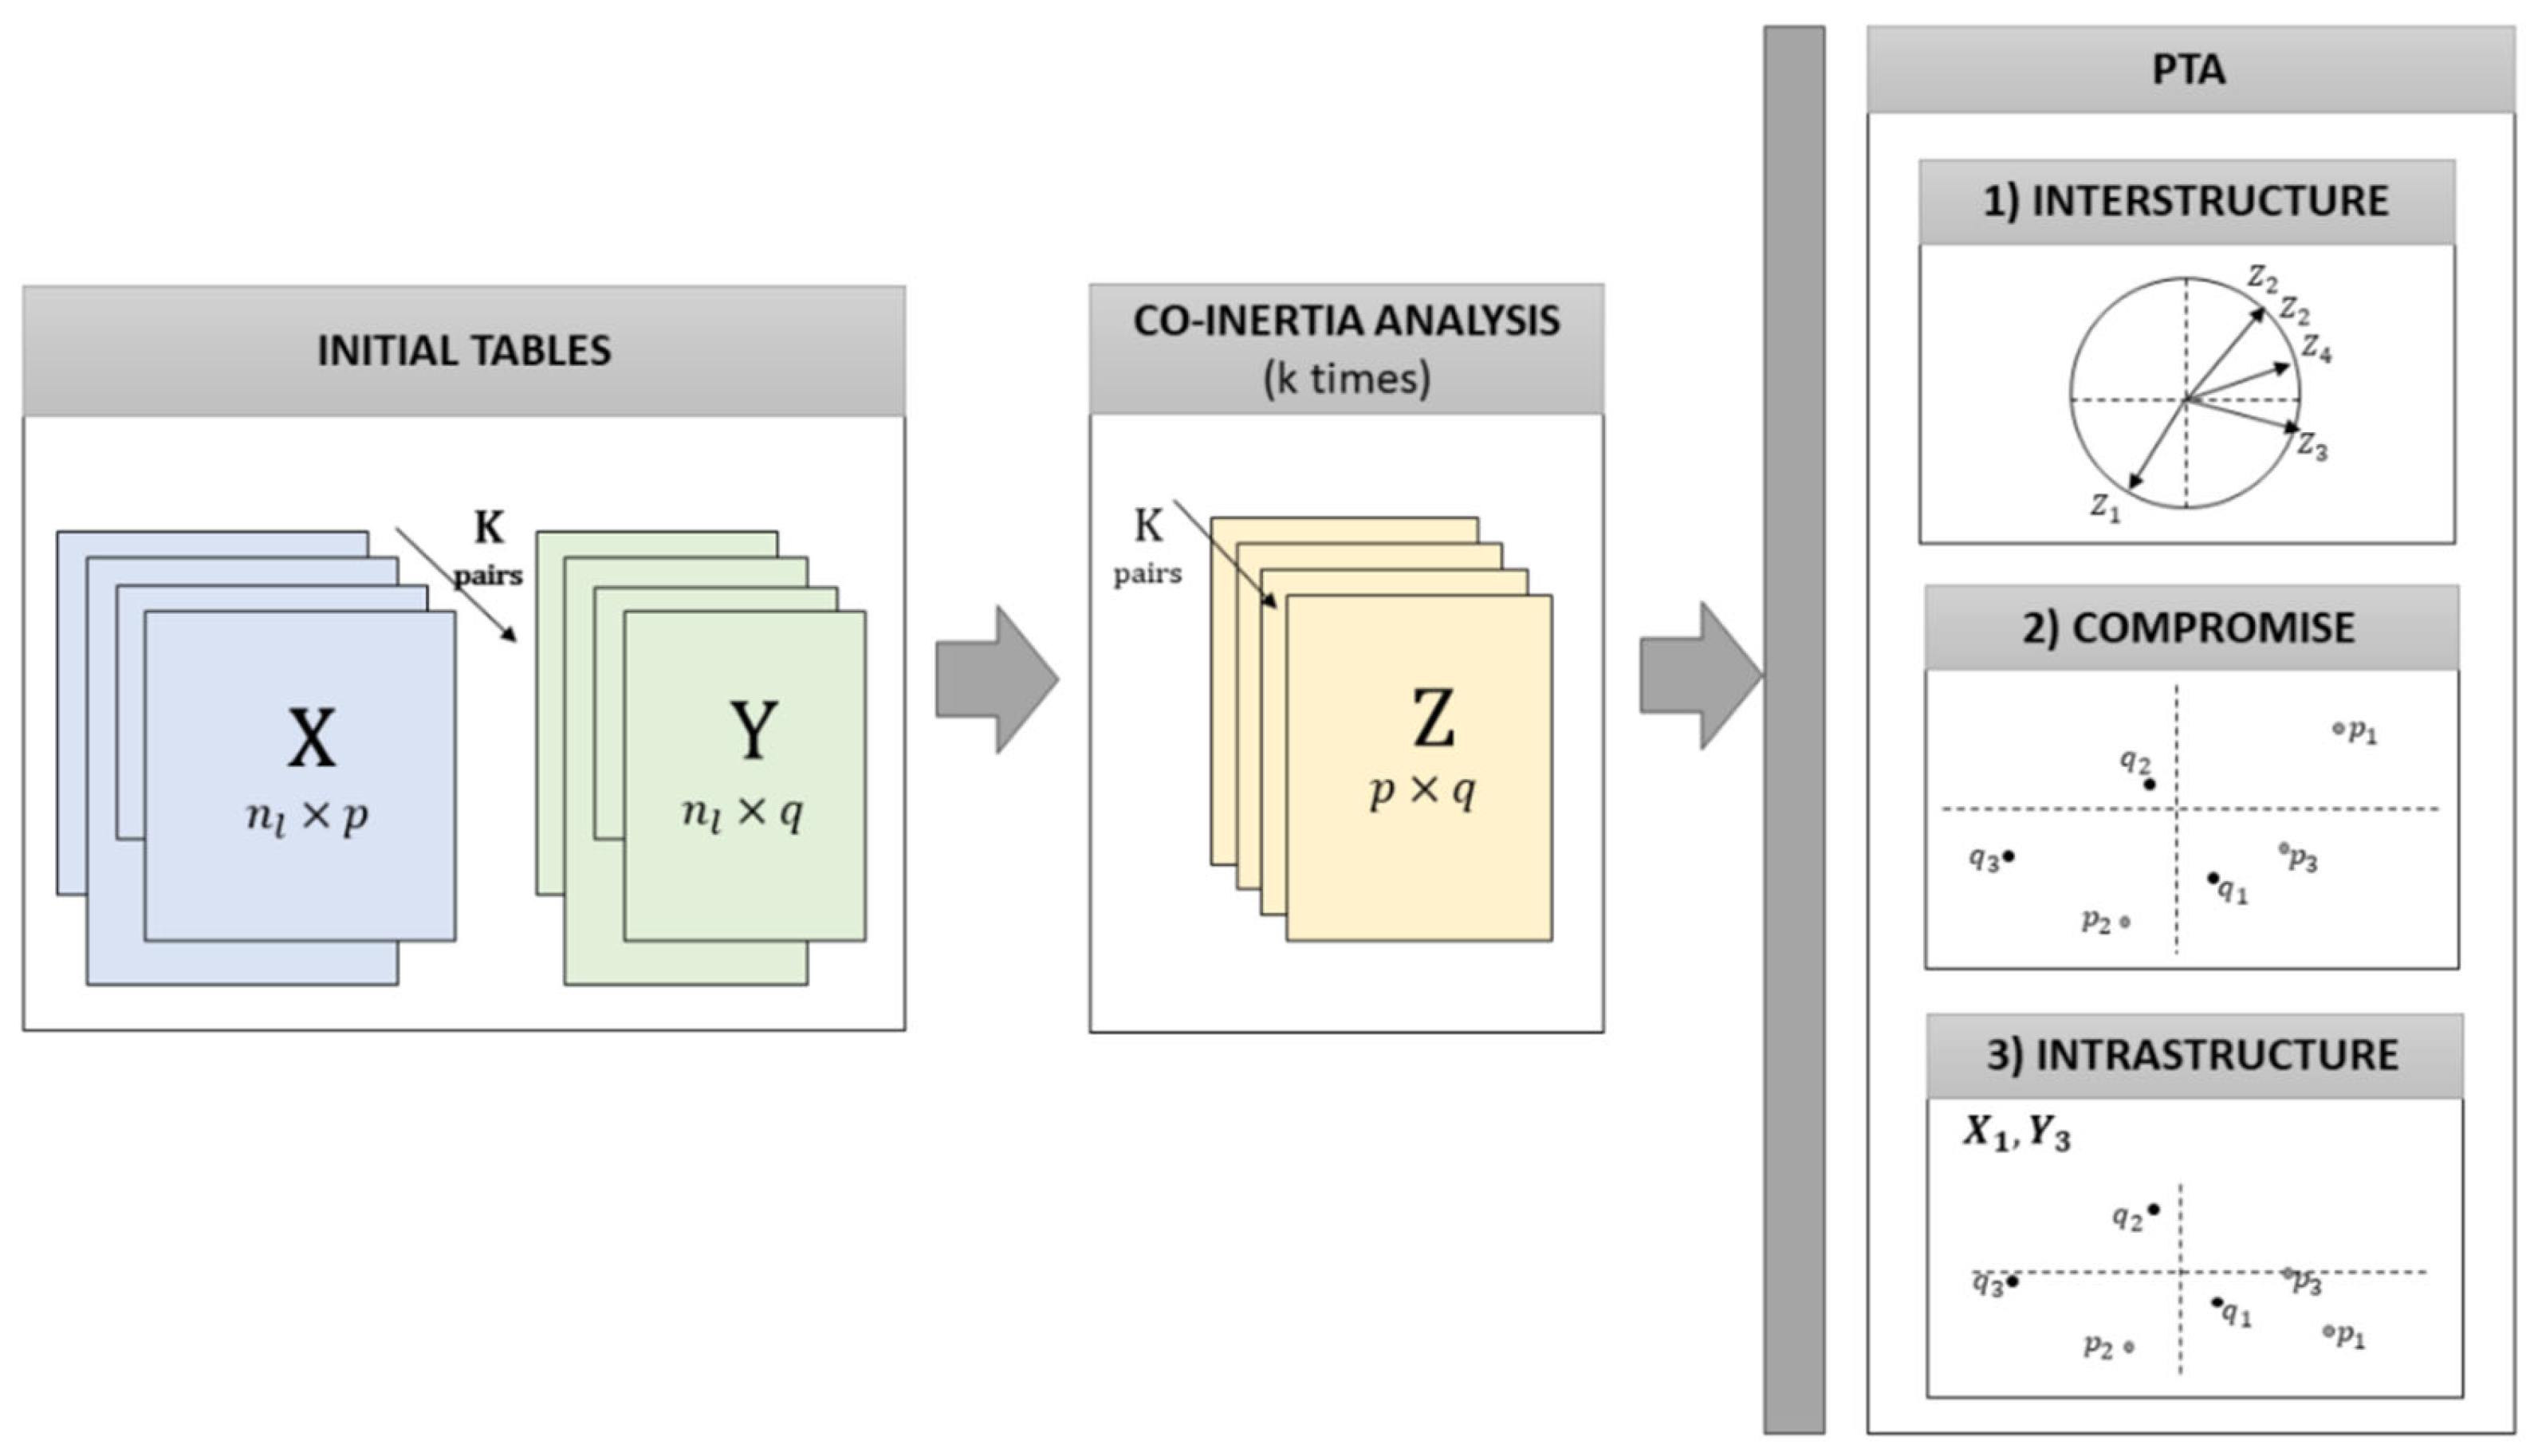
Figure 4.
Flowchart of the proposed methodologies based on a hypothetical model of relationships between constructs.
Figure 4.
Flowchart of the proposed methodologies based on a hypothetical model of relationships between constructs.
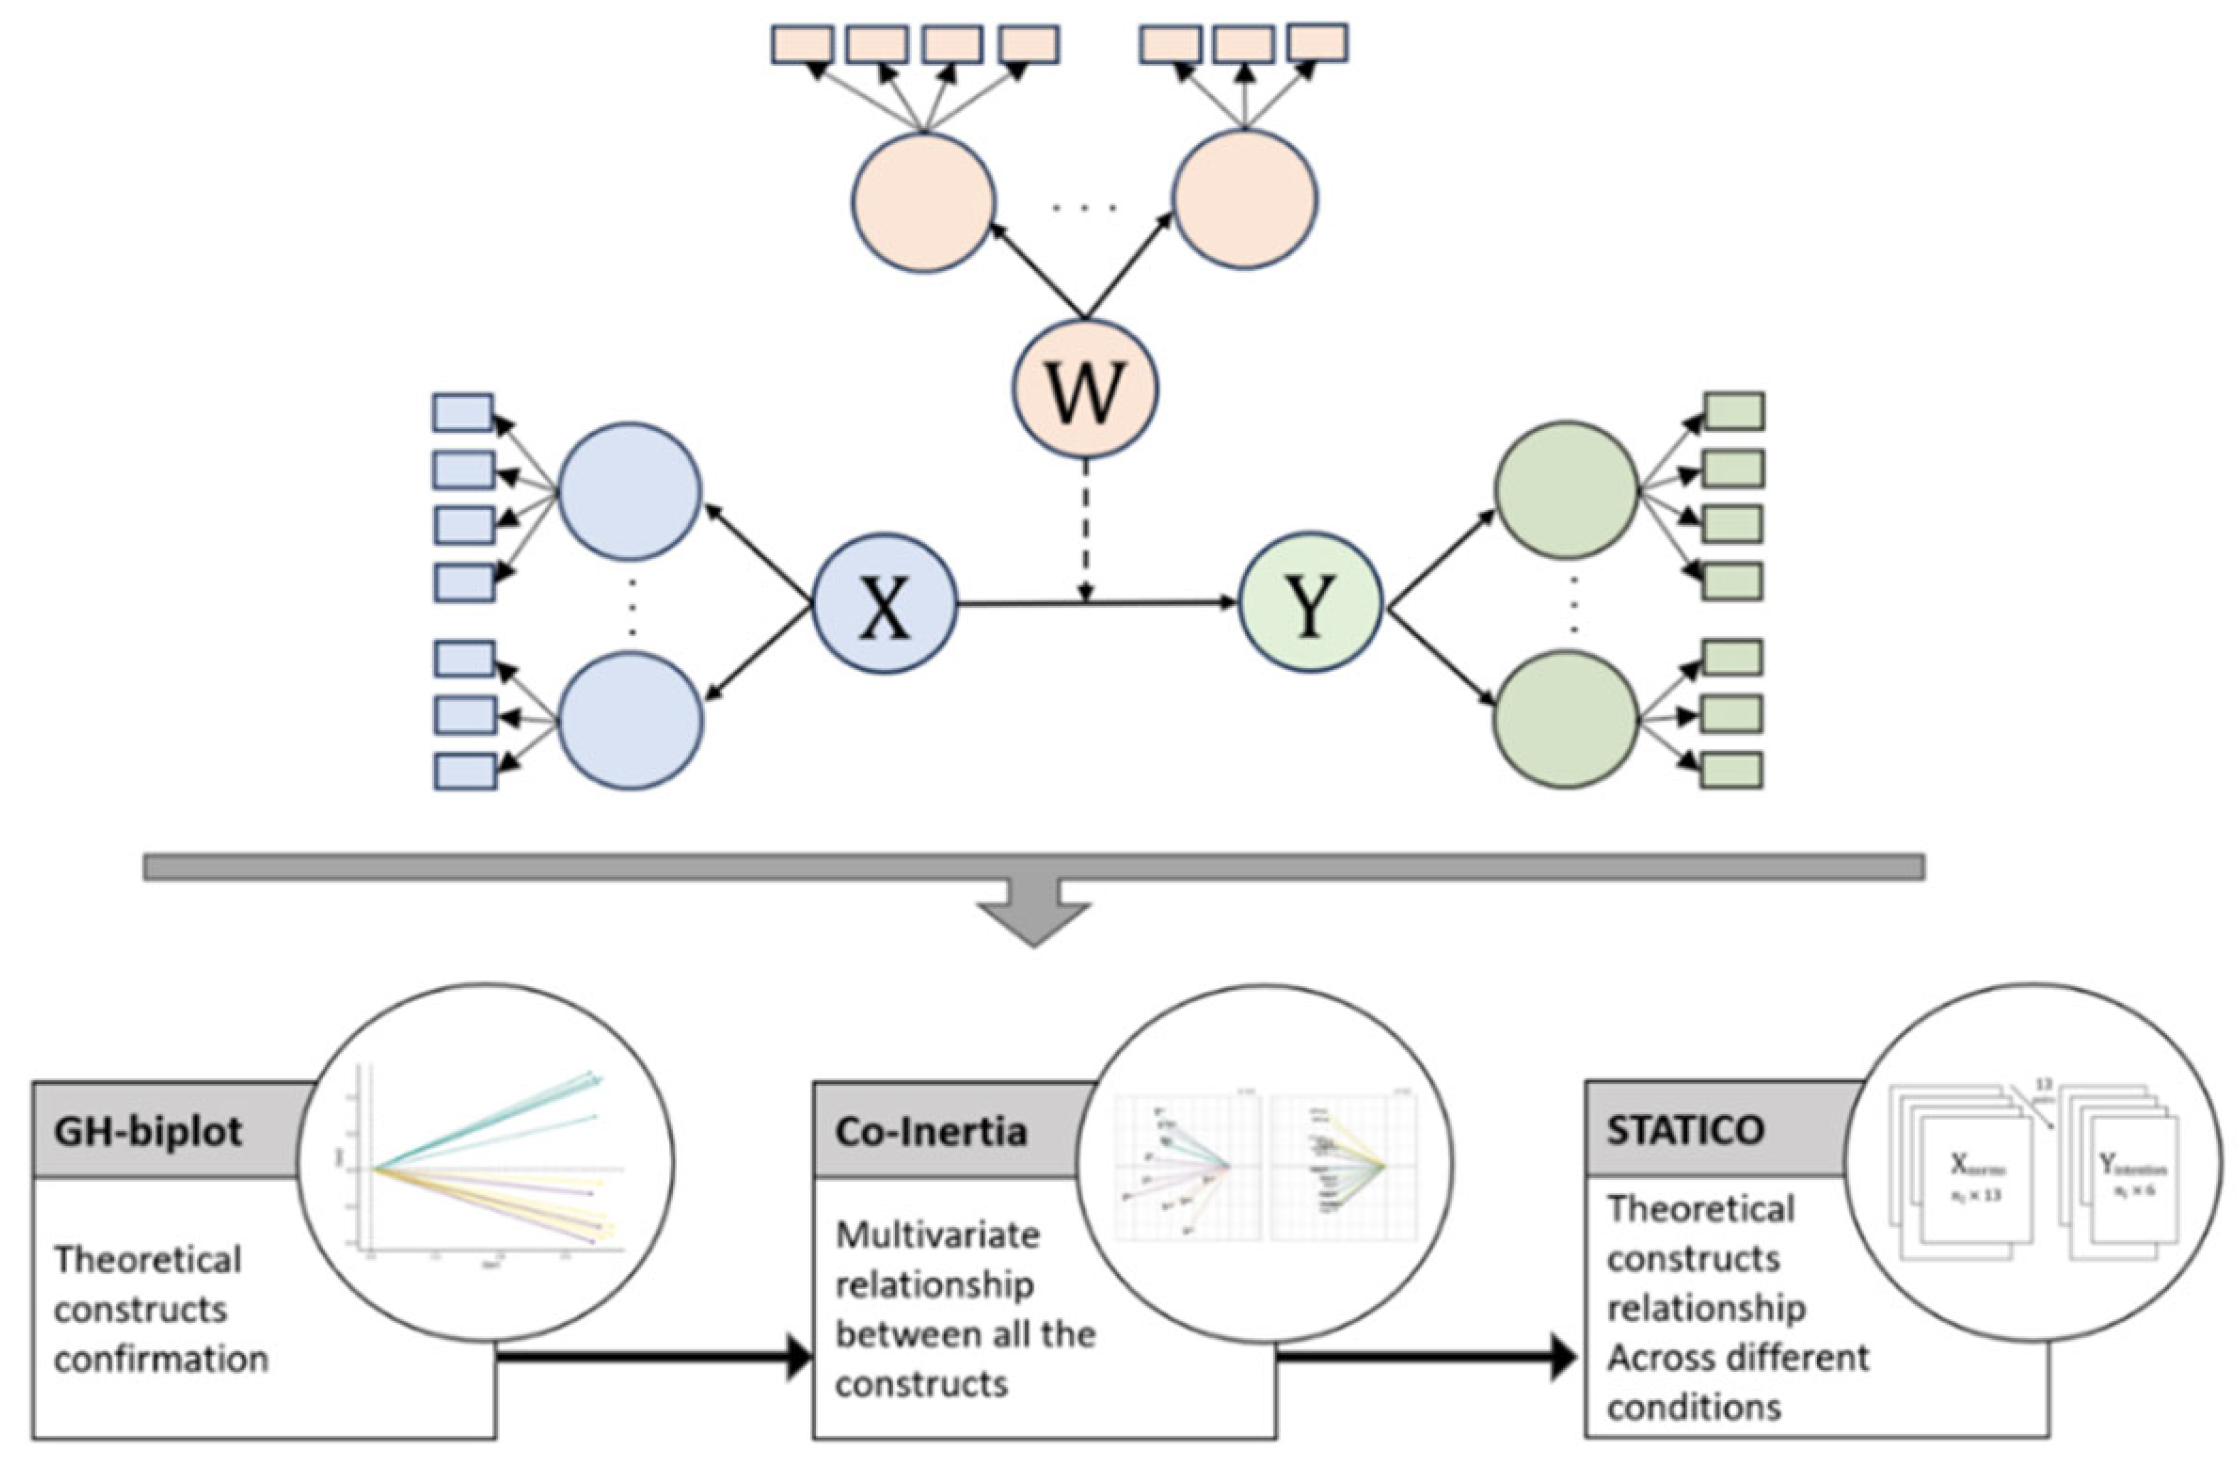
Figure 5.
Graphical representation of the proposed framework. This diagram summarizes the processes by which data sets are analyzed using each of the proposed multivariate techniques. The framework begins with a hypothesis to be tested, which can be evaluated using the proposed methodology.
Figure 5.
Graphical representation of the proposed framework. This diagram summarizes the processes by which data sets are analyzed using each of the proposed multivariate techniques. The framework begins with a hypothesis to be tested, which can be evaluated using the proposed methodology.
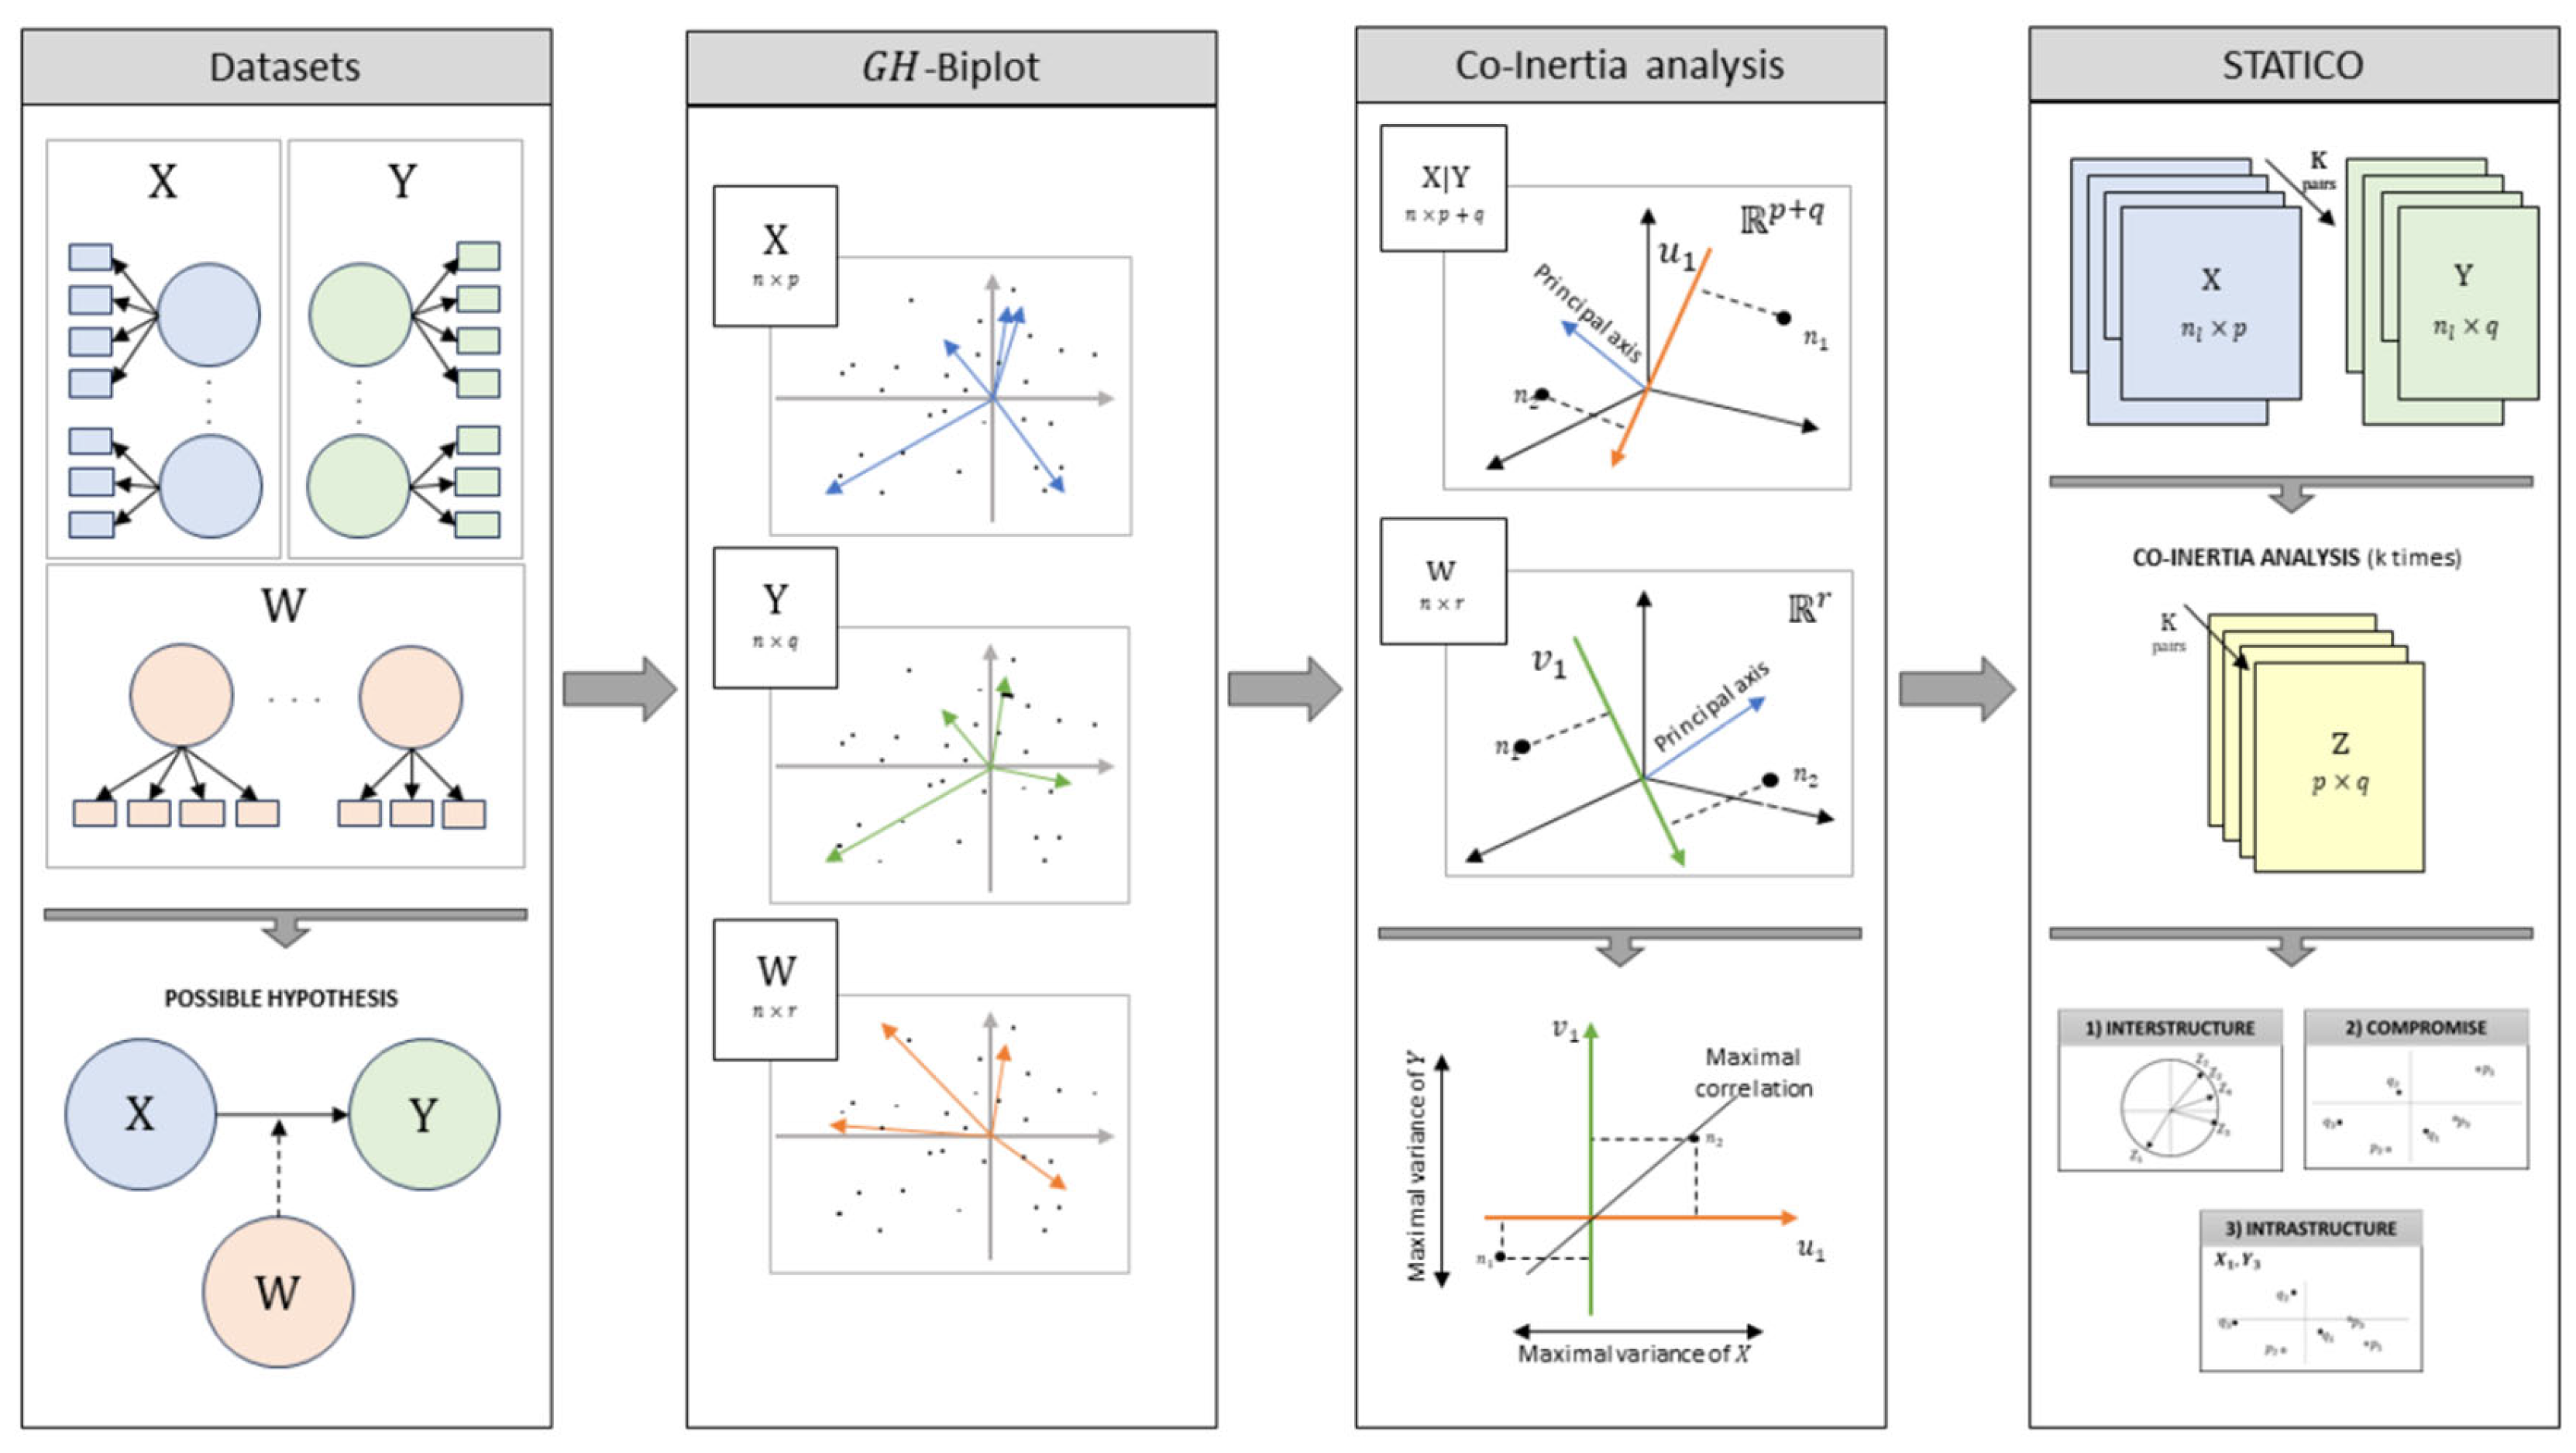
Figure 6.
GH- Biplots of the constructs studied: (A) attitudes and norms towards PPT, (B) intention to participate in PPT and (C) value orientation.
Figure 6.
GH- Biplots of the constructs studied: (A) attitudes and norms towards PPT, (B) intention to participate in PPT and (C) value orientation.
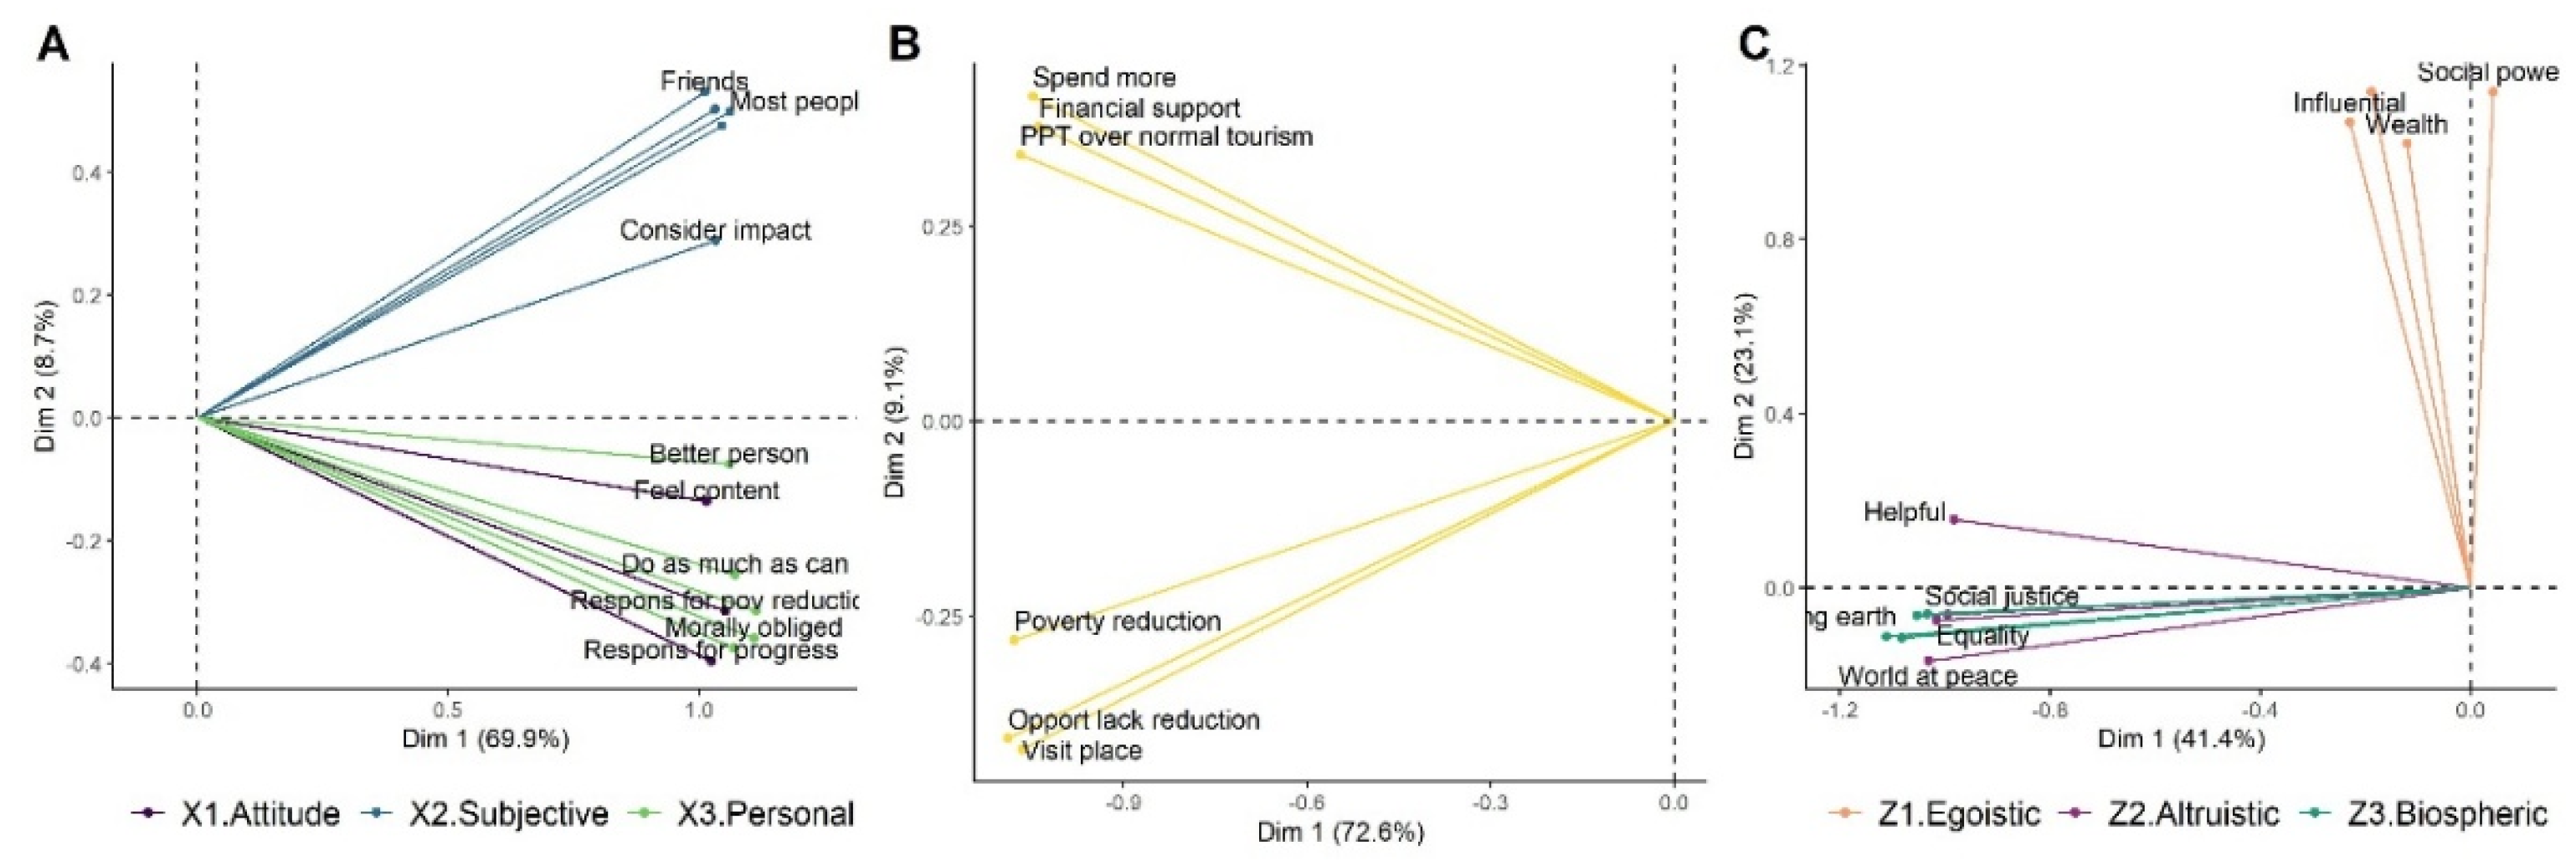
Figure 8.
Results of the interstructure and commitment matrix from the STATICO Analysis. Panel a shows the correlation circle for the interstructure phase. Panels B and C show the configuration of the row and column variables, respectively, in the commitment matrix. Panel D presents the plot of contributions versus weights of the value types in constructing the commitment matrix.
Figure 8.
Results of the interstructure and commitment matrix from the STATICO Analysis. Panel a shows the correlation circle for the interstructure phase. Panels B and C show the configuration of the row and column variables, respectively, in the commitment matrix. Panel D presents the plot of contributions versus weights of the value types in constructing the commitment matrix.
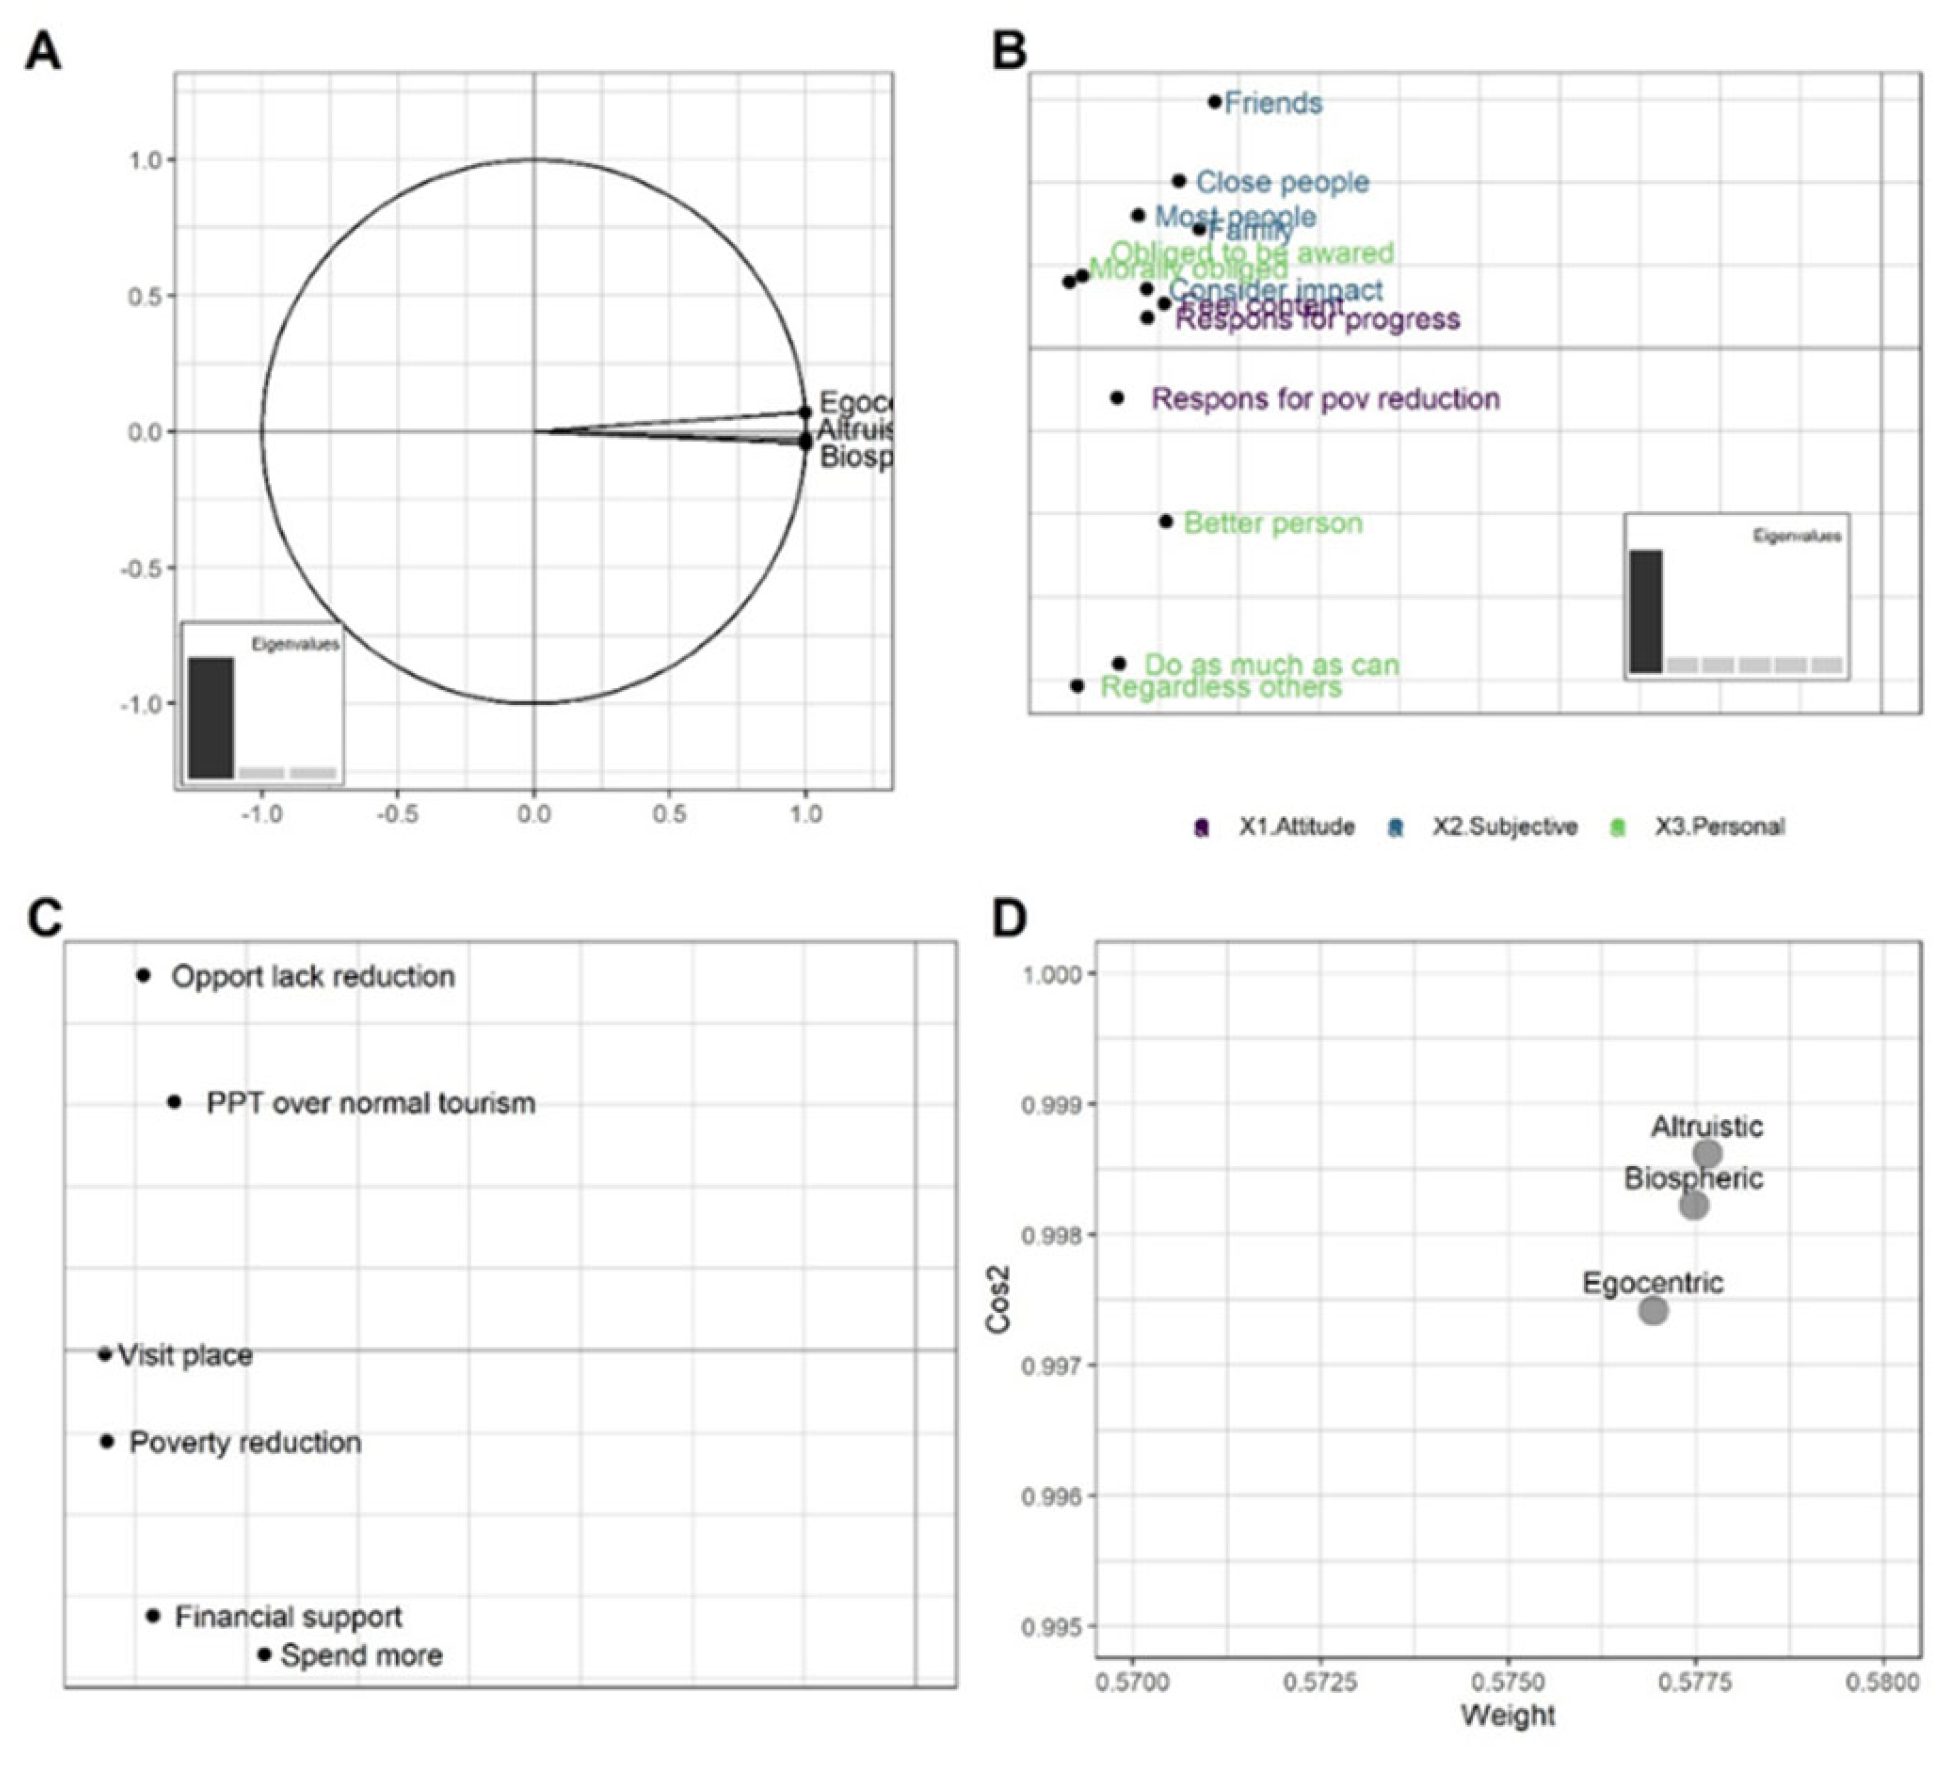
Figure 9.
Projection of rows (Construct of norms and attitude towards PPT) and columns (Construct of intention to participate in PPT) in the commitment matrix.
Figure 9.
Projection of rows (Construct of norms and attitude towards PPT) and columns (Construct of intention to participate in PPT) in the commitment matrix.
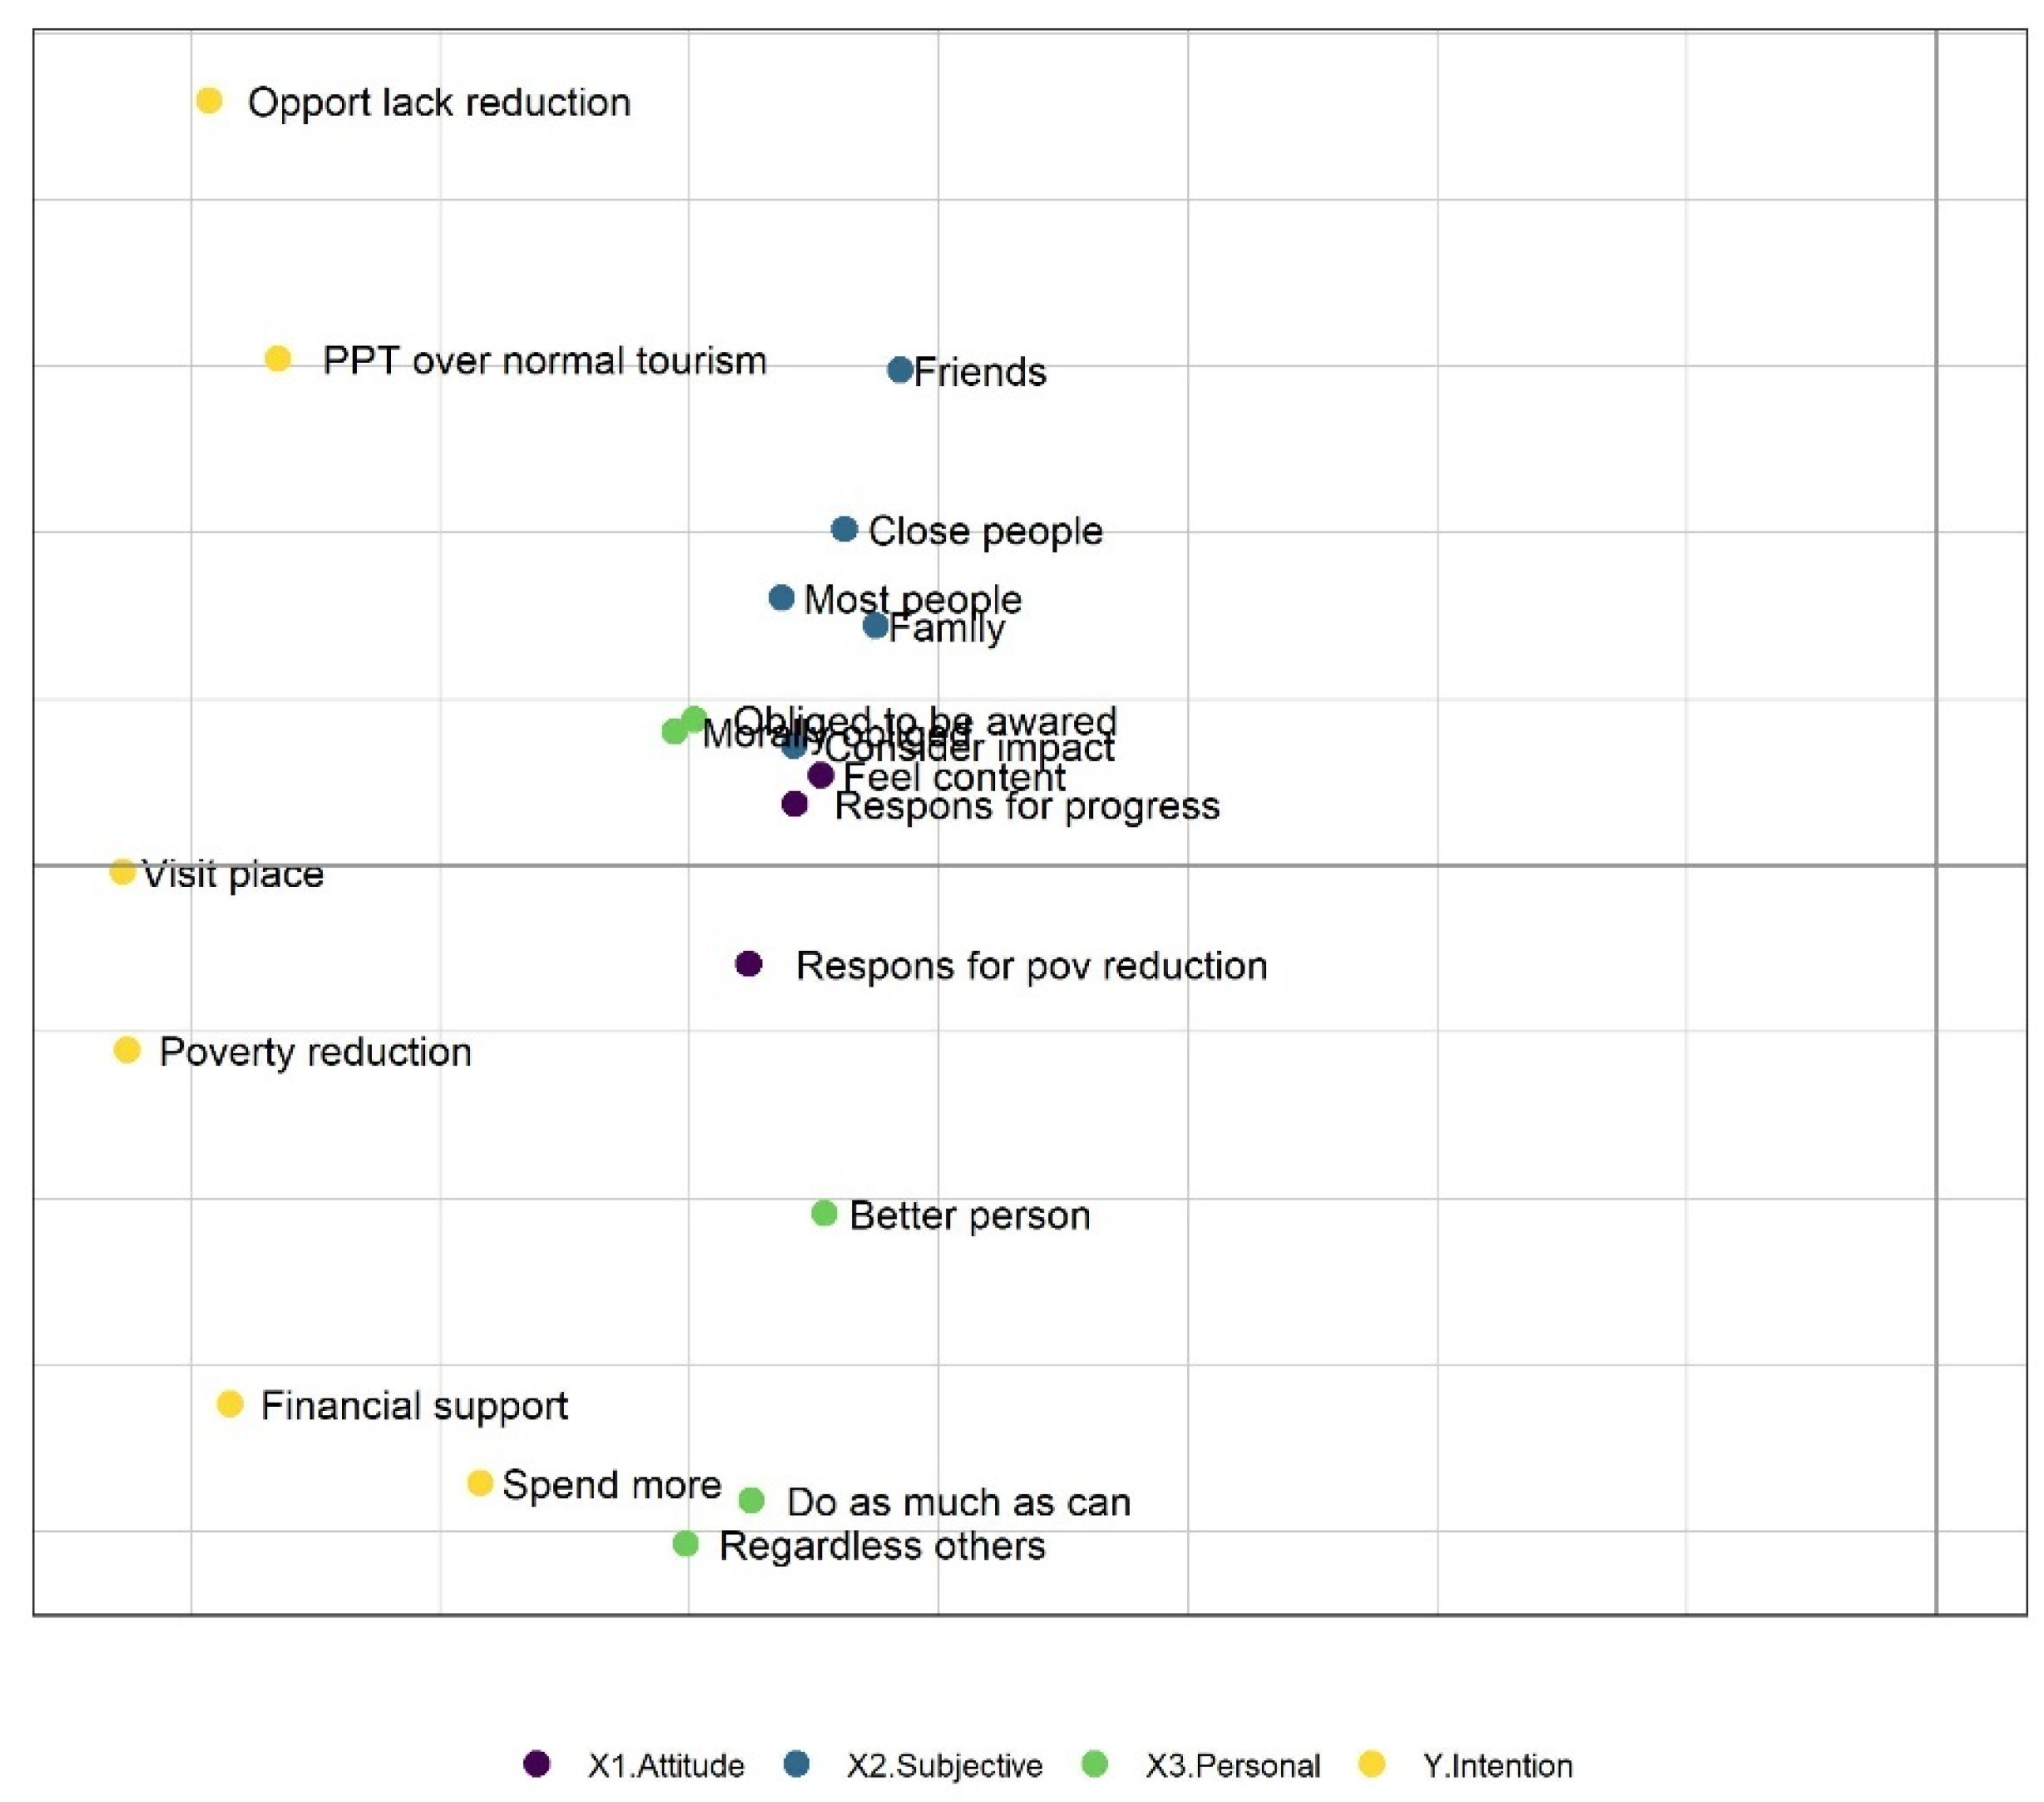
Figure 10.
Projection of rows (norms and attitude toward PPT construct) and columns (intention to participate in PPT construct) for each value type in relation to engagement.
Figure 10.
Projection of rows (norms and attitude toward PPT construct) and columns (intention to participate in PPT construct) for each value type in relation to engagement.
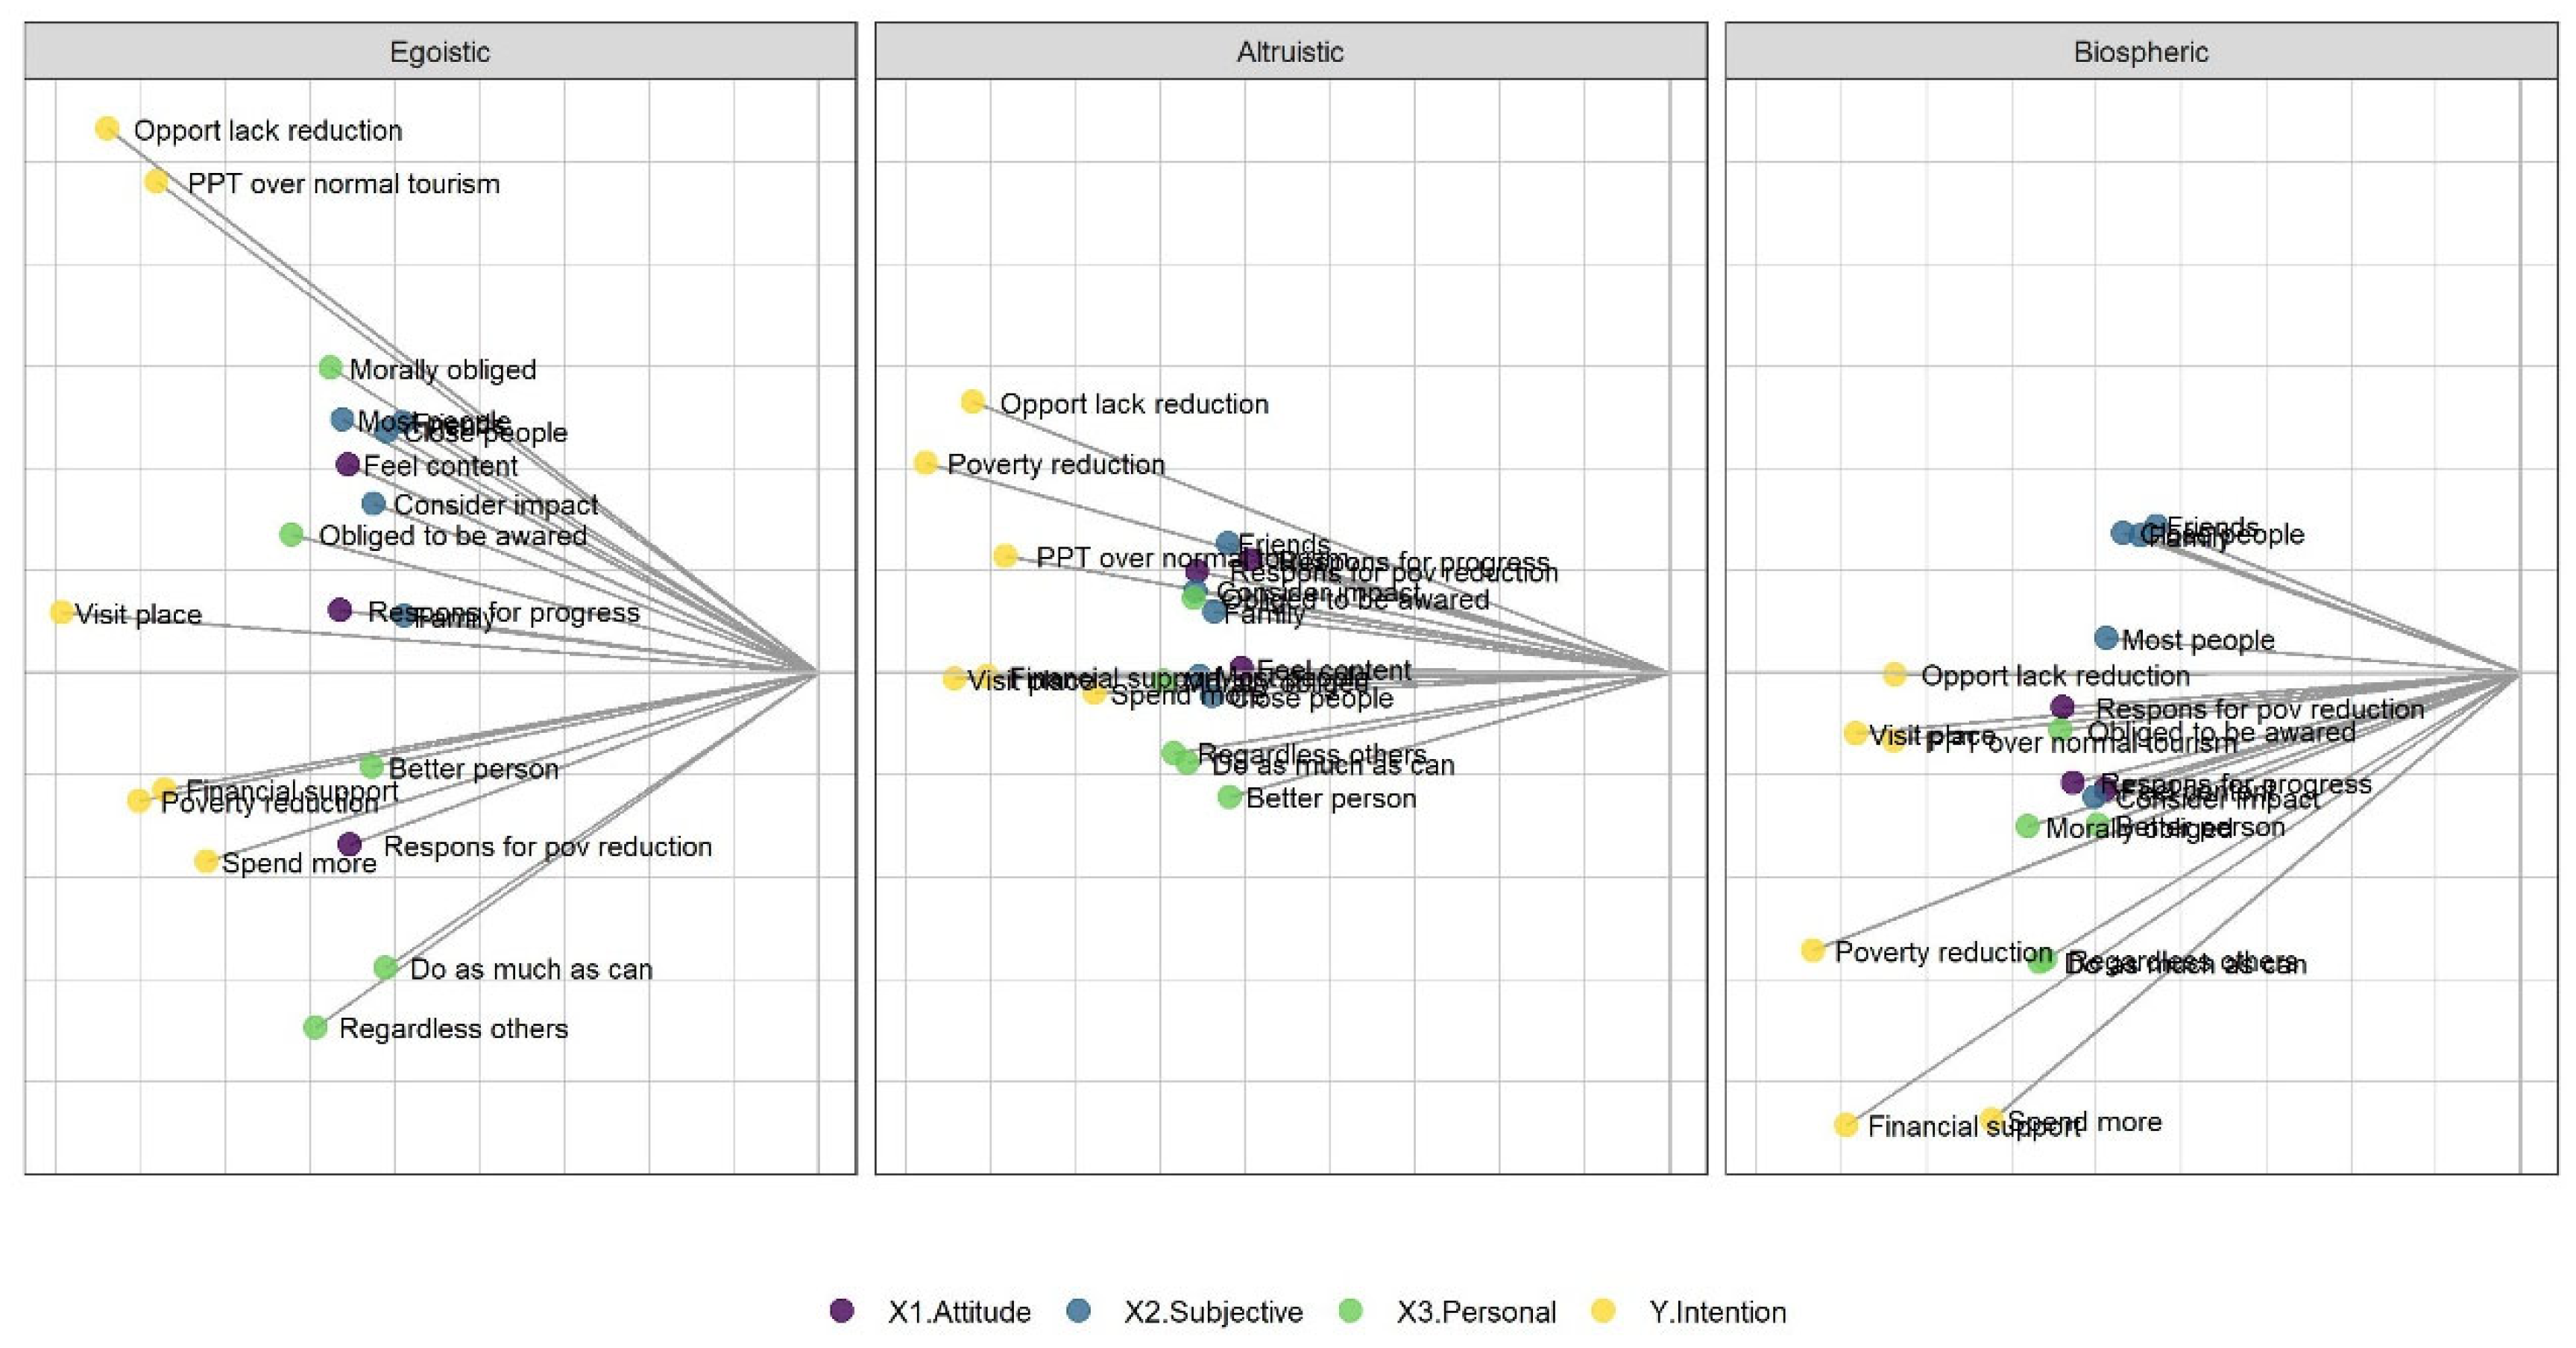
Figure 14.
Weighted Evaluation Coefficients Ranking.
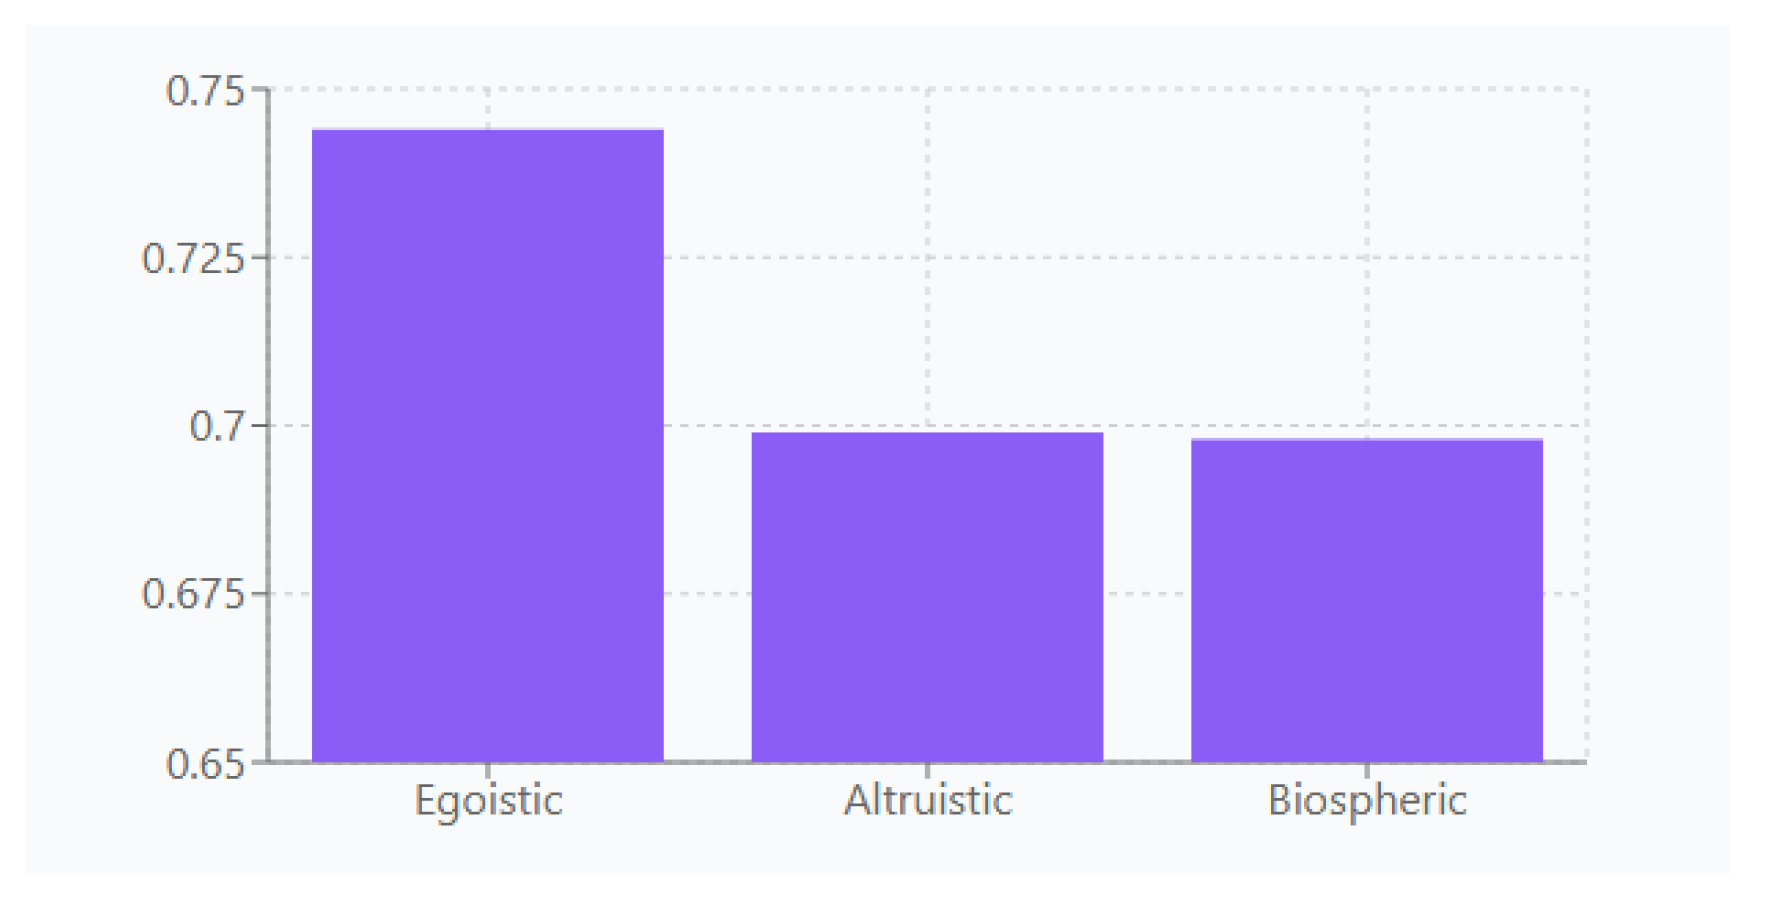
Table 1.
Comparative capabilities of the conventional PLS-SEM approach and the proposed multivariate framework.
Table 1.
Comparative capabilities of the conventional PLS-SEM approach and the proposed multivariate framework.
| Analytical Capability | Conventional PLS-SEM | Proposed Framework |
|---|---|---|
| Validation of causal relationships | ✓ | ✓ |
| Identification of symmetric multivariate structures | ✗ | ✓ |
| Exploratory visualization of latent structures | Limited | ✓ |
| Analysis of covariance relationships | Partial | ✓ |
| Multiblock data integration | ✗ | ✓ |
| Identification of behavioural variability | Limited | ✓ |
| Representation of uncertainty | ✗ | ✓ (Neutrosophic Psychology) |
| Decision-support for tourist segmentation | Moderate | High |
Table 2.
Centroids of the groups obtained for the value factors in the value orientation questionnaire.
Table 2.
Centroids of the groups obtained for the value factors in the value orientation questionnaire.
| Factor (High orientation n; %) |
Items | Average orientation score (out of 5) | |
|---|---|---|---|
| Low | High | ||
| Selfish (111; 27.7%) |
Social power | 2.06 | 4.00 |
| Can | 2.84 | 4.07 | |
| Authority | 2.43 | 4.16 | |
| Influential | 2.78 | 4.23 | |
| Altruistic (208; 52.0%) |
Equality | 3.8 | 4.8 |
| A world at peace | 3.9 | 4.8 | |
| Social justice | 3.5 | 4.7 | |
| Altruistic (208; 52.0%) |
Useful | 3.5 | 4.6 |
| Biosphere (243; 60.8%) |
Prevent pollution | 3.6 | 4.8 |
| Respecting the land | 3.7 | 4.8 | |
| Unity with nature | 3.5 | 4.7 | |
| Protecting the environment | 3.7 | 4.8 | |
Note: Percentages were calculated based on the total sample size (n = 400).
Table 3.
Standardized loadings of the indicator variables for each construct in the models.
| Build | Indicator | Charging | Build () | Indicator | Charging |
|---|---|---|---|---|---|
| X1.Att | Att1 | .874 | Z1.Ego (Model ) | Ego1 | .838 |
| Att2 | .906 | Ego2 | .715 | ||
| Att3 | .896 | Ego3 | .871 | ||
| X2.Sub | Subject 1 | .862 | Ego4 | .867 | |
| Subject 2 | .929 | Z2.Alt (Model ) | Alt1 | .835 | |
| Subject 3 | .908 | Alt2 | .778 | ||
| Subject 4 | .907 | Alt3 | .840 | ||
| Build | Indicator | Charging | Build ( ) | Indicator | Charging |
| Subject 5 | .901 | Alt4 | .836 | ||
| Build | Indicator | Charging | Build () | Indicator | Charging |
| X3.By | Person 1 | .855 | Z3.Bio (Model ) | Biography1 | .855 |
| Pers2 | .932 | Bio2 | .862 | ||
| Pers3 | .897 | Bio3 | .849 | ||
| Pers4 | .904 | Bio4 | .890 | ||
| Pers5 | .927 | ||||
| Y.Int | Presentation 1 | .865 | |||
| Presentation 2 | .855 | ||||
| Presentation 3 | .870 | ||||
| Presentation 4 | .834 | ||||
| Presentation 5 | .834 | ||||
| Presentation 6 | .855 |
Note: X1. Att: Attitude towards PPT, X2.Sub: Subjective norm, X3.Per: Perceived control or personal norm, Y.Int: Intention to participate in PPT, Z1.Ego: Egoistic value orientation, Z2.Alt: Altruistic value orientation, Z3.Bio: Biospheric value orientation.
Table 4.
Reliability and validity statistics for constructs in all models.
| Build | California | CR | AVE | Build () | California | CR | AVE |
| X1.Att | .871 | .921 | .796 | Z1.Ego (Model ) | .848 | .894 | .681 |
| X2.Sub | .942 | .956 | .813 | Z2.Alt (Model ) | .843 | .893 | .677 |
| X3.By | .943 | .957 | .816 | Z3.Bio (Model ) | .887 | .922 | .747 |
| Y.Int | .925 | .941 | .726 |
Note: CA: Cronbach's Alpha, CR: Composite Reliability, AVE: Average Variance Extracted; X1.Att: Attitude towards the PPT, X2.Sub: Subjective Norm, X3.Per: Perceived Control or Personal Norm, Y.Int : Intention to Participate in the PPT, Z1.Ego: Egoistic Values Orientation, Z2.Alt: Altruistic Values Orientation, Z3.Bio: Biosphere Values Orientation. The thresholds recommended by the scientific literature are ≥ 0.70 for CA and CR, and ≥ 0.50 for AVE.
Table 5.
Discriminant validity of constructs based on the heterotrait-monotrait relationship (HTMT).
Table 5.
Discriminant validity of constructs based on the heterotrait-monotrait relationship (HTMT).
| Build | X1.Att | X2.Sub | X3.By | Y.Int |
| X2.Sub | .809 | |||
| X3.By | .972 | .815 | ||
| Y.Int | .829 | .766 | .824 | |
| Z1.Ego (Model ) | .327 | .338 | .327 | .264 |
| Z2.Alt (Model ) | .539 | .490 | .520 | .568 |
| Z3.Bio (Model ) | .418 | .421 | .393 | .489 |
Note: X1.Att: Attitude towards PPT, X2.Sub: Subjective norm, X3.Per: Perceived control or personal norm, Y.Int: Intention to participate in PPT, Z1.Ego: Egoistic value orientation, Z2.Alt: Altruistic value orientation, Z3.Bio: Biospheric value orientation.
Table 6.
Path coefficients of the structural diagram for each of the models.
| Model : Selfish | Model : Altruistic | Model : Biospheric | ||||
| Hypothesis | Correlation coefficient (95% CI) |
p-val | Correlation coefficient (95% CI) |
p-val | Correlation coefficient (95% CI) |
p-val |
| X1.Att → Y.Int | .239 (.110, .372) | <.001 | .200 (.062, .322) | <.001 | .196 (.049, .325) | <.001 |
| X2.Sub → Y.Int | .281 (.186, .381) | <.001 | .252 (.157, .355) | <.001 | .250 (.154, .357) | <.001 |
| X3.By → Y.Int | .350 (.206, .479) | <.001 | .327 (.181, .472) | <.001 | .350 (203, .494) | <.001 |
| Z yo → Y.Int | -.018 (-.087, .046) | .302 | .150 (.080, .221) | .280 | .139 (.075, .200) | <.001 |
| X1.Att * Z i → Y.Int | .152 (-.029, .323) | .049 | -.044 (-.192, .097) | .280 | -.027 (-.150, .088) | .329 |
| X2.Sub * Zi → Y.Int | .027 (-.086, .134) | .315 | .042 (-.088, .146) | .245 | -.087 (-.180, -.005) | .027 |
| X3.By * Z i → Y.Int | -.140 (-.316, .054) | .075 | -.013 (-.160, .165) | .439 | .072 (-.044, .204) | .133 |
Note: X1.Att: Attitude towards the PPT, X2.Sub: Subjective norm, X3.Per: Perceived control or personal norm, Y.Int: Intention to participate in the PPT, Z1.Ego: Egoistic orientation towards values, Z2.Alt: Altruistic orientation towards values, Z3.Bio: Biospheric orientation towards values. Confidence intervals and p-values associated with the coefficients were obtained using 1000 bootstrap samples.
Table 7.
Summary of evaluation criteria for complex models using PLS-SEM and the proposed methodology.
Table 7.
Summary of evaluation criteria for complex models using PLS-SEM and the proposed methodology.
| Criterion | PLS-SEM | Proposed methodology |
|---|---|---|
| Article reliability | Standardized loads > .708 | Length of the element vector represented in the GH-Biplot |
| Internal consistency reliability | Cronbach's alpha and composite reliability > .700 | Acute angles between vectors representing the same dimension in the GH-Biplot |
| Convergent validity | Average Variance Extracted (AVE) > .500 | Percentage of variability explained by the reduced plane in the GH-Biplot |
| Criterion | PLS-SEM | Proposed methodology |
| Discriminant validity | Heterotrait-monotrait ratio (HTMT) <.900 | Right or obtuse angles between vectors representing different dimensions in the GH-Biplot |
| Relationship between factors | Significant coefficients in the structural diagram | Angles between vectors of independent and dependent constructs in COIA |
| Effect of the moderating variable | Significant coefficients in the structural diagram | Interstructure analysis in STATICO |
Table 8.
Neutrosophic triplets for value orientations.
| Orientation | T (Truth) | I (Indeterminacy) | F (Falsehood) | Proportion (%) |
|---|---|---|---|---|
| Biospheric | 0.96 | 0.146 | 0.72 | 60.8 |
| Altruistic | 0.94 | 0.104 | 0.74 | 52.0 |
| Selfish | 0.824 | 0.088 | 0.506 | 27.7 |
Disclaimer/Publisher’s Note: The statements, opinions and data contained in all publications are solely those of the individual author(s) and contributor(s) and not of MDPI and/or the editor(s). MDPI and/or the editor(s) disclaim responsibility for any injury to people or property resulting from any ideas, methods, instructions or products referred to in the content. |
© 2026 by the authors. Licensee MDPI, Basel, Switzerland. This article is an open access article distributed under the terms and conditions of the Creative Commons Attribution (CC BY) license (http://creativecommons.org/licenses/by/4.0/).
Copyright: This open access article is published under a Creative Commons CC BY 4.0 license, which permit the free download, distribution, and reuse, provided that the author and preprint are cited in any reuse.


