

Submitted:
07 July 2026
Posted:
08 July 2026
You are already at the latest version
Abstract
Background: Prognostic heterogeneity among patients with stage I-IIIA non-small cell lung cancer (NSCLC) following curative-intent resection limits the utility of anatomical staging alone. We evaluated the prognostic value of the C-reactive protein-albumin-lymphocyte-monocyte (CALM) index as an integrative biomarker for overall survival (OS) in this population. Methods: This retrospective study included 533 patients with stage I-IIIA NSCLC. We assessed the association between the CALM index and OS using multivariable Cox proportional hazards models, adjusted for established clinicopathological factors. To ensure model robustness, we utilized Least Absolute Shrinkage and Selection Operator (LASSO)-penalized Cox regression for variable selection. Predictive performance was comprehensively evaluated using Harrell's concordance index (C-index), integrated area under the curve (iAUC), integrated discrimination improvement (IDI), and decision-curve analysis (DCA). Results: The CALM index was identified as a stable, independent predictor of OS across both conventional and LASSO-penalized models. The final prognostic model included age, American Society of Anesthesiologists physical status, pleural invasion, pathological stage, the modified Shine-Lal index, and the CALM index. Incorporation of the CALM index significantly enhanced model discrimination and risk reclassification at 3 and 5 years, while consistently increasing net clinical benefit across a wide range of threshold probabilities. Conclusions: The CALM index is a biologically plausible, robust, and readily accessible prognostic biomarker that provides incremental prognostic information beyond established factors in patients with resected stage I-IIIA NSCLC. Its integration into postoperative assessment offers a framework for refined prognostic stratification and more individualized clinical decision-making.
Keywords:
immunity
; non-small cell lung cancer
; nutrition
; prognosis
; risk stratification
1. Introduction
Lung cancer remains the leading cause of cancer-related mortality worldwide, with an estimated 2.30 million new cases and 2.04 million deaths in 2023 [1]. Non-small cell lung cancer (NSCLC) accounts for approximately 85% of these cases, with adenocarcinoma serving as the most frequent histological subtype [2]. While the tumor–node–metastasis (TNM) classification has remained the cornerstone of prognostic evaluation and therapeutic decision-making since its inception, anatomical staging often fails to capture the full spectrum of disease biology [3]. Marked heterogeneity in clinical outcomes among patients with identical pathological stages underscores the limitations of stage-based systems in accounting for occult residual disease or aggressive tumor biology following resection. Consequently, recurrence and mortality rates remain substantial even in early-stage NSCLC [4,5,6].
While clinical variables—such as age, smoking history, and performance status—and pathological parameters like tumor size and pleural invasion (PL) offer supplementary prognostic insights, they primarily reflect local tumor extent rather than the systemic tumor–host interactions that critically influence recurrence and survival [5,7,8,9,10,11,12,13,14,15]. These limitations have spurred the search for practical, blood-based biomarkers that complement conventional staging to facilitate personalized prognostic assessment. Routine laboratory markers are particularly attractive due to their cost-effectiveness, reproducibility, and widespread accessibility.
Several laboratory markers have been independently implicated in NSCLC outcomes: C-reactive protein (CRP) as a marker of systemic inflammation; serum albumin as an indicator of nutritional reserve; absolute lymphocyte count (ALC) as a surrogate for adaptive immune competence; and absolute monocyte count (AMC) as a driver of tumor progression via angiogenesis and the recruitment of tumor-associated macrophages [13,16,17,18,19,20]. While these variables each offer prognostic value in surgical NSCLC cohorts [13,16,17,21,22], cancer prognosis is fundamentally shaped by the complex interplay between inflammation, nutrition, and host immunity. Consequently, composite indices that integrate these distinct biological domains may provide superior prognostic resolution compared to single-marker assessments.
The recently introduced CRP–albumin–lymphocyte (CALLY) index has demonstrated prognostic relevance in heterogeneous NSCLC populations [7]. We expanded upon this framework by developing the CRP–albumin–lymphocyte–monocyte (CALM) index. By incorporating AMC, the CALM index captures critical, complementary dimensions—specifically myeloid-driven immunosuppression and tumor-promoting inflammation—not fully represented by the other constituents [23,24]. By synthesizing inflammatory, nutritional, lymphoid, and myeloid domains, the CALM index offers a more comprehensive assessment of the systemic milieu relevant to postoperative outcomes.
Accordingly, this study evaluated the independent prognostic significance, comparative performance, and clinical utility of the CALM index in predicting overall survival (OS) for patients with stage I–IIIA NSCLC undergoing curative-intent surgical resection. We hypothesized that the CALM index would outperform established composite biomarkers and provide prognostic information independent of conventional clinicopathological factors.
2. Materials and Methods
2.1. Patients
This retrospective cohort study included consecutive patients with NSCLC who underwent curative-intent surgical resection at Kyung Hee University Hospital at Gangdong, Seoul, Korea, between January 2009 and October 2024. Preoperative staging was conducted in accordance with institutional protocols and routinely included contrast-enhanced computed tomography (CT) of the chest and abdominopelvic regions, along with positron emission tomography–computed tomography (PET-CT). Pathological stage classification was based on the 8th edition of the American Joint Committee on Cancer system [6]. The postoperative treatment followed contemporary clinical guidelines. Patients with stage II–IIIA disease received adjuvant platinum-based doublet chemotherapy comprising of cisplatin combined with paclitaxel, vinorelbine, or pemetrexed. Adjuvant osimertinib was administered to patients with stage IB disease harboring sensitizing epidermal growth factor receptor mutations (exon 19 deletion or L858R) [25]. Postoperative surveillance consisted of contrast-enhanced chest and abdominopelvic CT performed at 3- to 6-month intervals during the first 3 years, followed by semiannual chest CT for an additional 2 years and annual imaging thereafter.
Patients were eligible for inclusion if they met all of the following criteria: (1) histologically confirmed NSCLC corresponding to stage I–II or selected N2-negative stage IIIA disease [26,27]; (2) completion of standardized preoperative staging, including CT and PET-CT imaging; (3) curative-intent surgical resection with microscopically margin-negative (R0) status [28]; (4) availability of complete baseline clinicopathologic and laboratory data obtained within 7 days prior to surgery; and (5) availability of survival follow-up data, allowing inclusion regardless of follow-up duration, including patients who experienced early postoperative mortality. The median follow-up duration for the entire cohort was 46.4 months. Patients were excluded if they had received neoadjuvant systemic therapy, radiotherapy, or immunotherapy prior to surgery; had pathologically confirmed N2-positive stage IIIA, IIIB, or IV disease; had a concurrent malignancy or a malignancy diagnosed within the preceding 5 years; or had an active infection or connective tissue disorder requiring ongoing treatment at the time of resection.
2.2. Clinical Characteristics
Clinical and pathological data were retrospectively collected from electronic medical records. The recorded demographic factors included age, sex, smoking status, alcohol intake (defined as consumption of alcohol more than once per week) [29], American Society of Anesthesiologists physical status (ASA-PS), and body mass index. Treatment-related data included surgical technique, extent of resection, and administration of adjuvant therapy after surgery. Tumor-specific variables included histological subtype; tumor size; pathological stage; PL (grades 0–3) [30]; lymphatic, vascular, and perineural invasion; and the presence of microscopic residual disease.
Preoperative laboratory measurements obtained during routine clinical assessments included hematological and biochemical variables. Hematological parameters included white blood cell (WBC) count, absolute neutrophil count (ANC), ALC, and AMC. Red blood cell (RBC)-related measures include RBC count, hemoglobin, hematocrit, and erythrocyte indices, namely mean corpuscular volume (MCV), mean corpuscular hemoglobin (MCH), mean corpuscular hemoglobin concentration (MCHC), and the modified Shine–Lal index (mSLI) calculated using MCV and MCH [31]. Platelet evaluation included platelet counts. Biochemical analyses included the measurement of total protein, albumin, total bilirubin, aspartate aminotransferase (AST), alanine aminotransferase (ALT), and CRP levels. The CALM index was calculated as: (β1 × CRP) + (β2 × albumin) + (β3 × ALC) + (β4 × AMC), where β denotes regression coefficient for each variable.
Preoperative laboratory measurements obtained within 7 days before surgery were eligible for analysis; when multiple values were available, the measurement closest to the time of surgery was selected. Blood samples were processed within 1 h of collection in accordance with standardized institutional protocols. Complete blood counts were performed using an automated hematology analyzer (Beckman Coulter LH 1502; Beckman Coulter, Miami, FL, USA) [32,33].
2.3. Statistical Analysis Framework
2.3.1. Definition of Outcome and Data Handling
The primary endpoint was OS, which was defined as the time interval from curative-intent surgical resection to death from any cause. Patients who were alive at the time of their last follow-up were censored on that date. Continuous covariates were modeled on their original scales without categorization to preserve data granularity and optimize the statistical efficiency. Missing data were analyzed using a complete-case approach, excluding patients with missing covariates required for multivariate analyses. Considering the low proportion of missing data, imputation methods to estimate missing values were not performed. All statistical analyses were conducted using R software (version 4.4.0; R Foundation for Statistical Computing, Vienna, Austria) and statistical significance was defined as a two-sided p < 0.05.
2.3.2. Cox Regression–Based Survival Modeling
Associations between the candidate variables and OS were initially evaluated using univariate Cox proportional hazards regression. Variables meeting statistical significance at this stage (p < 0.05) were subsequently included in the multivariable Cox models.
To reduce multicollinearity and minimize overfitting, predictor selection was further refined using least absolute shrinkage and selection operator (LASSO)-penalized Cox regression with cross-validated selection of the penalty parameter (λ). Variables with nonzero coefficients were subsequently included in a refitted multivariable Cox model to obtain the final adjusted estimates. Collinearity among candidate covariates was assessed using variance inflation factors. Proportional hazards assumption was formally evaluated for each predictor and variables that violated this assumption were excluded from the multivariable modeling.
To better delineate risk gradients across continuous predictors, log–relative hazard plots were constructed, recognizing that conventional Cox model hazard ratios (HRs) may inadequately capture non-linear or graded associations. HRs for continuous covariates were expressed per unit increment.
To determine whether the CALM index provides prognostic information beyond that contained within its constituent biomarkers, a series of nested Cox proportional hazards models were constructed and compared. Incremental prognostic value was evaluated using likelihood ratio tests, whereas discriminative performance was quantified using Harrell’s concordance index (C-index). Overall model fit and parsimony were assessed using the Akaike information criterion (AIC). Collectively, these complementary metrics were used to evaluate explanatory contribution, predictive discrimination, and model efficiency.
2.3.3. Data-Driven Identification of Determinants of the CALM Index
A data-driven analytical framework was used to identify the principal clinical and laboratory determinants of the CALM index. First, the CALM index was modeled as a continuous outcome using LASSO regression. This penalized regression approach simultaneously performs variable selection and coefficient shrinkage, thereby reducing model complexity and minimizing the risk of overfitting. Model performance was assessed using the coefficient of determination (R2) and root mean squared error, and the optimal λ was selected through 10-fold cross-validation. Variables with non-zero coefficients at the optimal λ were considered relevant contributors and were subsequently evaluated in conventional multivariable linear regression models.
To explore potential non-linear relationships and higher-order dependencies beyond the assumptions of linear regression, an Extreme Gradient Boosting (XGBoost) model was additionally constructed. Model interpretability was assessed using SHapley Additive exPlanations (SHAP), which quantify the contribution of individual predictors to model output while accommodating complex non-linear effects and variable interdependencies. Feature importance was summarized using both gain-based importance measures and mean absolute SHAP values.
2.3.4. Model Performance Assessment and Clinical Utility
The performance of the finalized full model (FM) was compared with that of two reference models: a baseline model (BM) based solely on the pathological stage and an intermediate model (IM) including identical covariates to the FM, except for the exclusion of the CALM index. The discriminative performance was evaluated using C-index and the integrated time-dependent area under the receiver operating characteristic curve (iAUC). Pairwise comparisons of model performance were conducted using 1,000 bootstrap re-samples. The incremental prognostic value was quantified using the integrated discrimination improvement (IDI) at the 3- and 5-year time points. Clinical utility was examined using decision curve analysis (DCA), which estimates the net benefit across clinically relevant threshold probabilities [34].
To further contextualize the prognostic contribution of the CALM index relative to established composite biomarkers, a series of multivariable Cox models was constructed, with each model incorporating a single biomarker individually—including CALLY index, CRP-to-lymphocyte ratio (CLR), hemoglobin–albumin–lymphocyte–platelet (HALP) score, inflammatory burden index (IBI), lymphocyte-to-monocyte ratio (LMR), monocyte-to-lymphocyte ratio (MLR), neutrophil-to-lymphocyte ratio (NLR), prognostic nutritional index (PNI), systemic immune-inflammation index (SII), and systemic inflammation response index (SIRI)—within an otherwise identical modeling structure equivalent to the IM [7,15,35,36,37,38,39].
An individualized prognostic nomogram was constructed based on the FM. Model stability and predictive accuracy were internally evaluated using 1,000 bootstrap re-samples, with approximately one hundred observations per calibration group. Calibration was performed by comparing the predicted and observed survival probabilities using the calibration plots [34].
3. Results
3.1. Clinicopathological Characteristics of the Patients
The study cohort comprised 533 patients who underwent curative-intent resection for NSCLC. The population was ethnically homogeneous, with the vast majority identified as East Asians (98.1%, n = 523) and a minority identified as Caucasians (1.9%, n = 10). Based on postoperative pathological staging, most patients were classified as stage I (n = 389, 73.0%), followed by stage II (n = 78, 14.6%), and stage IIIA disease (n = 66, 12.4%) (Table 1). The CALM index was calculated using the following weighted linear combination of inflammatory and nutritional biomarkers: the CALM index = (0.015 × CRP [mg/L]) − (1.836 × albumin [g/dL]) − (0.49 × ALC [103/μL]) + (2.05 × AMC [13³/μL]). The weighting coefficients were derived from Cox proportional hazards modeling, reflecting the relative contribution of each component to OS risk.
3.2. Identification and Validation of Independent Predictors of Overall Survival
Univariate Cox proportional hazards analysis showed that a broad range of demographic, clinicopathological, biochemical, hematological, and composite variables were significantly associated with OS. These included age; sex; smoking status; ASA-PS; histological subtype; tumor size; PL; lymphatic, vascular, and perineural invasion; pathological stage; surgical approach; albumin; CRP; WBC; ANC; ALC; AMC; hemoglobin concentration; red cell indices (MCV, MCH, and mSLI); platelet count; and the CALM index.
Following multivariable Cox proportional hazards modeling, several factors demonstrated independent prognostic significance for OS: advanced age (HR 1.07; p < 0.001), higher ASA-PS (HR 1.91; p = 0.001), PL presence (HR 1.56; p < 0.001), elevated pathological stage (HR 2.34; p < 0.001), increased mSLI (HR 1.08; p < 0.001), and elevated CALM index (HR 1.55; p < 0.001). These covariates constituted the FM, which demonstrated strong discriminative performance (C-index = 0.838). Assessment of multicollinearity revealed uniformly low variance inflation factors (range, 1.04–1.18), indicating minimal interdependence among predictors and confirming the robustness and stability of the final model (Figure 1). Interaction testing revealed no significant effect of pathological stage on the relationship between the CALM index and OS (p for interaction = 0.253), supporting the consistency of its prognostic effect across disease stages.
To further contextualize these findings and compare conventional regression with penalized feature selection, LASSO-penalized Cox regression was performed using 10-fold cross-validation. At the λ value corresponding to the minimum cross-validated partial likelihood deviance, the model selected nine variables with non-zero coefficients: age, ASA-PS, PL, pathological stage, mSLI, the CALM index, smoking status, vascular invasion, and perineural invasion. These variables were subsequently incorporated into a refitted conventional multivariate Cox proportional hazards model. In this model, six covariates—age, ASA-PS, PL, pathological stage, mSLI, and CALM index—remained independently associated with OS, demonstrating substantial concordance with the predictors identified in the primary multivariable Cox regression.
In the unadjusted analysis, the CALM index exhibited a clear linear relationship with the log-relative hazard of death (Figure 2A). This association retained an approximately linear pattern after multivariate adjustment for established clinical prognostic factors, including age, ASA-PS, PL, pathological stage, and mSLI (Figure 2B). The consistency of this linear pattern in both the crude and adjusted models indicated a dose–response relationship, whereby increasing CALM values corresponded to a steadily rising mortality risk. These findings support the use of the CALM index as a stable and continuous prognostic indicator of OS in patients with NSCLC.
Three nested Cox proportional hazards models were compared to determine whether the CALM index provides prognostic information beyond its constituent biomarkers. Likelihood ratio testing showed no significant differences between the CALM-based and component-based models (p = 0.688), and the simultaneous inclusion of the CALM and its individual components provided no additional explanatory value (p = 0.968). Although discriminative performance was virtually identical across models (C-index: 0.838), the CALM-based model achieved the lowest AIC (889.45), indicating the most parsimonious fit compared with the component-based (893.98) and combined (895.98) models. By distilling the prognostic signal of four distinct biomarkers into a single, highly parsimonious metric, the CALM index eliminates the need for complex multi-variable calculations, thereby facilitating a more efficient and standardized risk-stratification workflow in clinical practice. Collectively, these findings suggest that the CALM index efficiently captures the prognostic information contained within its constituent biomarkers while reducing model complexity, offering a robust and simplified framework for clinical decision-making. Furthermore, because the calculation is mathematically straightforward, it can be seamlessly embedded into electronic medical record systems, allowing for automated, real-time risk assessment without imposing any additional burden on the clinical team.
3.3. Biological Architecture of the CALM Index: Relative Contributions and Component Interactions
To further elucidate the statistical architecture and biological underpinnings of the CALM index, we applied complementary linear and non-linear modeling approaches, including penalized regression (LASSO), multiple linear regression, and XGBoost with SHAP-based interpretability. Within the LASSO framework, only four variables—CRP (β = 0.0151), albumin (β = −1.8098), ALC (β = −0.4565), and AMC (β = 1.9451)—retained non-zero coefficients, confirming that these biomarkers exclusively define the CALM construct. This finding was corroborated by conventional multiple linear regression analysis, in which all four components remained independently and highly significantly associated with CALM index (all p < 0.001), collectively accounting for virtually all observed variance in the index (R2 = 0.9990).
To independently assess the relative contribution of candidate variables without imposing linear assumptions, we applied an XGBoost model incorporating the full set of candidate clinical and laboratory predictors. Feature importance analysis demonstrated that albumin, CRP, AMC, and ALC were the four most influential variables in predicting risk, whereas all remaining predictors contributed minimally. SHAP-based feature attribution further confirmed the predominance of these four biomarkers in determining CALM values. Based on mean absolute SHAP values, albumin exerted the greatest influence on model predictions (0.534), followed by AMC (0.241), ALC (0.183), and CRP (0.120). The directionality of these effects was biologically coherent: higher albumin and ALC levels were associated with lower predicted CALM values, whereas increasing AMC and CRP levels contributed positively to the index.
Given the dominant contribution of these four biomarkers across both linear and non-linear modeling frameworks, subsequent analyses were directed toward elucidating their individual effects and potential interactions. SHAP dependence analyses were conducted to investigate how these components jointly contribute to prognostic risk and to identify potential effect-modifying relationships. These SHAP dependence plots illustrate the non-linear relationship between individual CALM components and the model-predicted log-hazard (SHAP value). In each panel, the x-axis displays the biomarker concentration, while the y-axis represents the corresponding SHAP contribution. The point color (blue gradient) indicates the value of the interacting variable, AMC, while the red curve represents the smoothed global relationship between the biomarker and its prognostic contribution.
Analysis of the nutritional axis, represented by serum albumin, demonstrated a strong inverse association between albumin levels and risk, consistent with its established role as a marker of physiologic reserve and nutritional status. SHAP dependence analysis revealed that this relationship is significantly modified by AMC. Notably, as albumin levels decrease toward the hypoalbuminemic range (3.0–4.0 g/dL), higher AMC levels (indicated by darker blue points) are associated with higher SHAP-derived risk estimates than those with lower AMC at the same albumin concentration. This indicates that monocytosis exacerbates the prognostic risk associated with declining nutritional status (Figure 3A).
A similar modifying pattern was observed along the immune axis, represented by ALC. Although higher ALC levels were consistently associated with lower risk, elevated AMC shifted SHAP-derived risk estimates upward across the observed range of lymphocyte counts, indicating that monocytosis diminishes the favorable prognostic impact of preserved lymphocyte levels (Figure 3B).
In contrast, analysis of the inflammatory axis, represented by CRP, demonstrated a positive, non-linear association with risk, characterized by an accelerated increase at higher CRP concentrations. SHAP dependence analysis indicated that this prognostic contribution is modulated by the underlying myeloid inflammatory state (AMC). Specifically, while higher AMC exerted a consistent additive risk-boosting effect across the observed range of CRP (0–260 mg/L), the prognostic impact of increasing CRP appeared attenuated in individuals with the highest baseline myeloid activity. These trends were most robustly observed within the clinically representative range of CRP (< 100 mg/L), which accounted for all but two cases in our study population (Figure 3C).
Collectively, these analyses identify AMC as a central, dynamic modifier within the CALM framework. By demonstrating that AMC amplifies hypoalbuminemia-related risk, attenuates the protective effects of lymphocytosis, and exhibits multifaceted interactions with CRP, these findings confirm that the CALM index successfully integrates nutritional, immune, and inflammatory signals into a unified measure of host-related prognostic vulnerability in resected NSCLC.
3.4. Model Comparison for Survival Prediction: FM vs. IM vs. BM
To evaluate the added prognostic value of the CALM index, the FM was compared with two reference models: BM and IM. FM demonstrated markedly superior discriminative performance, achieving a C-index of 0.838 (standard error [SE] = 0.021), exceeding that of the BM (0.690, SE = 0.027). Consistent results were observed for time-integrated discrimination, with an iAUC of 0.799 (SE = 0.018) for FM and 0.655 (SE = 0.025) for BM (both p < 0.001). Measures of reclassification further supported the added prognostic value of FM, with IDI values of 0.242 at 3 years and 0.218 at 5 years compared with BM (both p < 0.001), indicating sustained improvement in long-term risk prediction.
In contrast to the IM, which yielded a C-index of 0.816 (SE = 0.024) and iAUC of 0.787 (SE = 0.019), FM also showed statistically significant gains in discriminative accuracy (p < 0.001 for both metrics). The inclusion of the CALM index resulted in meaningful improvements in risk reclassification, as reflected by the IDI values of 0.056 at 3 years (p < 0.001) and 0.039 at 5 years (p = 0.024). Together, these findings demonstrate that the incorporation of the CALM index conferred a consistent and incremental enhancement in prognostic performance beyond established clinical predictors (Table 2).
A DCA showed that FM consistently yielded a higher net clinical benefit than either IM and BM models across a wide range of threshold probabilities for 3- and 5-year OS predictions. Throughout the clinically relevant decision thresholds, FM maintained higher net benefit values, reflecting a more effective separation of patients at elevated vs. low mortality risk (Figure 4). These results indicated that the utilization of FM has the potential to improve clinical decision-making by reducing overtreatment among low-risk patients, while appropriately identifying individuals who may benefit from intensified postoperative management.
3.5. Comparative Prognostic Performance of the CALM Index vs. Established Inflammatory and Nutritional Biomarkers
To contextualize the prognostic performance of the CALM index relative to established inflammatory and nutritional biomarkers, we constructed a series of multivariate Cox proportional hazards models in which each biomarker—CALLY index, CLR, HALP score, IBI, LMR, MLR, NLR, PNI, SII, and SIRI—was entered individually into a standardized reference framework corresponding to the IM. IM incorporated age, ASA-PS, PL, pathological stage, and mSLI, thereby enabling direct and standardized comparisons across biomarkers. Across all the evaluated models, the CALM index demonstrated the strongest discriminative capability (C-index, 0.838). This performance modestly exceeded that of the CALLY index (0.833) and PNI (0.830), whereas other inflammation- and nutrition-based indices, including CLR, HALP, IBI, LMR, MLR, NLR, SII, and SIRI, exhibited comparatively lower discrimination (C-indice, 0.817–0.825) (Figure 5).
3.6. Development and Validation of a Full Model–Based Nomogram for 3- and 5-Year Survival Prediction
A prognostic FM-based nomogram was constructed to generate individualized estimates of 3- and 5-year OS rates. The model incorporated six variables independently associated with survival (age, ASA-PS, PL, pathological stage, mSLI, and the CALM index), integrating the clinical, pathological, and hematologic dimensions of risk This visual prediction tool holds potential to enable quantitative, patient-specific risk assessment and may facilitate more precise postoperative stratification and informed decision-making regarding surveillance and management (Figure 6).
Calibration analyses at 3 and 5 years demonstrated close concordance between the predicted and observed survival probabilities, with calibration plots closely aligned with the 45° line of ideal concordance. Internal validation based on 1,000 bootstrap resamples confirmed consistent calibration and negligible optimism across the spectrum of predicted risk (Figure 7). Collectively, these findings demonstrated that the nomogram derived from FM was both robust and well-calibrated, supporting its use for individualized survival prediction in patients with resected stage I–IIIA NSCLC.
4. Discussion
In this study, we comprehensively evaluated the prognostic utility of the CALM index in patients with resected NSCLC using complementary conventional, penalized, and machine learning–based approaches. Across both conventional multivariate Cox regression and LASSO-penalized models, the CALM index consistently emerged as an independent predictor of OS after adjustment for established clinicopathological factors. Furthermore, the incorporation of the CALM index into the full model (FM) significantly improved discrimination, calibration, and clinical net benefit compared with both the baseline model (BM) and the intermediate model (IM). Collectively, these findings support the CALM index as a reproducible and biologically coherent biomarker that provides incremental prognostic information beyond conventional postoperative risk determinants.
Multivariate Cox regression analysis identified age, ASA-PS, pathology, stage, mSLI, and the CALM index as independent predictors of OS. Notably, LASSO-based variable selection followed by refitting retained these same six variables, demonstrating strong concordance with the primary multivariable model. This convergence highlights the consistency and reproducibility of the identified prognostic factors. The persistent selection of the CALM index across both modeling strategies reinforces its prognostic relevance, supporting its potential utility as an integrative biomarker that captures biologically meaningful information beyond traditional clinicopathological features.
The retained covariates are clinically and biologically plausible. Age and ASA-PS reflect global physiological reserve and comorbidity burden, and are consistently linked to postoperative outcomes [8,9,10,40]. Pathological stage and PL remain fundamental indicators of tumor aggressiveness and disease extent [7,8,9,10,15]. Furthermore, the inclusion of mSLI, a RBC–derived composite index, highlights the significant contribution of hematologic and systemic factors to patient survival [31,41,42]. Collectively, these findings indicate that outcomes following curative-intent resection are determined not only by anatomical disease burden but also by a patient’s host-related inflammatory, nutritional, and hematologic status.
Importantly, the prognostic association of the CALM index remained consistent across pathological stages, suggesting stable performance irrespective of disease extent. Given the well-recognized heterogeneity in clinical outcomes within TNM stage groups, this finding holds significant practical implications. The CALM index may serve as a complementary tool to refine risk stratification within these stage-defined categories, thereby supporting more individualized postoperative surveillance and tailored adjuvant treatment strategies.
Additional analyses demonstrated that the prognostic information captured by the CALM index was largely equivalent to that contained within its individual components. Models incorporating CRP, albumin, ALC, and AMC separately did not outperform the composite index, and their inclusion alongside the CALM index provided no meaningful incremental prognostic value. Notably, the CALM-based model achieved the lowest Akaike Information Criterion (AIC), indicating the most favorable balance between model fit and parsimony. These findings suggest that CALM index serves as an efficient integrative biomarker, condensing complementary information related to systemic inflammation, nutritional status, immune competence, and myeloid activation into a single clinically applicable measure of prognostic risk.
Mechanistically, the biological plausibility of the CALM index is supported by the complementary functions of its constituent biomarkers, which collectively reflect four interrelated dimensions of host status: systemic inflammation (CRP), nutritional (albumin), adaptive immune competence (ALC), and myeloid inflammatory activity (AMC). SHAP-based dependence analyses suggest that these components contribute to prognostic risk in a coordinated rather than purely additive manner. In particular, AMC emerged as a key contextual determinant of the prognostic associations of the other CALM components. While albumin and ALC demonstrated inverse associations with risk—consistent with their established roles as markers of physiologic resilience and immune competence—these favorable associations appeared attenuated in the presence of elevated AMC. This suggests that heightened myeloid inflammatory activity may diminish the prognostic benefit typically associated with preserved nutritional and immune status. Conversely, the association between CRP and risk became less pronounced at higher AMC levels, raising the possibility that the incremental prognostic contribution of CRP is attenuated in the setting of pre-existing myeloid activation. Although these observations should not be interpreted as definitive evidence of direct biological interactions, they suggest that the prognostic relevance of individual inflammatory and immune biomarkers is significantly influenced by the broader host inflammatory milieu. Collectively, these findings support the concept that the CALM index captures complementary and interrelated aspects of host biology, thereby providing a more integrated representation of prognostic vulnerability than any single biomarker alone
From a predictive standpoint, the FM, which incorporates the CALM index alongside established clinical and hematologic covariates, demonstrated superior performance compared with both the BM and IM. These improvements were consistently observed across multiple domains, including discrimination (C-index and iAUC), risk reclassification (IDI), and clinical utility as assessed by decision curve analysis. Although the absolute increase in concordance associated with the CALM index was modest, the improvement was statistically significant and consistent across multiple complementary performance metrics. Notably, even incremental gains in discriminative capacity within an already well-calibrated clinical model can have meaningful clinical impacts, particularly at decision thresholds relevant to adjuvant therapy selection and postoperative surveillance. In this context, the inclusion of the CALM index enhanced the model’s ability to distinguish patients at genuinely elevated risk from those with more favorable prognoses, thereby supporting more appropriate risk-adapted management—minimizing unnecessary interventions in low-risk individuals while facilitating timely treatment for high-risk patients. Collectively, these findings highlight the CALM index as a key integrative component of the FM, providing incremental prognostic information beyond conventional predictors by capturing systemic inflammatory–nutritional status. In doing so, it complements measures of tumor burden and physiological reserve, contributing to a more comprehensive and clinically actionable framework for postoperative risk stratification.
When evaluated against other widely used inflammation- and nutrition-based biomarkers within a uniform prognostic framework (IM), the CALM index demonstrated the highest discriminative performance (C-index = 0.838), outperforming established indices, including the NLR, LMR, MLR, IBI, CLR, PNI, SII, SIRI, HALP, and CALLY. Notably, given that the CALLY index (C-index = 0.833) was constructed from CRP, serum albumin, and ALC, the superior performance of the CALM index observed here suggests that the incorporation of AMC provides additional clinically meaningful prognostic information beyond these shared components. This finding supports the notion that the CALM index more comprehensively captures tumor–host interactions relevant to cancer outcomes.
From a clinical implementation perspective, the CALM index offers several practical advantages. It is derived from routinely available, low-cost laboratory parameters and does not require specialized assays, facilitating broad applicability across diverse healthcare settings. Following external validation, it may be integrated into prognostic nomograms or clinical decision-support systems to identify patients who may benefit from intensified postoperative surveillance or individualized adjuvant treatment strategies.
This study has several notable strengths. First, it provides a comprehensive and methodologically rigorous evaluation of the CALM index as a prognostic biomarker in patients with stage I–IIIA NSCLC undergoing resection with curative intent. To our knowledge, this is the first study to establish the prognostic value of a composite index integrating CRP, albumin, ALC, and AMC in a surgically treated NSCLC population, thereby addressing a critical gap in postoperative risk stratification. The analysis was conducted in a well-characterized cohort with standardized staging and long-term follow-up; furthermore, continuous predictors were preserved in their native form, avoiding arbitrary dichotomization and minimizing information loss. Second, this study is strengthened by the rigorous use of complementary analytical frameworks, including conventional multivariable Cox regression, LASSO-penalized feature selection, and machine learning–based interpretability. Across these approaches, the CALM index was consistently identified as an independent predictor of OS alongside established clinicopathological factors, contributing to a final prognostic model with excellent discriminative performance and minimal multicollinearity. The high concordance between the predictors selected using standard and penalized regression methods supports the robustness, stability, and generalizability of the findings. Third, model performance was evaluated comprehensively through discrimination, calibration, reclassification, and decision curve analyses (DCAs), with internal bootstrap validation demonstrating stable predictive performance. Importantly, the prognostic value of the CALM index was continuous and approximately linear across both unadjusted and fully adjusted models, supporting its use without arbitrary categorization and maximizing prognostic resolution. Finally, incorporation of the CALM index into multivariable models yielded consistent and clinically meaningful improvements in discrimination, risk reclassification, and net clinical benefit relative to both the BM and IM, as well as compared with a broad spectrum of established inflammatory and nutritional biomarkers within a uniform comparative framework. Given that the CALM index is derived from routinely available, low-cost laboratory parameters without the need for specialized testing, it has strong translational potential and practical scalability across diverse healthcare settings. Nevertheless, external validation in independent and heterogeneous cohorts remains necessary to confirm its generalizability and clinical applicability
Nevertheless, this study has several limitations. First, the retrospective design and single-institution setting inherently introduce the potential for selection bias and unmeasured confounding that cannot be entirely eliminated despite multivariate adjustment. Second, the study population was overwhelmingly East Asian (98.1%), limiting the generalizability of these findings to ethnically and geographically diverse cohorts. In addition, the high proportion of patients with stage I disease (73.0%) may have influenced OS estimates, although pathological stage was systematically incorporated into all prognostic models to mitigate stage-related confounding. Third, the analysis relied exclusively on preoperative baseline laboratory values, precluding evaluation of temporal fluctuations in the CALM index. While longitudinal assessment of CALM dynamics may provide additional prognostic or predictive information not captured here, postoperative and serial measurements may be influenced by adjuvant therapy, treatment-related toxicities, perioperative stress, or intercurrent clinical events, which could complicate interpretation. Moreover, individual components of the CALM index may be affected by non-malignancy-related conditions, including acute infection, chronic inflammatory disorders, or autoimmune diseases. To minimize such bias, patients with active systemic inflammatory conditions were excluded, and laboratory measurements were restricted to those obtained within 7 days before surgery. Fourth, the primary endpoint was OS rather than recurrence-free or cancer-specific survival, as complete data to reliably ascertain recurrence events or cause-specific mortality were not uniformly available. Accordingly, competing non-cancer deaths may have influenced the observed associations, particularly among older patients or those with a substantial comorbidity burden. Finally, although internal validation using 1,000 bootstrap resamples demonstrated stable model performance, external validation remains necessary to confirm reproducibility and clinical applicability. Prospective, multicenter investigations incorporating ethnically heterogeneous populations, serial CALM measurements, molecular data, and clinically relevant endpoints are warranted to further substantiate its prognostic value and to clarify how the CALM index may be optimally integrated into postoperative risk stratification and clinical decision-making frameworks [43,44].
5. Conclusion
In summary, the CALM index is a biologically plausible and clinically interpretable composite biomarker that independently predicts OS in patients with NSCLC undergoing curative-intent resection. Across complementary analytic frameworks—including both conventional and penalized regression approaches—the CALM index demonstrated consistent prognostic performance and provided incremental predictive and clinical utility beyond established clinicopathological factors and commonly used inflammatory or nutritional indices. By integrating systemic inflammation, nutritional status, and immune-related host factors, the CALM index offers a practical and scalable tool for postoperative risk stratification using routinely available laboratory parameters. Following external validation in independent and diverse cohorts, the CALM index may facilitate the identification of patients who could benefit from more individualized surveillance and perioperative management strategies.
Author Contributions
Conceptualization, Soomin An (S. An) and Wankyu Eo (W. Eo); data curation, S. An and W. Eo; formal analysis, S. An and W. Eo; funding acquisition, S. An; investigation, S. An and W. Eo; methodology, S. An, W. Eo, Sookyung Lee (S. Lee), and Dae Hyun Kim (D. H. Kim); project administration, S. An and W. Eo; resources, S. An, W. Eo, S. Lee, and D. H. Kim; software, S. An, W. Eo, S. Lee, and D. H. Kim; supervision, S. An and W. Eo; validation, S. An, W. Eo, S. Lee, and D. H. Kim; visualization, S. An and W. Eo; writing—original draft preparation, S. An; writing—review and editing, S. An, W. Eo, S. Lee, and D. H. Kim. All authors have read and agreed to the published version of the manuscript.
Funding
This research was funded by a grant from Dongyang University in 2025.
Institutional Review Board Statement
The study was conducted in accordance with the Declaration of Helsinki and approved by the Institutional Review Board of Kyung Hee University Hospital in Gangdong on 8th September 2025 (No. 2025-08-037).
Informed Consent Statement
Patient consent was waived due to the retrospective nature of the study.
Data Availability Statement
The datasets presented in this study are available upon request from the corresponding author due to ethical reasons.
Conflicts of Interest
The authors declare no conflicts of interest. The funders had no role in the design of the study; in the collection, analyses, or interpretation of data; in the writing of the manuscript; or in the decision to publish the results.
References
- The global, regional, and national burden of cancer, 1990-2023, with forecasts to 2050: a systematic analysis for the Global Burden of Disease Study 2023. Lancet 2025, 406, 1565–1586. [CrossRef] [PubMed]
- Duma, N.; Santana-Davila, R.; Molina, J.R. Non-Small Cell Lung Cancer: Epidemiology, Screening, Diagnosis, and Treatment. Mayo Clin. Proc. 2019, 94, 1623–1640. [Google Scholar] [CrossRef] [PubMed]
- Burke, H.B. Outcome prediction and the future of the TNM staging system. J. Natl. Cancer Inst. 2004, 96, 1408–1409. [Google Scholar] [CrossRef] [PubMed]
- Voorn, M.J.J.; Beukers, K.; Trepels, C.M.M.; Bootsma, G.P.; Bongers, B.C.; Janssen-Heijnen, M.L.G. Associations between pretreatment nutritional assessments and treatment complications in patients with stage I-III non-small cell lung cancer: A systematic review. Clin. Nutr. ESPEN 2022, 47, 152–162. [Google Scholar] [CrossRef] [PubMed]
- Balata, H.; Foden, P.; Edwards, T.; Chaturvedi, A.; Elshafi, M.; Tempowski, A.; Teng, B.; Whittemore, P.; Blyth, K.G.; Kidd, A.; et al. Predicting survival following surgical resection of lung cancer using clinical and pathological variables: The development and validation of the LNC-PATH score. Lung Cancer 2018, 125, 29–34. [Google Scholar] [CrossRef] [PubMed]
- Chansky, K.; Detterbeck, F.C.; Nicholson, A.G.; Rusch, V.W.; Vallières, E.; Groome, P.; Kennedy, C.; Krasnik, M.; Peake, M.; Shemanski, L.; et al. The IASLC Lung Cancer Staging Project: External Validation of the Revision of the TNM Stage Groupings in the Eighth Edition of the TNM Classification of Lung Cancer. Journal of thoracic oncology: official publication of the International Association for the Study of Lung Cancer 2017, 12, 1109–1121. [Google Scholar] [CrossRef] [PubMed]
- Liu, X.Y.; Zhang, X.; Zhang, Q.; Ruan, G.T.; Liu, T.; Xie, H.L.; Ge, Y.Z.; Song, M.M.; Deng, L.; Shi, H.P. The value of CRP-albumin-lymphocyte index (CALLY index) as a prognostic biomarker in patients with non-small cell lung cancer. Supportive care in cancer: official journal of the Multinational Association of Supportive Care in Cancer 2023, 31, 533. [Google Scholar] [CrossRef] [PubMed]
- Sato, S.; Sezaki, R.; Shinohara, H. Significance of preoperative evaluation of modified advanced lung cancer inflammation index for patients with resectable non-small cell lung cancer. Gen. Thorac. Cardiovasc Surg. 2024. [Google Scholar] [CrossRef] [PubMed]
- Takada, K.; Takamori, S.; Matsubara, T.; Haratake, N.; Akamine, T.; Kinoshita, F.; Ono, Y.; Wakasu, S.; Tanaka, K.; Oku, Y.; et al. Clinical significance of preoperative inflammatory markers in non-small cell lung cancer patients: A multicenter retrospective study. PLoS ONE 2020, 15, e0241580. [Google Scholar] [CrossRef] [PubMed]
- Taylor, M.; Evison, M.; Michael, S.; Obale, E.; Fritsch, N.C.; Abah, U.; Smith, M.; Martin, G.P.; Shackcloth, M.; Granato, F.; et al. Pre-Operative Measures of Systemic Inflammation Predict Survival After Surgery for Primary Lung Cancer. Clin. Lung Cancer 2024, 25, 460–467.e467. [Google Scholar] [CrossRef] [PubMed]
- Pellini, B.; Chaudhuri, A.A. Circulating Tumor DNA Minimal Residual Disease Detection of Non-Small-Cell Lung Cancer Treated With Curative Intent. J. Clin. Oncol. 2022, 40, 567–575. [Google Scholar] [CrossRef] [PubMed]
- Onaitis, M.W.; Furnary, A.P.; Kosinski, A.S.; Kim, S.; Boffa, D.; Tong, B.C.; Cowper, P.; Jacobs, J.P.; Wright, C.D.; Putnam, J.B., Jr.; et al. Prediction of Long-Term Survival After Lung Cancer Surgery for Elderly Patients in The Society of Thoracic Surgeons General Thoracic Surgery Database. Ann. Thorac. Surg. 2018, 105, 309–316. [Google Scholar] [CrossRef] [PubMed]
- Hara, M.; Matsuzaki, Y.; Shimuzu, T.; Tomita, M.; Ayabe, T.; Enomoto, Y.; Onitsuka, T. Preoperative serum C-reactive protein level in non-small cell lung cancer. Anticancer Res. 2007, 27, 3001–3004. [Google Scholar] [PubMed]
- Motono, N.; Mizoguchi, T.; Ishikawa, M.; Iwai, S.; Iijima, Y.; Uramoto, H. Prognostic Impact of Cancer Inflammation Prognostic Index for Non-small Cell Lung Cancer. Lung 2023, 201, 603–610. [Google Scholar] [CrossRef] [PubMed]
- Tomita, M.; Shimizu, T.; Hara, M.; Ayabe, T.; Onitsuka, T. Preoperative leukocytosis, anemia and thrombocytosis are associated with poor survival in non-small cell lung cancer. Anticancer Res. 2009, 29, 2687–2690. [Google Scholar] [PubMed]
- Kobayashi, N.; Usui, S.; Kikuchi, S.; Goto, Y.; Sakai, M.; Onizuka, M.; Sato, Y. Preoperative lymphocyte count is an independent prognostic factor in node-negative non-small cell lung cancer. Lung Cancer 2012, 75, 223–227. [Google Scholar] [CrossRef] [PubMed]
- Miura, K.; Hamanaka, K.; Koizumi, T.; Kitaguchi, Y.; Terada, Y.; Nakamura, D.; Kumeda, H.; Agatsuma, H.; Hyogotani, A.; Kawakami, S.; et al. Clinical significance of preoperative serum albumin level for prognosis in surgically resected patients with non-small cell lung cancer: Comparative study of normal lung, emphysema, and pulmonary fibrosis. Lung Cancer 2017, 111, 88–95. [Google Scholar] [CrossRef] [PubMed]
- Kiss, M.; Caro, A.A.; Raes, G.; Laoui, D. Systemic Reprogramming of Monocytes in Cancer. Front Oncol. 2020, 10, 1399. [Google Scholar] [CrossRef] [PubMed]
- Huang, B.; Lei, Z.; Zhao, J.; Gong, W.; Liu, J.; Chen, Z.; Liu, Y.; Li, D.; Yuan, Y.; Zhang, G.M.; et al. CCL2/CCR2 pathway mediates recruitment of myeloid suppressor cells to cancers. Cancer Lett. 2007, 252, 86–92. [Google Scholar] [CrossRef] [PubMed]
- Cassetta, L.; Pollard, J.W. Targeting macrophages: therapeutic approaches in cancer. Nat. Rev. Drug Discov. 2018, 17, 887–904. [Google Scholar] [CrossRef] [PubMed]
- Okada, S.; Shimomura, M.; Tsunezuka, H.; Teramukai, S.; Ishihara, S.; Shimada, J.; Inoue, M. Prognostic Significance of Perioperative C-Reactive Protein in Resected Non-Small Cell Lung Cancer. Semin Thorac. Cardiovasc Surg. 2020, 32, 1046–1055. [Google Scholar] [CrossRef] [PubMed]
- Kumagai, S.; Marumo, S.; Shoji, T.; Sakuramoto, M.; Hirai, T.; Nishimura, T.; Arima, N.; Fukui, M.; Huang, C.L. Prognostic impact of preoperative monocyte counts in patients with resected lung adenocarcinoma. Lung Cancer 2014, 85, 457–464. [Google Scholar] [CrossRef] [PubMed]
- Ugel, S.; Canè, S.; De Sanctis, F.; Bronte, V. Monocytes in the Tumor Microenvironment. Annu Rev. Pathol. 2021, 16, 93–122. [Google Scholar] [CrossRef] [PubMed]
- Nakamura, K.; Smyth, M.J. Myeloid immunosuppression and immune checkpoints in the tumor microenvironment. Cell Mol. Immunol. 2020, 17, 1–12. [Google Scholar] [CrossRef] [PubMed]
- Tsuboi, M.; Herbst, R.S.; John, T.; Kato, T.; Majem, M.; Grohé, C.; Wang, J.; Goldman, J.W.; Lu, S.; Su, W.C.; et al. Overall Survival with Osimertinib in Resected EGFR-Mutated NSCLC. N. Engl. J. Med. 2023, 389, 137–147. [Google Scholar] [CrossRef] [PubMed]
- Travis, W.D. The 2015 WHO classification of lung tumors. Der Pathol. 2014, 35 Suppl 2, 188. [Google Scholar] [CrossRef] [PubMed]
- Detterbeck, F.C.; Boffa, D.J.; Kim, A.W.; Tanoue, L.T. The Eighth Edition Lung Cancer Stage Classification. Chest 2017, 151, 193–203. [Google Scholar] [CrossRef] [PubMed]
- Hermanek, P.; Wittekind, C. The pathologist and the residual tumor (R) classification. Pathol. Res. Pract. 1994, 190, 115–123. [Google Scholar] [CrossRef] [PubMed]
- Nakamura, K.; Seishima, R.; Matsui, S.; Shigeta, K.; Okabayashi, K.; Kitagawa, Y. The prognostic impact of preoperative mean corpuscular volume in colorectal cancer. Jpn. J. Clin. Oncol. 2022, 52, 562–570. [Google Scholar] [CrossRef] [PubMed]
- Kawase, A.; Yoshida, J.; Miyaoka, E.; Asamura, H.; Fujii, Y.; Nakanishi, Y.; Eguchi, K.; Mori, M.; Sawabata, N.; Okumura, M.; et al. Visceral pleural invasion classification in non-small-cell lung cancer in the 7th edition of the tumor, node, metastasis classification for lung cancer: validation analysis based on a large-scale nationwide database. Journal of thoracic oncology: official publication of the International Association for the Study of Lung Cancer 2013, 8, 606–611. [Google Scholar] [CrossRef] [PubMed]
- An, S.; Eo, W.; Lee, S. Prognostic Significance of Modified Shine and Lal Index in Patients with Non-Small Cell Lung Cancer Undergoing Surgical Resection. Biomedicines 2025, 13. [Google Scholar] [CrossRef] [PubMed]
- Harrison, P.; Goodall, A.H. Studies on Mean Platelet Volume (MPV) - New Editorial Policy. Platelets 2016, 27, 605–606. [Google Scholar] [CrossRef] [PubMed]
- Noris, P.; Melazzini, F.; Balduini, C.L. New roles for mean platelet volume measurement in the clinical practice? Platelets 2016, 27, 607–612. [Google Scholar] [CrossRef] [PubMed]
- Steyerberg, E.W.; Vickers, A.J.; Cook, N.R.; Gerds, T.; Gonen, M.; Obuchowski, N.; Pencina, M.J.; Kattan, M.W. Assessing the performance of prediction models: a framework for traditional and novel measures. Epidemiology 2010, 21, 128–138. [Google Scholar] [CrossRef] [PubMed]
- Li, S.; Yang, Z.; Du, H.; Zhang, W.; Che, G.; Liu, L. Novel systemic inflammation response index to predict prognosis after thoracoscopic lung cancer surgery: a propensity score-matching study. ANZ J. Surg. 2019, 89, E507–e513. [Google Scholar] [CrossRef] [PubMed]
- Liu, Q.; Xie, H.; Cheng, W.; Liu, T.; Liu, C.; Zhang, H.; Lin, S.; Liu, X.; Tian, H.; Li, X.; et al. The preoperative hemoglobin, albumin, lymphocyte, and platelet score (HALP) as a prognostic indicator in patients with non-small cell lung cancer. Front Nutr. 2024, 11, 1428950. [Google Scholar] [CrossRef] [PubMed]
- Xie, H.; Ruan, G.; Ge, Y.; Zhang, Q.; Zhang, H.; Lin, S.; Song, M.; Zhang, X.; Liu, X.; Li, X.; et al. Inflammatory burden as a prognostic biomarker for cancer. Clin. Nutr. 2022, 41, 1236–1243. [Google Scholar] [CrossRef] [PubMed]
- Yuan, C.; Li, N.; Mao, X.; Liu, Z.; Ou, W.; Wang, S.Y. Elevated pretreatment neutrophil/white blood cell ratio and monocyte/lymphocyte ratio predict poor survival in patients with curatively resected non-small cell lung cancer: Results from a large cohort. Thorac. Cancer 2017, 8, 350–358. [Google Scholar] [CrossRef] [PubMed]
- An, S.; Eo, W.; Lee, S. Comparison of the Clinical Value of the Geriatric Nutritional Risk Index and Prognostic Nutritional Index as Determinants of Survival Outcome in Patients with Gastric Cancer. J. Cancer 2022, 13, 3348–3357. [Google Scholar] [CrossRef] [PubMed]
- Zhang, R.; Kyriss, T.; Dippon, J.; Hansen, M.; Boedeker, E.; Friedel, G. American Society of Anesthesiologists physical status facilitates risk stratification of elderly patients undergoing thoracoscopic lobectomy. European journal of cardio-thoracic surgery: official journal of the European Association for Cardio-thoracic Surgery 2018, 53, 973–979. [Google Scholar] [CrossRef] [PubMed]
- Qu, X.; Zhang, T.; Ma, H.; Sui, P.; Du, J. Lower mean corpuscular hemoglobin concentration is associated with unfavorable prognosis of resected lung cancer. Future Oncol. 2014, 10, 2149–2159. [Google Scholar] [CrossRef] [PubMed]
- Wang, H.; Zhang, J. Clinical significance of mean corpuscular volume as a prognostic indicator of radiotherapy for locally advanced lung cancer: a retrospective cohort study. J. Thorac. Dis. 2022, 14, 4916–4924. [Google Scholar] [CrossRef] [PubMed]
- Zhou, L.; Zhang, Y.; Chen, W.; Niu, N.; Zhao, J.; Qi, W.; Xu, Y. Development and validation of a prognostic nomogram for early stage non-small cell lung cancer: a study based on the SEER database and a Chinese cohort. BMC Cancer 2022, 22, 980. [Google Scholar] [CrossRef] [PubMed]
- Kassir, N.; Chan, P.; Dang, S.; Bruno, R. External validation of a tumor growth inhibition-overall survival model in non-small-cell lung cancer based on atezolizumab studies using alectinib data. Cancer Chemother. Pharmacol. 2023, 92, 205–210. [Google Scholar] [CrossRef] [PubMed]
Figure 1.
Cox regression and penalized variable selection for overall survival. PL, pleural invasion; CALM, CRP–albumin–lymphocyte–monocyte index.
Figure 1.
Cox regression and penalized variable selection for overall survival. PL, pleural invasion; CALM, CRP–albumin–lymphocyte–monocyte index.
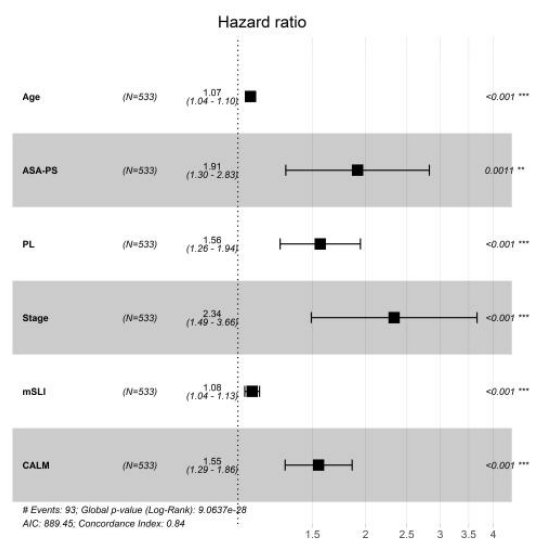
Figure 2.
Association between the CALM index and log hazard ratio of death based on Cox regression analysis. (A) Univariate model. (B) Multivariable model adjusted for age, ASA-PS, PL, pathological stage, and mSLI. Shaded areas indicate 95% confidence intervals.
Figure 2.
Association between the CALM index and log hazard ratio of death based on Cox regression analysis. (A) Univariate model. (B) Multivariable model adjusted for age, ASA-PS, PL, pathological stage, and mSLI. Shaded areas indicate 95% confidence intervals.
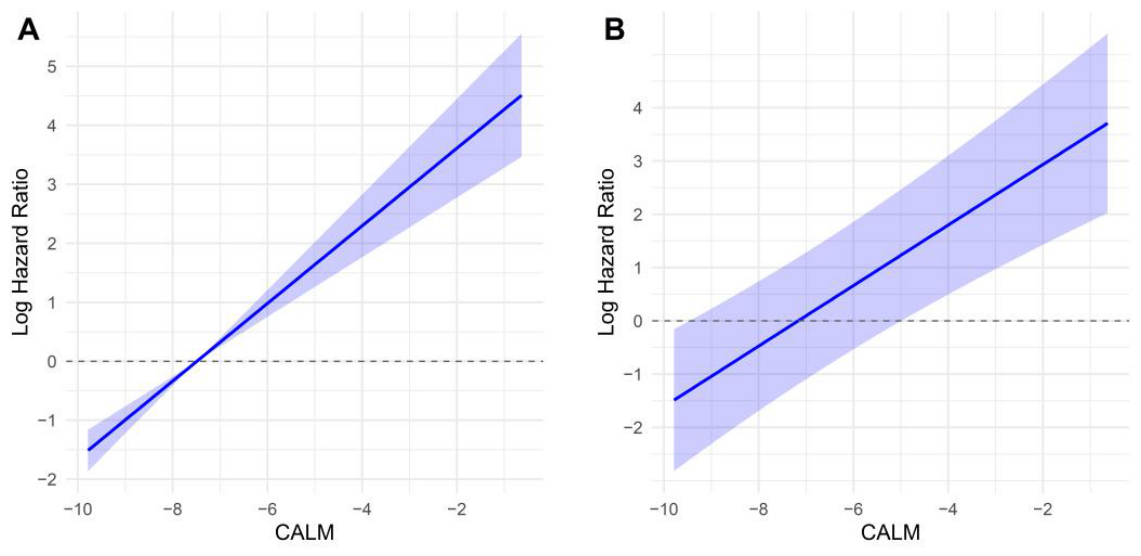
Figure 3.
SHAP dependence analysis demonstrates interaction effects among principal components of the CALM index. Panels demonstrate how the prognostic associations of (A) serum albumin, (B) ALC, and (C) CRP are modified by the underlying myeloid inflammatory state (AMC).
Figure 3.
SHAP dependence analysis demonstrates interaction effects among principal components of the CALM index. Panels demonstrate how the prognostic associations of (A) serum albumin, (B) ALC, and (C) CRP are modified by the underlying myeloid inflammatory state (AMC).
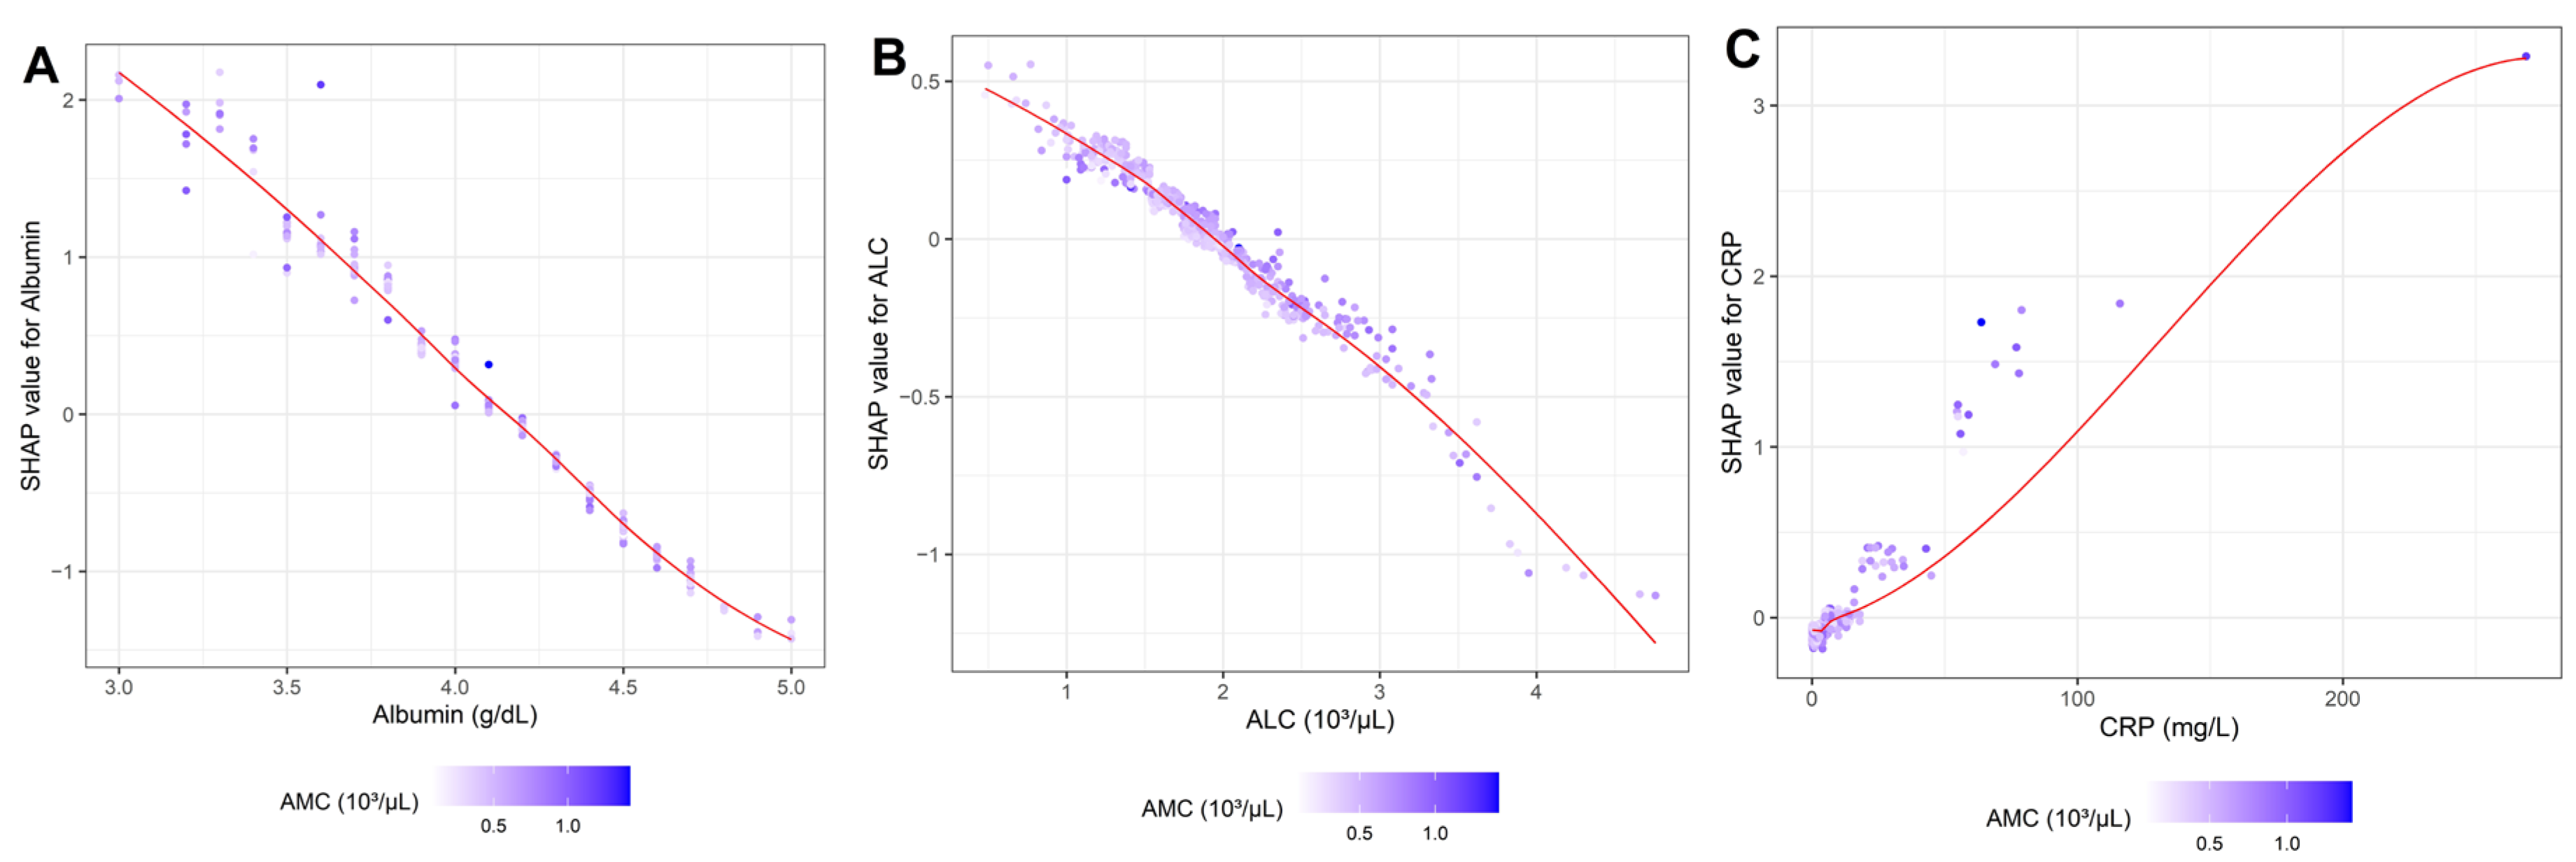
Figure 4.
Decision curve analysis of the full, intermediate, and baseline models for predicting 3-year (A) and 5-year (B) overall survival. .
Figure 4.
Decision curve analysis of the full, intermediate, and baseline models for predicting 3-year (A) and 5-year (B) overall survival. .
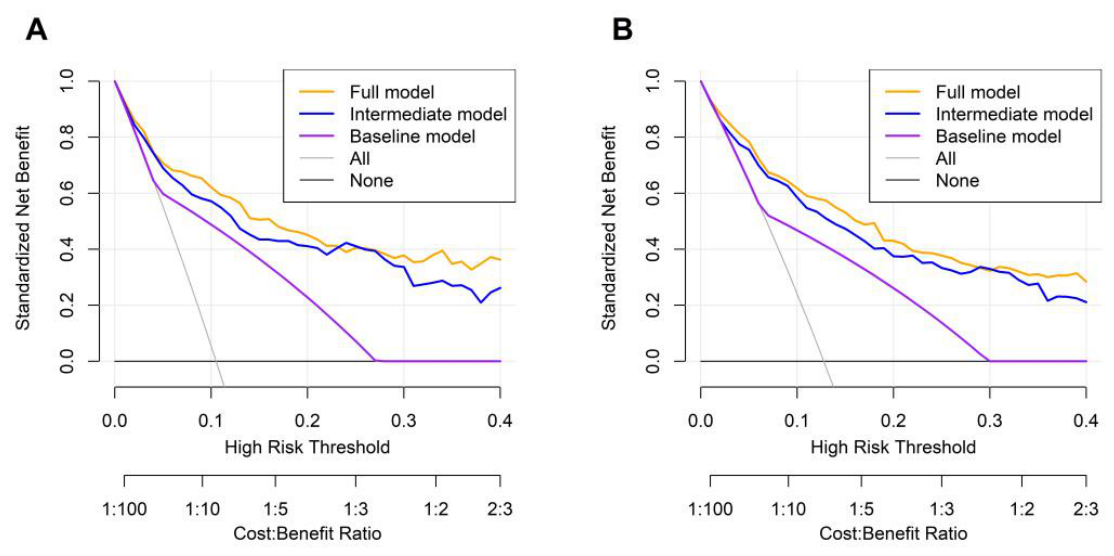
Figure 5.
CALM index vs. other biomarkers: Model discrimination for survival outcomes. CALLY, CRP–albumin–lymphocyte; CLR, CRP-to-lymphocyte ratio; HALP, hemoglobin–albumin–lymphocyte–platelet; IBI, inflammatory burden index; LMR, lymphocyte-to-monocyte ratio; MLR, monocyte-to-lymphocyte ratio; NLR, neutrophil-to-lymphocyte ratio, PNI, prognostic nutritional index; SII, systemic immune-inflammation index; SIRI, systemic inflammation response index.
Figure 5.
CALM index vs. other biomarkers: Model discrimination for survival outcomes. CALLY, CRP–albumin–lymphocyte; CLR, CRP-to-lymphocyte ratio; HALP, hemoglobin–albumin–lymphocyte–platelet; IBI, inflammatory burden index; LMR, lymphocyte-to-monocyte ratio; MLR, monocyte-to-lymphocyte ratio; NLR, neutrophil-to-lymphocyte ratio, PNI, prognostic nutritional index; SII, systemic immune-inflammation index; SIRI, systemic inflammation response index.
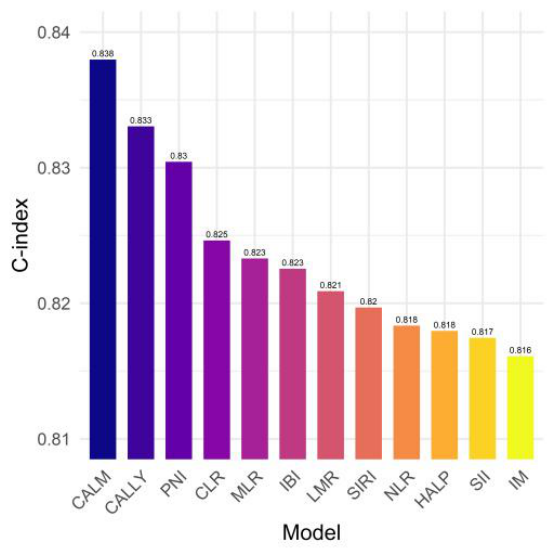
Figure 6.
Nomogram derived from the full model for predicting 3- and 5-year overall survival in patients with stage I–IIIA NSCLC undergoing curative-intent resection.
Figure 6.
Nomogram derived from the full model for predicting 3- and 5-year overall survival in patients with stage I–IIIA NSCLC undergoing curative-intent resection.
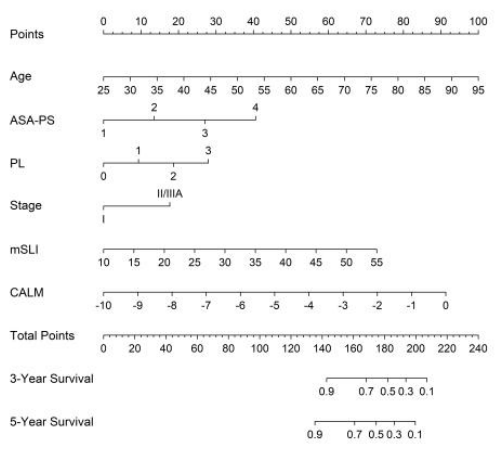
Figure 7.
Calibration curve analysis for predicting 3-year (A) and 5-year (B) overall survival based on the full model. Calibration plots were internally validated using bootstrap resampling (B = 1000), with approximately 100 observations per calibration group (m = 100).
Figure 7.
Calibration curve analysis for predicting 3-year (A) and 5-year (B) overall survival based on the full model. Calibration plots were internally validated using bootstrap resampling (B = 1000), with approximately 100 observations per calibration group (m = 100).
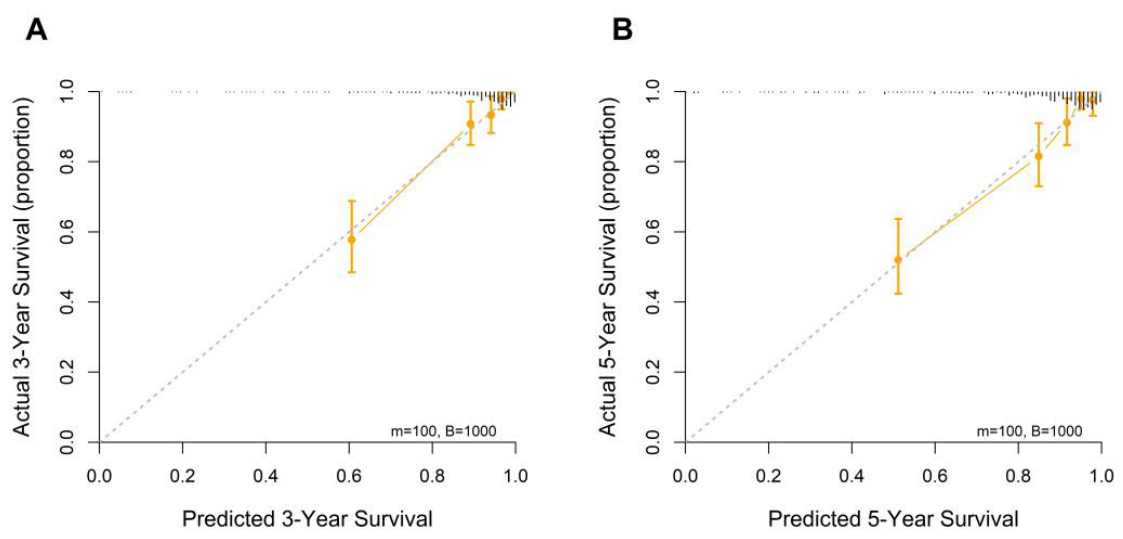

Table 1.
Clinicopathological characteristics of the patients.
| Variables |
n (%) or median (IQR) |
Variables |
n (%) or median (IQR) |
|---|---|---|---|
| Age, years | 69 (12) | Vascular invasion | |
| Sex | Yes | 29 (5.4%) | |
| Men | 310 (58.2%) | No | 504 (94.6%) |
| Women | 223 (41.8%) | Perineural invasion | |
| Smoking | Yes | 8 (1.5%) | |
| Current/Past | 214 (40.2%) | No | 525 (98.5%) |
| Never | 319 (59.8%) | Pathological stage | |
| Alcohol consumption | IA/IB | 389 (73.0%) | |
| Yes | 135 (25.3%) | IIA/IIB/IIIA | 144 (27.0%) |
| No | 398 (74.7%) | Adjuvant therapy | |
| ASA-PS | Yes | 121 (22.7%) | |
| 1/2 | 438 (82.2%) | No | 412 (77.3%) |
| 3/4 | 95 (17.8%) | Total protein, g/dL | 7.1 (0.7) |
| BMI, kg/m2 | 23.9 (4.2) | Albumin, g/dL | 4.2 (0.4) |
| Resection | Total bilirubin, mg/dL | 0.5 (0.2) | |
| Sublobar resection | 194 (36.4%) | AST, U/L | 22 (8) |
| Lobectomy | 326 (61.2%) | ALT, U/L | 17 (11) |
| Bilobectomy | 6 (1.1%) | CRP, mg/L | 1.0 (2.4) |
| Pneumonectomy | 7 (1.3%) | WBC, × 103/μL | 6.3 (2.2) |
| Histological subtype | ANC, × 103/μL | 3.6 (1.7) | |
| Squamous | 118 (22.1%) | ALC, × 103/μL | 1.8 (0.7) |
| Non-squamous | 415 (77.9%) | AMC, × 103/μL | 0.5 (0.2) |
| Tumor size, cm | 2.5 (1.8) | Hemoglobin, g/dL | 13.3 (2.0) |
| Pleural invasion | MCV, fL | 91.8 (5.6) | |
| 0 | 425 (79.7%) | MCH, pg | 30.9 (2.1) |
| ≥1 | 108 (20.3%) | MCHC, g/dL | 33.7 (1.2) |
| Lymphatic invasion | mSLI | 26.1 (4.7) | |
| Yes | 66 (12.4%) | Platelet, × 106/μL | 0.2 (0.1) |
| No | 467 (87.6%) |
ALC, absolute lymphocyte count; ALT, alanine aminotransferase; AMC, absolute monocyte count; ANC, absolute neutrophil count; ASA-PS, American Society of Anesthesiologists physical status; AST, aspartate aminotransferase; BMI, body mass index; CRP, C-reactive protein; IQR, interquartile range; MCH, mean corpuscular hemoglobin; MCHC, mean corpuscular hemoglobin concentration; MCV, mean corpuscular volume; mSLI, modified Shine-Lal index; WBC, white blood cell count.
Table 2.
Model comparison for survival prediction.
| Metrics | FM vs. BM | FM vs. IM | ||
|---|---|---|---|---|
| Improvement | p-value | Improvement | p-value | |
| C-index | 0.151 (0.022) | <0.001 | 0.021 (0.010) | <0.001 |
| iAUC | 0.144 (0.009) | <0.001 | 0.014 (0.003) | <0.001 |
| IDI at 3 years | 0.242 (0.046) | <0.001 | 0.056 (0.024) | <0.001 |
| IDI at 5 years | 0.218 (0.041) | <0.001 | 0.039 (0.021) | 0.024 |
Values in parentheses indicate standard errors. BM, baseline model; C-index, Harrell’s concordance index; FM, full model; iAUC, integrated area under the curve; IDI, integrated discrimination improvement; IM, intermediate model.
Disclaimer/Publisher’s Note: The statements, opinions and data contained in all publications are solely those of the individual author(s) and contributor(s) and not of MDPI and/or the editor(s). MDPI and/or the editor(s) disclaim responsibility for any injury to people or property resulting from any ideas, methods, instructions or products referred to in the content. |
© 2026 by the authors. Licensee MDPI, Basel, Switzerland. This article is an open access article distributed under the terms and conditions of the Creative Commons Attribution (CC BY) license (http://creativecommons.org/licenses/by/4.0/).
Copyright: This open access article is published under a Creative Commons CC BY 4.0 license, which permit the free download, distribution, and reuse, provided that the author and preprint are cited in any reuse.


