

Submitted:
06 July 2026
Posted:
08 July 2026
You are already at the latest version
Abstract
Rapid flood mapping using optical sensors such as Sentinel-2 is frequently challenged by spectral confusion, where turbid water, urban shadows, and wet soils exhibit similar reflectance signatures that undermine single-index detectors. We present the FLOod Oriented Detection Hybrid Index (FLOOD-HI), a statistically calibrated multi-index fusion that combines six complementary spectral indices (NDWI, IMP, AWEI, TCW, NDVI, and SAVI) through a multivariate linear model. Trained against high-fidelity Directly Affected Area (DAA) ground-truth maps from the catastrophic May 2024 Rio Grande do Sul floods, the model is implemented end-to-end in Google Earth Engine (GEE). Inundation extent is mapped using a straightforward sign-based decision rule (FLOOD-HI > 0), with spectral masks incorporated as pragmatic refinements. Moving beyond traditional small-sample paradigms, FLOOD-HI is validated wall-to-wall over two municipality-scale Regions Of Interest (ROI), with metrics computed across all pixels rather than on hand-picked water and non-water samples. In the external testing domain (ROI-2), FLOOD-HI achieves an F₁ ≈ 0.80, IoU ≈ 0.66, Precision ≈ 0.73 and Recall ≈ 0.88, substantially outperforming the best-performing single index (TCW, F₁ ≈ 0.63 and IoU ≈ 0.46). This represents an approximate 26,50% relative improvement in F₁ (absolute gain ≈ 0.17) and a 44% improvement in IoU (absolute gain ≈ 0.20). The major contribution is methodological, offering a reproducible multivariate index formulation, a conservative municipality-scale framework, and an open-access GEE implementation that includes a localized calibration workflow.
Keywords:
automatic flood mapping
; Urban resilience
; cloud computing
; water security
; Sentinel-2
1. Introduction
Floods are widely phenomenon recognized as one of the most devastating natural hazards, causing profound socioeconomic and environmental damage globally [1,2,3]. In Brazil, floods affected nearly 100 million people between 1991 and 2021 [4], culminating in the catastrophic 2024 Rio Grande do Sul disaster. Within just over a week, this extreme event submerged entire neighborhoods across more than 400 municipalities, resulting in unprecedented human and material losses [5]. To guide post-disaster evacuations, prioritize mitigation measures, and accurately assess structural damage, rapid and reliable flood extent mapping is imperative.
Satellite-based optical remote sensing, particularly via the Sentinel-2 Multispectral Instrument (MSI), provides the high spatial resolution and frequent revisit times necessary for near-real-time inundation mapping [6,7]. Traditionally, spectral indices such as the Normalized Difference Water Index (NDWI) [8] or the Automated Water Extraction Index (AWEIsh) [9] have been used to amplify water signals based on Near-InfraRed (NIR) and shortwave-infrared (SWIR) absorption characteristics. However, automated flood mapping across heterogeneous urban landscapes remains severely constrained by spectral confusion. Turbid floodwaters, deep urban shadows, wet soils, and dark impervious surfaces exhibit spectral signatures that heavily overlap with water profiles [10,11]. Consequently, traditional single-index methods frequently break down in these complex landscapes, yielding widespread false-positive detections [12,13].
To overcome the inherent limitations of isolated spectral metrics, recent studies highlight the necessity of multi-index fusion paradigms [14,15]. Building on this premise, we developed the FLOod Oriented Detection Hybrid Index (FLOOD-HI), a statistically calibrated tool tailored for accurate mapping in spectrally complex landscapes. FLOOD-HI synthesizes six complementary indices: NDWI, AWEIsh, Tasseled Cap Wetness (TCW), Imperviousness Index (IMP), Normalized Difference Vegetation Index (NDVI), and Soil-Adjusted Vegetation Index (SAVI). By jointly targeting the water signal, scene wetness, vegetation suppression, and impervious/soil confounders, this unified formulation resolves the spectral ambiguities that cause single indices to struggle.
Beyond its spectral formulation, a critical contribution of this study lies in its rigorous spatial evaluation framework. Conventional index validation often relies on small, pre-selected spatial crops or isolated patches of open water bodies (e.g., Feyisa et al. [9], Farhadi et al. [16]. This conventional sampling practice may artificially inflates accuracy metrics because it largely excludes the expansive, complex dry areas (e.g., dense urban fabrics, agricultural plains) where false positives predominantly manifest. Our evaluation departs from this limitation by performing a wall-to-wall assessment across two extensive Regions of Interest (ROIs) comprising multiple municipalities. By requiring the algorithm to classify every single pixel within the municipal boundaries, we expose the model to the full spectrum of real-world operational challenges, providing conservative and highly realistic estimate of its real-world reliability.
Finally, to ensure practical utility for end-users, the entire FLOOD-HI pipeline was engineered and deployed directly within the Google Earth Engine (GEE) platform. This cloud-based integration eliminates the computational bottlenecks of local processing, allowing for the rapid, scalable, and automated generation of municipal-scale flood maps. By combining the physical robustness of multi-index fusion with the computational efficiency of GEE, we deliver a highly operational tool aligned with some of the exigencies of civil defense and disaster response planning.
2. Methodology
The methodological framework developed here integrates cloud-based geospatial processing with multi-spectral analysis to engineer a statistically optimized flood detection index. As illustrated in the flowchart (Figure 1), the workflow progresses through five sequential phases: i) Data Acquisition and Processing; ii) Multi-index Synthesis; iii) Empirical Index Training; iv) Thresholding; and v) Validation and Transferability Testing. This pipeline was implemented entirely within the GEE cloud platform, following Gorelick et al. [17], leveraging its high-performance distributed computing capabilities to streamline massive, large-scale environmental analyses.
By exploiting Sentinel-2 satellite imagery, the FLOOD-HI framework establishes a statistically calibrated approach engineered specifically for accurate flood extent mapping across spectrally complex landscapes. Rather than relying on isolated physical channels, our methodology transforms multi-spectral inputs into high-precision flood maps through the optimized fusion of six complementary spectral indices. These underlying indices are selected based on comprehensive spectral characteristic analysis (Section 2.3) and mathematically formalized in Section 2.4. The fusion is achieved by weighting these independent spectral inputs via a multivariate linear regression model trained directly against high-fidelity ground-truth reference data compiled from the catastrophic May 2024 Rio Grande do Sul floods. This adaptive configuration enables robust, context-aware flood detection capable of neutralizing severe spectral confusion across highly heterogeneous urban and rural terrains.
To demonstrate real-world operational reliability, the spatial transferability of the trained model is rigorously evaluated wall-to-wall across multiple autonomous municipal sectors. Validation leverages five classic, pixel-wise verification metrics against the ground-truth reference maps: Overall Accuracy, Precision, Recall, -score, and Cohen’s Kappa coefficient. Ultimately, this workflow marries cloud-scale computational efficiency with a physics-informed statistical formulation, providing an operational asset well-suited for immediate disaster response, civil defense deployment, and long-term municipal flood risk mitigation.
2.1. Definition of Study Areas
The study area is situated within the state of Rio Grande do Sul (RS), Brazil, which served as the epicenter of catastrophic regional flooding between 28 April and 12 May 2024. The selection of this broad geographic focus was motivated by the severe socio-environmental impact of the event and the unique availability of high-accuracy validation data compiled by the state government, designated as the Directly Affected Area (DAA) dataset. The DAA reference maps are exceptionally valuable for remote sensing validation because they integrate empirical field surveys, aerial reconnaissance, high-resolution satellite imagery, and localized municipal records. This multi-source synthesis yields spatiotemporally reliable flood delineations rigorously audited and validated by institutional civil defense teams [18].
To optimize cloud-based computational performance while ensuring landscape representativeness, a primary Region Of Interest 1 (ROI-1) was defined as the domain for the training of the multivariate linear regression model (Figure 2a). This domain encompasses nine municipalities within the state of Rio Grande do Sul: Porto Alegre, Alvorada, Cachoeirinha, Canoas, Nova Santa Rita, Triunfo, Charqueadas, Eldorado do Sul, and Guaíba. These administrative municipalities were strategically selected because they capture a heavily urbanized landscape mosaic. This region features a complex metropolitan deltaic plain characterized by high-density urban zones, expansive impervious infrastructure, and intricate riparian boundaries, all of which are essential for exposing the model to severe spectral confounders during the training phase.
Subsequently, to evaluate the geographical transferability and out-of-domain performance of the FLOOD-HI framework, an independent testing domain (ROI-2) was established (Figure 2b). ROI-2 comprises fourteen distintic municipalities distributed across central and eastern Rio Grande do Sul: Santa Maria, Restinga Sêca, São Sepé, Agudo, Faxinal do Soturno, Cachoeira do Sul, Pântano Grande, Rio Pardo, Santa Cruz do Sul, Candelária, Formigueiro, Paraíso do Sul, Dona Francisca, and Vera Cruz. ROI-2 was intentionally selected to sample a distinctly different set of hydrogeomorphic and environmental conditions compared to the training domain. Unlike the metropolitan deltaic landscape of ROI-1, ROI-2 is dominated by extensive agricultural valleys, different soil compositions, and varying topographic gradients, thereby providing a stringent out-of-domain test of the model’s applicability. It thus provides a stringent, independent baseline to verify the operational reliability and spatial scalability of the proposed multi-index fusion algorithm.
This two-stage methodological design— incorporating targeted training within ROI-1 followed by independent testing across ROI-2—ensures that the multi-index model is rigorously tested for both fit within the training domain and geographical transferability. While this framework demonstrates strong regional applicability across diverse landscapes, broader global transferability remains an avenue for future studies, requiring further validation across different international geographic regions, varying soil-vegetation complexes, and alternative flood regimes.
2.2. Data Collection and Pre-Processing
2.2.1. Sentinel-2 Satellite Imagery
We utilized Level-2A Surface Reflectance (SR) product from the Harmonized Sentinel-2 MSI dataset [19], accessed via GEE cloud-computing platform. This dataset provides Bottom-Of-Atmosphere (BOA) reflectance values derived the Sentinel-2 constellation. The harmonized collection systematically compensates for radiometric inconsistencies introduced in scenes processed after January 2022 (processing baseline ≥ 04.00) by normalizing the +1000 Digital Number (DN) offset shift, ensuring temporal consistency across the multi-temporal image archive.
Each individual acquisition records 13 distincts spectral bands spanning the Visible (VIS), NIR, red-edge, and SWIR spectral domains. These bands are collected at native spatial resolutions of 10 m, 20 m, and 60 m, operating on a 5-day nominal constellation revisit frequency. The operational Level-2A processing chain implements the Sen2Cor algorithm [20] to generate atmospherically corrected surface reflectance measurements, minimizing aerosol contamination and water-vapor attenuation effects.
Cloud screening used the QA60 bitmask (Bit 10 for opaque clouds, Bit 11 for cirrus formations). Because residual thin clouds or shadows can persist and alter reflectance, temporal compositing (median reduction) was applied across the target flood analysis window, suppressing most transient atmospheric artifacts and yielding a cleaner, representative surface-reflectance composite for index formulation.
2.2.2. Ground Truth Data
To establish a high-fidelity reference dataset for empirical model calibration and wall-to-wall spatial validation, this study utilized the official Directly Affected Area (DAA) dataset. The DAA maps were generated and hosted by the State Secretariat of Planning, Governance, and Management of Rio Grande do Sul (SPGG) through an institutional, multi-agency initiative [18]. Rather than relying on a single modeled or observed source, the DAA dataset integrates four complementary methodologies across a rigorous three-stage institutional process featuring extensive cross-validated verification [21]. By anchoring the FLOOD-HI framework to this official baseline, our validation relies on an iterative, field-audited product that delivers exceptional geographic reliability for quantifying flood impacts across highly heterogeneous landscapes.
Initially, multi-source data integration combined high-resolution optical imagery (0.35–3 m) from PlanetScope, WorldView, and Pleiades—processed via automated NDWI-driven routines, with Height Above the Nearest Drainage (HAND) hydrodynamic extents and field, validated topographic boundaries generated via ordinary kriging interpolation of water-level gauges against a m DEM. This structural foundation was further augmented by dynamic, localized impact reporting from over 400 municipal Civil Defense units. By anchoring the FLOOD-HI framework to this official baseline, our validation relies on an iterative, field-audited product that delivers exceptional geographic reliability for quantifying flood impacts across highly heterogeneous landscapes.
This multi-source geospatial inventory was subsequently refined through an iterative protocol spanning five major version updates (v1.0 to v3.3). This optimization phase systematically integrated post-event field surveys from the Brazilian Army and the Hydraulic Research Institute (IPH/UFRGS), hydrodynamic simulations, and high-resolution tasking imagery brokered via the International Charter on Space and Major Disasters. Finally, the SPGG technical team enforced strict quality-assurance controls to mitigate error, employing spectral-temporal cross-checking of pre- and post-disaster PlanetScope pairs, geomorphic plausibility screening against the 30 m ANADEM hydrographically conditioned DEM [22], and manual morphological editing to reconcile modeled limits with satellite-observed physical watermarks.
The scientific integrity of the DAA dataset as a wall-to-wall validation reference rests upon its multi-scale methodological convergence. Its fine spatial precision (up to m) substantially surpasses the native 10 m resolution of Sentinel-2 MSI, successfully eliminating sub-pixel reference ambiguity. Moreover, daily PlanetScope coverage captured the catastrophic flood peaks between 6–7 May 2024, ensuring absolute temporal representativeness. By combining independent spectral indices, terrain-informed geomorphic modeling, and hydraulic gauge interpolation, the DAA dataset effectively neutralizes single-technique systematic biases. Ultimately, this staged uncertainty reduction protocol minimized total commission errors to below 5% across the state territory [18], providing a rigorous, institutional baseline for testing the out-of-domain transferability of our multi-index model.
2.3. Spectral Signature of Different Landscapes
The spectral signature analysis employed a rigorous cloud-based workflow within GEE, adhering to established multi-spectral remote sensing methodologies for hazard response [15,23]. To ensure radiometric fidelity, Sentinel-2 Level-2A surface reflectance scenes covering the critical flooding window from 28 April to 12 May 2024 were systematically preprocessed. The raw DN were scaled to BOA reflectance values within a normalized 0–1 range, by dividing the digital numbers by 10,000, adhering to Sentinel-2 technical specifications.
To evaluate spectral separability and identify persistent confounders within ROI-1, we implemented two complementary techniques. First, a point-based pure-pixel sampling strategy was executed to establish an empirical baseline (Figure 3; corresponding profiles for urban land, vegetation, and bare land are available in the Supplementary Material as Figures S1, S2 and S3), respectively. This step involved manually isolating ten reference sites for each key land-cover class—bare land, urban land, vegetation, and open water—verified via visual inspection of a True Color Composites (TCC; bands B4, B3, and B2) alongside two distinct False Color Composites 1 (bands B8, B4, and B3), and False Color Composite 2 (bands B12, B8, and B4). Surface reflectance values for six bands (B2, B3, B4, B8, B11, and B12) were extracted at their native spatial resolutions via localized spatial reduction in GEE. To neutralize single-pixel radiometric noise, a spatial buffer matching the native pixel footprint was applied around each coordinate, extracting the median reflectance value. This localized spatial aggregation minimizes single-pixel noise and ensures that the resulting spectral curves accurately reflect the nominal physical signatures of the target classes.
Second, we performed a region-based spectral feature analysis to quantify mixing behaviors across spectrally ambiguous surfaces using geographically targeted rectangular bounds (Figure 4); the remaining cases are provided in the Supplementary Material as Figures S4–S6). Within each region, one thousand pixels were randomly sampled at 10 m resolution to populate scatterplots correlating NIR (B8) reflectance with visible bands (B2, B3, and B4). This integrated approach captures and quantifies the severe spectral overlap typical of heterogeneous floodplains, providing the empirical foundation required to optimize multi-index fusion algorithms [15,24].
2.4. Spectral Index Selection and Formulation
The exploratory spectral discrimination analyses revealed that no single band was sufficient to ensure robust separability between water and other land-cover classes under complex landscape examined here. This limitation underscores the necessity of a multi-index approach capable of amplifying distinct physicochemical, structural, and contextual surface properties.
We determined the composition of the final index suite via a methodical exploratory analysis of spectral separability. We initially evaluated a broader suite of parameters, which included the Modified Normalized Difference Water Index (MNDWI) to leverage SWIR sensitivity against urban noise.However, our preliminary analyses revealed that the joint application of NDWI, AWEIsh, and TCW already comprehensively captured the required visible-to-SWIR contrast for discriminating urban features and turbid water. Adding MNDWI introduced excessive multicollinearity without noticeably improving the predictive boundary of the model. Consequently, the final optimal suite was restricted to six complementary indices that uniquely target distinct spectral features: open water (NDWI), scene wetness (TCW), impervious surfaces (IMP), vegetation activity (NDVI/SAVI), and shadow suppression (AWEIsh).
This multi-faceted operational framework establishes a comprehensive feature space intended to resolve spectral ambiguities across heterogeneous landscapes. The six indices—whose formulas, spectral roles, and representative target classes are detailed in Table 1—were computed in GEE using band-algebra operations from the original Sentinel-2 bands. Each index was produced individually and then virtually stacked into a single multi-band image, in which each pixel contained the value of all six indices. This multi-index stack served as the input for the subsequent `Empirical Index Calibration’ step.
As outlined in the “Empirical Index Calibration” step (Figure 1), the DAA vector shapefile for the study area was rasterized to a binary image, assigning a value of 1 to pixels inside the inundated extent and 0 to all others. From this binary reference layer, 5000 random points were extracted across ROI-1. This simple random sampling strategy allows the training dataset to reflect the natural spatial proportion of the flooded and non-flooded classes within the region. These points were spatially distributed across the nine municipalities of the training domain to capture the full intra-class variance of the complex urban landscape. Each sampled point was then attributed with its corresponding set of six index values (from stacked multi-index image) and the associated binary flood label.
Using this dataset, a multivariate linear regression model (Ordinary Least Squares, OLS) was fitted against the six indices as explanatory variables and the DAA binary label as the response variable. Equation (1) expresses the formulation of FLOOD-HI as a weighted linear combination of six spectral indices derived from Sentinel-2 images.
While logistic regression is typically favored for strict binary classification tasks (yielding bounded probabilities between 0 and 1), OLS was deliberately selected here to generate a continuous, unbounded spectral index.This mathematical approach aligns with the design principles of physical indices as AWEIsh and TCW, producing a continuous gradient curve where values cross a zero-threshold to separate classes, rather than a probabilistic output.
Regarding the proposed hybrid index (FLOOD-HI), the methodological design prioritized a strategy that combines specialized thematic indices rather than relying solely on combinations of raw spectral bands. The rationale is that this approach operates at a higher semantic tier, encapsulating specific physicochemical or contextual surface properties and enabling more meaningful multispectral interactions. In this framework, the multivariate linear regression is employed strictly as a predictive optimization tool rather than an inferential one. Because the input indices possess different native numerical ranges and inherent multicollinearity (e.g., NDVI and SAVI sharing similar spectral bands), the derived coefficients () function purely as empirical calibration weights that maximize the separation hyperplane between aquatic and non-aquatic feature spaces, rather than direct measures of each index’s individual importance. We intentionally bypassed standardization (e.g., Z-score normalization) prior to regression. Retaining the indices in their native scales ensures that FLOOD-HI remains a static, universally applicable formula (similar to AWEIsh), eliminating the operational bottleneck of calculating scene-dependent statistics. This robustly calibrated structure subsequently supports refinement phases, where contextual spectral masks can be incorporated to suppress false positives with greater selectivity and efficiency.
The “Thresholding” (Figure 1) process defines candidate inundation by selecting pixels with positive FLOOD-HI values, a criterion based on isolating the positive mode of the index’s frequency histogram. This sign-based thresholding generates a binary inundation mask (1 = water, 0 = non-water).
This sign-based criterion leverages the empirical separation commonly observed in the FLOOD-HI distribution: positive values correspond to spectral responses dominated by water-absorption landscapes, whereas negative values correspond to vegetation, exposed soil and built surfaces. By excluding negative values, the method isolates both permanent water bodies and temporarily inundated zones while avoiding arbitrary percentile-based thresholds. The combined use of simple sign-based selection and morphological refinement yields a computationally efficient and robust flood mask across heterogeneous landscapes and varying acquisition conditions.
2.5. Accuracy Assessment Criteria
The “Validation and Transferability” step (Figure 1) involved a rigorous comparison between the binary inundation maps derived from FLOOD-HI and the official DAA delineations. This assessment relied on six quantitative metrics consolidated in remote sensing and binary classification [31,32]: Accuracy (Equation (S2)), Precision (Equation (S3)), Recall (Equation (S4)), the -score (Equation (S5)), Intersection over Union (IoU, Equation (S6)), and Cohen’s Kappa coefficient (, Equation (S9)). These metrics were calculated from the fundamental components of the confusion matrix: True Positives () represent inundated pixels correctly identified as such; False Positives () are non-inundated pixels incorrectly classified as inundated; True Negatives () are non-inundated pixels correctly classified; and False Negatives () are inundated pixels missed by the classification. The total number of validation pixels (N) corresponds to the sum of all four categories (Equation (S1)). For Cohen’s Kappa (), two additional derived components are considered: the observed agreement (, Equation (S7)), which represents the actual proportion of correctly classified pixels, and the expected agreement by chance (, Equation (S8)), which represents the probability of agreement occurring randomly based on the marginal distributions of the confusion matrix.
To assess performance and transferability, all six metrics were computed independently for both the training domain (ROI-1) and the independent testing domain (ROI-2). Because FLOOD-HI was trained exclusively in ROI-1, performance in ROI-2 directly reveals its out-of-domain behaviour, indicating how well the index maintains accuracy across new hydrogeomorphic and land-use conditions.
Flood-extent maps were generated for all municipalities in both domains using the FLOOD-HI coefficients from Equation (1), with post-processing following the spectral masking protocols defined in Section 3.1. Pixels with FLOOD-HI > 0 were retained as candidate flooded or open-water areas, a criterion sufficient to delineate the aquatic component without an additional dynamic percentile threshold.
3. Results and Discussion
3.1. Spectral Signature Analysis for Hybrid Index Composition
The results of spectral analysis, employing both pure-pixel sampling and region-based approaches, revealed critical overlaps and separabilities among distinct landscapes. As expected, clear water exhibited low reflectance across all bands (e.g., B2, B3, B4 ≈ 0.015–0.020; B8 ≈ 0.020–0.030; Figure 3, Figure 4b and Figure S4b), while complex behaviour emerged for turbid water and vegetation. Turbid water samples showed elevated reflectance in the Red (B4 up to ≈0.175) and Green (B3 up to ≈0.13) portions of the spectrum, with Near-Infrared (NIR, B8) values spanning a wide range (0.02–0.5) (Figure 3, Figures S5 and S6a and Figure 4a). This spectral variability creates potential confusion with bare soil, which also showed moderate NIR reflectance (B8 up to 0.225; Figure S3). Urban areas were distinctly characterized by consistently high Short-Wave Infrared (SWIR) reflectance (B11 up to 0.55; B12 up to 0.30), providing a strong discriminative cue (Figure S1). Vegetation retained its traditional spectral signature, with very high NIR (B8 up to 0.4) and low visible reflectance in the bands (Figure S2).
In contrast, water samples with high chlorophyll content exhibited a distinctive spectral profile, characterized by a pronounced reflectance peak in the Near-Infrared region (B8 ≈ 0.43–0.50; Figures S4a and S6b). This elevated NIR response—significantly higher than that of clear or even turbid water—accompanied moderate reflectance in the visible bands (Green B3 ≈ 0.1–-0.15; Red B4 ≈ 0.08–-0.12), creating a signature that approaches, yet remains separable from, that of healthy vegetation. Such chlorophyll-driven spectra can lead to potential confusion in broadband indices, especially when vegetation and eutrophic waters coexist in the scene. The consistent NIR elevation in these samples underscores the importance of SWIR bands (e.g., B11, B12) for improved discrimination, as urban and soil landscapes retain distinct SWIR signatures.
This empirical evidence justifies the inclusion of core water-related indices and their variants. The classic NDWI, computed from Green (B3) and NIR (B8), performed as expected for open water; water samples consistently showed NDWI > 0 (often >0.5), whereas soils and vegetation returned negative values. However, its well-documented susceptibility to urban spectral interference was also confirmed, with built-up samples producing moderate NDWI values. In addition, we included the IMP index to explicitly target and mask non-water urban landscapes. Its formulation combines a water-sensitive term (NDWI) with a built-up-sensitive term (Blue–NIR), directly addressing this spectral confusion.
We found that the analysis of spectrally ambiguous zones further underscored the need for indices capable of handling the internal variability of water bodies, particularly under conditions of turbidity and shadowing. The AWEIsh proved particularly effective in this regard: its linear band combination is designed so that water pixels return positive values, while other dark surfaces—such as urban shadows and cloud shadows—consistently return negative ones. This behavior was clearly reflected in our turbid-water and shadow samples. Complementing AWEIsh, the TCW component adds a stable, scene-level wetness signal that is less affected by turbidity-related fluctuations, further reinforcing our ability to accurately discriminate water in complex spectral environments.
Misclassification of dense vegetation as water is a well documented limitation of indices such as NDWI. To mitigate this effect, two vegetation indices were applied as masks. NDVI provided a reliable indicator of vegetation vigor, with values much greater than 0.5 for vegetated targets in our samples, in contrast with values near zero for open water. However, bare soil exhibited moderate NDVI values, which reduced its effectiveness in isolating vegetation in more heterogeneous areas. For this reason, SAVI was incorporated. By including a soil adjustment factor of 0.5, SAVI reduced the influence of the soil background and produced a cleaner separation of vegetated surfaces, improving suppression of vegetation related false positives.
Overall, the FLOOD-HI is not a simple combination of indices but a synergistic aggregation informed by direct spectral assessment. Each component was chosen to address a specific spectral confusion identified through our rigorous analyses: IMP for urban suppression; AWEIsh for shadow and turbid water artifacts; TCW for a generalized wetness signal; and NDVI/SAVI for robust vegetation exclusion. This multi-index approach ensures the FLOOD-HI’s robustness across the diverse and challenging spectral scenarios presented by complex landscapes.
Finally, this spectral profiling conducted on ROI-1 established the physical boundaries used for the FLOOD-HI post-processing masks. The observation that water samples consistently exhibited B11 values ≤ 0.125 and NIR values well below terrestrial peaks (Figure 3, Figure 4 and Figures S4–S6) justifies the applied thresholds (B11 < 0.12; B6/B7/B8 < 0.20). These thresholds, originally derived from the calibration site (ROI-1), were subsequently applied to the validation site (ROI-2) without modification. While this demonstrates regional stability across the specific hydrogeomorphic domains of our study area, we acknowledge that this single out-of-domain validation site is not sufficient to confirm broad geographic transferability. Comprehensive testing scenarios across varied global landscapes will be necessary to fully establish the universal applicability of these spectral boundaries. It is critical to note that while these thresholds are necessary conditions for water detection, they are not sufficient on their own. Therefore, these masks serve strictly as a supplementary safeguard to reject ‘physically implausible’ high-reflectance false positives that might statistically bypass the regression model, leaving the multivariate FLOOD-HI with the primary task of resolving the complex spectral overlaps in turbid and water-land interfaces.
3.2. Empirical Calibration of the FLOOD-HI Model
The multiple linear regression used to calibrate FLOOD-HI yielded the following formulation, based on ordinary least squares applied to the stratified calibration sample:
As established in Section 2.4, the coefficients in Equation (2) function as empirical calibration weights rather than measures of individual index importance: because the indices retain their native, unstandardized ranges and are multicollinear (e.g., NDVI and SAVI), the sign and magnitude of each weight reflect the optimal mathematical balance for class separation rather than physical contribution.
Although the coefficients themselves are products of predictive optimization rather than inferential statistics, the structural logic of the final FLOOD-HI values remains physically consistent. To validate this internal consistency, the statistical relationship between the resultant FLOOD-HI and its constituent indices was evaluated. Scatter plots illustrating these correlations, along with the corresponding Pearson correlation coefficients (r), coefficients of determination (), and significance levels (p-values), are provided in the Supplementary Material (Figure S7).
All constituent indices show significant correlations () with the final FLOOD-HI values. AWEIsh exhibits the highest positive agreement (, ), aligning with its role as a primary water driver alongside TCW () and NDWI (). Furthermore, the scatter plots resolve the interpretative duality of variables like SAVI: despite its positive regression weight—attributed to multivariate adjustments for soil background—its direct correlation with the final FLOOD-HI output is strongly negative (), behaving similarly to NDVI (). This confirms that, in practice, the resulting hybrid index effectively suppresses vegetation signals while maintaining a high sensitivity to water.
By retaining the indices in their native scales, FLOOD-HI remains a static, efficient formula for rapid deployment in platforms such as Google Earth Engine. However, because the weights were optimized for the hydrogeomorphic conditions of southern Brazil, their direct transfer to different global biomes is not guaranteed, and regional recalibration may be required—a question for future benchmarking across diverse scenarios.
3.3. Spectral Sensitivity of Water Indices
We conducted a comparative analysis to evaluate the discriminative capacity of the proposed FLOOD-HI relative to three established water indices (NDWI, AWEIsh and TCW). Using the DAA map as ground truth, we randomly sampled 1,000 pixels from two spatially distinct regions (ROI-1 for training and ROI-2 for testing) to assess class separability.
As shown in Figure 5, results from the training set indicated that while NDWI values exhibited substantial class overlap, FLOOD-HI produced a distinct vertical separation between flooded and non-flooded pixels. Specifically, we observed a modest correlation between NDWI and FLOOD-HI for non-flooded areas (; ), which increased to a stronger correlation for flooded pixels (; ). We interpret the higher RMSE in the flooded class not as a signal degradation, but as an expansion in dynamic range introduced by FLOOD-HI. This characteristic effectively reduces the ambiguity often found near standard NDWI thresholds, suggesting improved detection performance (precision and recall) for FLOOD-HI-based classifiers.
Further comparisons with AWEIsh and TCW clarified the spectral behavior of the proposed index. We found that FLOOD-HI maintained a high linear alignment with AWEIsh, particularly within the flooded class (; ), indicating that the new index preserves the core water signal while compressing non-flood variability. Conversely, the relationship with TCW displayed a weaker background correlation () but a robust association for flooded pixels (), reinforcing that FLOOD-HI retains conventional water signatures while significantly enhancing the contrast between classes.
The testing set (ROI-2) corroborated these findings: NDWI again showed considerable overlap while FLOOD-HI maintained clear separability, with strong flooded-class correlations for AWEIsh () and TCW (). This confirms that the FLOOD-HI transformations amplify the water signal rather than background noise.
We analyzed the frequency distribution of pixel values within the confirmed DAA to evaluate the discriminatory power and threshold stability of the proposed index relative to established water metrics. The histograms for ROI-1 (Training) and ROI-2 (Testing) illustrate the spectral response of pixels classified as flooded across FLOOD-HI, NDWI, AWEIsh, and TCW (Figure 6).
We observed a distinct contrast in signal separation capabilities between the indices. Regarding the traditional metrics (NDWI, AWEIsh, and TCW), we found that the distribution of flooded pixels remained heavily concentrated near zero, frequently extending into negative ranges or exhibiting bimodal patterns. This behavior complicates the definition of a universal classification cutoff. For instance, within the ROI-1 training data, the distributions for NDWI and TCW displayed significant overlap with values typically associated with non-water surfaces. We interpret this as a limitation that necessitates complex, scene-dependent threshold tuning—often requiring cutoff values marginally below or above zero (<0 or >0) depending on specific sensor conditions.
In contrast, our analysis demonstrated that FLOOD-HI achieves superior spectral separation. We observed that the proposed index consistently shifted the distribution of flooded pixels toward highly positive values across the plotted histograms. This trend was consistent in both training and testing datasets, where the FLOOD-HI response effectively avoided the ambiguity of the near-zero region.
Consequently, these results validate the practical utility of the index. Unlike standard metrics where the boundary between water and background is often indistinct, we found that FLOOD-HI follows a clear logic where positive values (>0) unequivocally represent inundated areas. This distinct polarization reinforces the robustness of the fixed zero threshold within the evaluated regional context, effectively minimizing the need for iterative adjustments and ensuring consistent performance across diverse local flood intensities.
3.4. Performance of the FLOOD-HI Index for Water Mapping
The calibration results for ROI-1 show FLOOD-HI markedly outperforming every single conventional index. As reported in Table 2, it attains an -score of ≈0.85 and an IoU of ≈0.74; against the best single index (TCW), this is an absolute gain of ≈0.13 in (≈19%) and ≈0.18 in IoU (≈33%). These gains stem mainly from a substantial reduction in commission errors—reflected in markedly higher Precision while maintaining high Recall—showing that the hybrid formulation captures water that single indices miss or misclassify.
The superiority of FLOOD-HI is not limited to calibration: independent validation in ROI-2 (Table 3) confirms its robustness and transferability across the regional study domain. In ROI-2, FLOOD-HI reaches an -score of ≈0.80 and an IoU of ≈0.66, compared with the best-performing single index (TCW), which attains ≈0.63 and ≈0.46, respectively—absolute gains of ≈0.17 (approximately 26.5% relative) in and ≈0.20 (approximately 44.0% relative) in IoU. The consistent advantage across both regions supports the claim that FLOOD-HI integrates complementary spectral cues in a way that transfers effectively to different hydrogeomorphic settings within the evaluated regional context.
A full metric profile explains why global measures such as Accuracy and Kappa can be misleading for Sentinel-2 flood maps. Several conventional indices (e.g., TCW, AWEIsh) report higher Accuracy and Kappa, but both are strongly influenced by class prevalence and by systematic spatial disagreements between prediction and reference. Crucially, although the DAA represents the maximum observed flood extent, the Sentinel-2 scenes available here (28 April–12 May 2024) did not capture the inundation peak; pixels labelled as water in the DAA may therefore correspond to recession or dry conditions in the imagery, manifesting as apparent omissions that lower Kappa and Accuracy even when an index correctly maps the visible water. Figure 7, Figure 8, Figures S8 and S9 exemplify this: the DAA boundary sometimes extends beyond the spectrally detectable water, while FLOOD-HI more closely matches it.
The Precision and Recall profile reveals distinct operational behaviors. FLOOD-HI is balanced (Precision ≈ 0.78/Recall ≈ 0.94 in calibration; ≈0.73/≈0.88 in validation): high Precision means its positive classifications are likely true water, and high Recall means it captures most flooded pixels visible in the scenes. By contrast, NDWI shows very low Precision (≈0.22–0.35) despite high Recall, signalling pronounced overprediction, while TCW and AWEIsh achieve high Recall at the expense of Precision and IoU, reflecting a commission bias. The hybrid design combines complementary signals (SWIR suppression of bright soils, visible/NIR sensitivity to open water) while reducing sensitivity to confounders, yielding fewer false alarms and fewer missed pixels than any single index across both datasets.
Operationally, FLOOD-HI is better suited for producing actionable flood extents because it reduces false positives while preserving flooded areas. Summary metrics (particularly Kappa) should still be interpreted with caution when the reference represents peak inundation but the acquisition dates do not: temporally mismatched disagreement reflects true change rather than index failure, so and IoU against contemporaneous data—or visual inspection (Figure 7 and Figure 8)—give a more faithful assessment.
A visual analysis of the spatial discrepancies (Figure S10) clarifies these points. Omissions (in the DAA but not FLOOD-HI) predominantly correspond to water that had already receded by the Sentinel-2 acquisition, confirming the temporal limitation, whereas commissions (in FLOOD-HI but not the DAA) often correspond to isolated flooded patches present at image capture but absent from the connectivity-focused maximum-extent reference. This reinforces that FLOOD-HI maps the spectrally visible water, while the DAA is a distinct, peak-focused product.
4. Conclusions
This study introduced the FLOod Oriented Detection Hybrid Index (FLOOD-HI), demonstrating that unifying specialized spectral indices with empirical statistical optimization yields a marked improvement in flood delineation accuracy within complex, heterogeneous landscapes. The hybrid formulation effectively suppresses pervasive spectral confusion from urban materials, shadows, and vegetation, achieving robust validation metrics (-score ≈ 0.80, IoU ≈ 0.66) in an independent, municipality-scale test region. These results significantly surpass conventional single indices, offering high classification accuracy while maintaining computational simplicity and spectral parsimony, effectively bypassing the extensive data and processing requirements often associated with complex machine learning frameworks.
Critically, this work validates a replicable and operationally oriented methodological framework. By optimizing predictive weights against high-fidelity reference data from a major flood event (Rio Grande do Sul, 2024) and evaluating exhaustively across all pixels of large administrative units, we ensure that the reported accuracy metrics are conservative, representative, and directly actionable for risk assessment. The demonstrated generalization of the calibrated model to a distinct hydrogeomorphic setting underscores the robust regional transferability of the approach, establishing a solid foundation for future studies to test its global applicability across different biomes.
Consequently, FLOOD-HI offers a scalable and practical pathway for rapid flood assessment. Its efficient deployment in cloud platforms like Google Earth Engine, combined with a direct and transparent predictive workflow, bridges the critical gap between rigorous remote sensing science and the urgent demand for reliable, timely intelligence in emergency response and municipal planning. This index provides a trusted, accessible tool that empowers local agencies to prioritize mitigation investments, streamline damage assessments, and integrate geospatial hazard data into evidence-based policy decisions.
Supplementary Materials
The following supporting information can be downloaded at the website of this paper posted on Preprints.org.
Author Contributions
Mateus Domingos:Writing—original draft, Conceptualization, Visualization, Validation, Software, Methodology, Investigation, Formal analysis, Data curation. Guilherme Palermo Coelho: Writing—review & editing, Project administration, Conceptualization, Investigation, Methodology. Edson CezarWendland:Writing—review & editing, Investigation. Murilo Cesar Lucas: Writing—review & editing, Project administration, Conceptualization, Funding acquisition, Investigation.
Conflicts of Interest
Mateus Domingos reports financial support was provided by National Council for Scientific and Technological Development. Edson Cezar Wendland reports financial support was provided by State of Sao Paulo Research Foundation. If there are other authors, they declare that they have no known competing financial interests or personal relationships that could have appeared to influence the work reported in this paper.
Acknowledgments
The authors acknowledge financial support from the National Council for Scientific and Technological Development (CNPq; Grant No. 403292/2023-9) and the São Paulo Research Foundation (FAPESP; Grant No. 2023/18011-0), for supporting part of this study; and the Teaching, Research, and Extension Support Fund (FAEPEX) of UNICAMP (Grant No. 3111/23) for supporting the scholarship of Mateus Domingos.
Data Availability Statement
All data is available via open access repository at https://github.com/LaboratorioHidroinformatica/Sentinel2-Flood-Mapping.
References
- McDermott, T.K.J. Global exposure to flood risk and poverty. Nat. Commun. 2022, 13, 3529. [Google Scholar] [CrossRef] [PubMed]
- Rentschler, J.; Salhab, M.; Jafino, B.A. Flood exposure and poverty in 188 countries. Nat. Commun. 2022, 13, 3527. [Google Scholar] [CrossRef] [PubMed]
- Abebe, Y.A.; Pregnolato, M.; Jonkman, S.N. Flood impacts on healthcare facilities and disaster preparedness–A systematic review. Int. J. Disaster Risk Reduct. 2025, 119, 105340. [Google Scholar] [CrossRef]
- Hupsel Filho, V.; Caniato, B. Brasil mostra despreparo para enfrentar o impacto das mudanças climáticas. VEJA 2023. [Google Scholar] [CrossRef]
- Rizzotto, M.L.F.; Costa, A.M.; de Vasconcelos da Costa Lobato, L. Crise climática e os novos desafios para os sistemas de saúde: O caso das enchentes no Rio Grande do Sul/Brasil. Saúde Debate 2024, 48. [Google Scholar] [CrossRef]
- Drusch, M.; Bello, U.D.; Carlier, S.; Colin, O.; Fernandez, V.; Gascon, F.; Hoersch, B.; Isola, C.; Laberinti, P.; Martimort, P.; et al. Sentinel-2: ESA’s Optical High-Resolution Mission for GMES Operational Services. Remote Sens. Environ. 2012, 120, 25–36. [Google Scholar] [CrossRef]
- Farhadi, H.; Ebadi, H.; Kiani, A.; Asgary, A. Near Real-Time Flood Monitoring Using Multi-Sensor Optical Imagery and Machine Learning by GEE: An Automatic Feature-Based Multi-Class Classification Approach. Remote Sens. 2024, 16, 4454. [Google Scholar] [CrossRef]
- McFEETERS, S.K. The use of the Normalized Difference Water Index (NDWI) in the delineation of open water features. Int. J. Remote Sens. 1996, 17, 1425–1432. [Google Scholar] [CrossRef]
- Feyisa, G.L.; Meilby, H.; Fensholt, R.; Proud, S.R. Automated Water Extraction Index: A new technique for surface water mapping using Landsat imagery. Remote Sens. Environ. 2014, 140, 23–35. [Google Scholar] [CrossRef]
- Pekel, J.F.; Cottam, A.; Gorelick, N.; Belward, A.S. High-resolution mapping of global surface water and its long-term changes. Nature 2016, 540, 418–422. [Google Scholar] [CrossRef] [PubMed]
- Sigopi, M.; Shoko, C.; Dube, T. Advancements in remote sensing technologies for accurate monitoring and management of surface water resources in Africa: An overview, limitations, and future directions. Geocarto Int. 2024, 39, 2347935. [Google Scholar] [CrossRef]
- Vanderhoof, M.K.; Alexander, L.; Christensen, J.; Solvik, K.; Nieuwlandt, P.; Sagehorn, M. High-frequency time series comparison of Sentinel-1 and Sentinel-2 satellites for mapping open and vegetated water across the United States (2017–2021). Remote Sens. Environ. 2023, 288, 113498. [Google Scholar] [CrossRef]
- Satriano, V.; Ciancia, E.; Pergola, N.; Tramutoli, V. A first extension of the robust satellite technique RST-FLOOD to Sentinel-2 data for the mapping of flooded areas: The case of the Emilia Romagna (Italy) 2023 Event. Remote Sens. 2024, 16, 3450. [Google Scholar] [CrossRef]
- Wang; Xie, S.; Zhang, X.; Chen, C.; Guo, H.; Du, J.; Duan, Z. A robust Multi-Band Water Index (MBWI) for automated extraction of surface water from Landsat 8 OLI imagery. Int. J. Appl. Earth Obs. Geoinf. 2018, 68, 73–91. [Google Scholar] [CrossRef]
- Farhadi, H.; Ebadi, H.; Kiani, A.; Asgary, A. Introducing a new index for flood mapping using Sentinel-2 imagery (SFMI). Comput. Geosci. 2025, 194, 105742. [Google Scholar] [CrossRef]
- Farhadi, H.; Ebadi, H.; Kiani, A.; Asgary, A. A novel flood/water extraction index (FWEI) for identifying water and flooded areas using sentinel-2 visible and near-infrared spectral bands. Stoch. Environ. Res. Risk Assess. 2024, 38, 1873–1895. [Google Scholar] [CrossRef]
- Gorelick, N.; Hancher, M.; Dixon, M.; Ilyushchenko, S.; Thau, D.; Moore, R. Google Earth Engine: Planetary-scale geospatial analysis for everyone. Remote Sens. Environ. 2017, 202, 18–27. [Google Scholar] [CrossRef]
- da Silva Mieres, L.; Pessoa, M.L.; de Lima, L.; de Moraes, F.D.; Cunha, L.F.; et al. ÁREA DIRETAMENTE ATINGIDA (ADA) PELOS DESASTRES NATURAIS OCORRIDOS NO RIO GRANDE DO SUL EM MAIO DE 2024. Bol. Geográfico Do Rio Gd. Do Sul 2025, 215–224.
- European Space Agency (ESA); Google. COPERNICUS/S2_SR_HARMONIZED—Harmonized Sentinel-2 MSI: MultiSpectral Instrument, Level-2A Surface Reflectance. Accessed via Google Earth Engine. 2025. Available online: https://developers.google.com/earth-engine/datasets/catalog/COPERNICUS_S2_SR_HARMONIZED.
- Main-Knorn, M.; Pflug, B.; Louis, J.; Debaecker, V.; Müller-Wilm, U.; Gascon, F. Sen2Cor for Sentinel-2. Image and Signal Process. Remote Sens. XXIII 2017, 10427, 1042704. [Google Scholar] [CrossRef]
- Possantti, I.; Aguirre, A.; Alberti, C.; Azeredo, L.; Barcelos, M.; Becker, F.; Camana, M.; Cantor, G.; Cardozo, T.; Carrard, G.; et al. Banco de dados das cheias na Região Hidrográfica do Lago Guaíba em Maio de 2024, 2025. [CrossRef]
- Laipelt, L.; Comini de Andrade, B.; Collischonn, W.; de Amorim Teixeira, A.; Paiva, R.C.D.d.; Ruhoff, A. ANADEM: A digital terrain model for South America. Remote Sens. 2024, 16, 2321. [Google Scholar] [CrossRef]
- Waleed, M.; Sajjad, M. On the emergence of geospatial cloud-based platforms for disaster risk management: A global scientometric review of google earth engine applications. Int. J. Disaster Risk Reduct. 2023, 97, 104056. [Google Scholar] [CrossRef]
- Li, Z.; Zhao, Y.; Taylor, J.; Gaulton, R.; Jin, X.; Song, X.; Li, Z.; Meng, Y.; Chen, P.; Feng, H.; et al. Comparison and transferability of thermal, temporal and phenological-based in-season predictions of above-ground biomass in wheat crops from proximal crop reflectance data. Remote Sens. Environ. 2022, 273, 112967. [Google Scholar] [CrossRef]
- Mishra, K.; Prasad, P.R.C. Automatic extraction of water bodies from Landsat imagery using perceptron model. J. Comput. Environ. Sci. 2015, 2015, 903465. [Google Scholar] [CrossRef]
- Crist, E.P. A TM tasseled cap equivalent transformation for reflectance factor data. Remote Sens. Environ. 1985, 17, 301–306. [Google Scholar] [CrossRef]
- Chen, C.; Chen, H.; Liang, J.; Huang, W.; Xu, W.; Li, B.; Wang, J. Extraction of water body information from remote sensing imagery while considering greenness and wetness based on Tasseled Cap transformation. Remote Sens. 2022, 14, 3001. [Google Scholar] [CrossRef]
- Miura, Y.; Shamsudduha, M.; Suppasri, A.; Sano, D. A Global Multi-Sensor Dataset of Surface Water Indices from Landsat-8 and Sentinel-2 Satellite Measurements. Sci. Data 2025, 12, 1253. [Google Scholar] [CrossRef] [PubMed]
- Rouse, J.W., Jr.; Haas, R.H.; Schell, J.; Deering, D. Monitoring the Vernal Advancement and Retrogradation (Green Wave Effect) of Natural Vegetation; Technical Report RSC 1978-1; Remote Sensing Center, Texas A&M University: College Station, TX, USA, 1973. [Google Scholar]
- Huete, A.R. A soil-adjusted vegetation index (SAVI). Remote Sens. Environ. 1988, 25, 295–309. [Google Scholar] [CrossRef]
- Stehman, S.V. Selecting and interpreting measures of thematic classification accuracy. Remote Sens. Environ. 1997, 62, 77–89. [Google Scholar] [CrossRef]
- Congalton, R.G.; Green, K. Assessing the Accuracy of Remotely Sensed Data; CRC Press: Boca Raton, FL, USA, 2019. [Google Scholar] [CrossRef]
Figure 1.
Methodology flowchart of FlOOD-HI framework. Solid lines and arrows indicate direct, sequential workflow, whereas Dashed lines and arrows denote current or parallel processes. The large dashed rectangular block encapsulates a multi-component subroutine (Landscape Selection & Spectral Analysis) where internal techniques execute in parallel and pass their aggregated output downstream as a unified module.
Figure 1.
Methodology flowchart of FlOOD-HI framework. Solid lines and arrows indicate direct, sequential workflow, whereas Dashed lines and arrows denote current or parallel processes. The large dashed rectangular block encapsulates a multi-component subroutine (Landscape Selection & Spectral Analysis) where internal techniques execute in parallel and pass their aggregated output downstream as a unified module.
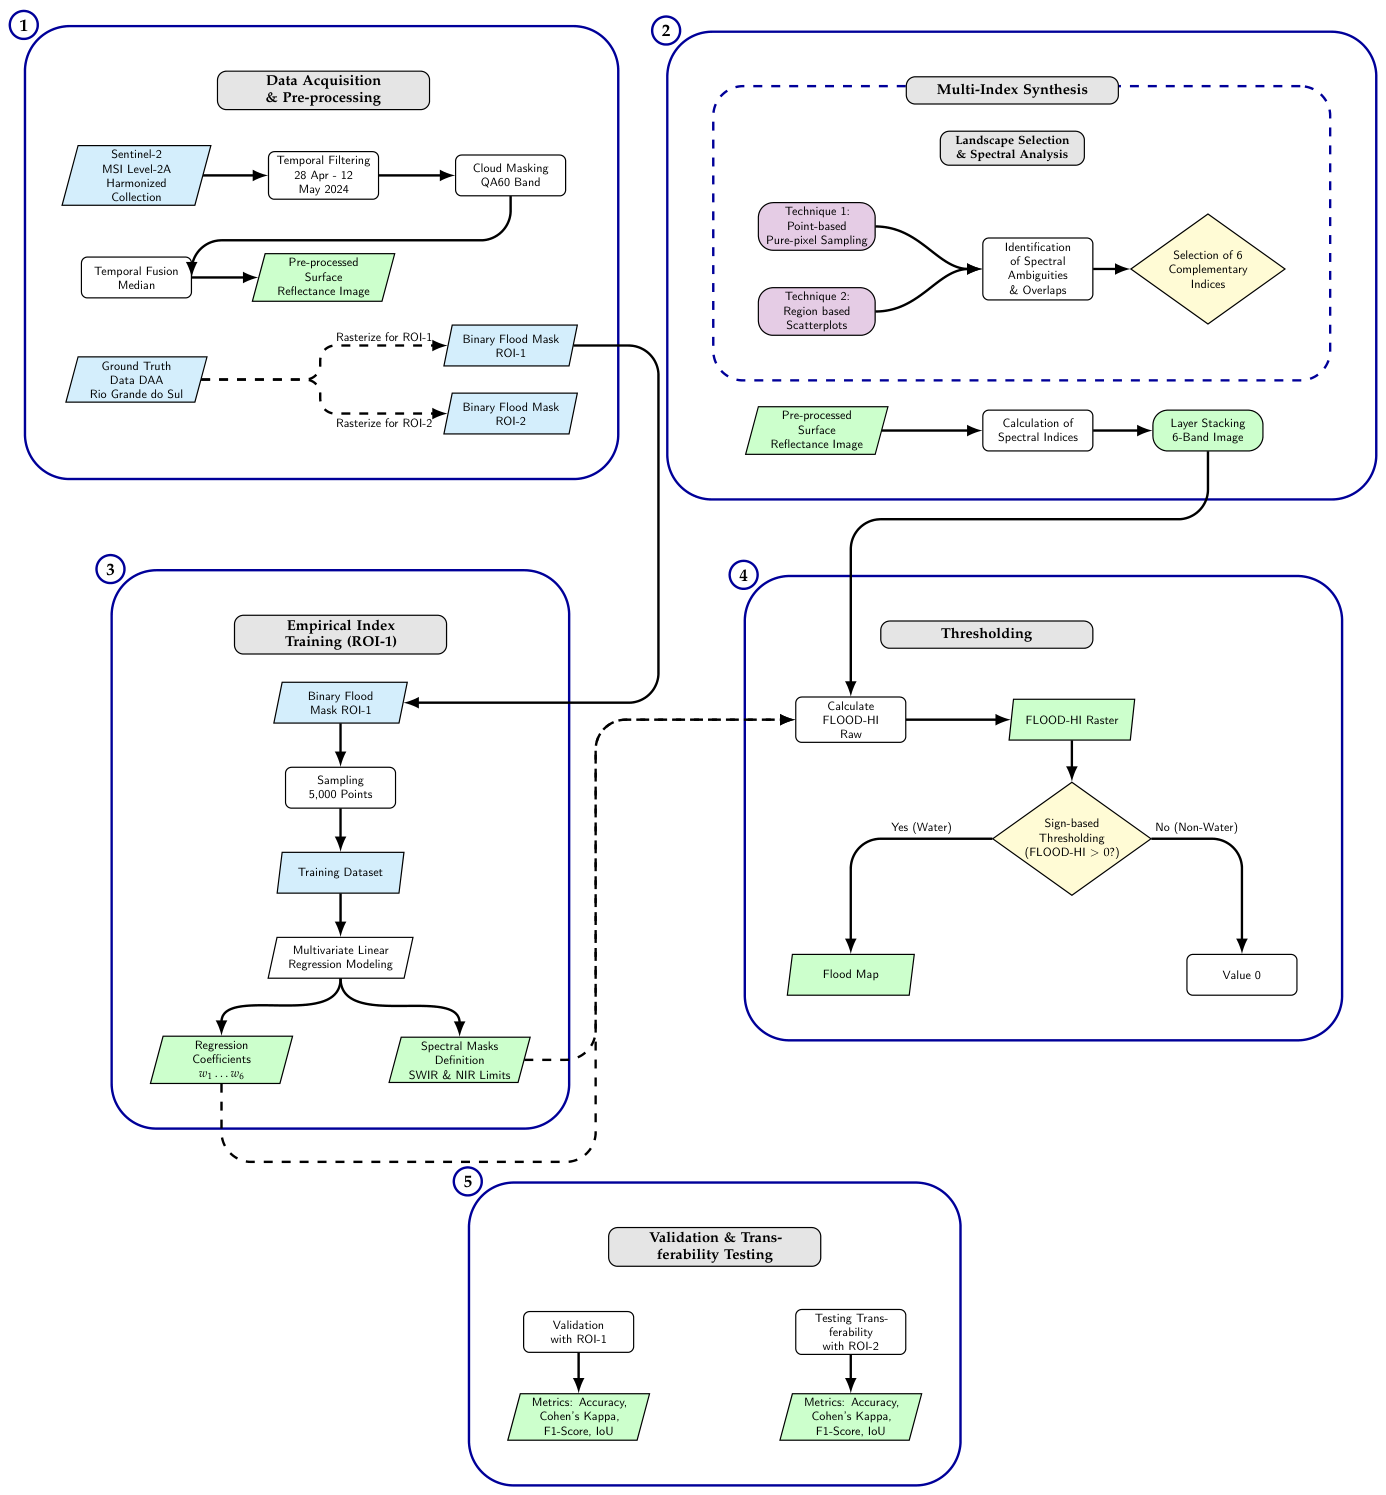
Figure 2.
Study area within the State of Rio Grande do Sul, Brasil: (a) Region Of Interest 1 (ROI-1), used for multivariate linear regression model training; and (b) Region Of Interest 2 (ROI-2), for independent geographical transferability testing.
Figure 2.
Study area within the State of Rio Grande do Sul, Brasil: (a) Region Of Interest 1 (ROI-1), used for multivariate linear regression model training; and (b) Region Of Interest 2 (ROI-2), for independent geographical transferability testing.
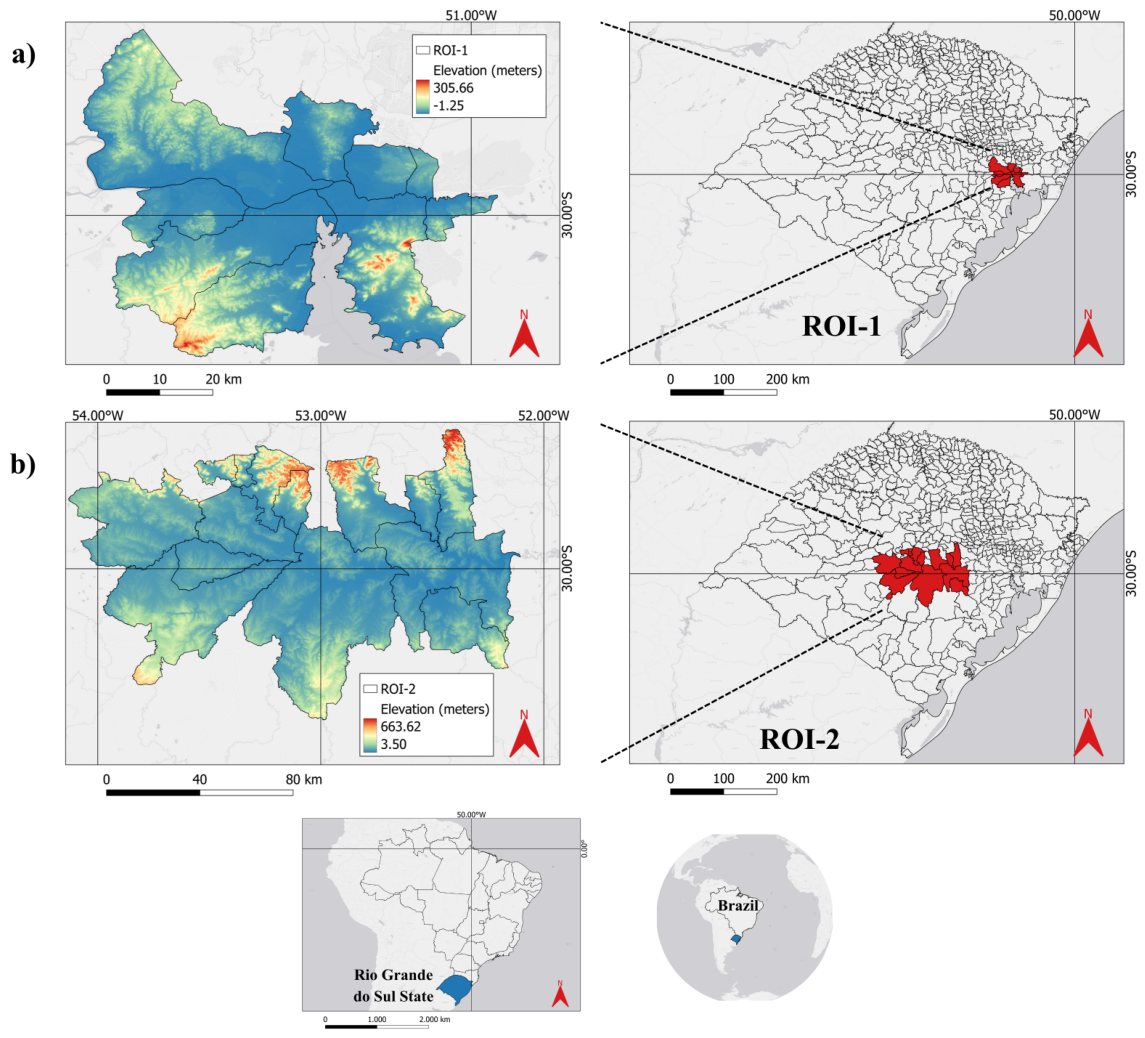
Figure 3.
Point-based pure-pixel sampling strategy for spectral signature extraction for the water landscapes. The analysis is presented in two panels: (a) refer to the first five selected sample points and (b) to the remaining five. Each panels display, in sequence, the spatial location of the five sample points, the resulting spectral reflectance curves for the six diagnostic bands, and the visual context of each point in True Color Composite (TCC; bands B4, B3, B2), False Color Composite I (FCC1; bands B8, B4, B3), and False Color Composite II (FCC2; bands B12, B8, B4).
Figure 3.
Point-based pure-pixel sampling strategy for spectral signature extraction for the water landscapes. The analysis is presented in two panels: (a) refer to the first five selected sample points and (b) to the remaining five. Each panels display, in sequence, the spatial location of the five sample points, the resulting spectral reflectance curves for the six diagnostic bands, and the visual context of each point in True Color Composite (TCC; bands B4, B3, B2), False Color Composite I (FCC1; bands B8, B4, B3), and False Color Composite II (FCC2; bands B12, B8, B4).
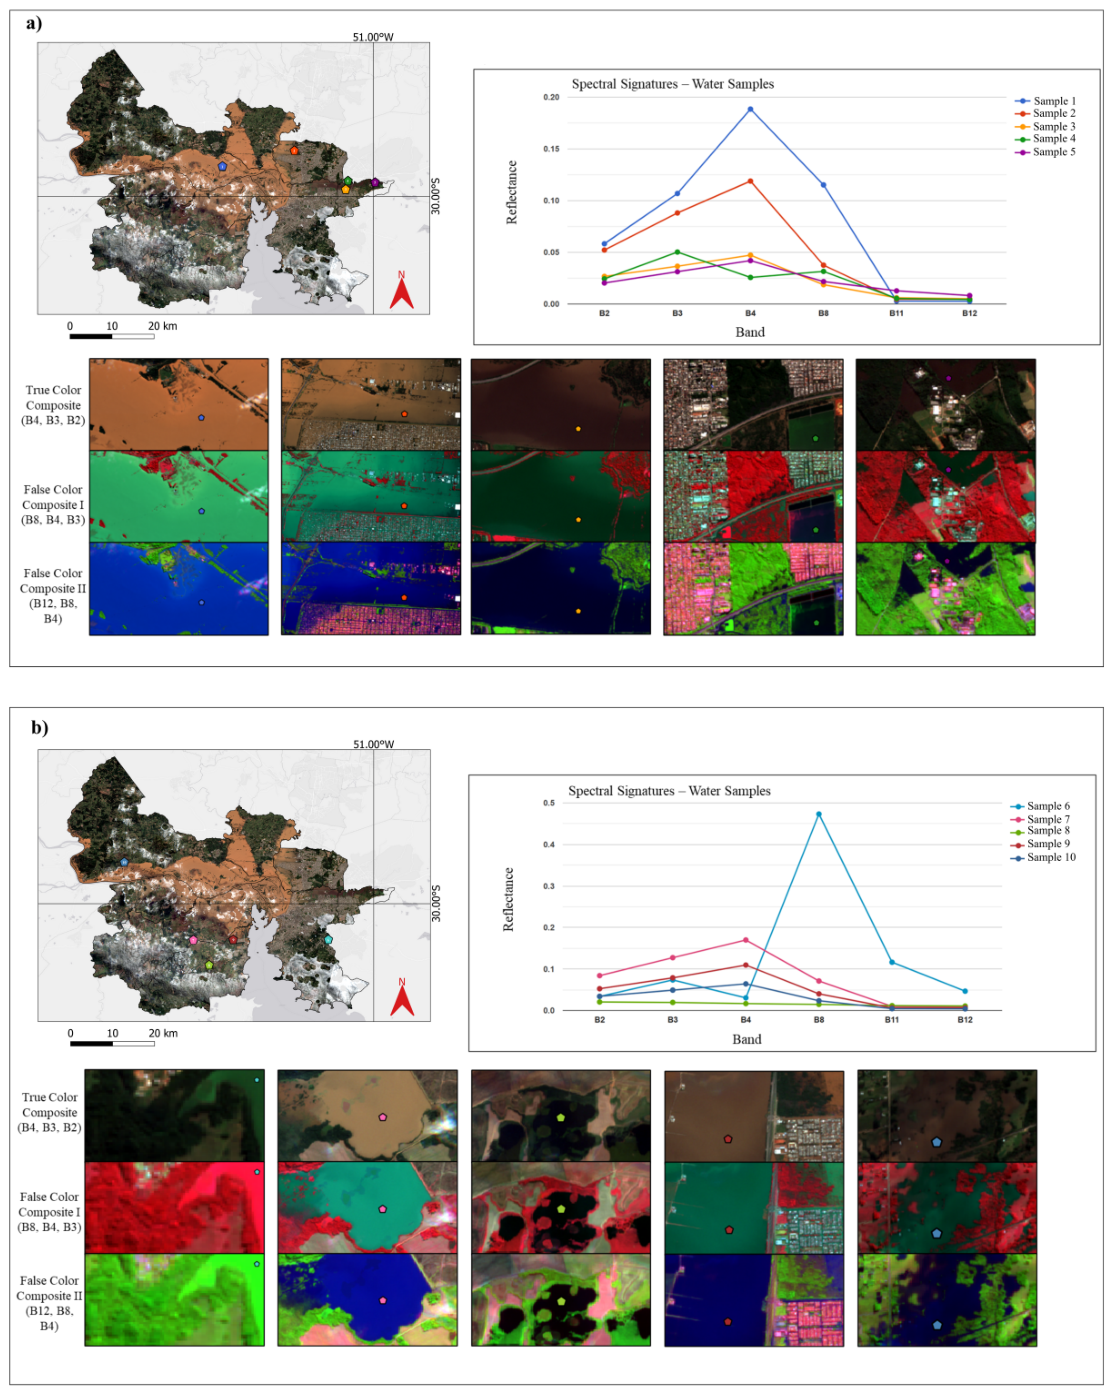
Figure 4.
Region-based spectral feature analysis for characterizing spectrally ambiguous zones, illustrating two representative cases (a,b). For each case, the panel presents the interactively delineated analysis window visualized in TCC (B4, B3, B2), FCC1 (B8, B4, B3), and FCC2 (B12, B8, B4). The corresponding scatterplots correlate Near-Infrared (B8) with visible bands (B2, B3, B4), derived from 1000 randomly sampled pixels within each analysis window.
Figure 4.
Region-based spectral feature analysis for characterizing spectrally ambiguous zones, illustrating two representative cases (a,b). For each case, the panel presents the interactively delineated analysis window visualized in TCC (B4, B3, B2), FCC1 (B8, B4, B3), and FCC2 (B12, B8, B4). The corresponding scatterplots correlate Near-Infrared (B8) with visible bands (B2, B3, B4), derived from 1000 randomly sampled pixels within each analysis window.
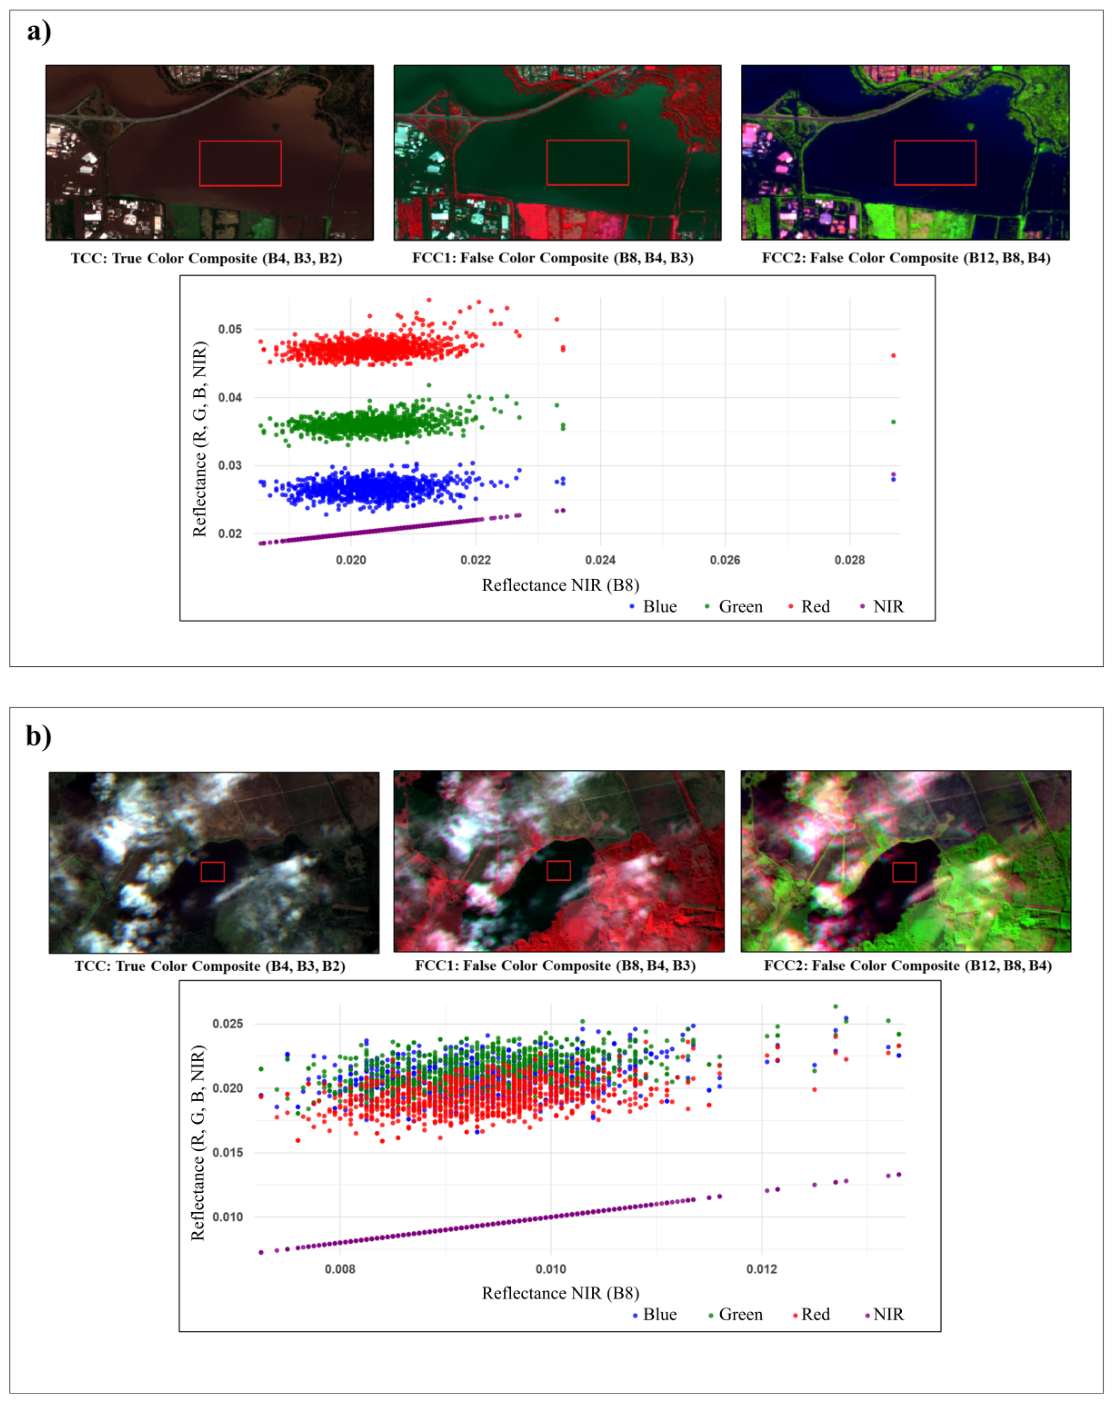
Figure 5.
Comparative scatter plots analyzing the discriminative capacity of the proposed FLOOD-HI (y-axis) against established water indices (x-axis): (a,b) NDWI, (c,d) AWEIsh, and (e,f) TCW. The left column displays results from ROI-1 (Training), while the right column shows ROI-2 (Testing). Red points represent flooded areas and blue points represent non-flooded areas. Linear trend lines are fitted for each class, accompanied by the respective Pearson correlation coefficients (r) and RMSE values.
Figure 5.
Comparative scatter plots analyzing the discriminative capacity of the proposed FLOOD-HI (y-axis) against established water indices (x-axis): (a,b) NDWI, (c,d) AWEIsh, and (e,f) TCW. The left column displays results from ROI-1 (Training), while the right column shows ROI-2 (Testing). Red points represent flooded areas and blue points represent non-flooded areas. Linear trend lines are fitted for each class, accompanied by the respective Pearson correlation coefficients (r) and RMSE values.
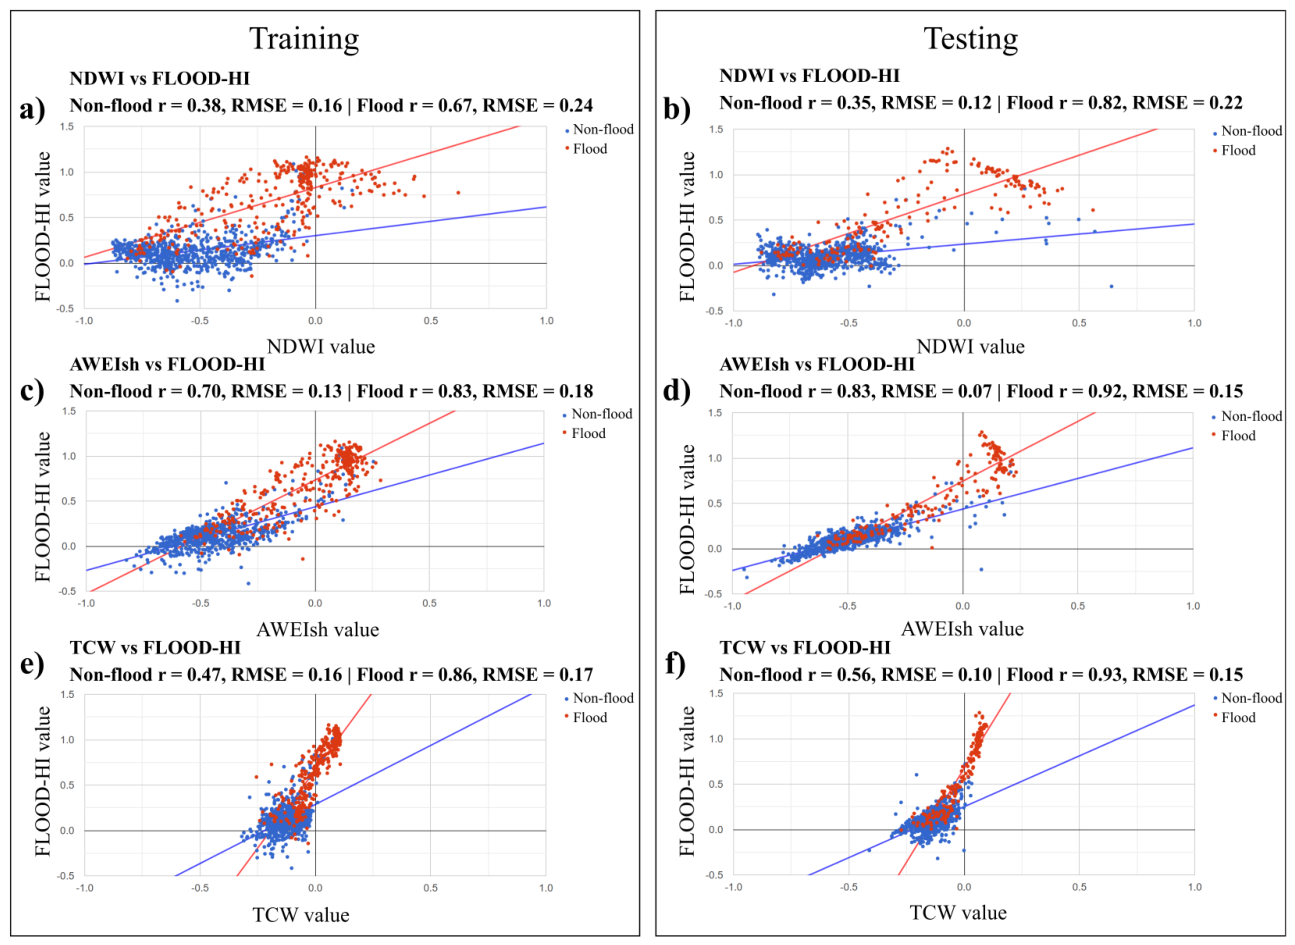
Figure 6.
Frequency distribution histograms of the spectral response of pixels classified as inundated within the Directly Affected Area (DAA). The plots overlay the distribution of the proposed FLOOD-HI (blue) against established water indices (red): NDWI, AWEIsh, and TCW. The left column displays results for ROI-1 (Training), while the right column displays ROI-2 (Testing).
Figure 6.
Frequency distribution histograms of the spectral response of pixels classified as inundated within the Directly Affected Area (DAA). The plots overlay the distribution of the proposed FLOOD-HI (blue) against established water indices (red): NDWI, AWEIsh, and TCW. The left column displays results for ROI-1 (Training), while the right column displays ROI-2 (Testing).
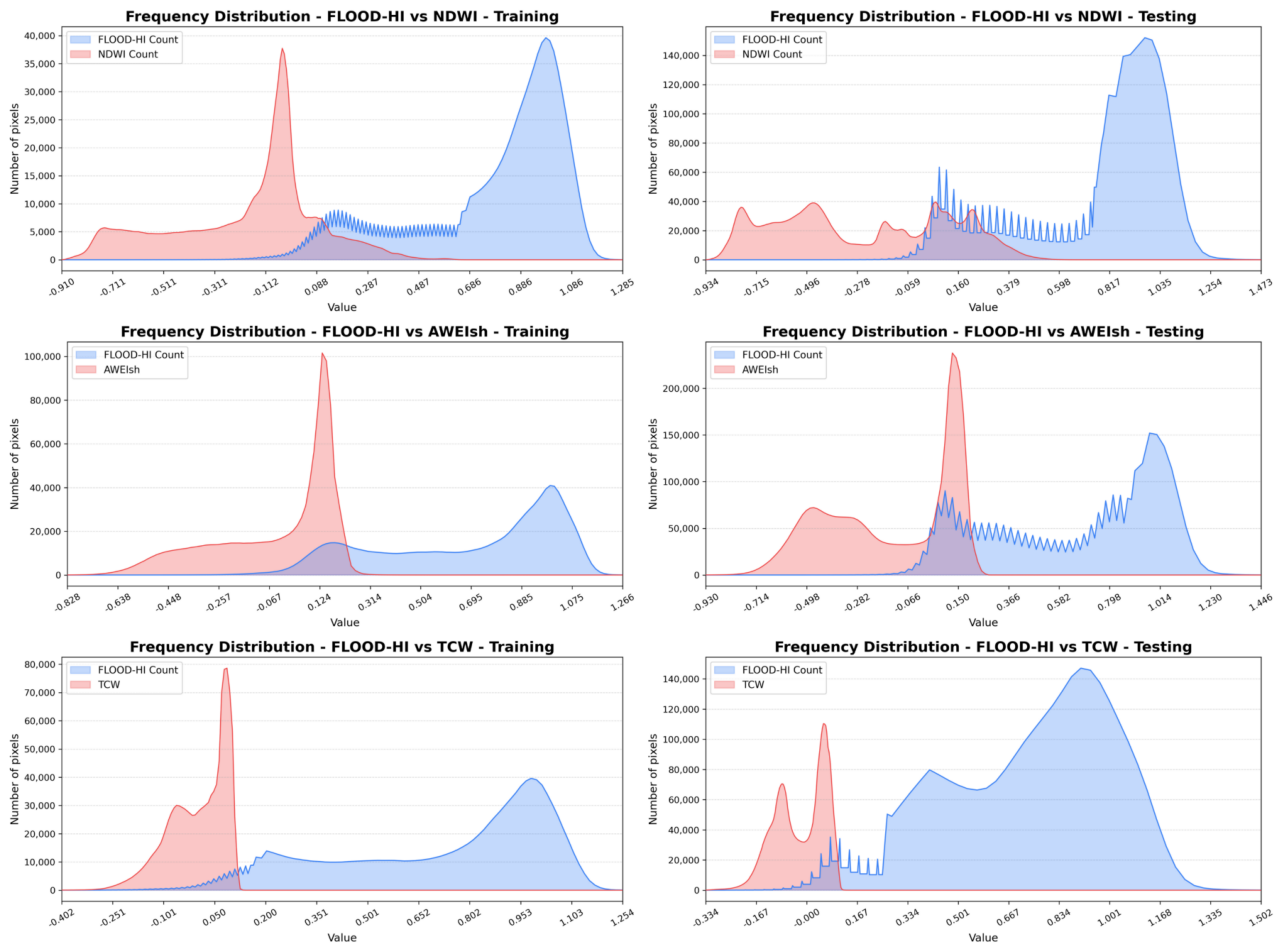
Figure 7.
Comparison of FLOOD-HI detection with the DAA ground-truth map and the Sentinel-2 true-color image within ROI-1. The top map, showing the location of the three inset scenes, uses land use and land cover (LULC) data derived from MapBiomas (https://brasil.mapbiomas.org/). Panels (a–c) display, from left to right: the Sentinel-2 true-color image, the flooded area identified by FLOOD-HI, and the Directly Affected Area (DAA).
Figure 7.
Comparison of FLOOD-HI detection with the DAA ground-truth map and the Sentinel-2 true-color image within ROI-1. The top map, showing the location of the three inset scenes, uses land use and land cover (LULC) data derived from MapBiomas (https://brasil.mapbiomas.org/). Panels (a–c) display, from left to right: the Sentinel-2 true-color image, the flooded area identified by FLOOD-HI, and the Directly Affected Area (DAA).
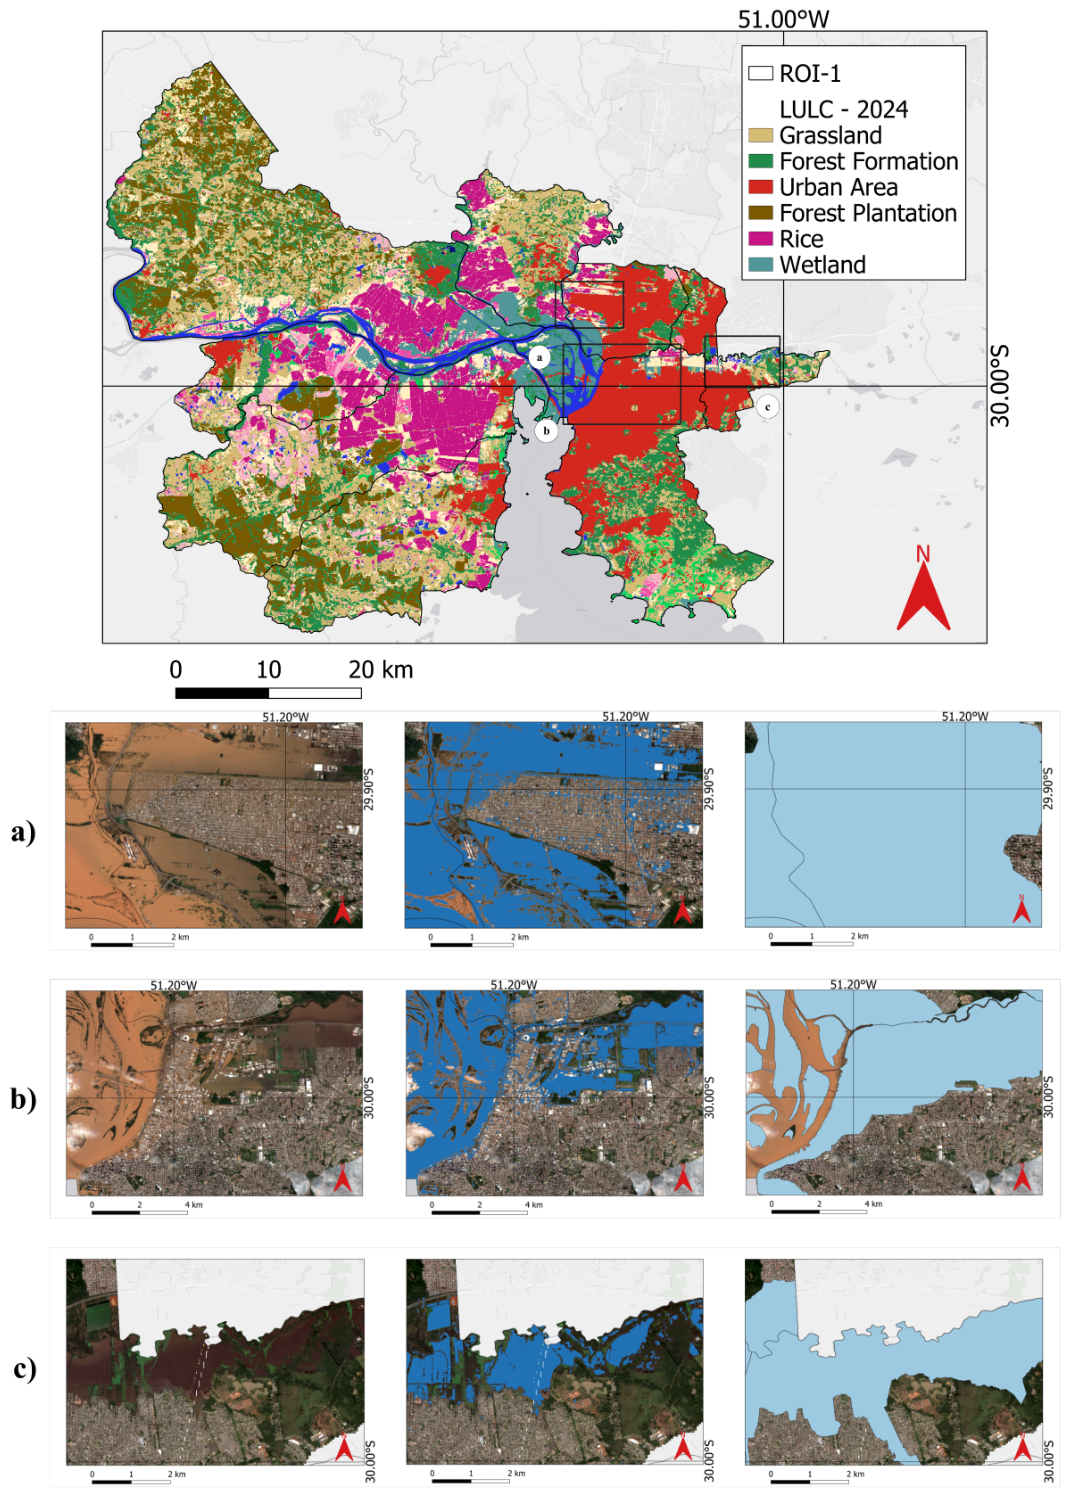
Figure 8.
Comparison of FLOOD-HI detection with the DAA ground-truth map and the Sentinel-2 true-color image within ROI-2. The top map, showing the location of the three inset scenes, uses land use and land cover (LULC) data derived from MapBiomas (https://brasil.mapbiomas.org/). Panels (a–c) display, from left to right: the Sentinel-2 true-color image, the flooded area identified by FLOOD-HI, and the Directly Affected Area (DAA).
Figure 8.
Comparison of FLOOD-HI detection with the DAA ground-truth map and the Sentinel-2 true-color image within ROI-2. The top map, showing the location of the three inset scenes, uses land use and land cover (LULC) data derived from MapBiomas (https://brasil.mapbiomas.org/). Panels (a–c) display, from left to right: the Sentinel-2 true-color image, the flooded area identified by FLOOD-HI, and the Directly Affected Area (DAA).
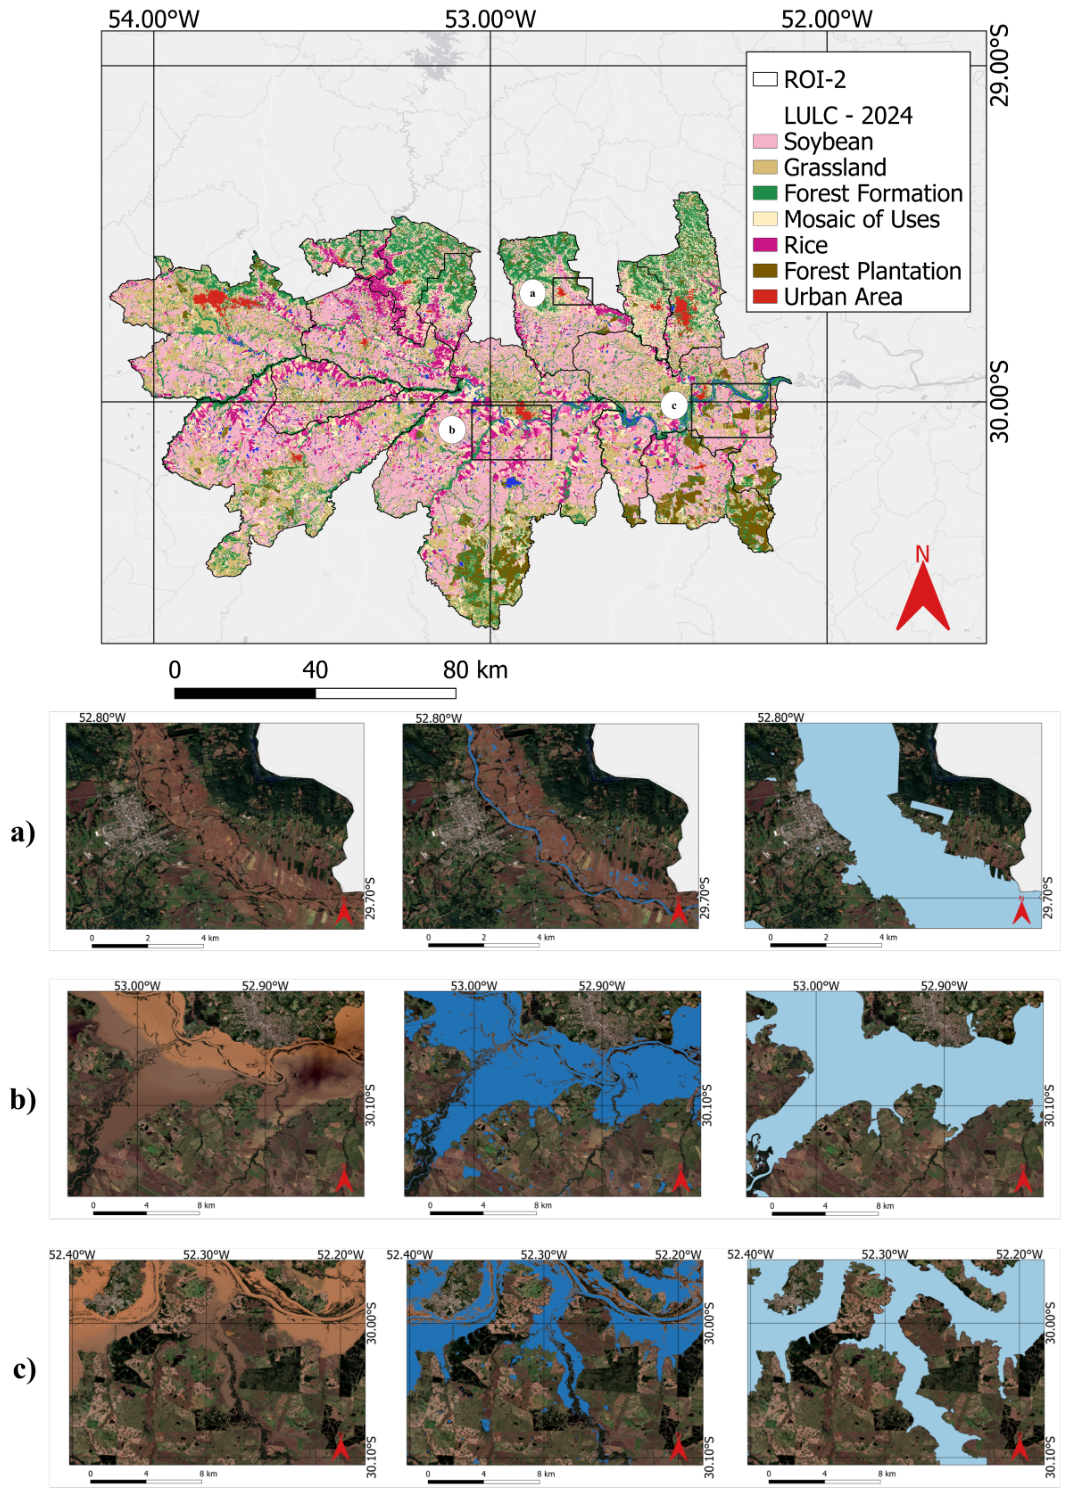

Table 1.
Spectral indices used in this study: formula, representative target classes and bibliographic reference.
Table 1.
Spectral indices used in this study: formula, representative target classes and bibliographic reference.
| Index | Formula (Sentinel-2) | Target classes | Ref. |
|---|---|---|---|
| NDWI | Open water; water bodies | [8] | |
| IMP | Impervious/exposed soil/paved areas | [25] | |
| AWEIsh | Automatic water extraction; suppresses shadows | [9] | |
| TCW | Scene wetness/overall water signal | [26,27,28] | |
| NDVI | Vegetation vigor | [29] | |
| SAVI | Vegetation-adjusted index | [30] |
Band notation: Sentinel-2—Blue = , Green = , Red = , NIR = , SWIR1 = , SWIR2 = .
Table 2.
Comparison of calibration metrics (ROI-1) for water indices: Accuracy, Precision, Recall, -score, IoU, and Kappa. The best performance for each metric is highlighted in bold.
Table 2.
Comparison of calibration metrics (ROI-1) for water indices: Accuracy, Precision, Recall, -score, IoU, and Kappa. The best performance for each metric is highlighted in bold.
| Index | Accuracy | Precision | Recall | -Score | IoU | Kappa |
|---|---|---|---|---|---|---|
| FLOOD-HI | 0.77 | 0.78 | 0.94 | 0.85 | 0.74 | 0.38 |
| NDWI | 0.74 | 0.22 | 0.93 | 0.36 | 0.22 | 0.27 |
| AWEIsh | 0.85 | 0.59 | 0.91 | 0.71 | 0.56 | 0.62 |
| TCW | 0.86 | 0.58 | 0.95 | 0.72 | 0.56 | 0.63 |
Table 3.
Comparison of validation metrics (ROI-2) for water indices: Accuracy, Precision, Recall, -Score, IoU, and Kappa. The best performance for each metric is highlighted in bold.
Table 3.
Comparison of validation metrics (ROI-2) for water indices: Accuracy, Precision, Recall, -Score, IoU, and Kappa. The best performance for each metric is highlighted in bold.
| Index | Accuracy | Precision | Recall | -score | IoU | Kappa |
|---|---|---|---|---|---|---|
| FLOOD-HI | 0.72 | 0.73 | 0.88 | 0.80 | 0.66 | 0.35 |
| NDWI | 0.85 | 0.35 | 0.85 | 0.49 | 0.33 | 0.42 |
| AWEIsh | 0.87 | 0.46 | 0.88 | 0.61 | 0.44 | 0.54 |
| TCW | 0.88 | 0.49 | 0.90 | 0.63 | 0.46 | 0.57 |
Disclaimer/Publisher’s Note: The statements, opinions and data contained in all publications are solely those of the individual author(s) and contributor(s) and not of MDPI and/or the editor(s). MDPI and/or the editor(s) disclaim responsibility for any injury to people or property resulting from any ideas, methods, instructions or products referred to in the content. |
© 2026 by the authors. Licensee MDPI, Basel, Switzerland. This article is an open access article distributed under the terms and conditions of the Creative Commons Attribution (CC BY) license (http://creativecommons.org/licenses/by/4.0/).
Copyright: This open access article is published under a Creative Commons CC BY 4.0 license, which permit the free download, distribution, and reuse, provided that the author and preprint are cited in any reuse.


