

Submitted:
07 July 2026
Posted:
08 July 2026
You are already at the latest version
Abstract
Taiwan has one of the highest dialysis prevalences worldwide, making safe and reliable hemodialysis monitoring a critical sensor-based healthcare challenge. Modern hemodialysis machines integrate heterogeneous multimodal sensors (pressure, flow, conductivity, temperature, and cardiovascular signals), but differences in machine brands, data formats, and privacy constraints hinder centralized learning and robust complication prediction. This work proposes a Medical IoT–oriented federated learning framework, PSOFed-HD, that performs dual-layer Particle Swarm Optimization (PSO) to enhance heterogeneous sensor fusion for predicting dialysis-related hypotension and discomfort events. Each hemodialysis machine is paired with an edge gateway acting as an FL client, where local PSO optimizes CNN feature weights over non-IID sensor subsets, while the central server applies PSO-driven aggregation to adaptively weight client models according to validation performance. Experiments on real-world hemodialysis datasets with 17 physiological features demonstrate that standard FedAvg yields an accuracy of 65.24% and F1-score of 0.5318, server-side PSO improves accuracy to 75.11%, and client-side PSO further raises accuracy to 81.97%. The proposed dual-layer PSO framework achieves the best performance, with 90.56% accuracy and an F1-score of 0.8533, along with superior ROC characteristics (AUC = 0.908) and stable cross-validation across 11 folds. These results confirm that jointly optimizing local feature representations and global aggregation weights enables effective fusion of heterogeneous hemodialysis sensor data under privacy-preserving Medical IoT constraints, providing a practical decision-support approach for early complication prediction in dialysis units.
Keywords:
medical IoT
; federated learning
; hemodialysis
; heterogeneous data fusion
; particle swarm optimization
; edge computing
1. Introduction
The global rise in chronic kidney disease (CKD) and end-stage renal disease (ESRD) has made maintenance hemodialysis an indispensable life-sustaining therapy, particularly in countries such as Taiwan where dialysis prevalence ranks among the highest worldwide. During hemodialysis, patients frequently experience complications including intradialytic hypotension, nausea, muscle cramps, and dizziness, which can degrade quality of life, interrupt treatment, and trigger emergency interventions. Early prediction of these adverse events would allow clinicians and nursing staff to adjust treatment parameters in real time, improving safety and reducing the clinical burden in dialysis units.
Modern hemodialysis machines operate as complex Medical IoT devices, integrating heterogeneous multimodal sensors that continuously monitor physiological and process variables such as arterial and venous pressure, blood and dialysate flow, conductivity, temperature, air bubbles, and related chemical indicators. These sensor streams form rich time-series data describing patient status and machine operation, and they are crucial for detecting abnormalities and preventing complications. However, differences in machine brands, hardware configurations, and data formats across machines lead to heterogeneous feature sets and non-uniform distributions, which complicate centralized data collection and model training. At the same time, strict requirements for patient privacy and regulatory compliance discourage the sharing of raw medical data, limiting the feasibility of conventional cloud-based analytics.
Federated learning (FL) has emerged as a promising paradigm for privacy-preserving model training in distributed Medical IoT environments. In FL, each client performs local training on its own data and uploads only model parameters to a central server for aggregation, thus avoiding direct transmission of raw patient records. This is well suited to networks of hemodialysis machines and edge gateways, where each client sees only a subset of sensor modalities and local patient cohorts. Nevertheless, standard aggregation schemes such as Federated Averaging (FedAvg) treat client models as homogeneous and typically weight them by sample size, which can result in biased global models and degraded performance when data and feature distributions are highly non-IID. In particular, naive weight averaging does not explicitly address heterogeneous sensor fusion, and may underutilize informative clients or overemphasize biased ones.
To address these challenges, this study focuses on real-time prediction of dialysis-related complications using a federated framework that explicitly targets heterogeneous sensor fusion in hemodialysis Medical IoT systems. We collect real-world hemodialysis records comprising 17 features from multiple sensors and treatment parameters, labeled according to blood pressure behavior (normal vs abnormal). The data are partitioned into multiple clients that each observe only partial feature subsets, thereby simulating realistic differences between machine configurations and sensor availability. On top of a 1D convolutional neural network (CNN) for time-series feature extraction, we introduce a dual-layer Particle Swarm Optimization (PSO) mechanism: client-side PSO for feature-level weighting of intermediate sensor representations, and server-side PSO for dynamic optimization of aggregation weights across heterogeneous client models. By jointly enhancing local feature discrimination and global aggregation, the proposed framework aims to improve prediction accuracy and stability under non-IID conditions while preserving data privacy.
Most current FL methods rely on aggregation algorithms such as FedAvg to combine client models, but these approaches perform poorly under data heterogeneity. To address this issue, Particle Swarm Optimization (PSO)—a swarm intelligence-based optimization algorithm—has been introduced to adjust aggregation weights. PSO simulates the cooperative search behavior of particles, enabling more effective fusion of client model parameters and improving classification accuracy. This research proposes a two stages PSO adaption on model parameters to enhance the final prediction accuracy on the Hemodialysis treatment discomfort, one on the client side, while the other on the server side.
When PSO was applied at both the client and server levels, the initial accuracy (around the 3rd epoch) already exceeded that of the other two methods, starting at approximately 50%.
As training progressed, the accuracy curve (as shown in Figure 9) exhibited a steeper and more stable upward trend, surpassing 85% around the 10th epoch and stabilizing near 90% by the 20th epoch. Overall, the dual-layer PSO method of PSOFed-HD achieved the highest final accuracy, outperforming the baseline and server-only PSO methods significantly. These findings indicate that the dual-layer PSO approach can more effectively integrate heterogeneous client features and dynamically adjust aggregation weights, ultimately achieving superior classification performance in federated learning environments with non-IID data distributions.
2. Background and Related Work
2.1. Hemodialysis Treatment Principles and the Role of Hemodialysis Machine Sensors
Hemodialysis Treatment Goals include toxin clearance such as urea nitrogen (BUN), creatinine etc. Fluid Balance controls dry weight, prevent pulmonary edema. Electrolyte Stability maintain blood potassium, sodium, and acid-base balance. Symptom improvement reduces complications like hypotension, cramps, nausea during dialysis. The treatment principles are introduced below:
2.1.1. Diffusion
The components of the dialysate are carefully formulated, with concentrations lower than those of toxins like urea and creatinine in the blood. This creates a concentration gradient across the semipermeable membrane of the dialyzer, allowing small-molecule toxins to diffuse from the blood into the dialysate.
2.1.2. Ultrafiltration
The dialysis machine uses transmembrane pressure (TMP) to push excess water out of the blood and into the dialysate side. This is key for controlling the patient’s dry weight and preventing edema and high blood pressure.
2.1.3. Convection
During water movement, some middle-molecule toxins (like β2-microglobulin) are carried away with the fluid. Convection complements diffusion, enhancing the clearance efficiency.
2.2. Clinical Functional Modules of the Dialysis Machine
2.2.1. Blood Pump
Maintains the blood flow rate (usually 200–400 mL/min) to ensure stable circulation.
2.2.2. Dialysate Delivery System
Controls dialysate flow rate and temperature, and monitors electrolyte concentrations.
2.2.3. Pressure Sensors
Monitor arterial pressure, venous pressure, and transmembrane pressure to prevent line blockage or membrane rupture.
2.2.4. Air/Bubble Detector
Prevents air from entering the bloodstream to avoid air embolism.
2.2.5. Conductivity and pH Detection
Ensure dialysate composition is correct to prevent metabolic acidosis or alkalosis.
2.2.6. Temperature Control
Keeps the dialysate at 36–37 °C to avoid hypothermia or hyperthermia. Blood Pressure and Heart Rate Monitoring: Reflects the patient’s tolerance in real time. Hemodialysis machines rely on a suite of integrated sensors to ensure safe, precise, and effective treatment. The most critical sensors include pressure, temperature, flow, force, and air/bubble detectors, each serving a distinct role in monitoring blood and dialysate conditions.
2.3. Basic Federated Learning Method: FedAvg
2.3.1. Model Structure
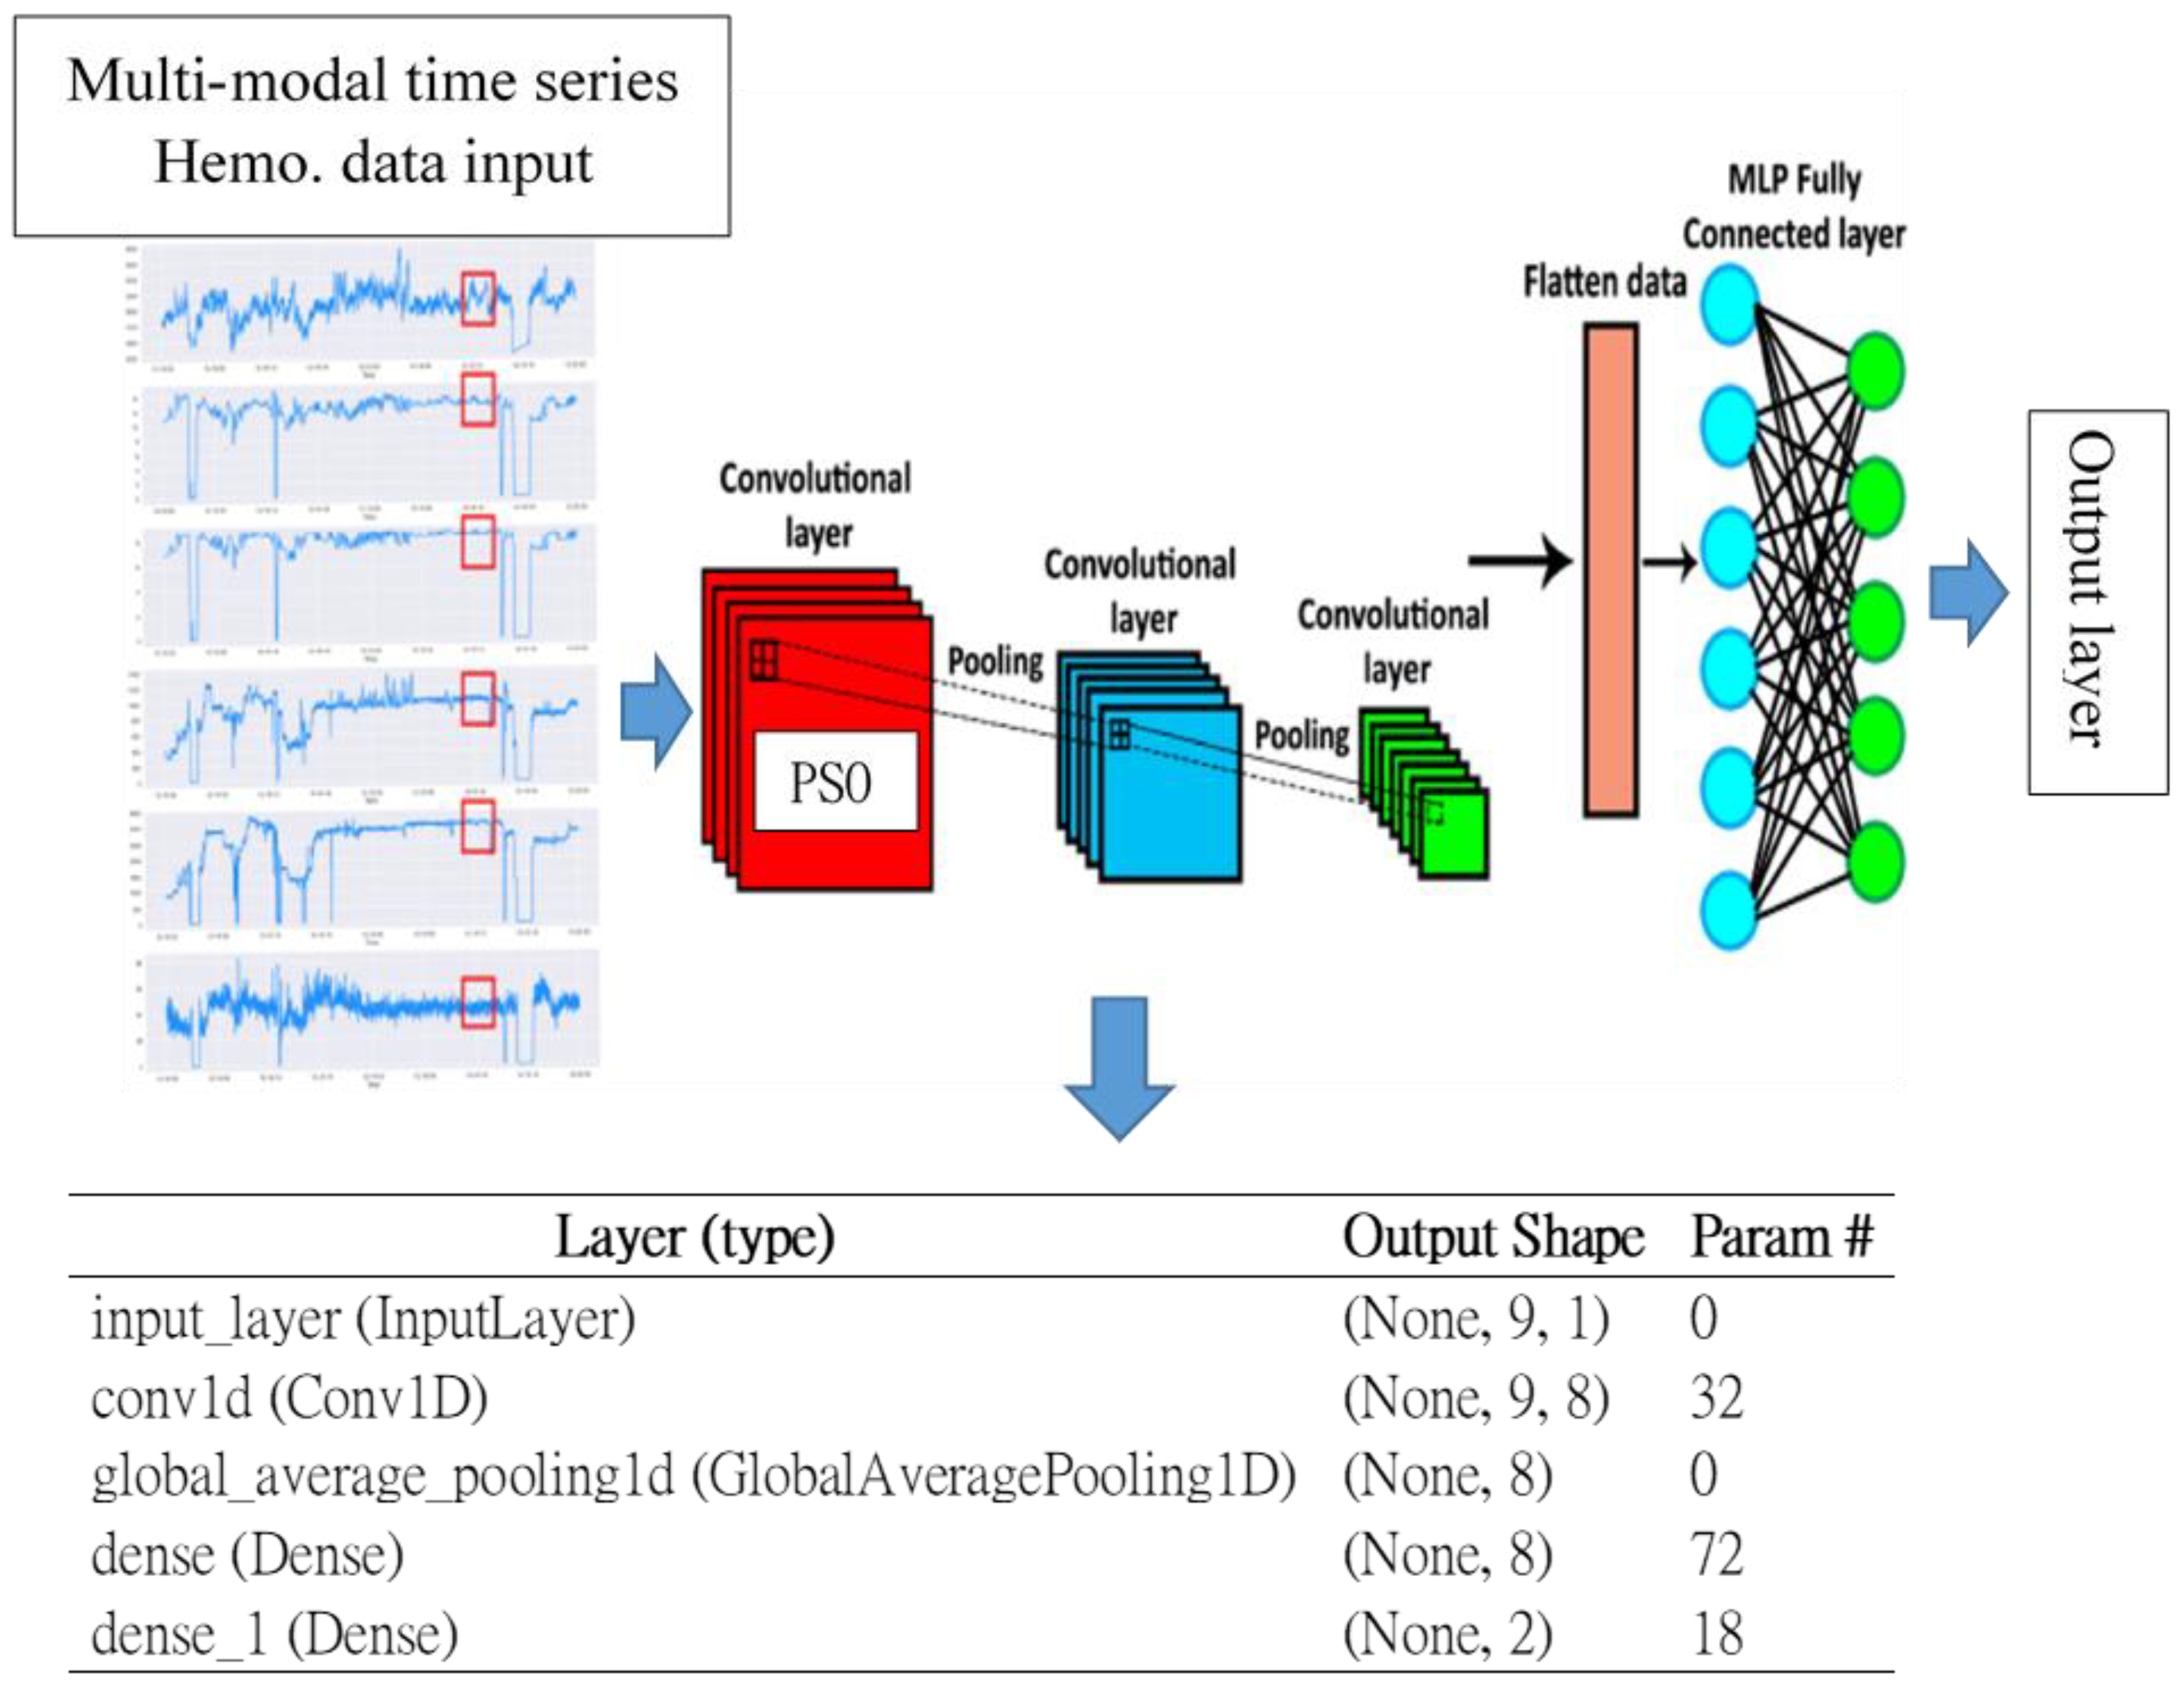
All clients use the same Convolutional Neural Network (CNN) architecture, consisting of a 1D convolutional layer, a flatten layer, a fully connected layer, and a dropout layer, followed by a Sigmoid activation function for binary classification.
2.3.2. Training Objective:
As shown in Equation (1), model weights from all clients are aggregated using the Federated Averaging (FedAvg) algorithm to form the global model, which serves as the control group baseline for comparison.
: Model weights of the k^thclient
: Number of samples on the k^thclient
N : Total number of samples across all clients
K : Total number of clients
2.4. Particle Swarm Algorithm
Particle Swarm Optimization (PSO) is a population-based metaheuristic algorithm inspired by the social behavior of birds flocking or fish schooling. It is widely used for solving optimization problems. Each particle represents a candidate solution in the search space. Particles move through the space by updating their velocity and position based on:
Their own best-known position (personal best, pBest)
The best-known position among all particles (global best, gBest)
The algorithm iteratively updates particles until a stopping condition (e.g., max iterations or convergence) is met. PSO is valued for its simplicity, efficiency, and ability to handle nonlinear, multidimensional optimization problems.
2.5. Federated Learning (FL) for Hemodialysis Related Complication Prediction
Federated Learning (FL), first proposed by Google, was designed to enable distributed model training while preserving data privacy. This technology allows each client to train models locally and upload only the trained model parameters to a central server for aggregation, rather than transferring raw data directly. Such an approach is particularly suitable for privacy-sensitive or data-restricted applications, including smartphone behavior analysis, medical diagnosis modeling, and industrial fault prediction.
Technically, the core workflow of federated learning consists of three stages: local model training, parameter uploading and aggregation, and global model updating. The Federated Averaging (FedAvg) algorithm, introduced by Konečný et al. [1], remains the most widely adopted aggregation method, demonstrating good performance in communication efficiency and computational stability. In many practical implementations, FL also supports asynchronous updates, partial client participation, and mini-batch training mechanisms, further reducing training time and communication overhead.
Despite its advantages in distributed training and privacy preservation, FL still faces challenges during deployment due to the data heterogeneity of client, especially in the Hemodialysis environment. These practical issues form the foundation for ongoing research and are a key motivation behind the framework design in this study.
Some relevant federated learning techniques have been used in the Hemodialysis treatment related complications from minor discomfort to major lethal events. Chun-Te Huang et al. [22] federated learning (FL), to establish an aggregate model for acute kidney injury (AKI) prediction in critically ill patients in Taiwan. This work used data from the Critical Care Database of Taichung Veterans General Hospital (TCVGH) from 2015 to 2020 and electrical medical records of the intensive care units (ICUs) between 2018 and 2020 of four referral centers in different areas across Taiwan. AKI prediction models were trained and validated thereupon. An FL-based prediction model across hospitals was then established. The study included 16,732 ICU admissions from the TCVGH and 38,424 ICU admissions from the other four hospitals. The complete model with 60 features and the parsimonious model with 21 features demonstrated comparable accuracies using extreme gradient boosting, neural network (NN), and random forest, with an area under the receiver-operating characteristic (AUROC) curve of approximately 0.90. The Shapley Additive Explanations plot demonstrated that the selected features were the key clinical components of AKI for critically ill patients. The AUROC curve of the established parsimonious model for external validation at the four hospitals ranged from 0.760 to 0.865. NN-based FL slightly improved the model performance at the four centers.
2.6. Challenges of Heterogeneous Data in Federated Learning Feature Fusion
While federated learning effectively mitigates the privacy risks associated with centralized learning, it faces major challenges when dealing with heterogeneous data. Heterogeneity manifests at three levels: data heterogeneity, system heterogeneity, and statistical skew. Data heterogeneity refers to differences in data sources, formats, and feature distributions among clients.
Statistical heterogeneity means uneven class distributions across clients (e.g., certain clients may have samples concentrated in a few categories).
System heterogeneity arises from variations in hardware performance, storage capacity, and battery life, which can impact synchronization and fairness during training. When client data distributions differ, even using FedAvg may result in a global model that generalizes poorly or biases toward clients with more abundant data, causing unstable training or convergence issues. Niknam et al. [16] demonstrated that in wireless device scenarios, highly heterogeneous environments significantly degrade convergence and classification performance if client participation ratios and model contributions are not properly balanced.
To address these challenges, various strategies have been proposed. Some studies introduce adaptive aggregation methods that adjust client weights based on model loss or gradient magnitude, while others vary local training epochs or learning rates according to data characteristics. In addition, Clustered FL and Personalized FL approaches have been developed to handle data diversity by grouping clients or training multiple models, enhancing both local adaptability and global generalization [10,11].
The heterogeneity problem not only affects model accuracy but also impacts fairness and system efficiency. Therefore, achieving effective learning across non-uniform data and system conditions—while preserving privacy—has become a crucial bottleneck for FL scalability. This study aims to address this challenge through the integration of dual-layer PSO optimization, seeking to balance model performance and features fusion issues.
3. Materials and Methods
3.1. System Architecture and Medical IoT Topology
The proposed PSOFed-HD framework as shown in Figure 1 consists of five stages: data preprocessing, client-side local training, server-side model aggregation, iterative federated updating, and final evaluation. The overall architecture is designed for a Medical IoT environment in which each hemodialysis machine or edge gateway functions as a federated client. Raw patient data remain local to each site, and only model parameters are exchanged with the central server.
During preprocessing, the original hemodialysis records are merged, labeled, normalized, and partitioned into multiple client subsets to simulate heterogeneous deployment conditions. Each client receives only a subset of the available features to reflect realistic differences in sensor availability across devices. The local models are then trained independently, and their updated parameters are sent to the server for aggregation. The server evaluates candidate global models and redistributes the best-performing one to the clients for the next training round. This cycle continues until convergence or a predefined stopping criterion is reached.
3.2. Hemodialysis Dataset Preprocessing
The dataset used in this study was collected from real hemodialysis patient records (as shown in Figure 2). It contains 17 features representing various physiological indicators and measurement data recorded during the dialysis process. The dataset includes two classification labels: Normal (0): Indicates that the patient’s blood pressure fluctuations remain within the normal range. Abnormal (1): Indicates that the patient experiences abnormal blood pressure drops, falling below 90 mmHg.
The 17 features include: total ultrafiltration volume, blood flow rate, conductivity, venous pressure, body temperature, heart rate, dialysis phase status, anticoagulant injection status, anticoagulant dosage, transmembrane pressure, target ultrafiltration volume, ultrafiltration rate, substitution flow rate, dialysate flow rate, time index, and stage indicator.
All data were read from two separate files—one labeled as “normal” and the other as “abnormal.” The datasets were then merged and randomly shuffled to ensure an even and unbiased distribution of samples across both classes.
3.3. Client-Side Model
Each client uses a lightweight 1D convolutional neural network for local learning. The 1D CNN is suitable for sequential or tabular treatment data because it can extract local patterns from ordered feature vectors while maintaining relatively low computational cost. The model contains convolution, flattening, fully connected, and dropout layers, followed by a sigmoid output for binary classification.
On each client, PSO is applied to optimize the weights of intermediate feature representations produced by the CNN. Each particle corresponds to a candidate feature-weighting vector. The fitness of each particle is evaluated on the local validation set according to classification accuracy. The best particle is retained as the client’s optimal feature-fusion configuration. This mechanism enables the model to emphasize informative local features even when some modalities are missing or incomplete.
Figure 3.
Model Architecture.
3.4. Data Flow for the PSO-Enhanced Federated Learning
Figure 4 illustrates the complete data flow of the proposed PSO-enhanced federated learning framework, covering both training and testing phases. The workflow begins at the client side, where each client receives its own local hemodialysis dataset containing heterogeneous feature subsets. Due to differences in sensor availability and dialysis machine configurations, each client only processes partial features, which reflects a realistic non-IID clinical scenario.
During local training, the raw time-series data are first normalized and fed into the 1D CNN model for initial feature extraction. At this stage, client-side PSO is applied to the intermediate convolutional feature maps, where particles represent different feature weighting combinations. Through iterative optimization, each client identifies an optimal feature weighting scheme that maximizes its local validation accuracy, thereby enhancing discriminative feature representation under limited feature conditions.
After local optimization, the updated model parameters are transmitted to the central server without sharing raw patient data, preserving data privacy. At the server side, a second PSO process is performed to optimize the aggregation weights of different client models. Each particle represents a candidate aggregation strategy, and its fitness is evaluated based on server-side validation accuracy. The best-performing particle determines the final global model, which is then redistributed to all clients for the next training round.
This dual-layer PSO data flow enables both feature-level enhancement at clients and model-level optimization at the server, effectively addressing feature heterogeneity while maintaining privacy and communication efficiency.
3.5. Control and Experimental Group Design
3.5.1. Server-Side PSO Fusion Method (Experimental Group 1)
Late-Stage Fusion Strategy:The main objective of this method is to use Particle Swarm Optimization (PSO) at the server stage to dynamically adjust the contribution weights of each client’s model during aggregation. This approach aims to achieve a more generalized global model under heterogeneous data conditions. Unlike the traditional FedAvg method, which performs linear weighting based solely on sample size, PSO searches for an optimal weight configuration that considers each client model’s contribution to the overall global accuracy, thereby improving aggregation quality.
Algorithm 1: Server-side PSO ModelAggregation
Input: Local model weights {W₁, W₂, …, Wₖ} from K clients, server validation set (X_val_svr, y_val_svr),particle number P, iteration T, inertia w, learning factors c₁, c₂
Output: Global model weights W_global
1 Initialize particles {Aₚ}ₚ₌₁ᴾ as random aggregation weight vectors of size K;
2 foreach particle Aₚ do3 Project Aₚ to simplex (non-negative, sum to 1);4 Set velocity Vₚ ← 0;5 Compute W_candidate ← Σₖ=1ᴷ Aₚ[k] · Wₖ;6 Evaluate fitness fₚ = Accuracy(W_candidate, (X_val_svr, y_val_svr));7 Set PBestₚ ← Aₚ, PBestScoreₚ ← fₚ;8 Set GBest ← arg maxₚ(PBestScoreₚ);
9 for t = 1 to T do10 foreach particle Aₚ do11 r₁, r₂ ← Uniform(0, 1);12 Vₚ ← w·Vₚ + c₁·r₁·(PBestₚ − Aₚ) + c₂·r₂·(GBest − Aₚ);13 Aₚ ← Aₚ + Vₚ;14 Project Aₚ to simplex;15 Re-evaluate fitness and update PBestₚ, GBest if improved;16 end foreach
17 if ConvergenceCriterionMet() then18 break;19 end if20 end for
21 W_global ← Σₖ=1ᴷ GBest[k] · Wₖ;
22 return W_global
Process Description:
- Particle Definition and Initialization
Define the number of PSO particles as . Each particle represents a potential weight vector:
where is the total number of clients. Each vector element corresponds to the weight coefficient representing a client’s contribution to the global model.
2. Particle Decoding and Model AggregationFor each particle , use its weight vector to perform weighted aggregation of model parameters received from all clients, thereby generating a candidate global model :
= (2)
where represents the model parameters uploaded by the client after local training.
3.Fitness Evaluation
Each aggregated candidate model is evaluated on the server validation dataset, and its prediction accuracy is used as the fitness value of the corresponding particle . The particle with the highest fitness value is selected as the optimal solution:
where denotes the server-side validation dataset, and represents the best-performing particle.
4. Particle Update (Velocity & Position Update)
According to the standard Particle Swarm Optimization (PSO) update rules, each particle adjusts its velocity and position based on its personal best solution (pBest) and the global best solution (gBest) as follows:
where:
: Particle position (i.e., weight vector)
: Particle velocity
: Inertia weight
: Learning coefficients
: Random constants between 0 and 1
5. Optimal Particle Selection and Final Aggregation
When the maximum iteration count or convergence condition is reached, the particle that achieves the highest validation accuracy is selected as the best particle (pBest). The final global model is then obtained by aggregating client models using the best particle’s weight vector:
Where:
: Final global model
: Weight assigned to the client in the best particle
- Initialize particles .
- foreach particle
- 3.
- end foreach
- 3.
- Set
- for
- 26.
- end for
- 26.
- return
- Definition of Local Particles (Client-Side)Each client initializes several PSO particles, where each particle represents a set of weighting coefficients applied to the sliding window outputs of the CNN layer.If the intermediate layer produces
- 2.
- Feature Map Weighted SynthesisEach particle corresponds to a particular way of weighting the intermediate feature maps. The CNN’s sliding outputs are weighted by the particle’s coefficients, then summed to form a synthetic feature map, which serves as the input for the next CNN layer—representing feature combinations with different importance distributions:
3. Local Fitness Evaluation
Each client evaluates the classification accuracy of the model using the feature map generated by each particle on its local validation dataset. The higher the accuracy, the higher the fitness value . The particle with the highest fitness is then selected as the best particle:
where:
: Local validation dataset
: Fitness of the best-performing particle
4. Particle Update
The standard PSO update strategy is used to iteratively update each particle’s velocity and position:
4. Results
4.1. Relationship Between Particle Count, Iteration Count, and Accuracy
Table 1 presents a comparison of model accuracy under different particle counts and iteration counts. It can be observed that increasing the number of iterations has minimal impact on accuracy improvement, whereas increasing the number of particles results in a significant performance gain.
For example, under the same condition of five iterations, an absolute accuracy improvement of approximately 50 percentage points, while using 100 particles increases accuracy by about 60%. However, when the number of particles exceeds 100, the improvement becomes negligible, indicating that the model begins to converge and additional particles no longer contribute to better performance. To visually analyze the impact of PSO on feature extraction, Figure 6 illustrates the feature activation maps before and after optimization, showing clearly enhanced feature formatting in relevant frequency bands.
These visualizations in Figure 6 show how feature activations vary across filters and time steps, before and after applying Particle Swarm Optimization (PSO).
Table 2 compares the feature characters before and after applying Particle Swarm Optimization (PSO)Interpretation.
- Before PSO:
Feature activations are low and sparse, with only a few filters showing moderate values. This suggests limited differentiation or signal strength across the grid.
- After PSO:
The optimization significantly boosts activation values, especially in filters 2–6 and time steps 1–3. The heatmap becomes more expressive, indicating that PSO helped concentrate and amplify meaningful features.
4.2. Comparison of Accuracy Among Different Methods
Figure 7 presents the test success rates of ten client groups using three different federated learning strategies: baseline FedAvg, server-side PSO aggregation, and the proposed dual-layer PSO method. The comparison highlights clear differences in convergence behavior, stability, and final classification performance under heterogeneous data conditions.
The baseline FedAvg method exhibits slow accuracy improvement and significant fluctuations during training. Due to unequal feature distributions across clients, the global model tends to bias toward dominant clients, resulting in unstable convergence and a relatively low final accuracy of approximately 65%. This confirms the limitation of sample-size-based aggregation when handling non-IID hemodialysis data.
When server-side PSO is introduced, the aggregation weights are dynamically optimized according to validation performance rather than sample size alone. As a result, the model demonstrates improved convergence stability and achieves higher final accuracy, reaching around 75%. However, performance variations across different clients are still noticeable, especially during early training epochs, indicating that local feature representations remain suboptimal.
In contrast, the proposed dual-layer PSO approach achieves superior performance across all client groups. The accuracy curve shows a steeper and more stable upward trend from early epochs, surpassing 70% accuracy by approximately the 15th epoch and stabilizing near 75%–80% thereafter. Notably, the initial accuracy at early epochs is significantly higher than that of the other two methods, demonstrating faster convergence. These results confirm that combining client-side feature optimization with server-side aggregation optimization enables more effective learning from heterogeneous data, yielding the most robust and accurate global model.
4.3. Cross-Validation
To further evaluate the robustness and generalization capability of the proposed framework, an 11-fold cross-validation experiment was conducted, with the results shown in Figure 8. In each fold, one subset was reserved for validation while the remaining subsets were used for federated training, ensuring that the model was evaluated across diverse data partitions.
The cross-validation results demonstrate consistently high success rates across all folds, with only minor performance variations. Most folds achieved validation accuracies above 90%, indicating strong generalization despite heterogeneous feature distributions among clients. The absence of extreme performance drops suggests that the proposed dual-layer PSO framework effectively mitigates overfitting and reduces dependency on specific data partitions.
Overall, the stability of validation performance across folds confirms that the proposed model is not tailored to a particular data split, but instead learns robust feature representations suitable for real-world deployment in distributed hemodialysis environments. These results further validate the reliability and practical applicability of the proposed federated learning approach.
4.4. Ablation Experiments
4.4.1. Learning Efficiency Comparison
Figure 9 shows accuracy vs. training iteration for four federated learning modalities applied to hemodialysis complication prediction, with PSO-based variants compared against standard FedAvg. All four curves exhibit rapid accuracy gains in the first ~3–4 iterations, then slower improvements and visible small oscillations rather than perfectly smooth convergence. Accuracy appears to stabilize after roughly 10–12 iterations, suggesting the PSO dynamics reach a quasi-steady regime where updates fluctuate around a plateau.
Modality comparison:
Full PSO (blue): Highest-performing method; it starts near 30% and climbs quickly above 80% by iteration ~4–5, eventually approaching ~88–90% with noticeable but bounded post-oscillations. This suggests that jointly applying PSO on both client and server sides yields the strongest global optimization of the hemodialysis complication model.
Client-only PSO (orange): Second-best curve; it tracks below Full PSO but clearly above the other two methods, plateauing in the low-80% range. This implies that PSO applied only to local client updates still improves federated optimization, but lacks the additional refinement provided by server-side PSO.
Server-only PSO (green): Intermediate performance; it rises similarly early on but stabilizes around the mid-70% accuracy range, indicating that optimizing aggregation or global parameters alone is beneficial yet less effective than adjusting client-side behaviors.
FedAvg (red): Baseline; it improves from ~30% to about 60–65% accuracy and then plateaus, with relatively small oscillations. This curve illustrates the performance gap between conventional federated averaging and the PSO-enhanced strategies in your ablation study.
4.4.2. Final Prediction Accuracy Comparison of Different Modalities
Figure 10 compares the confusion matrices (and derived metrics) of the four aggregation strategies at their final converged state for the binary task: predicting Normal vs Abnormal hemodialysis status.
Full PSO method(top-left)’s accuracy is 90.6% and F1 is 0.853, the best among all methods.
It shows 147 true normals correctly classified (TN) and only 6 normals misclassified as abnormal (FP). There are 64 true abnormals correctly detected (TP) and 16 missed abnormals (FN). This indicates both strong specificity (few false alarms) and strong sensitivity (most abnormal cases detected). Client-only PSO (top-right)’s accuracy is 82.0% and F1 is 0.734, clearly lower than Full PSO but still better than server-only PSO and FedAvg. TN = 133, FP = 12, TP = 58, FN = 30. Compared with Full PSO, you see more missed abnormal cases and more normals incorrectly flagged, which explains the drop in F1. Server-only PSO (bottom-left)’s accuracy is 75.1% and F1 is 0.646. TN = 122, FP = 16, TP = 53, FN = 42. Both error types increase: more false alarms and more undetected abnormal cases, leading to weaker clinical reliability than client-side PSO. FedAvg baseline (bottom-right)’s accuracy is 65.2% and F1 is 0.532, the weakest performer. TN = 106, FP = 23, TP = 46, FN = 58. The model misses a large fraction of abnormal cases and overflags normals, reflecting substantial degradation when no PSO-guided aggregation is used.
Overall, the confusion matrices reinforce the earlier learning-curve ablation: full PSO improves both detection of abnormal complications and avoidance of unnecessary alarms, while progressively removing PSO components (client-side, then server-side, then none) worsens the clinical trade-off between sensitivity and specificity
4.4.3. Performance Comparison of PSO Federated Learning for Different Fusing Strategies
This ablation study evaluates the contribution of different PSO fusion strategies by comparing four aggregation modes: baseline FedAvg, server-side PSO only, client-side PSO only, and the proposed full dual-layer PSO approach. The comparison metrics include precision, recall, F1-score, and overall classification accuracy, as summarized in Table 3.
The FedAvg baseline achieves the lowest performance, with an accuracy of 65.24% and an F1-score of 0.5318. Its low recall value indicates that many abnormal hemodialysis events are incorrectly classified as normal, which is undesirable in clinical risk prediction scenarios. This result highlights the inadequacy of simple averaging under heterogeneous feature distributions.
Applying PSO solely at the server side improves performance significantly. The accuracy increases to 75.11%, and both precision and recall show moderate improvement. This demonstrates that dynamically optimized aggregation weights can partially compensate for client heterogeneity by emphasizing more informative client models.
Client-side PSO further enhances feature discrimination at the local level, resulting in higher accuracy (81.97%) and an F1-score of 0.7342. The improved recall indicates better sensitivity to abnormal events, confirming the effectiveness of feature-level optimization.
The full dual-layer PSO framework achieves the best performance across all metrics, with an accuracy of 90.56% and an F1-score of 0.8533. This substantial improvement confirms that jointly optimizing local feature representations and global aggregation weights yields complementary benefits. The results verify that the proposed dual-layer PSO design is crucial for achieving high prediction accuracy and stability in heterogeneous federated learning environments.
4.4.4. Model Interpretability Comparisons of the Four Methods
Figure 11 compares the ROC curves of the four aggregation strategies for detecting abnormal hemodialysis events, showing their trade-offs between sensitivity and false positive rate over all decision thresholds. The x-axis is the false positive rate (specificity), and the y-axis is the true positive rate (sensitivity). Each curve traces how sensitivity increases as the decision threshold is relaxed and more false positives are allowed. The area under each curve (AUC) summarizes discrimination ability: higher AUC means the model is better at ranking abnormal cases above normal ones, independent of any particular threshold.
The blue curve of Full PSO stays closest to the top-left corner, meaning it achieves high sensitivity at relatively low false positive rates, across a wide range of thresholds. AUC = 0.908 indicates excellent discrimination between normal and abnormal hemodialysis conditions, consistent with the high accuracy and F1 in the confusion matrix figure.
The green curve of server-side PSO is clearly above the FedAvg baseline and not far below Full PSO, showing that server-side PSO improves ranking quality substantially. AUC = 0.855 suggests good discrimination, though sensitivity is slightly lower than Full PSO when keeping false positives small.
The orange curve of client-side PSO lies between server-only PSO and FedAvg, again above the baseline but below Full PSO. AUC = 0.840 shows that client-side PSO yields a solid but somewhat weaker ROC profile than server-side PSO in this experiment, even though in your confusion matrices client-only PSO had better accuracy than server-only, highlighting that threshold choice matters.
The red curve of FedAvg baseline is consistently below the PSO-based curves, especially at low false positive rates. AUC = 0.761 indicates only moderate discrimination; the model has much less ability to separate abnormal from normal cases, aligning with the poorer accuracy and F1 previously observed.
Taken together with learning curves and confusion matrices, this ROC analysis shows that Full PSO yields the most robust clinical operating points across thresholds, while standard FedAvg provides the weakest safety-effectiveness balance for abnormal hemodialysis detection.
4.4.5. Comparison with PriorWork
The results are compared with prior works and summarized in the accompanying Table 4.
Table 4 compares representative related studies across several key dimensions, including whether client-side and server-side PSO are employed, the model type, the dataset used, the evaluation metrics, and the target application domain. This comparison highlights that existing studies differ not only in optimization strategy but also in experimental setup and problem focus, ranging from general vision tasks to global optimization problems. More specifically, Aljarah et al. [19] adopted client-side PSO without server-side PSO, and evaluated their method using CNNs or neural networks on benchmark datasets, with performance measured by metrics such as accuracy and MSE for general vision applications. In contrast, Mirjalili et al. [20] considered both S-shaped and V-shaped PSO variants, tested them on CEC 2005 benchmark functions, and assessed their behavior in terms of convergence speed, mean error, and global optimum attainment for mathematical optimization problems. In Liu et al. [17], the authors proposed a Flexible Convolutional Autoencoder (FCAE) framework enhanced with client-side Particle Swarm Optimization (PSO) to optimize hyperparameters and structural configurations of deep learning models. By applying PSO locally rather than on a centralized server, their approach emphasizes scalability and privacy while maintaining computational efficiency. The FCAE was evaluated on widely used image datasets including MNIST, CIFAR-10, and STL-10, achieving notably high performance, with MNIST accuracy reaching 99.51%. These results demonstrate the effectiveness of combining evolutionary optimization with deep autoencoder architectures for robust feature extraction and classification. The study’s contribution lies in bridging metaheuristic optimization and deep vision models, positioning the method as a versatile solution for general computer vision applications where adaptability and accuracy are critical. In Kan et al. [18], the authors developed an IoT security framework that integrates Adaptive Particle Swarm Optimization (APSO) with a one-dimensional Convolutional Neural Network (1D-CNN) to enhance intrusion detection performance. The model leverages APSO to fine-tune CNN parameters dynamically, improving convergence and classification accuracy for network traffic patterns. Their experiments were conducted on the N-BaIoT dataset, which contains traffic data from Mirai and BASHLITE botnets, representing real-world IoT attack scenarios. Evaluation metrics such as accuracy and F1-score demonstrated strong detection capability, confirming the model’s robustness against diverse IoT threats. Overall, this study contributes to the field of IoT security by combining deep learning with swarm-based optimization, achieving efficient and adaptive detection of malicious network behaviors in resource-constrained environments.
FedPSO by Park et al. [12] is one of the earliest federated learning aggregation strategies integrating PSO. It replaces the traditional FedAvg mechanism by using PSO at the server side and employs a “score vector” instead of full model parameters, effectively reducing communication costs. However, it does not address client-side model enhancement, limiting its adaptability to heterogeneous environments. Second, Qadir et al. (2020) applied PSO to client-side hyperparameter tuning, such as learning rate and network depth, which improved local model stability and generalization [13]. Nonetheless, this approach lacked a server-side aggregation optimization mechanism and did not incorporate an integrated resource management strategy, restricting its applicability to simple hyperparameter search tasks. AdpFedPSO (Ouyang et al., 2024) emphasized dynamic adjustment of aggregation weights at the server, using PSO to automatically calculate client weights based on contribution and participation frequency. This improved global adaptability under highly heterogeneous data distributions [14]. However, the approach still omitted client-side reinforcement and did not address computational load or edge resource consumption. Experimental results demonstrate that using dual-layer PSO increased model accuracy from a baseline of 55% to 90%, while simultaneously reducing computational overhead and improving training stability. These findings confirm the effectiveness and practicality of the proposed approach under multi-objective optimization conditions.
The proposed dual-layer PSO approach achieves superior performance across all client groups. The accuracy curve shows a steeper and more stable upward trend from early epochs, surpassing 70% accuracy by approximately the 15th epoch and stabilizing near 75%–80% thereafter. Notably, the initial accuracy at early epochs is significantly higher than that of the other two methods, demonstrating faster convergence. These results confirm that combining client-side feature optimization with server-side aggregation optimization enables more effective learning from heterogeneous data, yielding the most robust and accurate global model.
The cross-validation results demonstrate consistently high success rates across all folds, with only minor performance variations. Most folds achieved validation accuracies above 90%, indicating strong generalization despite heterogeneous feature distributions among clients. The absence of extreme performance drops suggests that the proposed dual-layer PSO framework effectively mitigates overfitting and reduces dependency on specific data partitions.
5. Conclusion and Future Work
This study presented PSOFed-HD, a dual-layer Particle Swarm Optimization-enhanced federated learning framework for heterogeneous hemodialysis complication prediction in a Medical IoT environment. The proposed method was designed to address two major challenges in distributed hemodialysis monitoring: incomplete and non-IID sensor data across clients, and the limited effectiveness of conventional aggregation strategies such as FedAvg under heterogeneous conditions. By combining client-side PSO for local feature weighting with server-side PSO for adaptive model aggregation, the framework improved both local representation learning and global model fusion.
Experimental results showed that PSOFed-HD consistently outperformed the baseline FedAvg model and the two single-layer PSO variants across multiple evaluation settings. The full framework achieved 90.56% accuracy, an F1-score of 0.8533, and an AUC of 0.908, while also demonstrating stable convergence behavior and robust 11-fold cross-validation performance. These findings indicate that coordinated optimization at both the client and server levels is effective for privacy-preserving fusion of heterogeneous hemodialysis sensor data.
From an application perspective, the proposed framework has practical value for intelligent dialysis monitoring systems deployed at the edge. Because raw patient data remain local and only model parameters are exchanged, the method is compatible with privacy-sensitive healthcare settings and distributed Medical IoT architectures. The resource-aware design described in the manuscript further supports its potential use in real clinical environments where computational constraints and deployment efficiency must be considered.
Several directions remain for future work. External validation across multiple hospitals and dialysis machine platforms is needed to confirm generalizability, and prospective evaluation would be required before clinical adoption. In addition, future studies should examine interpretability, threshold selection, asynchronous federated settings, and more advanced temporal architectures to further strengthen the clinical utility of the framework.
Overall, PSOFed-HD provides a promising approach for robust and privacy-preserving complication prediction in heterogeneous hemodialysis environments. The results support the broader view that effective federated intelligence for Medical IoT systems should optimize both local feature extraction and global model integration rather than relying on aggregation alone.
References
- Konečný, J.; McMahan, H. B.; Yu, F. X.; Richtárik, P.; Suresh, A. T.; Bacon, D. Federated learning: Strategies for improving communication efficiency. arXiv 2016, arXiv:1610.05492. [Google Scholar]
- Kennedy, J.; Eberhart, R. Particle Swarm Optimization. In Proceedings of the ICNN’95—International Conference on Neural Networks, Perth, Australia, 27 November–1 December 1995; Volume 4, pp. 1942–1948. [Google Scholar] [CrossRef]
- Wang, Y.; Zhang, C.; Zeng, W. D3QN-based cloud resource management for federated learning. IEEE Trans. Cloud Comput. 2021, vol. 9(no. 3), 1012–1024. [Google Scholar] [CrossRef]
- Wang, S.; Tuor, T.; Salonidis, T.; Leung, K.K.; Makaya, C.; He, T.; Chan, K. Adaptive Federated Learning in Resource Constrained Edge Computing Systems. IEEE J. Sel. Areas Commun. 2019, 37, 1205–1221. [Google Scholar] [CrossRef]
- Tan, L.T.; Hu, R.Q.; Hanzo, L. Twin-Timescale Artificial Intelligence Aided Mobility-Aware Edge Caching and Computing in Vehicular Networks. IEEE Trans. Veh. Technol. 2019, 68, 3086–3099. [Google Scholar] [CrossRef]
- Liu, L.; Xu, J.; Zhang, N. Federated learning for mobile edge computing: A deep reinforcement learning approach. IEEE Trans. Veh. Technol. 2019, vol. 68(no. 10), 10145–10156. [Google Scholar] [CrossRef]
- Nishio, T.; Yonetani, R. Client Selection for Federated Learning with Heterogeneous Resources in Mobile Edge. In Proceedings of the ICC 2019 - 2019 IEEE International Conference on Communications (ICC), Shanghai, China, 20–24 May 2019; pp. 1–7. [Google Scholar]
- Yang, Z.; Chen, M.; Wong, K. Deep reinforcement learning for 5G wireless network resource allocation. IEEE Trans. Netw. Sci. Eng. 2020, vol. 7(no. 4), 2131–2141. [Google Scholar] [CrossRef]
- Li, H.; Ota, K.; Dong, M. Learning IoT in Edge: Deep Learning for the Internet of Things with Edge Computing. IEEE Netw. 2018, 32, 96–101. [Google Scholar] [CrossRef]
- Li, T.; Sahu, A.K.; Talwalkar, A.; Smith, V. Federated Learning: Challenges, Methods, and Future Directions. IEEE Signal Process. Mag. 2020, 37, 50–60. [Google Scholar] [CrossRef]
- Kairouz, P.; McMahan, H.B.; Avent, B.; Bellet, A.; Bennis, M.; Bhagoji, A.N.; Bonawitz, K.; Charles, Z.; Cormode, G.; Cummings, R.; et al. Advances and Open Problems in Federated Learning. Found. Trends Mach. Learn. 2021, 14, 1–210. [Google Scholar] [CrossRef]
- Mendoza, M.M.; Chang, Y.-C.; Dmitriev, A.V.; Lin, C.-H.; Tsai, L.-C.; Li, Y.-H.; Hsieh, M.-C.; Hsu, H.-W.; Huang, G.-H.; Lin, Y.-C.; et al. Recovery of Ionospheric Signals Using Fully Convolutional DenseNet and Its Challenges. Sensors 2021, 21, 6482. [Google Scholar] [CrossRef] [PubMed]
- Saleem, A.; Liu, N.; Junjie, H.; Iqbal, A.; Hayyat, M.A.; Mateen, M. Modelling of an Electric Vehicle for Tractive Force Calculation Along With Factors Affecting the Total Tractive Power and Energy Demand. 2020 3rd International Conference on Computing, Mathematics and Engineering Technologies (iCoMET); LOCATION OF CONFERENCE, PakistanDATE OF CONFERENCE; pp. 1–5.
- Ouyang, B.; Li, Y.; Zhang, H. AdpFedPSO: Adaptive federated learning aggregation with particle swarm optimization. Discov. Comput. 2024, vol. 2(no. 1), 1–13. [Google Scholar] [CrossRef]
- Zheng, Y.; Yang, H.; Wu, K. Federated learning for online resource allocation in mobile edge computing: A deep reinforcement learning approach. In IEEE Trans. Mobile Comput., early access; 2023. [Google Scholar] [CrossRef]
- Lopez-Perez, D.; Garcia-Rodriguez, A.; Galati-Giordano, L.; Kasslin, M.; Doppler, K. IEEE 802.11be Extremely High Throughput: The Next Generation of Wi-Fi Technology Beyond 802.11ax. IEEE Commun. Mag. 2019, 57, 113–119. [Google Scholar] [CrossRef]
- Orujov, F.; Maskeliūnas, R.; Damaševičius, R.; Wei, W. Fuzzy based image edge detection algorithm for blood vessel detection in retinal images. Appl. Soft Comput. 2020, 94. [Google Scholar] [CrossRef]
- Abououf, M.; Otrok, H.; Singh, S.; Mizouni, R.; Ouali, A. A Misbehaving-Proof Game Theoretical Selection Approach for Mobile Crowd Sourcing. IEEE Access 2020, 8, 58730–58741. [Google Scholar] [CrossRef]
- Kanarachos, S.; Dizqah, A.M.; Chrysakis, G.; Fitzpatrick, M.E. Optimal design of a quadratic parameter varying vehicle suspension system using contrast-based Fruit Fly Optimisation. Appl. Soft Comput. 2018, 62, 463–477. [Google Scholar] [CrossRef]
- Mirjalili, S.; Lewis, A. S-shaped versus V-shaped transfer functions for binary Particle Swarm Optimization. Swarm Evol. Comput. 2013, 9, 1–14. [Google Scholar] [CrossRef]
- Elaziz, M. A.; Oliva, D. A hybrid method with multi-verse optimizer and support vector machine for selecting features and optimizing parameters in data mining. Appl. Intell. 2019, vol. 49(no. 8), 3235–3252. [Google Scholar] [CrossRef]
- Huang, C.-T.; Wang, T.-J.; Kuo, L.-K.; Tsai, M.-J.; Cia, C.-T.; Chiang, D.-H.; Chang, P.-J.; Chong, I.-W.; Tsai, Y.-S.; Chu, Y.-C.; et al. Federated machine learning for predicting acute kidney injury in critically ill patients: a multicenter study in Taiwan. Heal. Inf. Sci. Syst. 2023, 11, 1–10. [Google Scholar] [CrossRef] [PubMed]
Figure 1.
Overall system architecture.
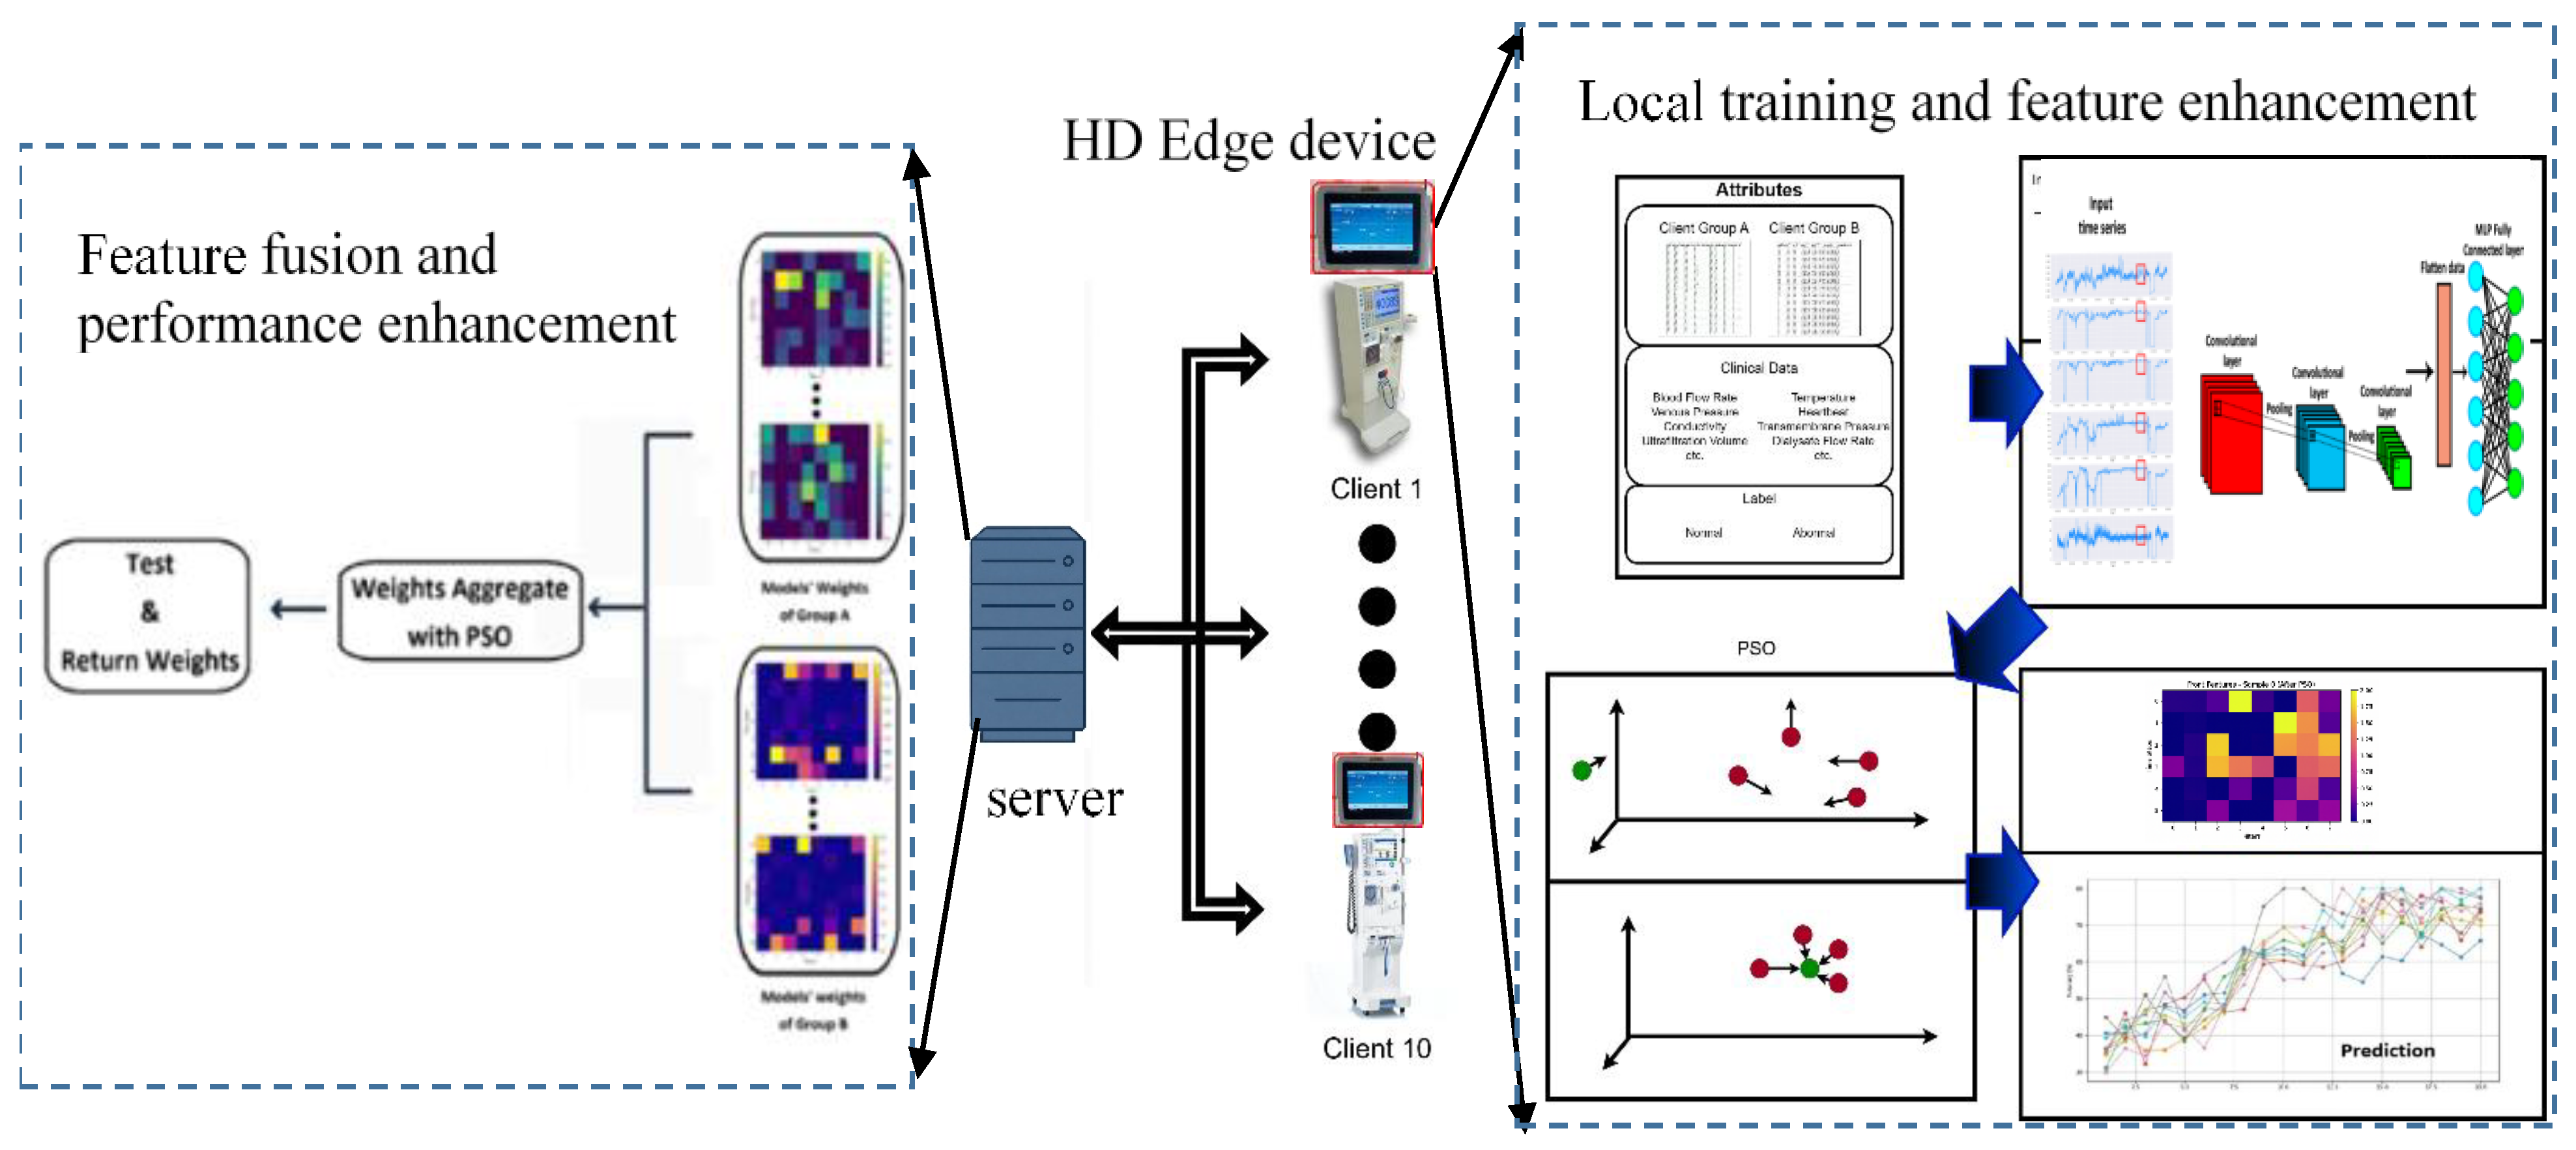
Figure 2.
Hemodialysis Data Set.
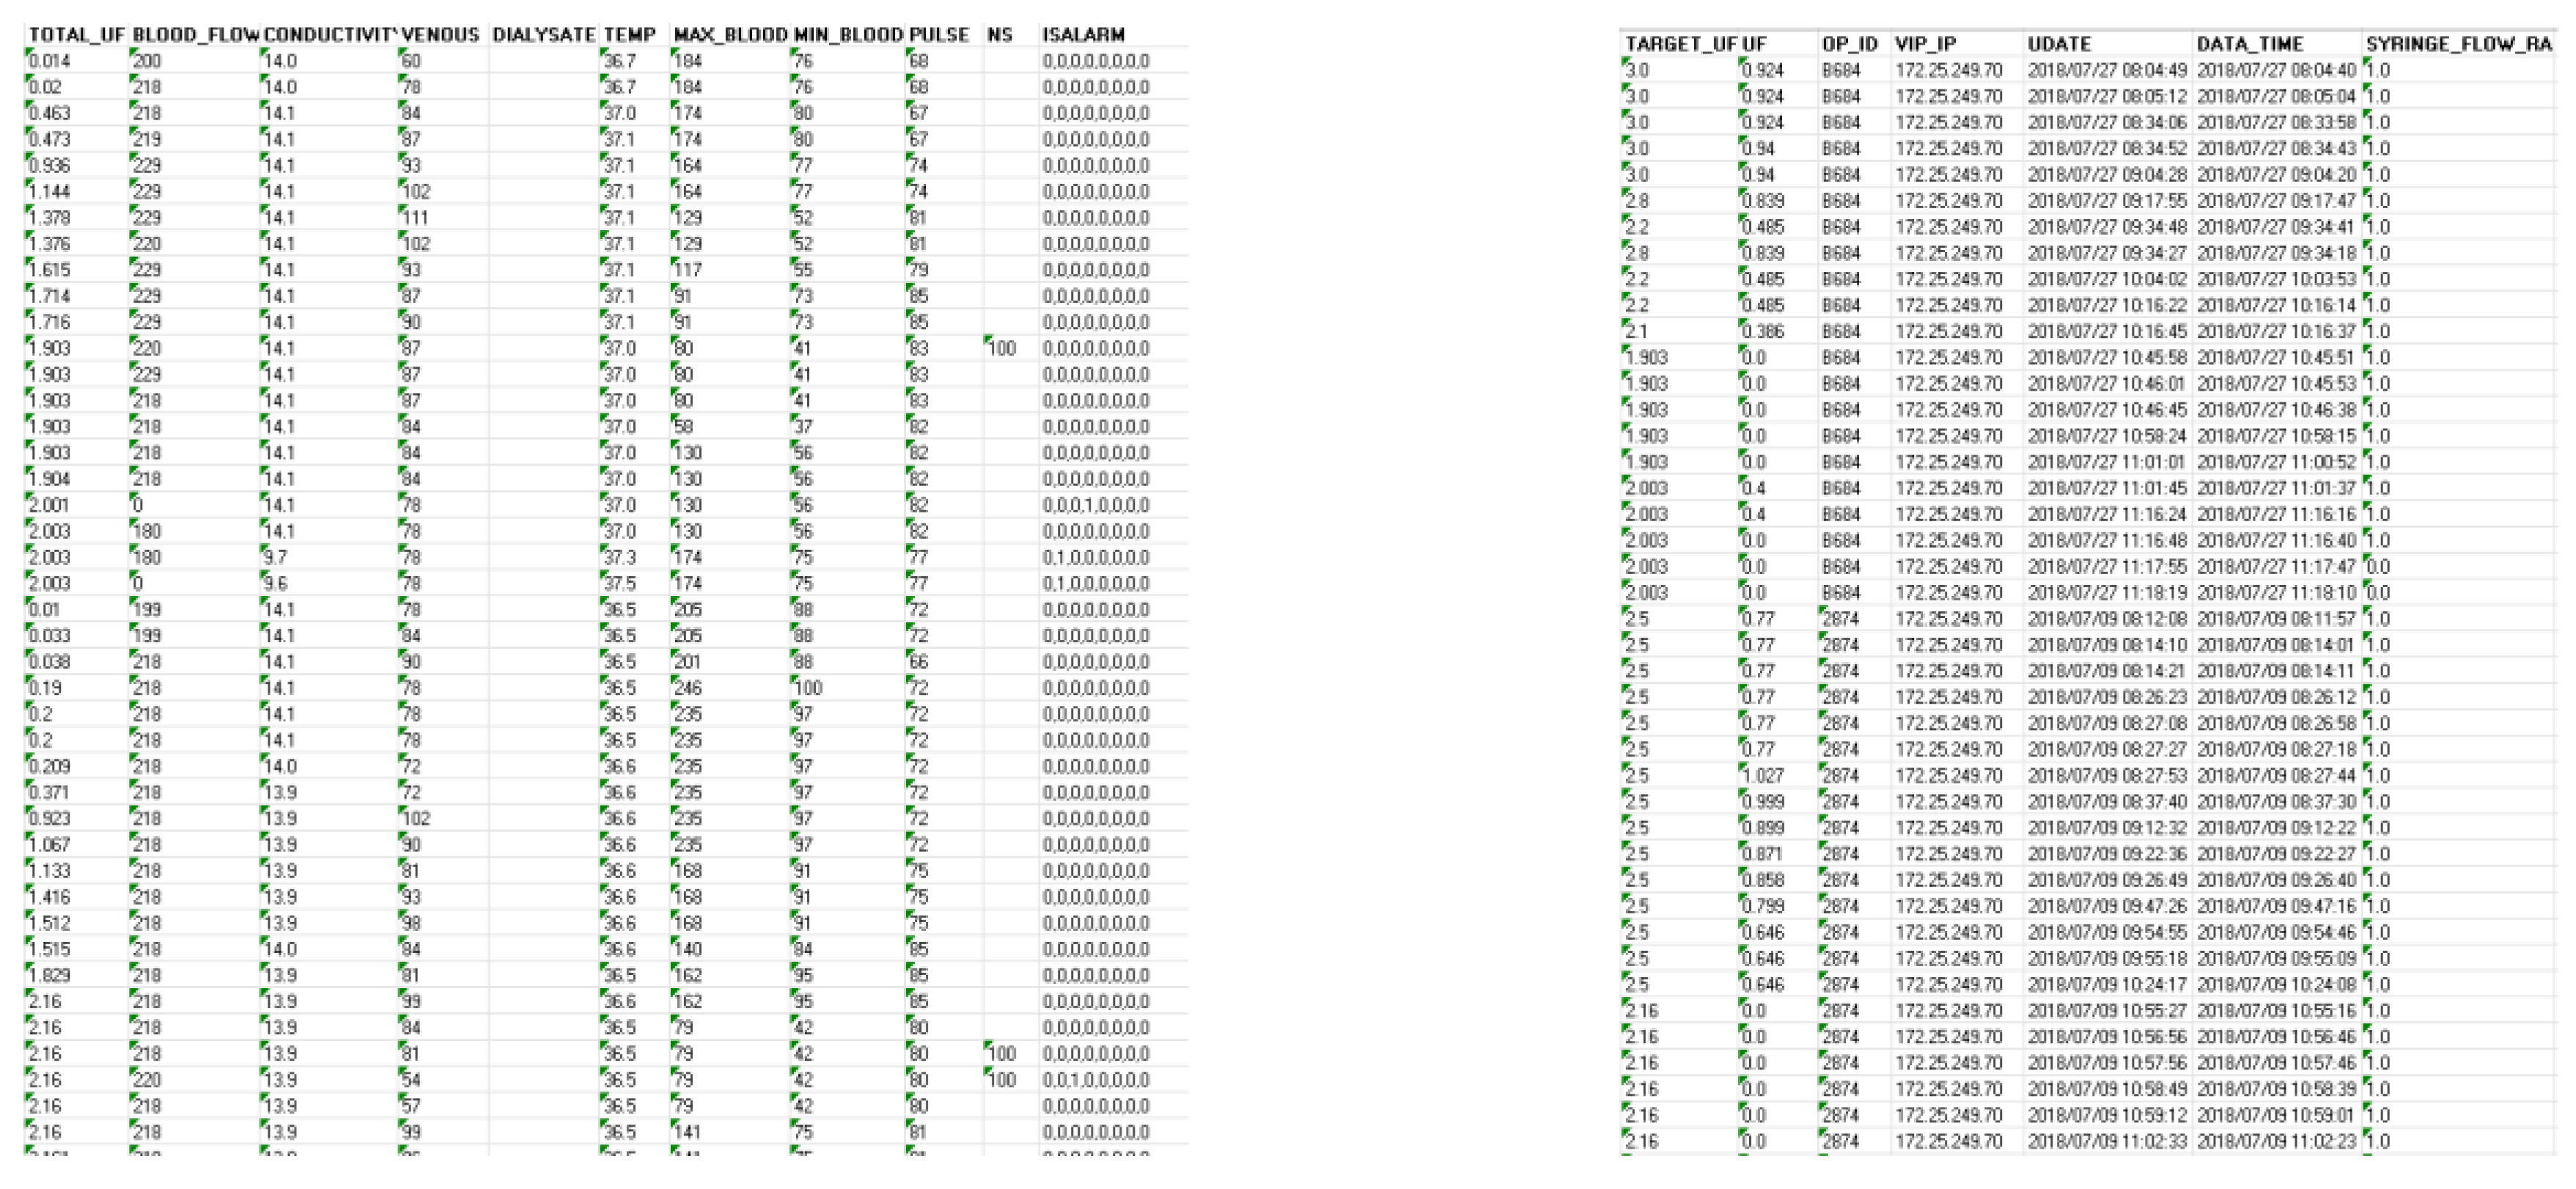
Figure 4.
Training and Testing Data Flow of PSOFed-HD.
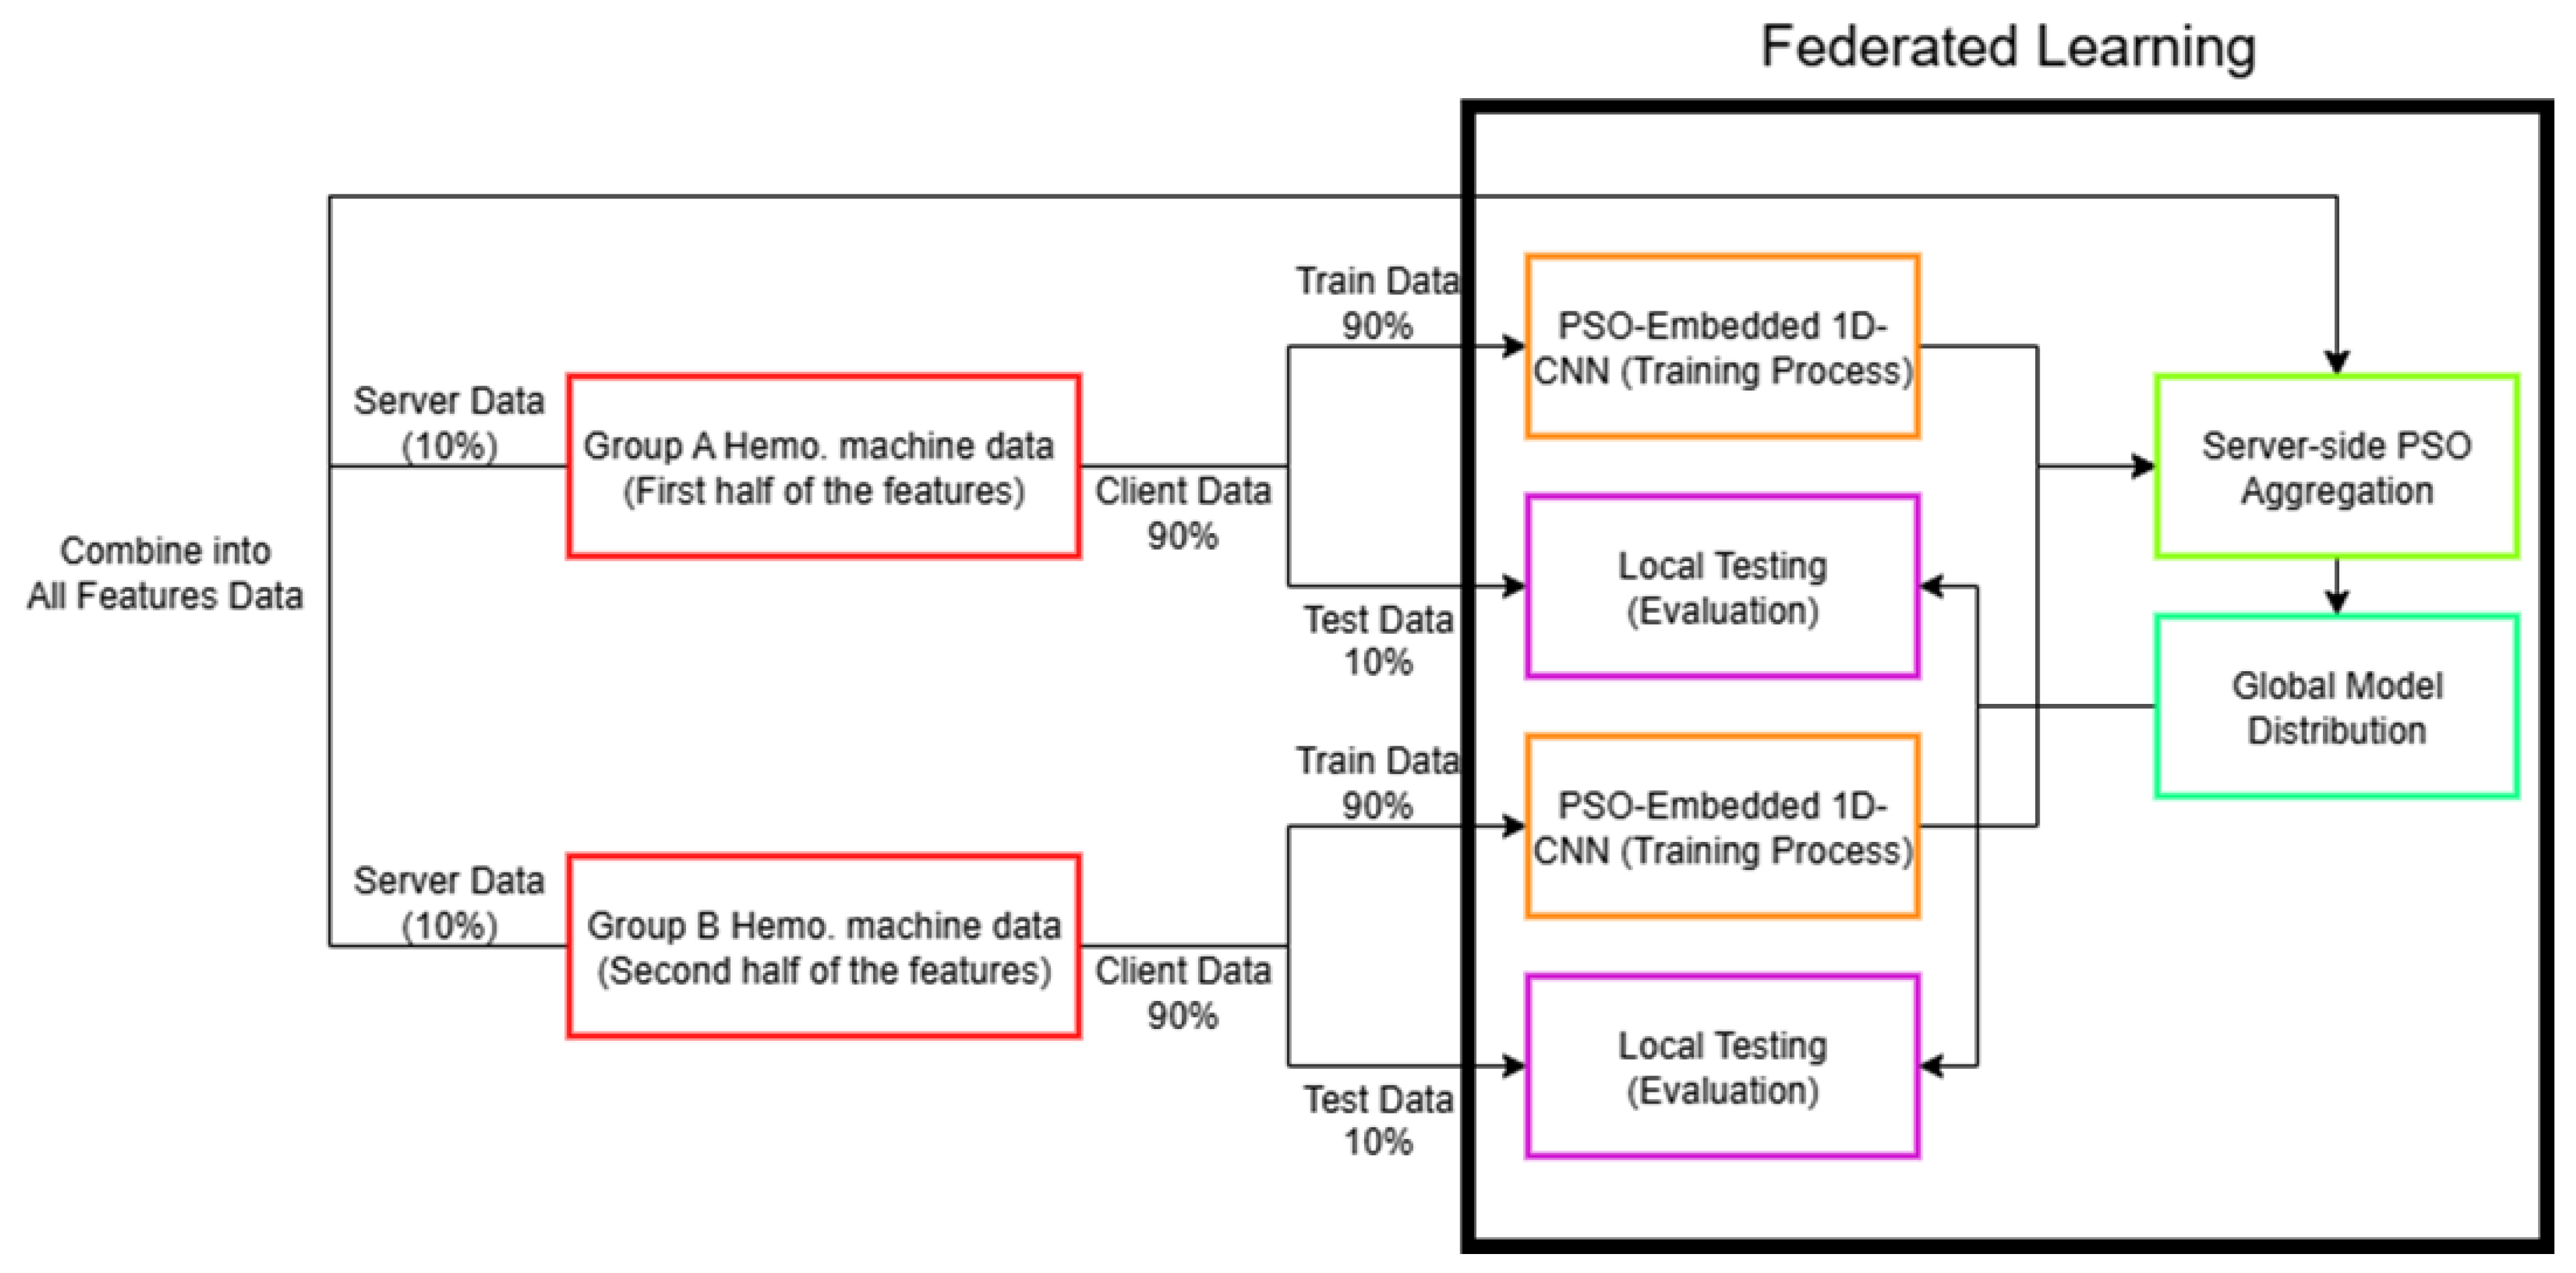
Figure 6.
Feature activation maps before and after PSO-based optimization for front-feature clients.
Figure 6.
Feature activation maps before and after PSO-based optimization for front-feature clients.
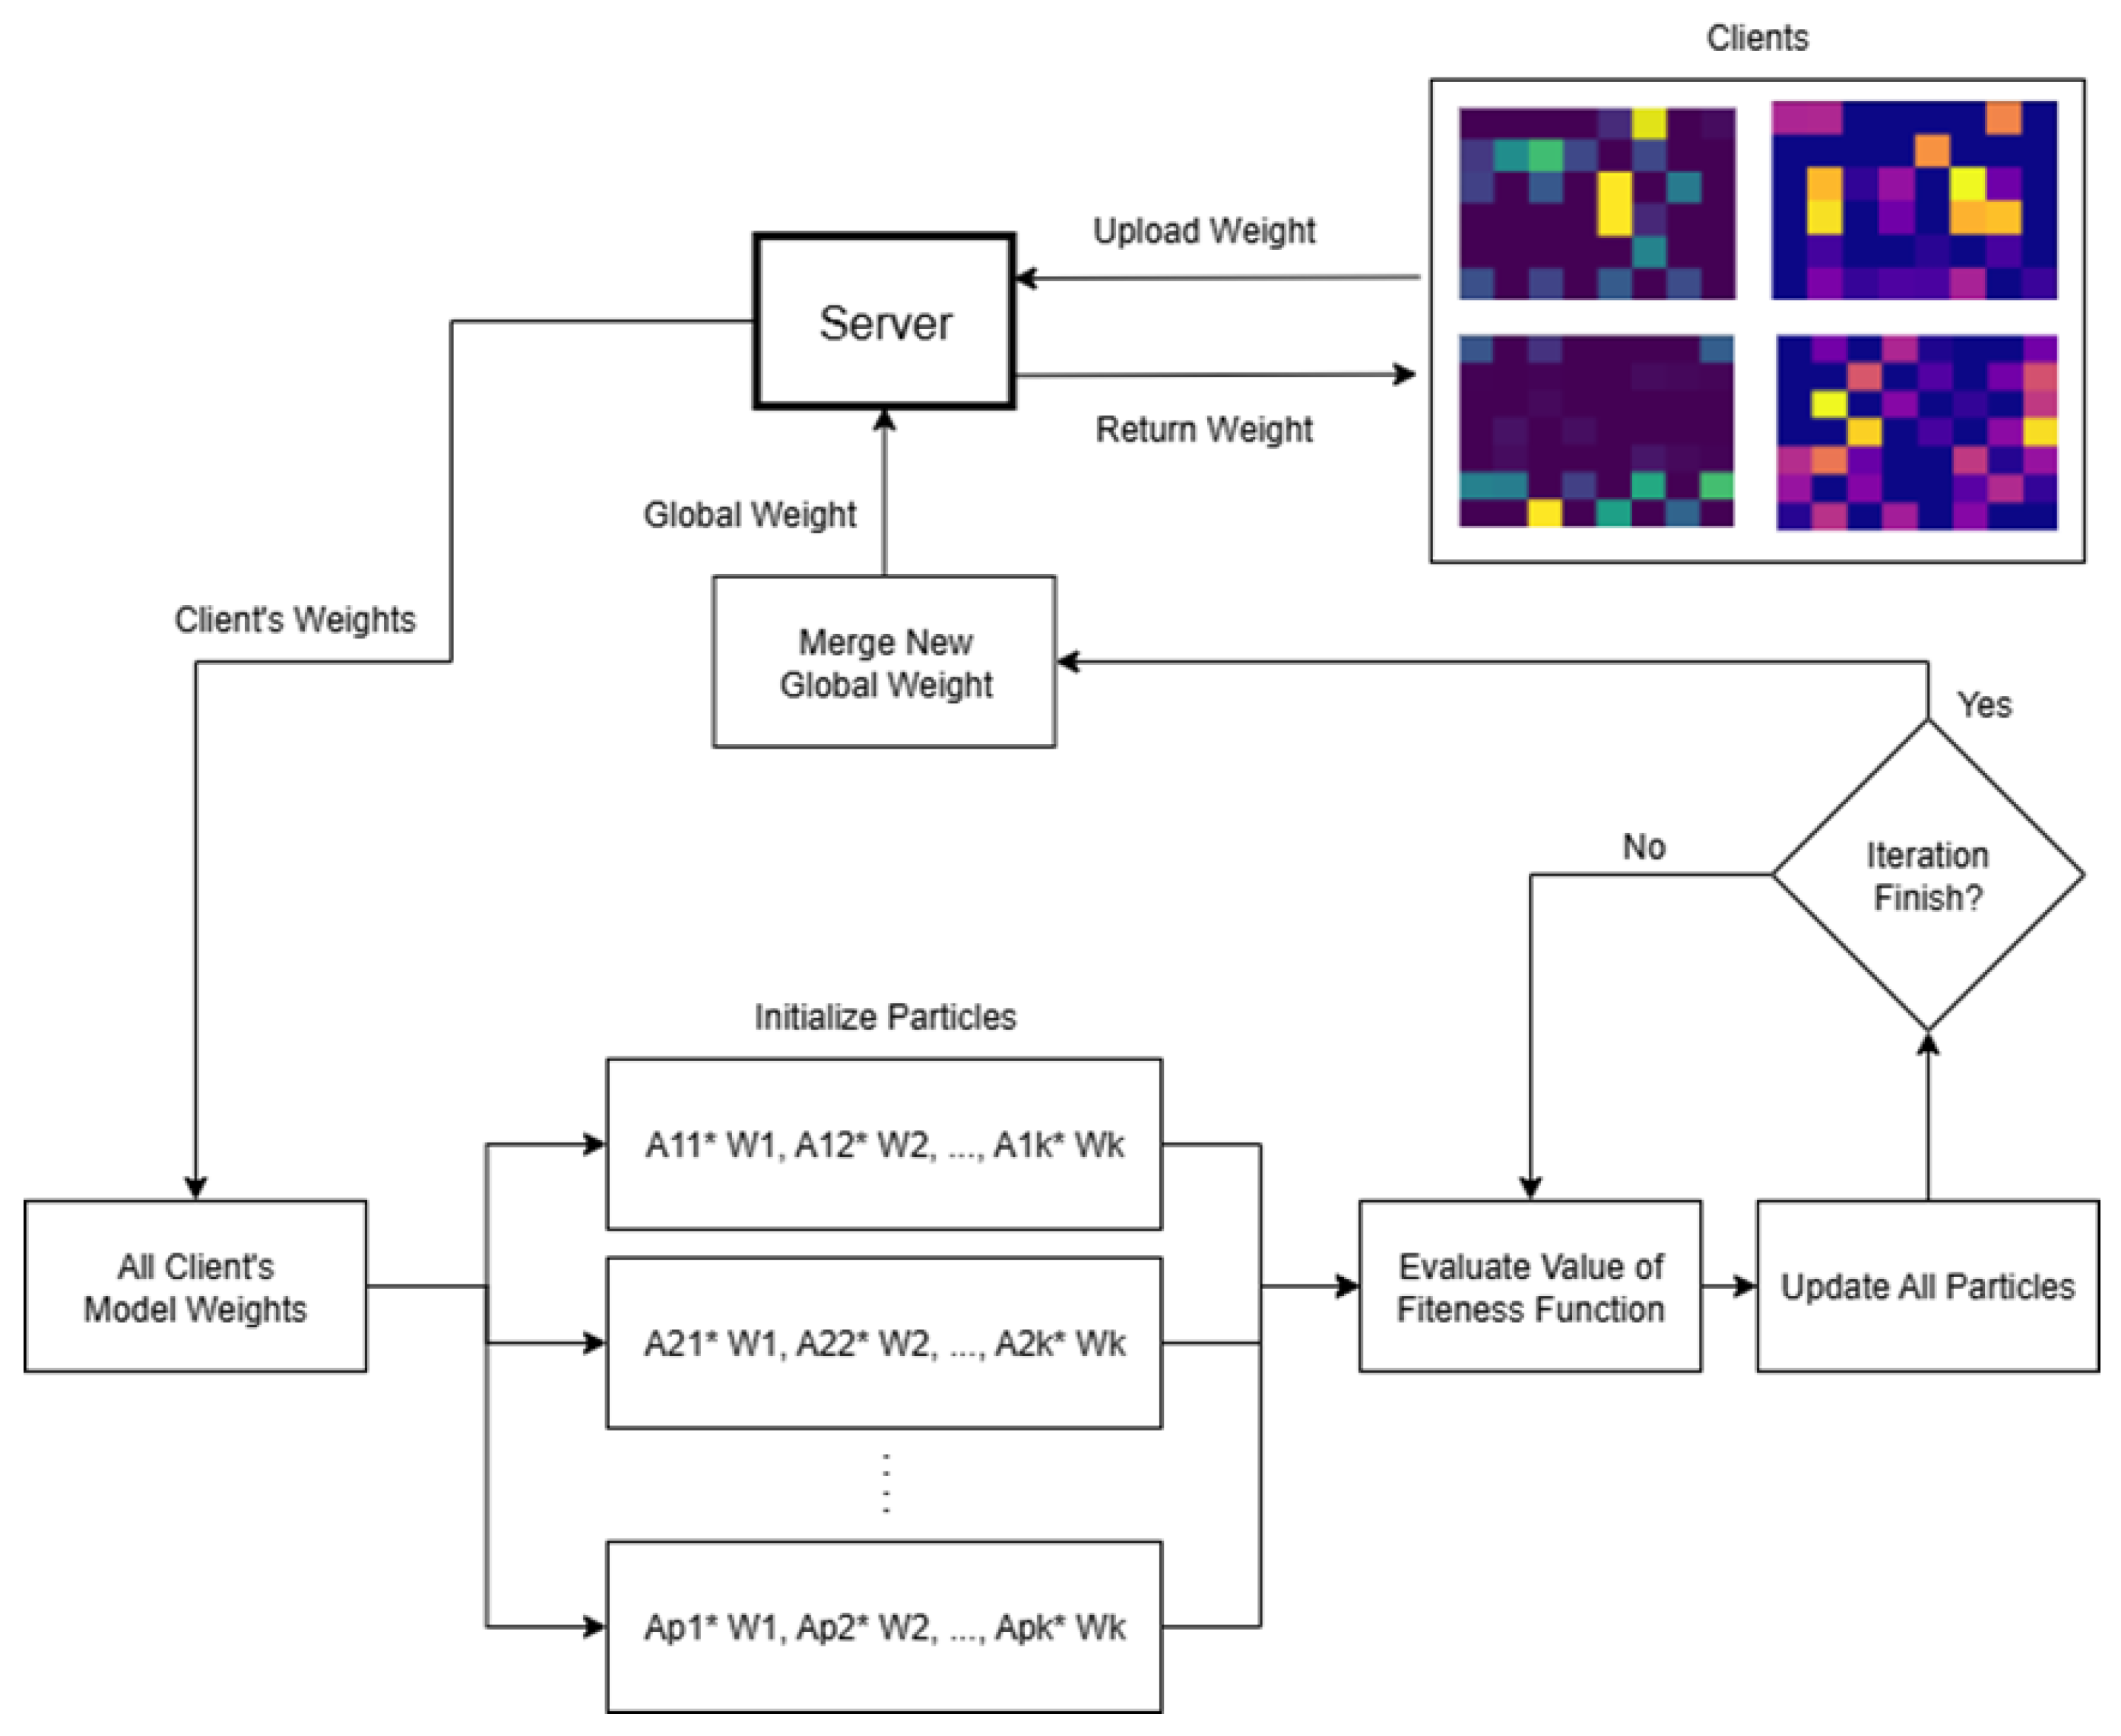
Figure 7.
Test success rate of ten client groups.
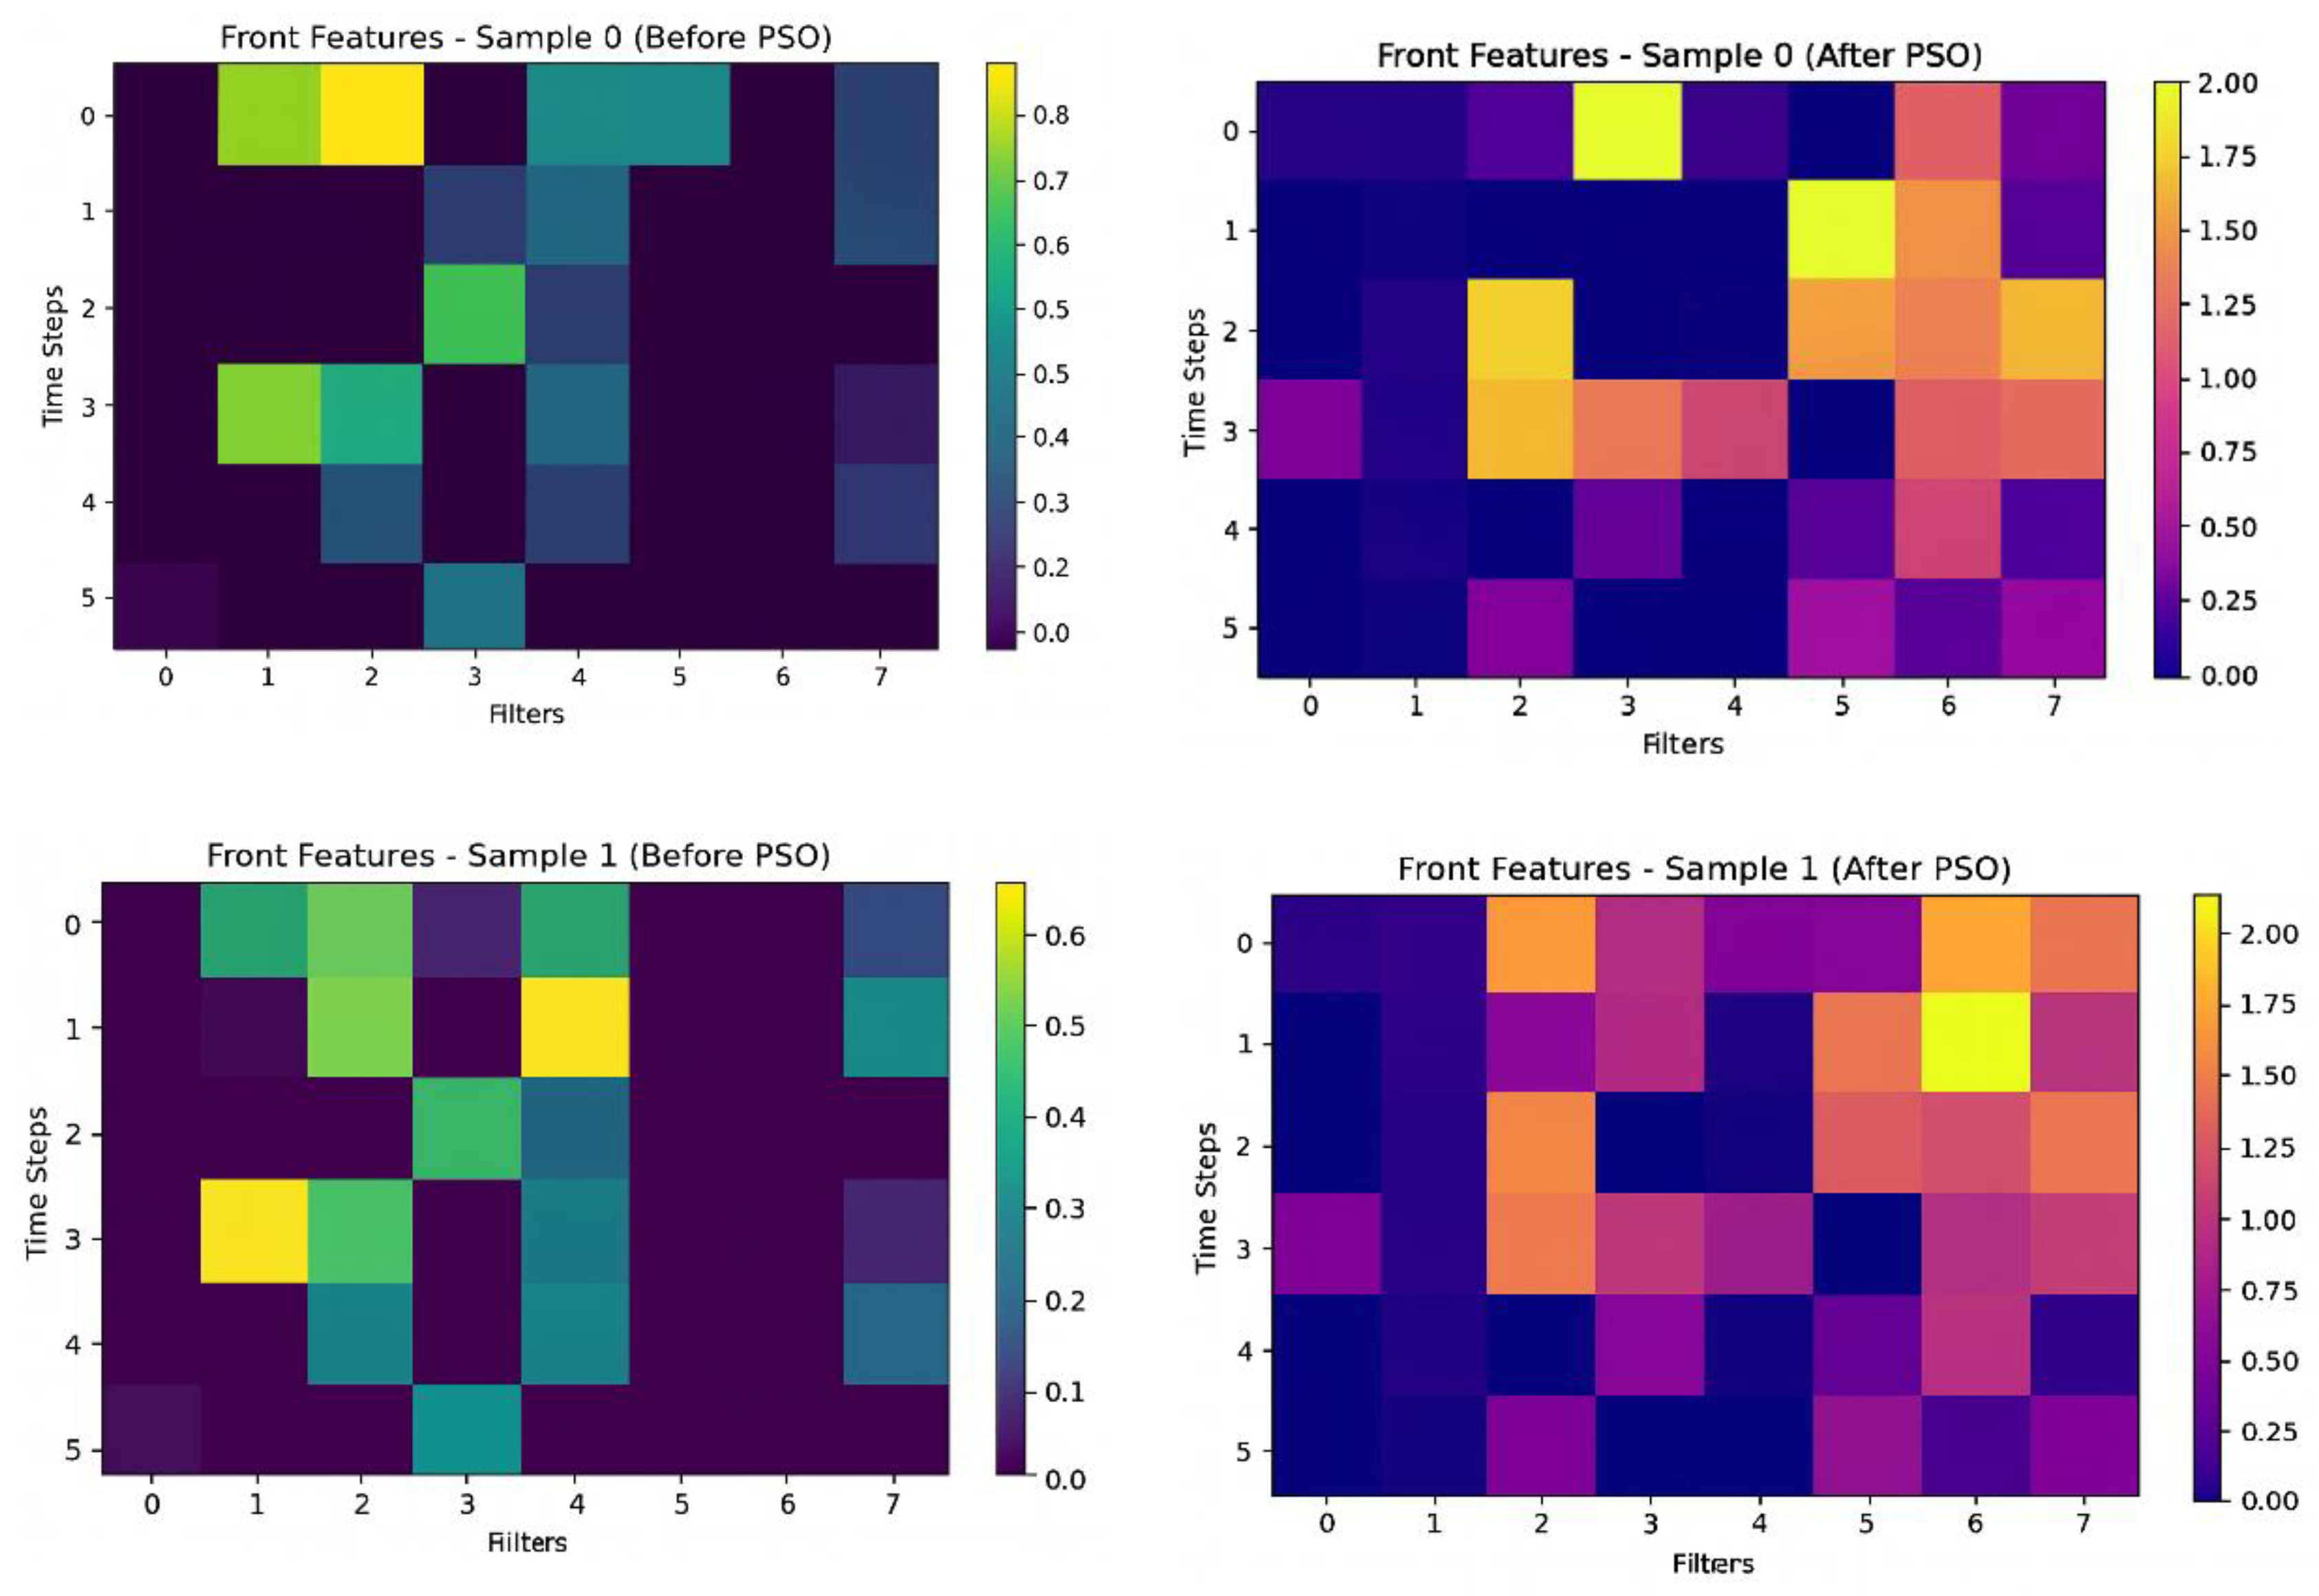
Figure 8.
Cross-validation success rate.
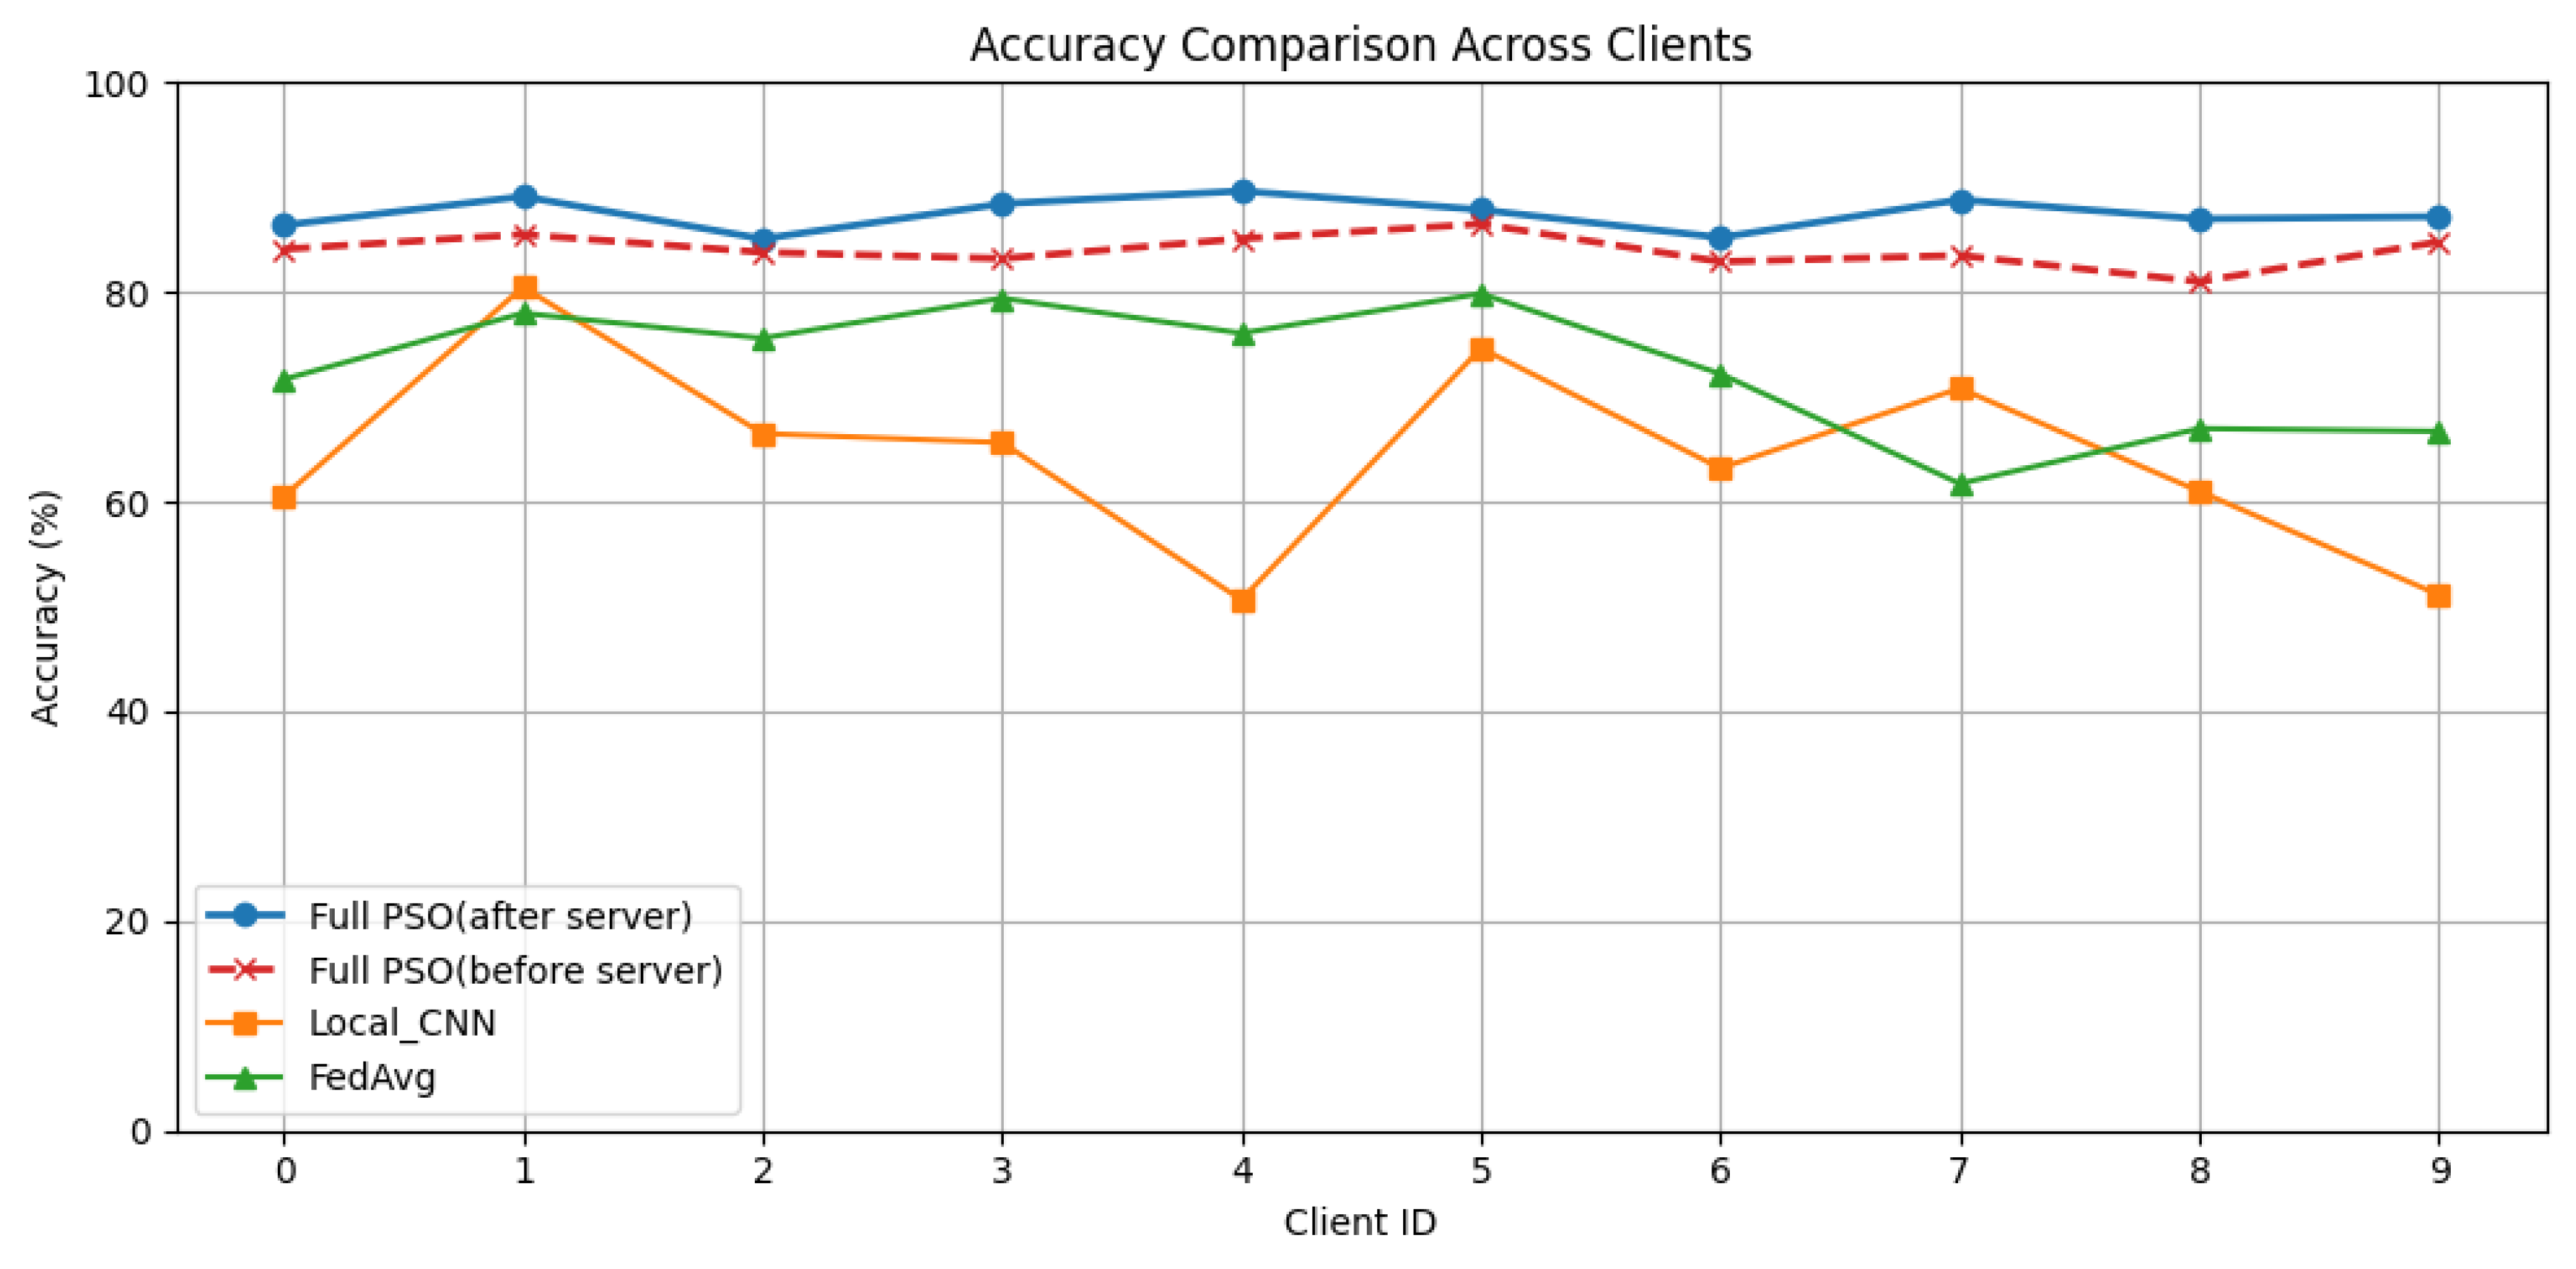
Figure 9.
Learning curves of different federated learning strategies under heterogeneous data.
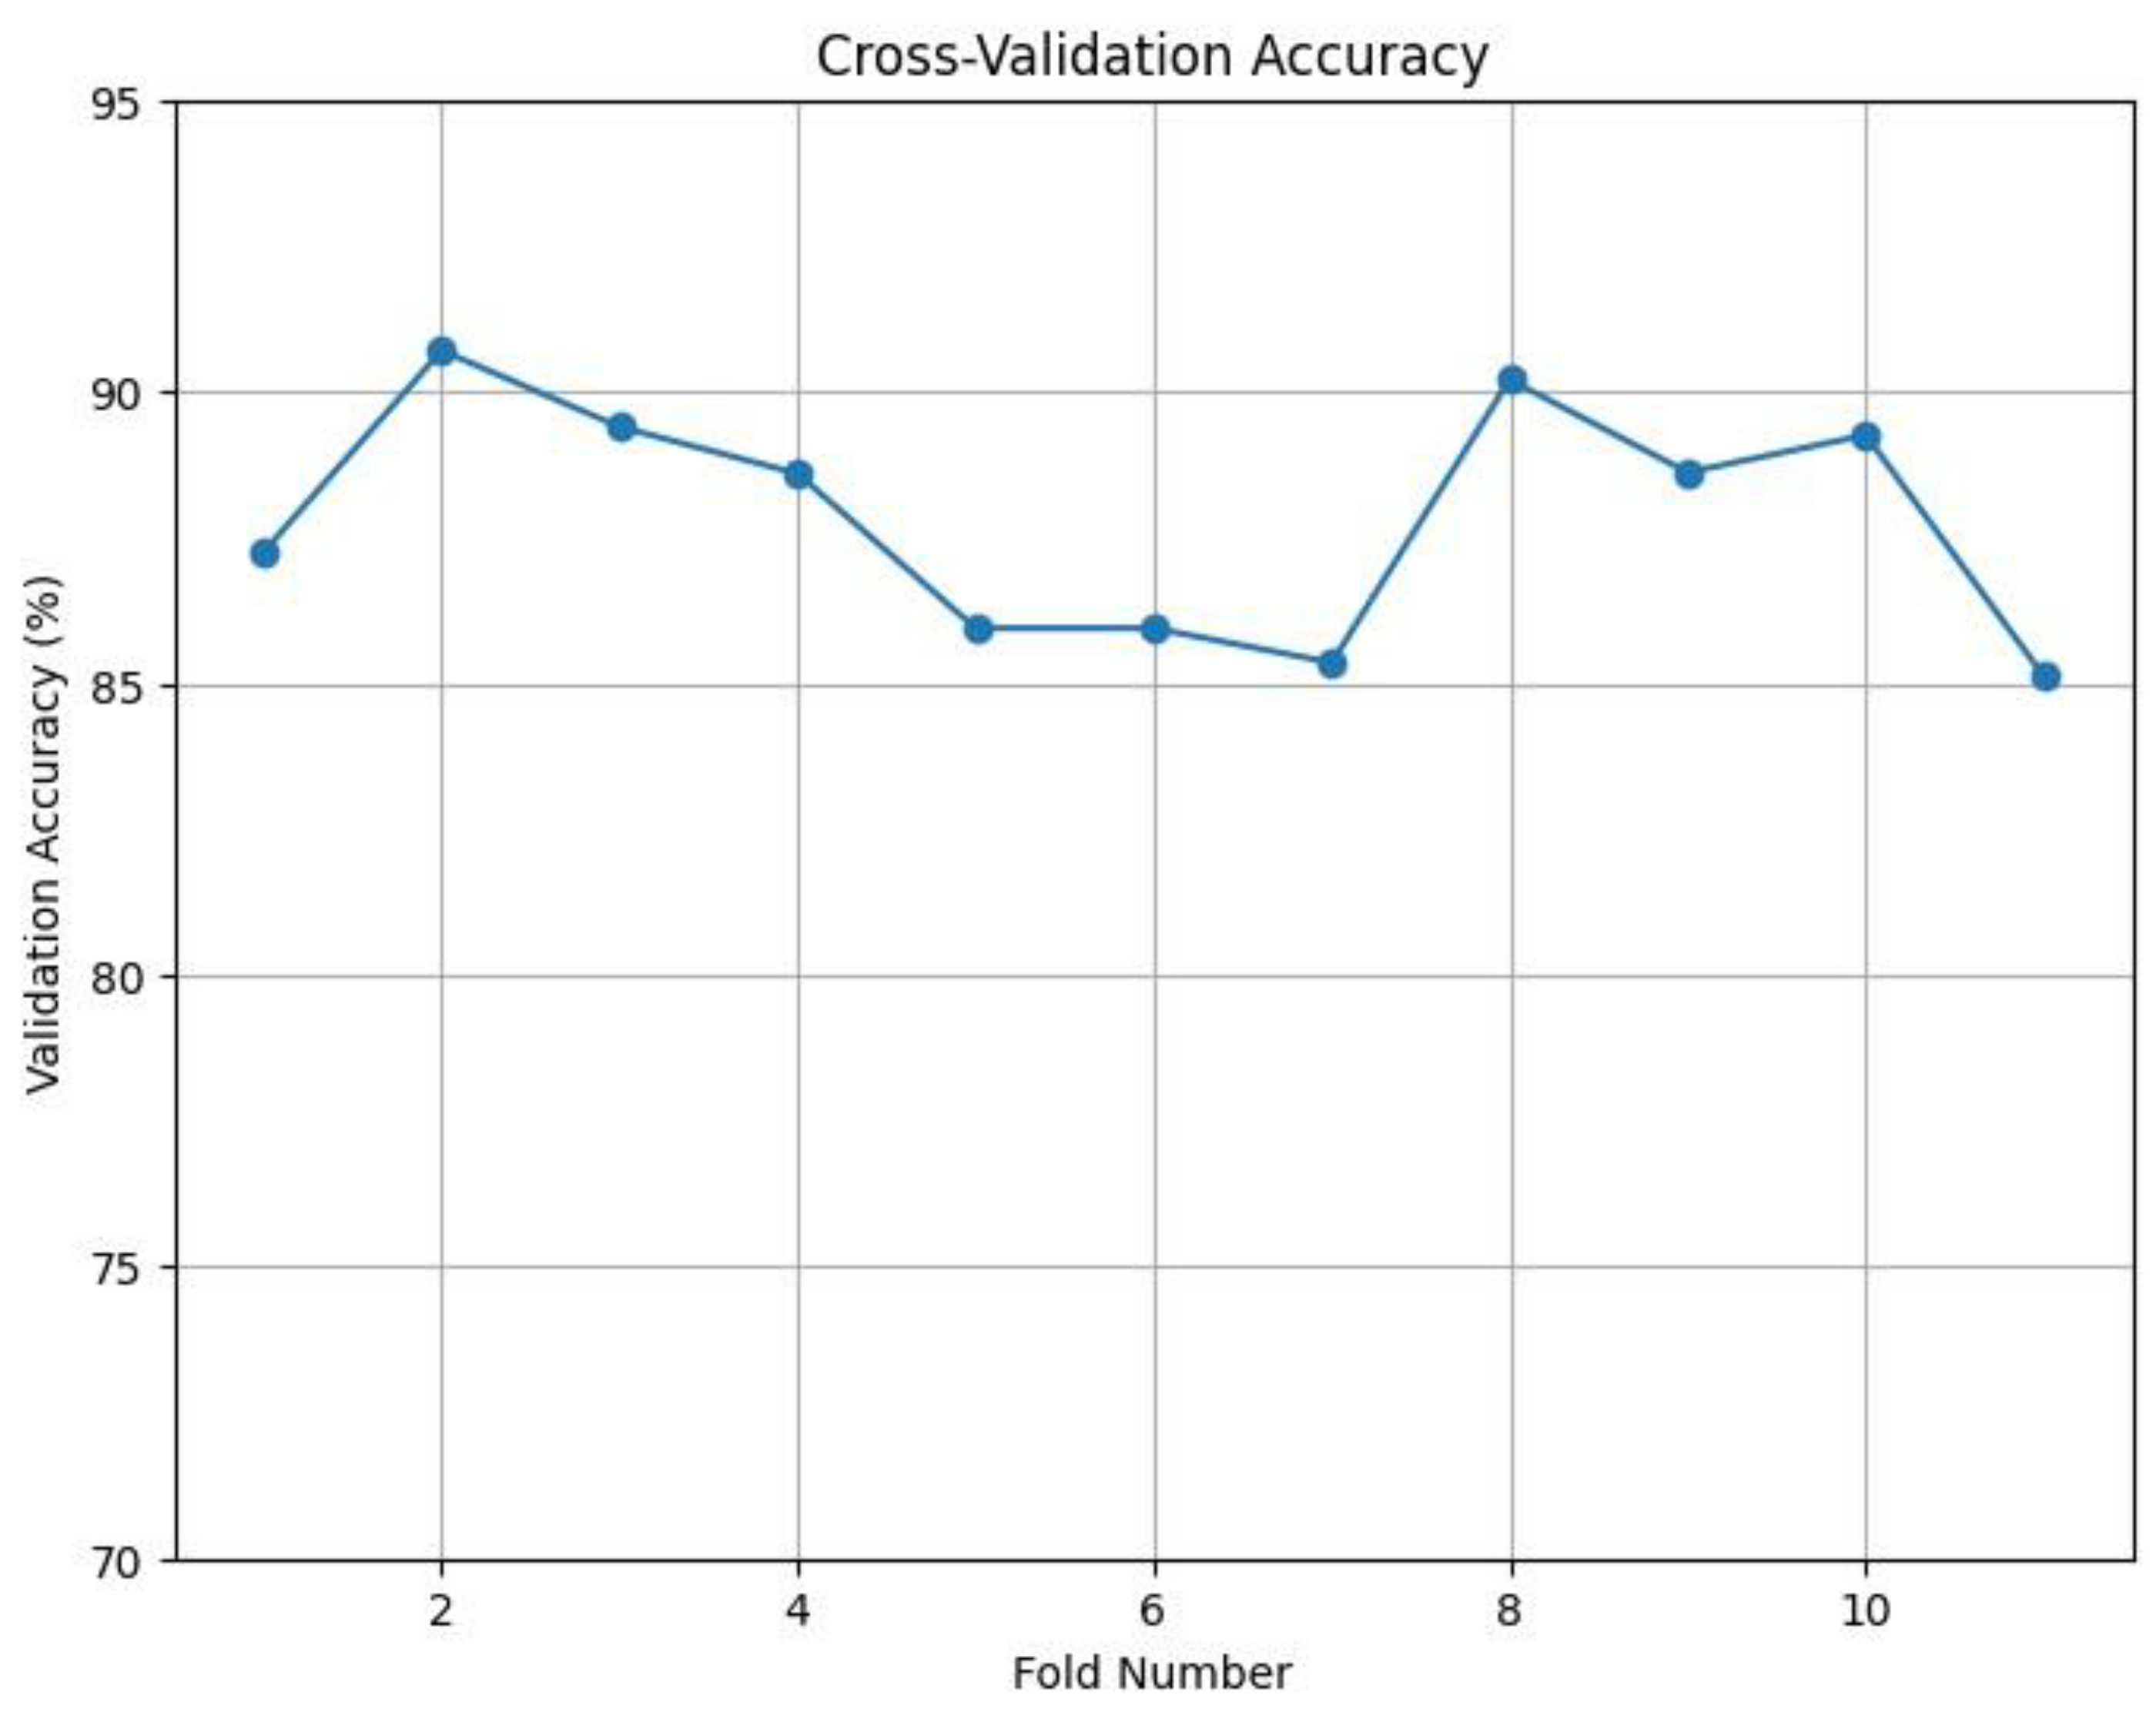
Figure 10.
Confusion matrix comparison of different aggregation strategies at final convergence.
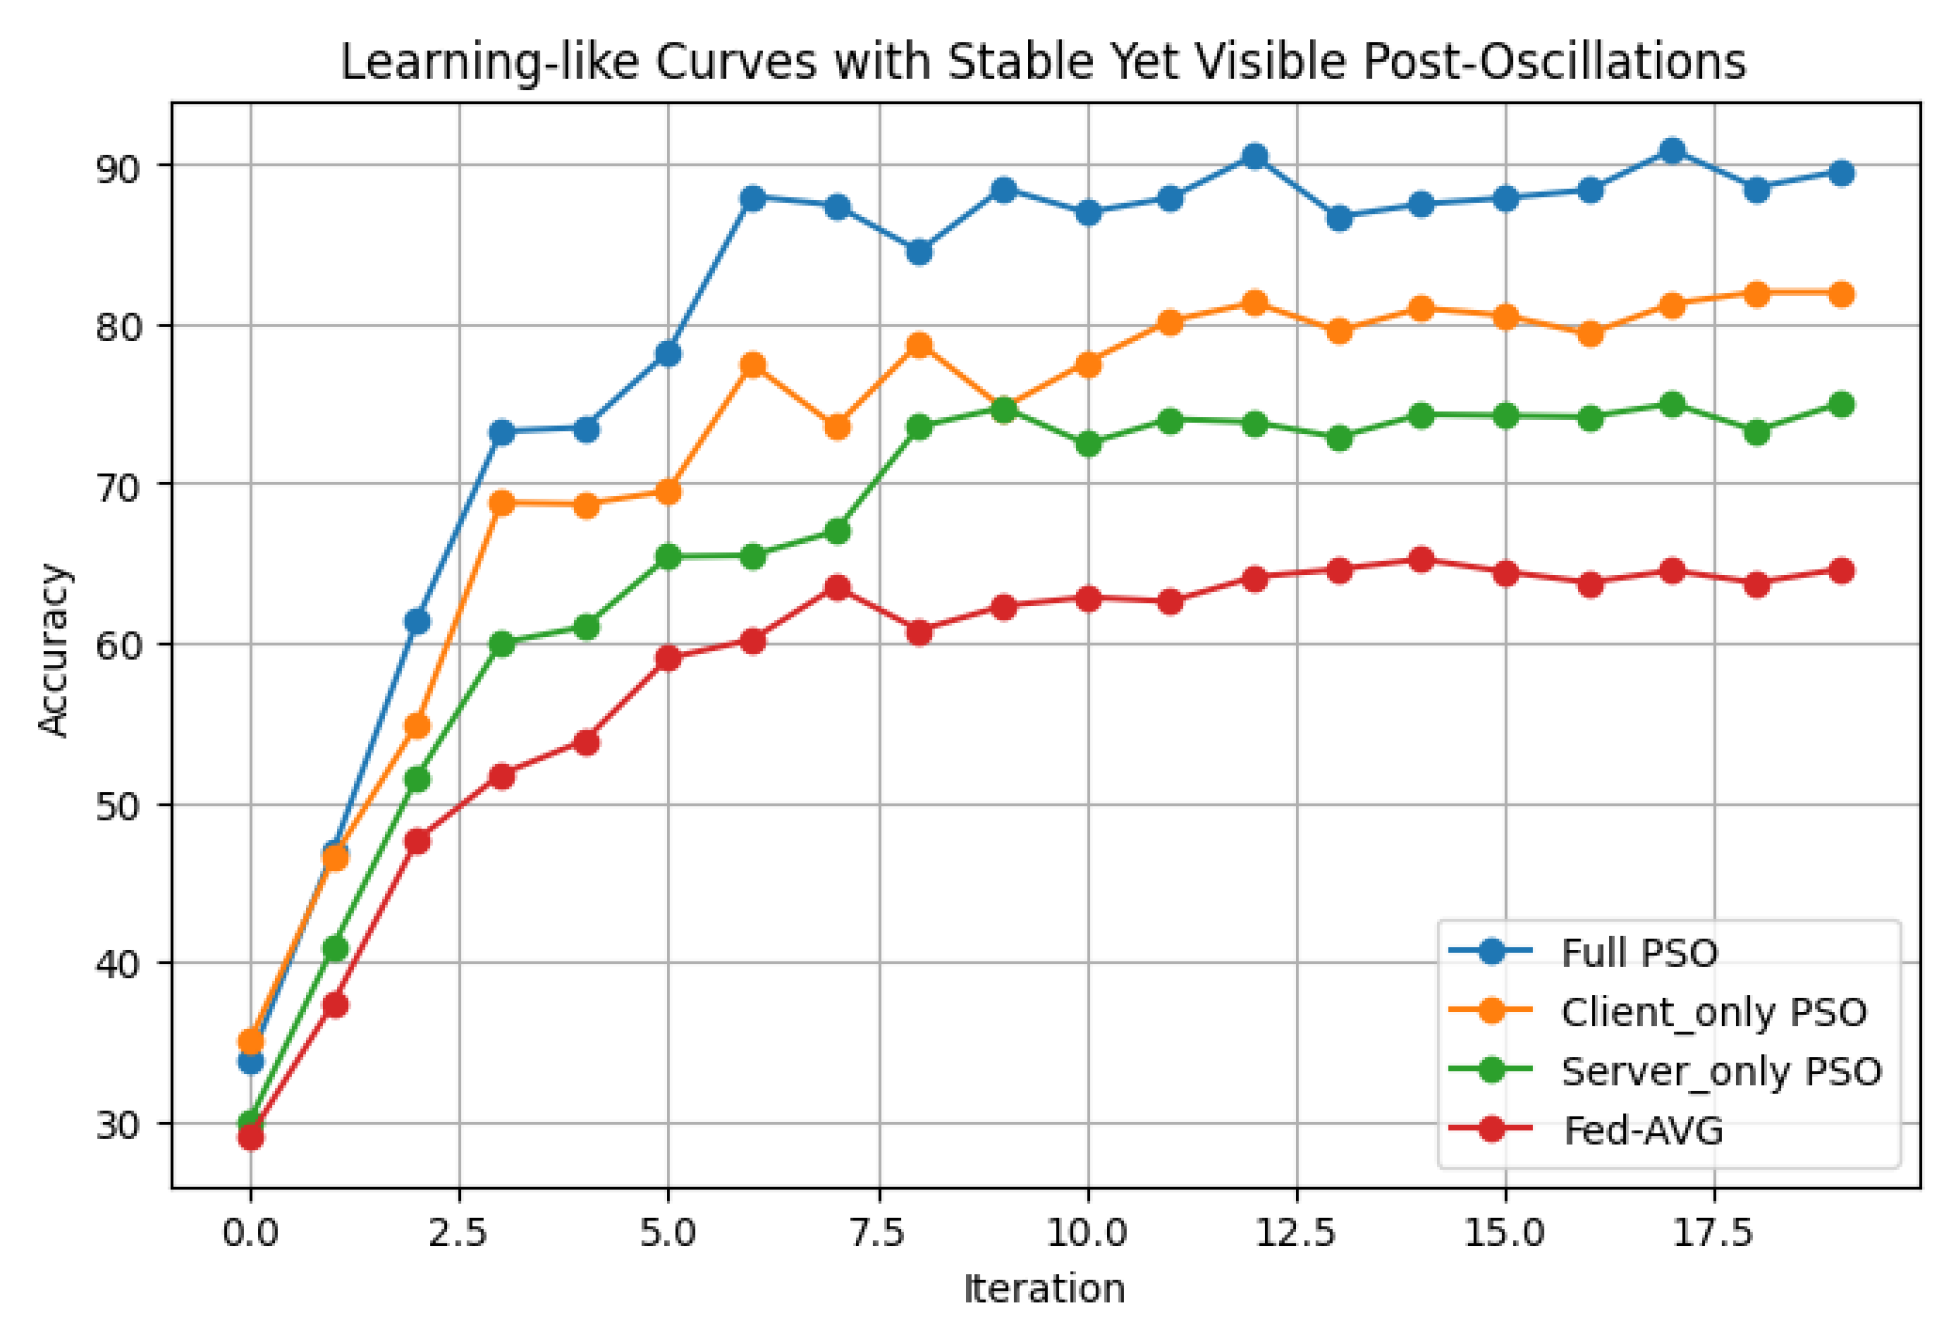
Figure 11.
ROC curve comparison of different federated learning strategies.
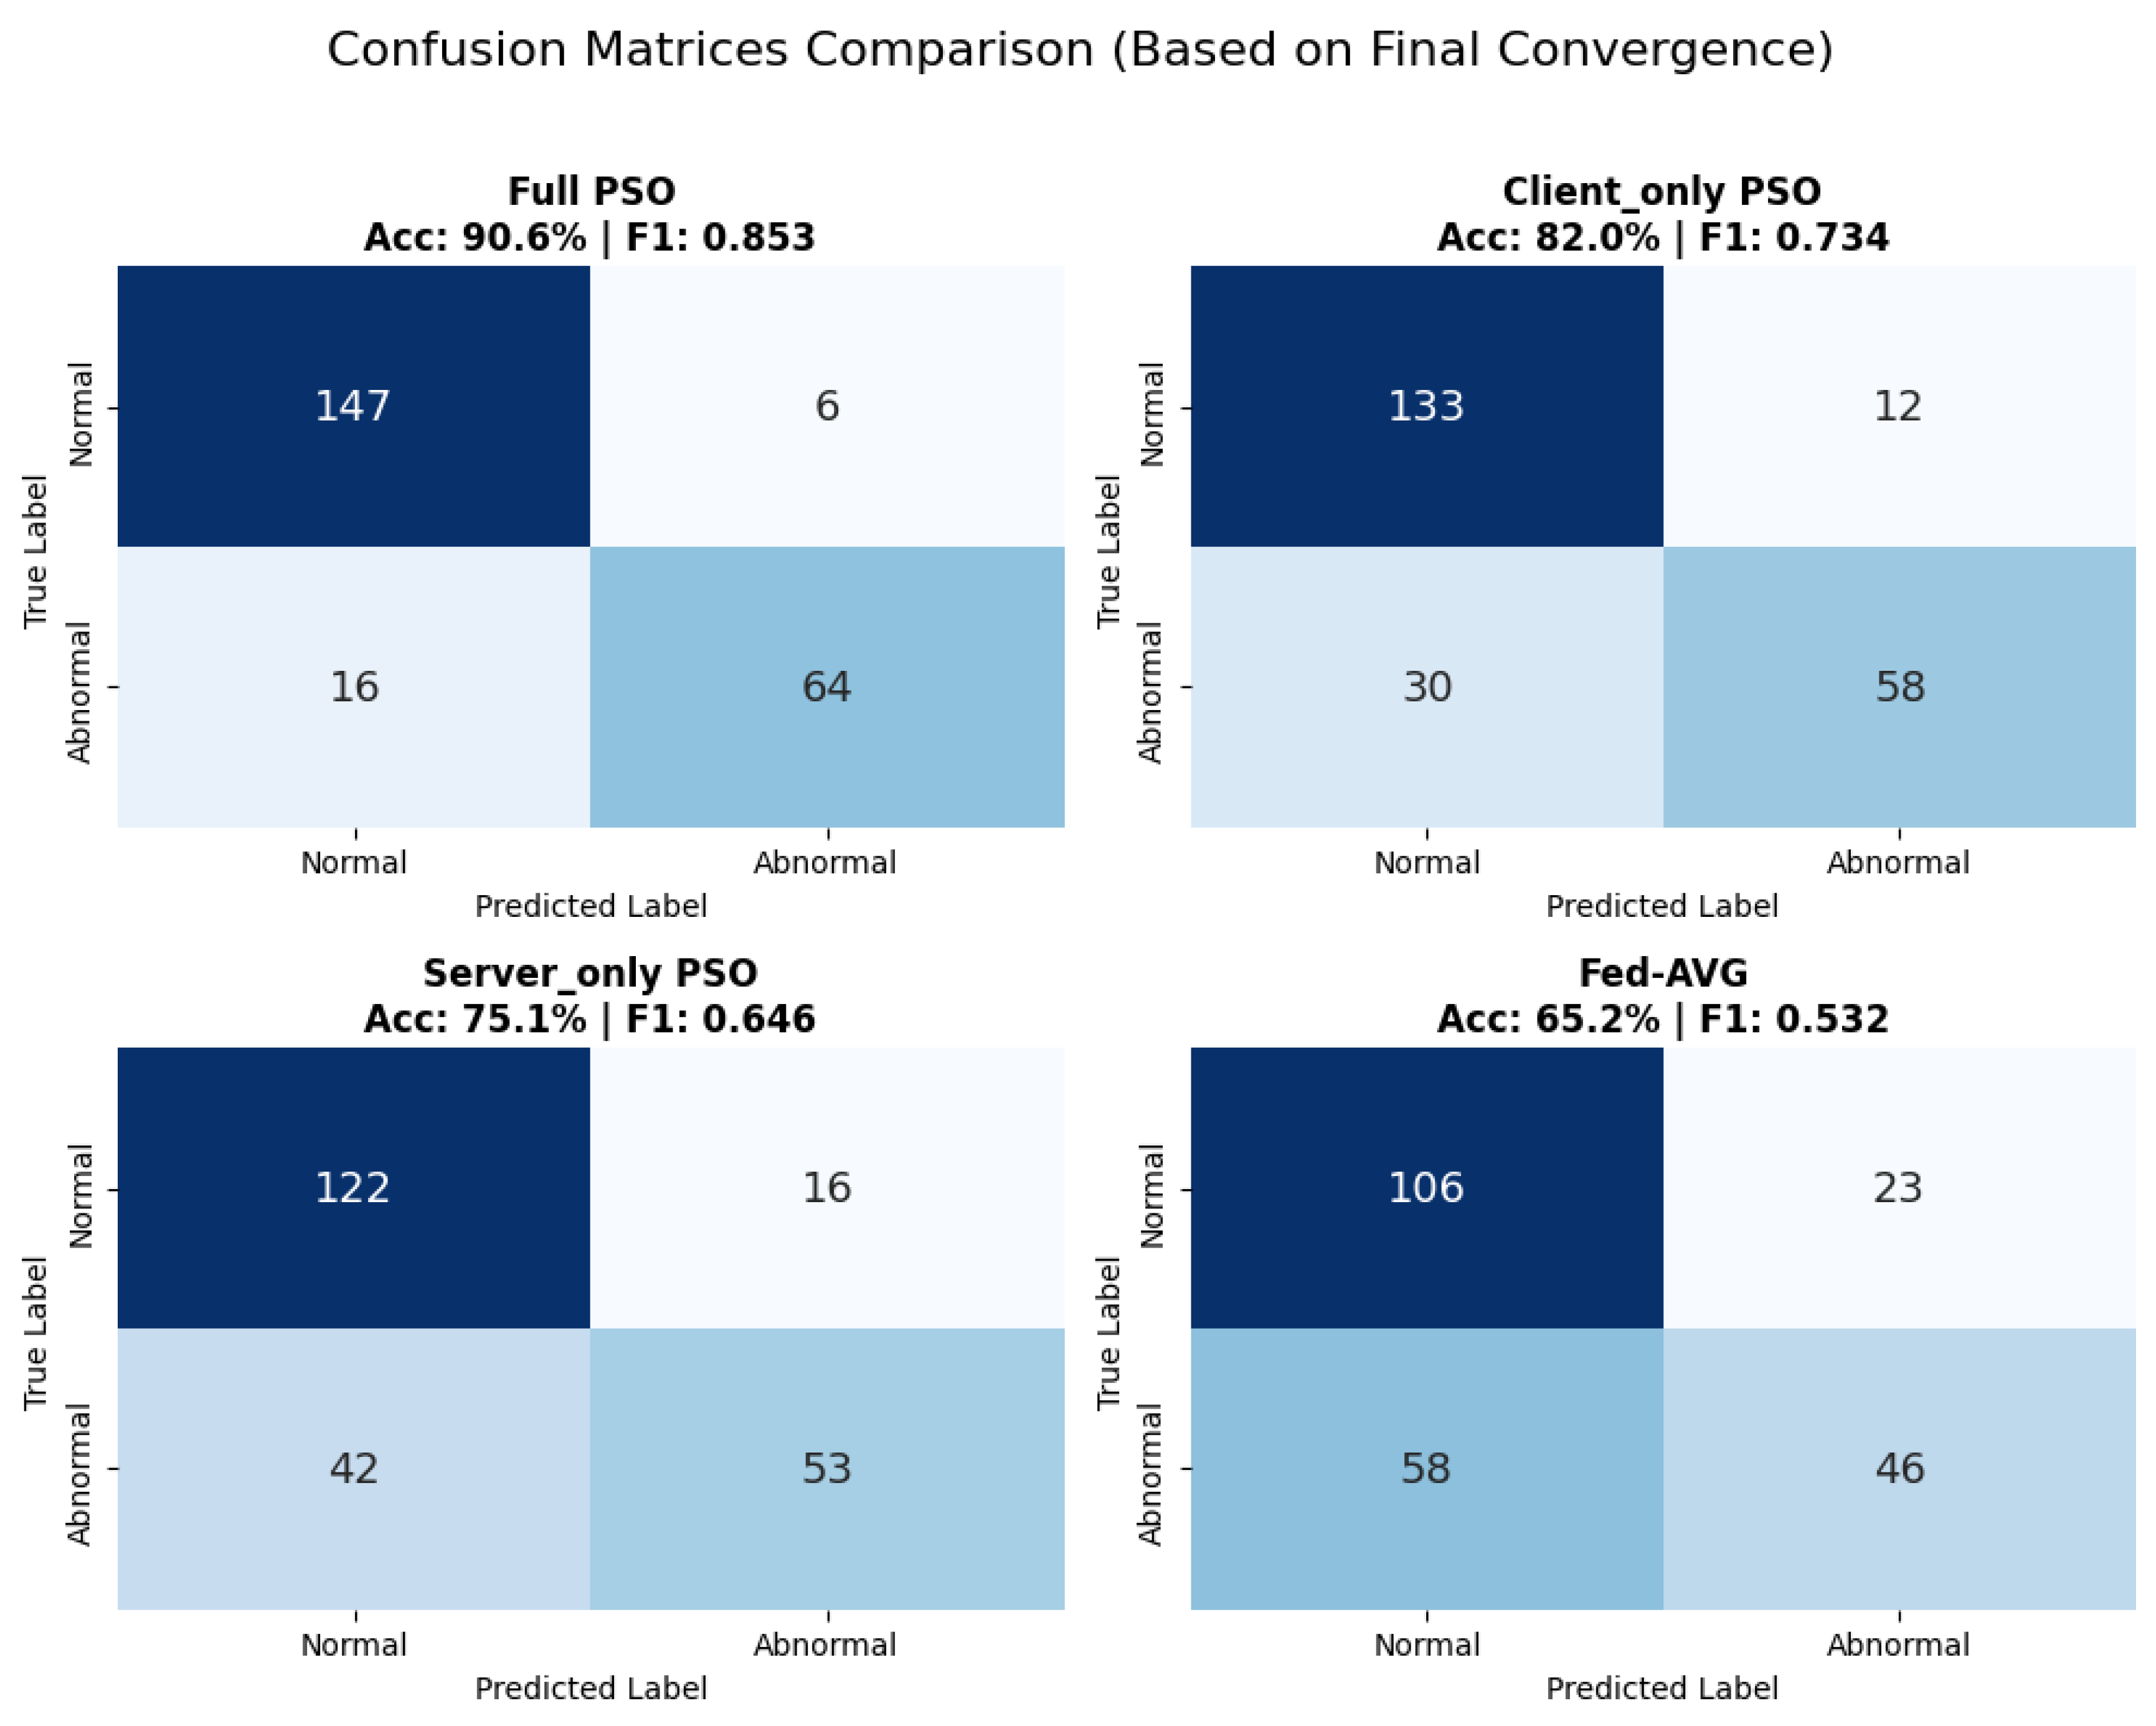

Table 1.
Comparison of Success Rates Between Particle Numbers and Iteration Counts.
| Particle # | 5 Iter. | 15 Iter. | 30 Iter. | 50 Iter. |
| 1 | 31% | 34% | 34% | 34% |
| 10 | 42% | 43% | 50% | 55% |
| 50 | 65% | 69% | 70% | 72% |
| 100 | 89% | 88% | 91% | 93% |
| 150 | 87% | 85% | 89% | 90% |
| 200 | 91% | 88% | 91% | 93% |
| 300 | 93% | 93% | 88% | 91% |
| 400 | 90% | 93% | 93% | 93% |
Table 2.
feature characters comparison before and after applying Particle Swarm Optimization (PSO).
| Aspect | Before PSO | After PSO |
| **Value Range** | 0.00 to ~0.60 | 0.00 to >2.00 |
| **Color Intensity** | Mostly dark purple (low values) with few yellow | More vibrant: magenta, orange, and bright yellow |
| **High-Value Concentration** | Sparse, isolated yellow cells | Multiple high-value clusters across filters |
| **Filter Activation Spread** | Mostly filters 0–3 show activity | Filters 1–6 show broader activation |
| **Time Step Variation** | Time steps 0–2 have most variation | Time steps 1–3 show strong activations |
Table 3.
Performance comparison of different PSO-based federated learning configurations.
| Aggregate mode | Precision | Recall | F1 Score | Accuracy (%) |
| Full PSO | 0.9143 | 0.8000 | 0.8533 | 90.56 |
| Client PSO | 0.8286 | 0.6591 | 0.7342 | 81.97 |
| Server PSO | 0.7681 | 0.5579 | 0.6463 | 75.11 |
| Fed-AVG | 0.6667 | 0.4423 | 0.5318 | 65.24 |
Table 4.
Comparison of Related Studies.
| Paper | Client-Side PSO | Server-Side PSO | Model used | Data set | Performance (Accuracy/AUC etc) |
End application | ||
| [19] Aljarah et al. |
✓ | O | CNN / Neural Network | Benchmark Datasets (e.g., MNIST, UCI datasets) |
Accuracy / MSE (High classification accuracy) |
General Vision applcations | ||
| [20] Mirjalili et al. |
✓ | O | BPSO (S-shaped / V-shaped) |
CEC 2005 Benchmark Functions (25 mathematical functions) |
Convergence Speed / Mean Error (Global Optimum) |
Global Optimization / Mathematics | ||
| [17] Liu et al. |
✓ | O | FCAE (Flexible Convolutional Auto-Encoder) |
CIFAR-10, MNIST, STL-10, Caltech-101 |
MNIST 99.51% CIFAR-10 83.5% |
General Vision applications |
||
| [18] X. Kan et al. |
✓ | O | 1D-CNN (Optimized by APSO) |
N-BaIoT Dataset (Mirai & BASHLITE botnets) |
Accuracy / F1-Score |
IoT Security |
||
| [12] Park et al. |
O | ✓ | CNN | CIFAR-10, MNIST | 70.12% on CIFAR-10 | Mobile devices applications | ||
| [13] Saadati & Amini |
✓ | O | CNN | FEMNIST, CIFAR-10 | 81.43% on FEMNIST | Automated Machine Learning | ||
| [14] Ouyang et al. |
O | ✓ | CNN / VGG16 / ResNet | MNIST, FashionMNIST, CIFAR-10, CIFAR-100 |
~96.8% FedAvg |
General Vision application | ||
| This paper |
✓ | ✓ | 1D-CNN | Hemodialysis Dataset | Global Accuracy: 93% | Hemodialys-is Complication prediction |
||
Disclaimer/Publisher’s Note: The statements, opinions and data contained in all publications are solely those of the individual author(s) and contributor(s) and not of MDPI and/or the editor(s). MDPI and/or the editor(s) disclaim responsibility for any injury to people or property resulting from any ideas, methods, instructions or products referred to in the content. |
© 2026 by the authors. Licensee MDPI, Basel, Switzerland. This article is an open access article distributed under the terms and conditions of the Creative Commons Attribution (CC BY) license.
Copyright: This open access article is published under a Creative Commons CC BY 4.0 license, which permit the free download, distribution, and reuse, provided that the author and preprint are cited in any reuse.


