

Submitted:
07 July 2026
Posted:
08 July 2026
You are already at the latest version
Abstract
This study examines neighborhood socioeconomic differences across the tri-county Detroit metropolitan area, focusing on patterns between its inner- and outer-ring suburbs, and the city of Detroit between 2010 and 2023. Using the Modified Darden–Kamel Composite Socioeconomic Index (CSI), a multidimensional measure of neighborhood socioeconomic status, places are classified into low-, middle-, and high-CSI categories. The analysis describes patterns of racial and ethnic composition, immigrant settlement, and household structure across this socioeconomic hierarchy, drawing on the spatial assimilation and place stratification perspectives. The results reveal a socioeconomic hierarchy, with outer-ring suburbs at the highest positions, inner-ring suburbs mostly in intermediate positions, and Detroit at the lower end. Moreover, both suburban rings are internally differentiated, with varying socioeconomic conditions within each. Racial and ethnic composition, immigrant settlement, and household structure also vary across CSI categories and suburban rings. These patterns remained largely stable between 2010 and 2023, although socioeconomic and demographic shifts occurred within each category. Overall, the findings show that suburban areas in the Detroit metro area are not homogeneous. Differentiating between inner- and outer-ring suburbs reveals important differences in neighborhood socioeconomic conditions.
Keywords:
inner- and outer-ring suburbs
; residential stratification
; socioeconomic status
; racial and ethnic composition
; immigration
; Detroit metropolitan area
1. Introduction
The Detroit metropolitan area provides a useful setting for examining socioeconomic and racial differences across suburban communities. Once a symbol of American industrial power and middle-class stability, Detroit has long been characterized by pronounced divisions along socioeconomic status (SES) and racial lines [14,46]. Detroit’s well-documented history of segregation, white flight, and socioeconomic decline has made the city a classic case in studies of urban inequality [28]. Over the past two decades, however, important changes have reshaped the broader metropolitan region, raising new questions about how SES differences are organized across its suburbs. This paper examines how neighborhood SES varies across Detroit’s suburban rings, specifically between its inner- and outer-ring suburbs, and how these patterns relate to race, ethnicity, and other key sociodemographic characteristics.
The changes in metropolitan Detroit reflect broader national patterns of suburban change [21]. Across the U.S., inner-ring suburbs, especially those in older industrial regions, have increasingly faced challenges once mostly associated with central cities, including aging housing stock, rising poverty and crime, and growing racial and ethnic diversity [5,16,35]. Once predominantly White, many inner suburbs now have larger Black, Asian, and Hispanic populations, along with shrinking tax bases, uneven investment, and deteriorating infrastructure [18]. Outer-ring suburbs are also diversifying, though with more uneven socioeconomic trajectories: some remain affluent, while others show signs of stagnation or decline, particularly in places historically tied to manufacturing or low-wage employment [16]. The traditional image of well-off White suburbs versus disadvantaged, racially diverse central cities no longer captures the full picture. Today's metropolitan regions include affluent enclaves, socioeconomically struggling communities, immigrant gateways, and neighborhoods with varying socioeconomic and racial/ethnic compositions. Detroit's tri-county metropolitan area reflects these dynamics, with wide variation in socioeconomic conditions across its inner- and outer-ring suburbs.
This study takes a multidimensional approach to analyzing neighborhood socioeconomic conditions across metropolitan Detroit. Rather than focusing on a single indicator such as income or poverty, the analysis uses the Modified Darden-Kamel Composite Socioeconomic Index (CSI), which combines income, education, occupation, and housing characteristics [9,10]. This provides a broader picture of neighborhood conditions than a single measure would. The goal is to describe how these conditions and population characteristics are distributed across Detroit's inner- and outer-ring suburbs, and Detroit, and how these patterns changed between 2010 and 2023. By combining the CSI with data on racial and ethnic composition, immigrant settlement, and household structure, the study examines how population characteristics are distributed across metro Detroit’s neighborhood socioeconomic hierarchy. This allows us to identify how racial and ethnic groups, immigrant populations, and household types are distributed across socioeconomic categories and suburban rings, and how these patterns changed between 2010 and 2023. This addresses the broader question of how neighborhood socioeconomic status and population composition are organized across metropolitan Detroit’s inner- and outer-ring suburbs, and how these patterns fit within the region’s socioeconomic hierarchy.
2. Literature Review
Suburbia has seen major socioeconomic changes over the past few decades. To the extent that the suburbs have traditionally been associated with middle-class stability and racial/ethnic homogeneity, they have become more socioeconomically and racially/ethnically diverse as metropolitan areas have grown and changed. These shifts reflect broader sociodemographic and economic restructuring, such as population redistribution, immigration, changes in housing markets, and the decentralization of employment [15]. Instead, new patterns of metropolitan residential stratification have emerged in which socioeconomic conditions, racial and ethnic composition, and public services greatly vary across suburban communities [17].
A growing body of research shows that suburbs are no longer characterized by a single category of advantage. Instead, they include a range of communities that differ in their SES, housing quality, access to employment opportunities, and overall fiscal health [5,16,32]. A central dimension of this differentiation involves the differences between inner- and outer-ring suburbs. In many older metropolitan regions, specifically in the Northeast and Midwest, older inner-ring suburbs closest to central cities face challenges once associated primarily with central cities, such as aging housing stock, fiscal pressures, rising poverty, and growing racial and ethnic diversity [5,19,35]. Meanwhile, outer-ring suburbs tend to be, on average, more affluent, account for a larger share of new residential development and population growth, and often contain newer housing, higher incomes, and stronger local tax bases. As a result, outer-ring suburbs frequently occupy more advantaged positions within metropolitan socioeconomic hierarchies [6,24].
To the extent that metropolitan Detroit reflects broader national patterns of suburban change, two major events may have further shaped and exacerbated these divisions. The 2008 foreclosure crisis strongly affected many Detroit-area inner suburbs, contributing to population loss, depressed property values, and deepening economic pressures in communities already experiencing fiscal strain [9,20]. Detroit’s 2013 municipal bankruptcy, the largest in U.S. history, also reshaped the region’s socioeconomic and institutional landscape, further deepening disinvestment in city services and infrastructure and sharpening socioeconomic contrasts between the city and surrounding suburban areas [37,48]. These patterns of suburban differentiation raise broader questions about how households are distributed across the Detroit metro area and how sociodemographic and economic factors shape residential patterns. Two complementary frameworks, the spatial assimilation model and the place stratification model, provide useful perspectives for interpreting these patterns.
2.1. The Spatial Assimilation Model
The spatial assimilation model has its origins in the Chicago School of urban ecology, which emphasized that spatial relations reflect broader social relations within urban areas [25,36]. From this perspective, residential patterns are understood as the outcome of processes of socioeconomic differentiation, in which individuals and households move through metropolitan space as their socioeconomic resources change. The model links SES improvements, i.e., in education, income, and occupational status, to residential mobility into higher income neighborhoods offering greater resources, amenities, and overall quality of life [29]. Traditionally, this process has been interpreted as moving away from central cities to the suburbs.
According to the spatial assimilation model, higher socioeconomic status is generally associated with residence in higher-status suburban neighborhoods, and differences in residential attainment between racial and ethnic groups are expected to decline or be eliminated when controlling for SES. A large body of research generally finds that socioeconomic status attainment is positively associated with suburban residence among Whites, Asians, and, to a lesser extent, Hispanics. Black households, however, have historically experienced more constrained residential outcomes, reflecting the continued influence of institutional barriers and residential stratification [2,26].
Contemporary patterns of suburban change, however, complicate the traditional spatial assimilation framework by challenging the assumption that suburban residential attainment reflects socioeconomic advantage. In many metropolitan regions, especially in postindustrial areas of the Midwest and Northeast, suburban communities exhibit considerable variation in socioeconomic conditions, racial and ethnic composition, and access to community resources. As Hanlon and colleagues note, many suburbs now contain working-class, immigrant, and lower-income populations, challenging the long-standing assumption that suburban residence uniformly reflects residential advantage [18].
This suburban differentiation suggests that residential attainment is not simply a move from the city to the suburbs, but movement within a stratified suburban landscape. Differentiating between inner- and outer-ring suburbs helps capture this variation. In this context, the relationship between socioeconomic status attainment and residential location may therefore be better understood as movement across a hierarchy of metropolitan places rather than a simple city-to-suburb transition. This perspective provides a useful framework for describing how households and neighborhood socioeconomic conditions are distributed across Detroit’s inner- and outer-ring suburbs and across the broader metropolitan socioeconomic hierarchy.
2.2. Family/Household Characteristics and Spatial Assimilation
Although family and household characteristics are not traditionally part of the bundle of characteristics central to the spatial assimilation model, they do play an important role in shaping residential mobility and neighborhood attainment [4,26,39,40,41,44,45]. Households vary in composition, size, and life-course stage, all of which can affect housing preferences and needs. For example, changes in family structure, such as via marriage, divorce, childbirth, or children leaving home, may change housing needs and lead households to relocate to neighborhoods that better match their changing circumstances [8,41,45]. Household structure can also shape access to different parts of metropolitan housing markets. For example, married-couple or dual-earner households may have greater financial resources and stronger incentives to live in neighborhoods with higher-quality schools, greater safety, and stronger institutional resources. On the other hand, single-parent households or smaller households may face economic obstacles that limit residential mobility or channel them toward more affordable housing markets. These life-course transitions influence both the timing of residential moves and the types of neighborhoods households are able or motivated to pursue [8,33,39,41,44].
These differences are especially relevant in metropolitan regions characterized by a stratified suburban landscape, where household structure and life-course changes can affect whether households move to inner or outer-ring suburbs. From this perspective, where people live depends not just on their individual socioeconomic resources, but also on the household context in which residential decisions are made. Family and household characteristics may interact with SES attainment to shape inner- versus outer-ring suburban residential locations. For example, higher-income married-couple or dual-earner households may be more likely to reside in outer-ring suburbs, while single-parent or economically constrained households may be more likely to reside in inner-ring areas. At the same time, structural factors may continue to shape differences in suburban residential outcomes across racial and ethnic groups, even after accounting for both socioeconomic status and household composition, as described by the place stratification model.
2.3. The Place Stratification Model
While the spatial assimilation model focuses on how individual-level socioeconomic attainment helps explain residential mobility, the place stratification model emphasizes the structural barriers that may restrict access to higher-status neighborhoods [27]. According to this perspective, where people live not only depends on household resources but also on discriminatory practices and broader institutional factors in the housing market. Actions by real estate agents, mortgage lenders, landlords, and local governments may influence where households can live, often reinforcing residential separation between more and less advantaged groups [3,51]. Although overt forms of housing discrimination were outlawed by the 1968 Fair Housing Act, research suggests that more subtle, covert forms of discrimination continue to shape residential outcomes. For example, racial and ethnic minority homebuyers and renters may receive less information about available housing, may be shown fewer housing options in higher-quality neighborhoods, or may be steered toward areas with higher concentrations of people of color [49,52]. Similar patterns have also been documented in mortgage lending, where differences in loan approval and credit access can affect whether households are able to move into more expensive housing markets [52].
In addition to discrimination, differences in household wealth can also affect residential attainment. Historical policies such as redlining and exclusionary housing programs contributed to large differences in wealth across racial and ethnic groups [34,42]. These wealth differences affect whether households are able to make down payments, qualify for and secure favorable mortgage terms, or afford homes in more expensive housing markets. Together, the spatial assimilation and place stratification models help explain why residential stratification across metropolitan areas continues. Both provide useful frameworks for describing how neighborhood socioeconomic conditions and population characteristics are distributed across metro Detroit’s inner- and outer-ring suburbs.
2.4. Extending the Models to a Differentiated Suburban Landscape
The extent to which the spatial assimilation and place stratification models apply to today’s suburban landscape remains an important question. Suburbs no longer represent a single, uniform residential setting; instead, they include neighborhoods that differ in socioeconomic status, housing conditions, and local resources, such as schools, public services, and other amenities. In the Detroit metropolitan area, these differences are noticeable especially between inner- and outer-ring suburbs, which, among other factors, differ in housing stock, institutional resources, and racial and ethnic composition [7,38]. Both the spatial assimilation and place stratification models suggest that suburban residential outcomes and patterns reflect movement across different types of suburbs, as well as unequal access to more advantaged neighborhoods.
From a spatial assimilation perspective, differentiating between inner- and outer-ring suburbs helps to explain how suburban residential attainment may take shape over time. Rather than viewing suburban residence as a single outcome, households may move through different types of suburbs as their SES resources change. For some households, relocating from the central city to an inner-ring suburb may represent an important first step toward improved residential conditions. In this sense, inner-ring suburbs may therefore serve as transitional or intermediate locations within the broader metropolitan housing market.
On the other hand, moving to an outer-ring suburb may reflect a higher level of residential advantage. Such places are often characterized by newer housing developments, higher property values, and stronger local tax bases, which can support better-funded public services and community amenities. Therefore, residence in outer-ring suburbs may reflect higher socioeconomic attainment and access to more advantaged neighborhoods within the metropolitan area. In this sense, movement to outer-ring suburbs may represent a higher level within the metropolitan residential hierarchy, where households are able to access communities with greater resources, newer development, and more favorable living conditions. At the same time, the place stratification model suggests that access to higher-status suburban areas is not equal across households. Even among households with similar SES levels, structural barriers in housing markets may limit access to more desirable suburban neighborhoods. As a result, some groups may be more concentrated in lower-SES inner-ring suburbs, while others may be more likely to reside in higher-SES outer-ring communities.
3. Hypotheses
Building on the preceding discussion of the spatial assimilation and place stratification models, this study is guided by several expectations regarding patterns of sociodemographic and economic differences across the Detroit metropolitan suburban landscape.
To the extent that residential attainment occurs across a differentiated suburban landscape rather than simply between the city and the suburbs, it is expected that outer-ring suburbs will be positioned at the higher end of the metropolitan socioeconomic hierarchy, followed by inner-ring suburbs, and that Detroit is concentrated at the lower end. At the same time, however, lower-SES neighborhoods are expected to be more common in inner-ring suburbs, while higher-SES neighborhoods are expected to be more concentrated in outer-ring suburbs.
Racial and ethnic groups are also expected to be unevenly distributed across the suburban SES hierarchy. White and Asian residents are expected to be more concentrated in higher-SES neighborhoods, especially in outer-ring suburbs, while Black and Hispanic residents are expected to be more concentrated in lower-SES neighborhoods, such as in inner-ring suburbs and Detroit. In accordance with the place stratification perspective, racial and ethnic diversity is also expected to vary across the metropolitan SES hierarchy. It is expected that lower- and middle-SES neighborhoods will be more diverse, especially in Detroit and inner-ring suburbs, and higher-SES outer-ring places to be less diverse.
Lastly, family and household characteristics are also expected to be differentially distributed across the suburban SES hierarchy. Higher-SES outer-ring suburbs are expected to have more married-couple households, while inner-ring suburbs and lower-SES areas are expected to have more varied household structures, such as higher shares of single-parent and nonfamily households.
4. Data and Methods
The primary dataset consists of census tract data from the 2010 and 2023 American Community Survey (ACS) 5-year estimates for the Detroit tri-county metropolitan area, including Wayne, Oakland, and Macomb counties. The 2010 5-Year ACS census tracts were normalized to 2020 tract boundaries to allow comparison across both time periods using consistent geographic units. Afterward, the Missouri Census Data Center’s Geocorr spatial allocation tool was used to identify which census tracts fell within each county subdivision, allowing tract-level data to be aggregated to the county subdivision level. County subdivisions, such as cities, charter townships, and civil townships, serve as the study’s unit of analysis. County subdivisions are locally governed administrative units that provide a useful framework for examining socioeconomic and demographic differences across suburban communities [31,50].
To differentiate between inner- and outer-ring suburbs in metropolitan Detroit, this study uses the method developed by Hanlon and Vicino [53] for the Baltimore region. Inner-ring suburbs were identified using QGIS based on proximity to Detroit and the age of the housing stock, following a two-step process. First, all subdivisions that shared a boundary with Detroit were identified. Second, subdivisions adjacent to these areas were classified as inner-ring suburbs if at least 50 percent of their housing units were built before 1970. Suburban areas that did not meet these criteria were classified as outer-ring suburbs. This approach follows the historical development of suburbanization in metropolitan Detroit and is consistent with the idea of first-ring or mature suburbs that emerged during the early post–World War II period [13,23,46,47]. Using this method, 40 inner-ring suburbs and 76 outer-ring suburbs were identified across the tri-county Detroit metropolitan area. Centroid distances were calculated between each inner-ring suburb and Detroit to show the spatial extent of the inner ring. The farthest inner-ring suburb is located approximately 14.8 miles from the city center. Figure 1 presents a map of suburban areas in metropolitan Detroit.
4.1. Composite Socioeconomic Index (CSI)
To examine SES differences across metropolitan Detroit and its suburban communities, this study uses the Modified Darden–Kamel Composite Socioeconomic Index (CSI) to measure the relative socioeconomic status position of county subdivisions. In contrast to using single indicators, such as poverty or median income, the CSI measures socioeconomic position as a multidimensional construct by providing a more comprehensive overview of neighborhood opportunity structures and quality-of-life conditions [11,12].
The index is calculated using nine socioeconomic status indicators associated with neighborhood quality and socioeconomic opportunity, such as: the percentage of the population below the poverty line, the unemployment rate, the median household income, the percentage employed in managerial and professional occupations, the educational attainment, the median housing value, the median gross rent, the homeownership rate, and the vehicle availability. All of the above indicators capture various dimensions of socioeconomic position, including labor market conditions, educational attainment, housing characteristics, and access to household resources. Prior research has demonstrated that composite indices incorporating multiple indicators are more effective at capturing variation in neighborhood socioeconomic status than single measures such as poverty alone [12,22].
Given that each indicator is measured on different scales, they are standardized by calculating z-scores to allow comparison across all variables. This way, indicators measured on different scales all have the same weight and contribute equally to the index. Variables associated with socioeconomic disadvantage, such as the percentage below the poverty line and the unemployment rate, are multiplied by −1 so that higher values of the index consistently reflect higher socioeconomic position. The standardized values were then summed to create a composite CSI score for each county subdivision. The index is calculated as follows:
where:
CSIi represents the composite socioeconomic index for county subdivision i; Vij represents the observed value of socioeconomic variable j for county subdivision i; VjDMA represents the mean value of variable j across all county subdivisions in the Detroit metropolitan area; S(VjDMA) represents the standard deviation of variable j across all county subdivisions in the Detroit metropolitan area; and k represents the number of variables included in the index.
This creates a continuous measure of socioeconomic status position that reflects the cumulative socioeconomic characteristics of each county subdivision. Higher CSI values indicate higher socioeconomic position, while lower values indicate lower socioeconomic position. The CSI scores were initially divided into five categories based on their distribution across the county subdivisions. Quintile cut points at the 20th, 40th, 60th, and 80th percentiles were used to classify areas into very low, low, moderate, high, and very high socioeconomic position. For the present analysis, the five categories were collapsed into three broader groups, low, moderate, and high socioeconomic position, to simplify interpretation and to allow for a clearer comparison across Detroit, inner-ring suburbs, and outer-ring suburbs. The analysis is organized in two stages. First, it examines the spatial distribution and stability of neighborhood socioeconomic status across Detroit and its inner- and outer-ring suburbs. Second, it evaluates how racial/ethnic group composition, immigrant settlement, and family/household structure vary across metropolitan subareas and across socioeconomic position (SEP) levels within the suburban rings.
4.2. Neighborhood Socioeconomic Status Across Metropolitan Detroit
A clear pattern emerges from Figure 1, which shows the spatial distribution of CSI levels across the inner- and outer-ring suburbs of the Detroit metropolitan area, including Detroit. High-CSI areas are largely concentrated in the outer suburbs, especially to the north and northwest of Detroit. Low-CSI areas are concentrated in Detroit and in nearby inner-ring suburbs, and are much less common in the outer ring. Meanwhile, middle-CSI areas are not evenly distributed across the region. To the extent that they should theoretically serve as a transition between the city and the suburbs, they are found across both suburban rings, often bordering higher-CSI communities. Overall, the map suggests that the Detroit metro area is characterized by a clear socioeconomic hierarchy, as well as significant variation within suburban areas.
Figure 2 shows how CSI levels changed between 2010 and 2023 across the Detroit metro area. A key finding is that the overall structure remained relatively stable, especially at the top and bottom of the hierarchy. For example, nearly 90% of places that were classified as high in 2010 remained in the high category in 2023, and a similar share of low-CSI places remained in the low category. Nevertheless, middle-CSI places showed more movement, with about two-thirds remaining in the middle category and the rest shifting either upward to high or downward to low. Overall, Figure 2 reveals that the metropolitan socioeconomic hierarchy changed only modestly over the period.
Figure 3 breaks the above transitions down by suburban ring. While both suburban rings show a high degree of stability, the patterns between them, however, differ. In the outer suburbs, stability is highest at the top and bottom of the hierarchy, with most high- and low-CSI places remaining in the same category, while middle-CSI places show more movement in both directions. In the inner suburbs, there was less movement across categories. All high-CSI and middle-CSI places remained in the same category between 2010 and 2023. At the same time, nearly all low-CSI places remained low, with only a small share moving to the middle category. Overall, Figure 3 suggests that while both suburban rings were stable, the inner ring demonstrated a more fixed socioeconomic structure during this period.
Overall, Figure 1, Figure 2 and Figure 3 show that the Detroit metropolitan area is characterized by a differentiated socioeconomic hierarchy, rather than a simple city–suburb divide. Outer-ring suburbs are concentrated at the higher end of the CSI hierarchy, inner-ring suburbs occupy an intermediate position, and Detroit remains concentrated at the lower end. In addition, both suburban rings include a mix of places across socioeconomic levels, highlighting that suburban space is internally diverse rather than uniform.
4.3. Socioeconomic Characteristics Underlying the Hierarchy
Table 1A presents the indicators that comprise the Composite Socioeconomic Index (CSI). The results show a clear socioeconomic hierarchy across the Detroit metro area. Detroit ranks lowest on most indicators, including education, income, housing value, and other measures of socioeconomic advantage, while outer-ring suburbs generally rank highest. Meanwhile, inner-ring suburbs mostly fall between these two ends of the CSI hierarchy.
Socioeconomic differences exist not only between Detroit and the suburbs, but also within the suburban rings themselves. Among inner suburbs, low-SEP places have weaker socioeconomic conditions than high-SEP places, such as higher poverty and unemployment rates, and lower incomes and home values. Middle-SEP places tend to fall between these groups. A similar pattern appears in the outer-ring suburbs, with high-SEP places having the strongest socioeconomic profiles, and low-SEP places showing weaker outcomes. Nevertheless, low-SEP outer suburbs are socioeconomically more advantaged than Detroit and, in some cases, are comparable to low-SEP inner suburbs.
Examining the percentage changes in the CSI indicators between 2010 and 2023 (Table 1B) shows that socioeconomic change during this period was unevenly distributed across the Detroit metropolitan area. Median household income, home values, and rents increased across all parts of the region, although the size of these increases varied by location and SEP level. With the exception of Detroit, poverty increased in many areas, especially in low-SEP inner suburbs and middle-SEP outer suburbs. Changes in unemployment were more mixed, declining in Detroit and some inner and outer suburban areas, but increasing in others. The share of residents without a vehicle declined in Detroit and the inner suburbs, but increased in the outer suburbs. Changes in homeownership varied across areas, declining in Detroit, showing mixed patterns in the inner suburbs, and increasing in the outer suburbs.
4.4. Racial and Ethnic Composition Across the Metropolitan Hierarchy
Racial and ethnic composition varies not only across Detroit and its suburban rings, but also across SEP levels within each suburban ring (see Figure 4). Detroit remains demographically different from both suburban rings in that it has a large share of the metropolitan Black population and a low share of White residents. The outer suburbs account for the largest shares of White and Asian residents and also for a notable share of Hispanic residents. On the other hand, the inner suburbs account for smaller but still meaningful shares of each racial and ethnic group. Meanwhile, both suburban rings include sizeable Black populations, especially in lower-SEP areas.
Racial and ethnic group composition also differs by SEP level within each suburban ring. Among outer-suburb rings, higher-SEP areas account for relatively larger shares of Asian and White residents than middle- or lower-SEP areas. In the inner suburbs, the racial/ethnic distribution varies across SEP levels. with White and Asian shares varying across SEP levels, including relatively higher shares in some lower-SEP areas. Black residents are more concentrated in lower-SEP places in both suburban rings. The distribution among Hispanic residents is more mixed, with relatively larger shares in lower-SEP inner suburbs and in certain outer-suburban SEP categories. Overall, the above patterns suggest that racial and ethnic groups are unevenly distributed across the metropolitan socioeconomic hierarchy.
The percentage changes in racial/ethnic distribution between 2010 and 2023, as shown in the lower panel of Figure 4, suggest that racial and ethnic change has occurred across multiple parts of suburban Detroit rather than being concentrated in a single segment of the metropolitan area. While the White share of the metro population increased in Detroit, the share for Black, Asian, and Hispanic residents decreased. In the inner suburbs, Black shares increased across SEP levels, with greater increases in the middle- and higher-SEP categories. In the outer suburbs, Black shares increased in the high- and low-SEP categories but declined in middle-SEP areas. Hispanic shares increased across suburban SEP levels, with larger gains in both the higher-SEP inner- and outer-suburban ring areas. Asian shares also increased across suburban areas, though the pattern differed by SEP level, with larger increases in some areas and smaller changes in others. For example, some of the largest increases occurred in middle-SEP areas in both the inner and outer suburbs.
4.5. Immigrant Settlement by Arrival Period Across Detroit and the Suburban Rings
A key result from Figure 5 is that foreign-born residents are mostly concentrated in suburban areas rather than in the city of Detroit. In addition, they are distributed across multiple suburban locations rather than concentrated in a single area, across all arrival periods. In 2023, the largest shares of foreign-born residents are found in higher-SEP outer suburbs, followed by lower-SEP inner suburbs, across all arrival periods. Middle- and lower-SEP outer suburbs had smaller shares, while higher- and middle-SEP inner suburbs had the smallest shares.
The percentage changes also reflect the patterns we saw in that immigrant growth occurred across several suburban contexts rather than being concentrated in only one part of the region (Figure 5, bottom panel). Recent arrivals increased in inner and outer middle-SEP suburbs, while declining in higher-SEP inner suburbs, and lower-SEP outer suburbs. Middle arrival immigrants increased in middle-SEP suburban areas and in higher-SEP outer ring suburbs, but declined in lower-SEP inner suburbs. Among long-term foreign-born residents, we see increases in middle-SEP outer suburbs and lower-SEP inner ring suburbs, while higher-SEP inner suburbs and lower-SEP outer suburbs registered declines. Detroit experienced declines in foreign-born residents across all arrival periods.
4.6. Family and Household Structure Across the Metropolitan Hierarchy
A key finding from Figure 6 is that family and household characteristics vary across metropolitan Detroit and within suburbs by SEP. Overall, married-couple and family households tend to be more common in outer suburbs than in inner suburbs. Higher-SEP outer suburbs account for the largest share of these households, while lower-SEP outer suburbs also account for a sizable share. At the same time, there is variation within the suburban rings. Specifically, within the inner rings, lower-SEP areas have, on average, a larger share of married-couple and family households than the middle- and high-SEP areas. Lower-SEP outer suburbs also account for a meaningful share of married and family households. Single-headed female households are most concentrated in Detroit, and are also relatively more common in lower-SEP outer and inner suburbs. On the other hand, higher- and middle-SEP inner suburbs generally account for smaller shares of these household types.
The relative percentage changes between 2010 and 2023, as shown in the bottom panel of Figure 6, reveal that household structure varies across the metropolitan socioeconomic hierarchy. Female-headed households increased for all SEP levels across all suburban rings, with the largest increases in middle-SEP outer suburbs. Married-couple households also increased in middle-SEP outer suburbs. Followed by increases in middle-SEP inner suburbs, but declined, however, in lower-SEP outer suburbs as well as in higher- and lower-SEP inner suburbs. Family households increased across all outer-suburban SEP levels and in middle-SEP inner suburbs, while declining in higher- and lower-SEP inner suburbs. At the same time, Detroit registered declines across all the family/household categories.
5. Discussion and Conclusion
This study presents a descriptive analysis of patterns of residential stratification across the metropolitan Detroit area by comparing inner-ring suburbs, outer-ring suburbs, and Detroit between 2010 and 2023. The results show that the Detroit metropolitan area is organized in a structured socioeconomic hierarchy, with outer-ring suburbs at higher levels, inner-ring suburbs at middle levels, and Detroit at the lower end. At the same time, both suburban rings exhibit considerable internal variation, with lower-SES areas more prevalent in the inner rings and higher-SES areas more prevalent in the outer rings. These findings support the expectation that suburban areas are not homogeneous. In addition to socioeconomic differences between the suburbs and Detroit, differences also exist within the suburbs, contributing to the body of research that challenges the city–suburb binary [1,18,32].
Racial and ethnic group composition, foreign-born settlement patterns, and family/household characteristics also vary across suburban rings and the metropolitan Detroit socioeconomic hierarchy. White and Asian groups are more concentrated in higher-SES outer-ring suburbs, while Black residents are more concentrated in lower-SES areas in both suburban rings, and in Detroit. Hispanic residents are spread across multiple SES levels, and their distribution varies across suburban rings. The relative percentage changes between 2010 and 2023 reveal that the above demographic shifts occurred across multiple parts of suburban Detroit. With respect to immigrant residential patterns, the results show that foreign-born residents are mostly located in suburban areas, especially in higher-SEP outer suburbs and lower-SEP inner suburbs. Changes over time reveal that foreign-born residential settlement stretches across multiple suburban areas, particularly in middle-SEP areas, rather than concentrating in a single part of the region. These changes, across both racial/ethnic composition and immigrant settlement, have occurred within the existing metropolitan structure rather than altering its overall pattern. Regarding family/ household characteristics, they also differ across the metropolitan hierarchy. Married-couple households are more common in higher-SEP outer suburbs, while female-headed households are more concentrated in lower-SEP and Detroit suburban areas. Inner-ring suburbs show more variation in household structure across SES levels relative to outer-ring suburbs. Relative percentage changes between 2010 and 2023 reveal increases in female-headed households across all suburban SEP levels, alongside mixed patterns in married-couple and family households. Changes in family/household characteristics also occurred across the metropolitan hierarchy; however, these patterns varied across suburban rings and SEP levels. Overall, the above findings underscore the importance of differentiating between inner- and outer-ring suburbs to understand patterns of stratification in metropolitan Detroit. The suburbs are not uniform; they differ by SES characteristics, racial and ethnic composition, immigrant settlement, and family/household structure. This differentiation provides a clearer understanding of how stratification is distributed across the Detroit metropolitan area, moving beyond a simple city–suburb divide.
This study has several limitations. First, the analysis is descriptive and does not ascertain causal relationships between socioeconomic conditions, race and ethnicity, nativity, and family/household characteristics. Therefore, the findings identify patterns of association but cannot determine the direction or underlying mechanisms driving these relationships. Second, the data are cross-sectional, that is, it captures conditions at specific points in time rather than following the same places or people over time. This limits the ability to study change over time, such as neighborhood change, residential mobility, or how people move across socioeconomic levels. Third, the use of aggregate-level data focuses on places rather than individuals. As a result, the results do not capture how individual characteristics shape residential outcomes. Lastly, categorizing places into CSI groups reduces variation within categories. To the extent that it’s useful for identifying general patterns, this method may overlook differences among places within the same category. Future research could examine how individual-level characteristics affect where people live, including differences across immigrant groups, and how residential mobility changes over time. Moreover, multivariate analyses will provide a better understanding of how socioeconomic and demographic factors are related to residential outcomes across Detroit’s inner- and outer-ring suburbs. Nevertheless, and despite the above limitations, this study provides a descriptive account of how socioeconomic status and population characteristics are distributed across metropolitan Detroit.
Author Contributions
G.A. is the sole author and contributed to all aspects of the study.
Funding
This research received no internal or external funding.
Data Availability Statement
The data used in this study are publicly available through IPUMS USA at https://usa.ipums.org. The specific dataset used in the present analysis is available upon request.
Conflicts of Interest
The author declares no conflicts of interest.
References
- Airgood-Obrycki, W., Hanlon, B., & Rieger, S. (2021). Delineate the US suburb: An examination of how different definitions of the suburbs matter. Journal of Urban Affairs, 43(9), 1263–1284. [CrossRef]
- Alba, R. D., & Logan, J. R. (1991). Variations on two themes: Racial and ethnic patterns in the attainment of suburban residence. Demography, 28(3), 431–453. [CrossRef]
- Alba, R. D., & Logan, J. R. (1993). Minority proximity to whites in suburbs: An individual-level analysis of segregation. American Journal of Sociology, 98(6), 1388–1427. [CrossRef]
- Alba, R., & Nee, V. (2015). Remaking the American mainstream: Assimilation and contemporary immigration. Harvard University Press.
- Anacker, K. B. (Ed.). (2015). The new American suburb: Poverty, race and the economic crisis. Ashgate.
- Argeros, G. (2018). Racial and ethnic group spatial assimilation in inner and outer suburban rings. Social Sciences, 7(11), 229. [CrossRef]
- Argeros, G. (forthcoming). Residential segregation and socioeconomic status differences across inner- and outer-ring suburbs in Metro Detroit. Sociological Focus.
- Clark, W. A. V., & Dieleman, F. M. (1996). Households and housing: Choice and outcomes in the housing market. Transaction Publishers.
- Darden, J. T. (2023). Detroit after bankruptcy: Are there trends towards an inclusive city? Policy Press.
- Darden, J. T., & Kamel, S. M. (2000). Black residential segregation in the city and suburbs of Detroit: Does socioeconomic status matter? Journal of Urban Affairs, 22(1), 1–13. [CrossRef]
- Darden, J. T., & Rubalcava, L. (2018). The measurement of neighborhood socioeconomic characteristics and Hispanic and non-Hispanic White residential segregation in metropolitan Detroit. Hispanic Journal of Behavioral Sciences, 40(3), 312–329. [CrossRef]
- Darden, J., Rahbar, M., Jezierski, L., Li, M., & Velie, E. (2010). The measurement of neighborhood socioeconomic characteristics and Black and White residential segregation in metropolitan Detroit: Implications for the study of social disparities in health. Annals of the Association of American Geographers, 100(1), 137–158. [CrossRef]
- Farley, R. (2022). Chocolate city, vanilla suburbs revisited: The racial integration of Detroit’s suburbs. Du Bois Review: Social Science Research on Race, 19(1), 1–29. [CrossRef]
- Farley, R., Danziger, S., & Holzer, H. J. (2000). Detroit divided. Russell Sage Foundation. [CrossRef]
- Frey, W. H. (2015). Diversity explosion: How new racial demographics are remaking America. Brookings Institution Press.
- Hanlon, B. (2009). Once the American dream: Inner-ring suburbs of the metropolitan United States. Temple University Press.
- Hanlon, B., Short, J. R., & Vicino, T. (2009). Cities and suburbs: New metropolitan realities in the US. Routledge.
- Hanlon, B., Vicino, T., & Short, J. R. (2006). The new metropolitan reality in the US: Rethinking the traditional model. Urban Studies, 43(12), 2129–2143. [CrossRef]
- Hudnut, W. H. (2003). Halfway to everywhere: A portrait of America’s first-tier suburbs. ULI–the Urban Land Institute.
- Immergluck, D. (2011). Foreclosed: High-risk lending, deregulation, and the undermining of America’s mortgage market. Cornell University Press.
- Kneebone, E., & Berube, A. (2013). Confronting suburban poverty in America. Rowman & Littlefield.
- Krieger, N., Williams, D. R., & Moss, N. E. (1997). Measuring social class in US public health research: Concepts, methodologies, and guidelines. Annual Review of Public Health, 18(1), 341–378. [CrossRef]
- Kruse, K. M., & Sugrue, T. J. (Eds.). (2006). The new suburban history. University of Chicago Press.
- Lee, S., & Leigh, N. G. (2007). Intrametropolitan spatial differentiation and decline of inner-ring suburbs: A comparison of four US metropolitan areas. Journal of Planning Education and Research, 27(2), 146–164. [CrossRef]
- Lieberson, S. (1963). Ethnic patterns in American cities. Free Press of Glencoe.
- Logan, J. R., & Alba, R. D. (1993). Locational return to human capital: Minority access to suburban community resources. Demography, 30(2), 243–268. [CrossRef]
- Logan, J. R., & Molotch, H. (1987). Urban fortunes: The political economy of place. University of California Press.
- Massey, D. S., & Denton, N. A. (1988). Suburbanization and segregation in US metropolitan areas. American Journal of Sociology, 94(3), 592–626. [CrossRef]
- Massey, D. S., & Mullan, B. P. (1984). Processes of Hispanic and Black spatial assimilation. American Journal of Sociology, 89(4), 836–873. [CrossRef]
- Meschede, T., Osoro, S., & Shapiro, T. (2013). The roots of the widening racial wealth gap: Explaining the Black-White economic divide. Institute on Assets and Social Policy.
- Michigan Townships Association. (2023). About townships. https://michigantownships.org/about-townships/.
- Mikelbank, B. A. (2004). A typology of US suburban places. Housing Policy Debate, 15(4), 935–964. [CrossRef]
- Mulder, C. H., & Hooimeijer, P. (1999). Residential relocations in the life course. In L. J. G. van Wissen & P. A. Dykstra (Eds.), Population issues: An interdisciplinary focus (pp. 159–186). Springer.
- Oliver, M. L., & Shapiro, T. M. (2006). Black wealth/white wealth: A new perspective on racial inequality. Routledge. [CrossRef]
- Orfield, M. (2011). American metropolitics: The new suburban reality. Rowman & Littlefield.
- Park, R. E., Burgess, E. W., & McKenzie, R. D. (1925). The city. University of Chicago Press.
- Peck, J., & Whiteside, H. (2016). Financializing Detroit. Economic Geography, 92(3), 235–268. [CrossRef]
- Pinho, K. (2024, December 12). Detroit’s inner-ring suburbs are at a crossroads. Crain’s Detroit Business. https://www.crainsdetroit.com/crains-forum-inner-ring-suburbs/growth-housing-top-concerns-detroits-nearest-neighbors/.
- Rosenbaum, E., & Friedman, S. (2001). Differences in the locational attainment of immigrant and native-born households with children in New York City. Demography, 38(3), 337–348. [CrossRef]
- Rosenbaum, E., & Friedman, S. R. (2007). The housing divide: How generations of immigrants fare in New York’s housing market. NYU Press.
- Rossi, P. (1955). Why families move: A study in the social psychology of urban residential mobility. Free Press. [CrossRef]
- Shapiro, T., Meschede, T., & Osoro, S. (2013). The roots of the widening racial wealth gap: Explaining the Black-White economic divide. Institute on Assets and Social Policy.
- South, S. J., Crowder, K., & Chavez, E. (2005). Geographic mobility and spatial assimilation among US Latino immigrants. International Migration Review, 39(3), 577–607. [CrossRef]
- South, S. J., & Crowder, K. D. (1997). Residential mobility between cities and suburbs: Race, suburbanization, and back-to-the-city moves. Demography, 34(4), 525–538. [CrossRef]
- South, S. J., & Deane, G. D. (1993). Race and residential mobility: Individual determinants and structural constraints. Social Forces, 72(1), 147–167. [CrossRef]
- Sugrue, T. J. (2014). The origins of the urban crisis: Race and inequality in postwar Detroit (updated ed.). Princeton University Press.
- Thomas, J. M. (2013). Redevelopment and race: Planning a finer city in postwar Detroit. Wayne State University Press. [CrossRef]
- Turbeville, W. C. (2013). Detroit bankruptcy: Why is Detroit in bankruptcy? Demos. https://www.demos.org/sites/default/files/publications/Detroit_Bankruptcy-Demos.pdf.
- Turner, M. A., Ross, S., Galster, G., & Yinger, J. (2002). Discrimination in metropolitan housing markets: National results from phase I HDS 2000. U.S. Department of Housing and Urban Development.
- U.S. Census Bureau. (2022). Geography boundaries: American Community Survey. https://www.census.gov/programs-surveys/acs/geography-acs/geography-boundaries-by-year/2022.html.
- Yinger, J. (1995). Closed doors, opportunities lost: The continuing costs of housing discrimination. Russell Sage Foundation. [CrossRef]
- Zhao, B., Ondrich, J., & Yinger, J. (2006). Why do real estate brokers continue to discriminate? Evidence from the 2000 Housing Discrimination Study. Journal of Urban Economics, 59(3), 394–419. [CrossRef]
- Hanlon, B., & Vicino, T. (2007). The fate of inner suburbs: Evidence from metropolitan Baltimore. Urban Geoegraphy, 28(3), 249-275. [CrossRef]
Figure 1.
Suburban Classification in the Detroit Metropolitan Area.
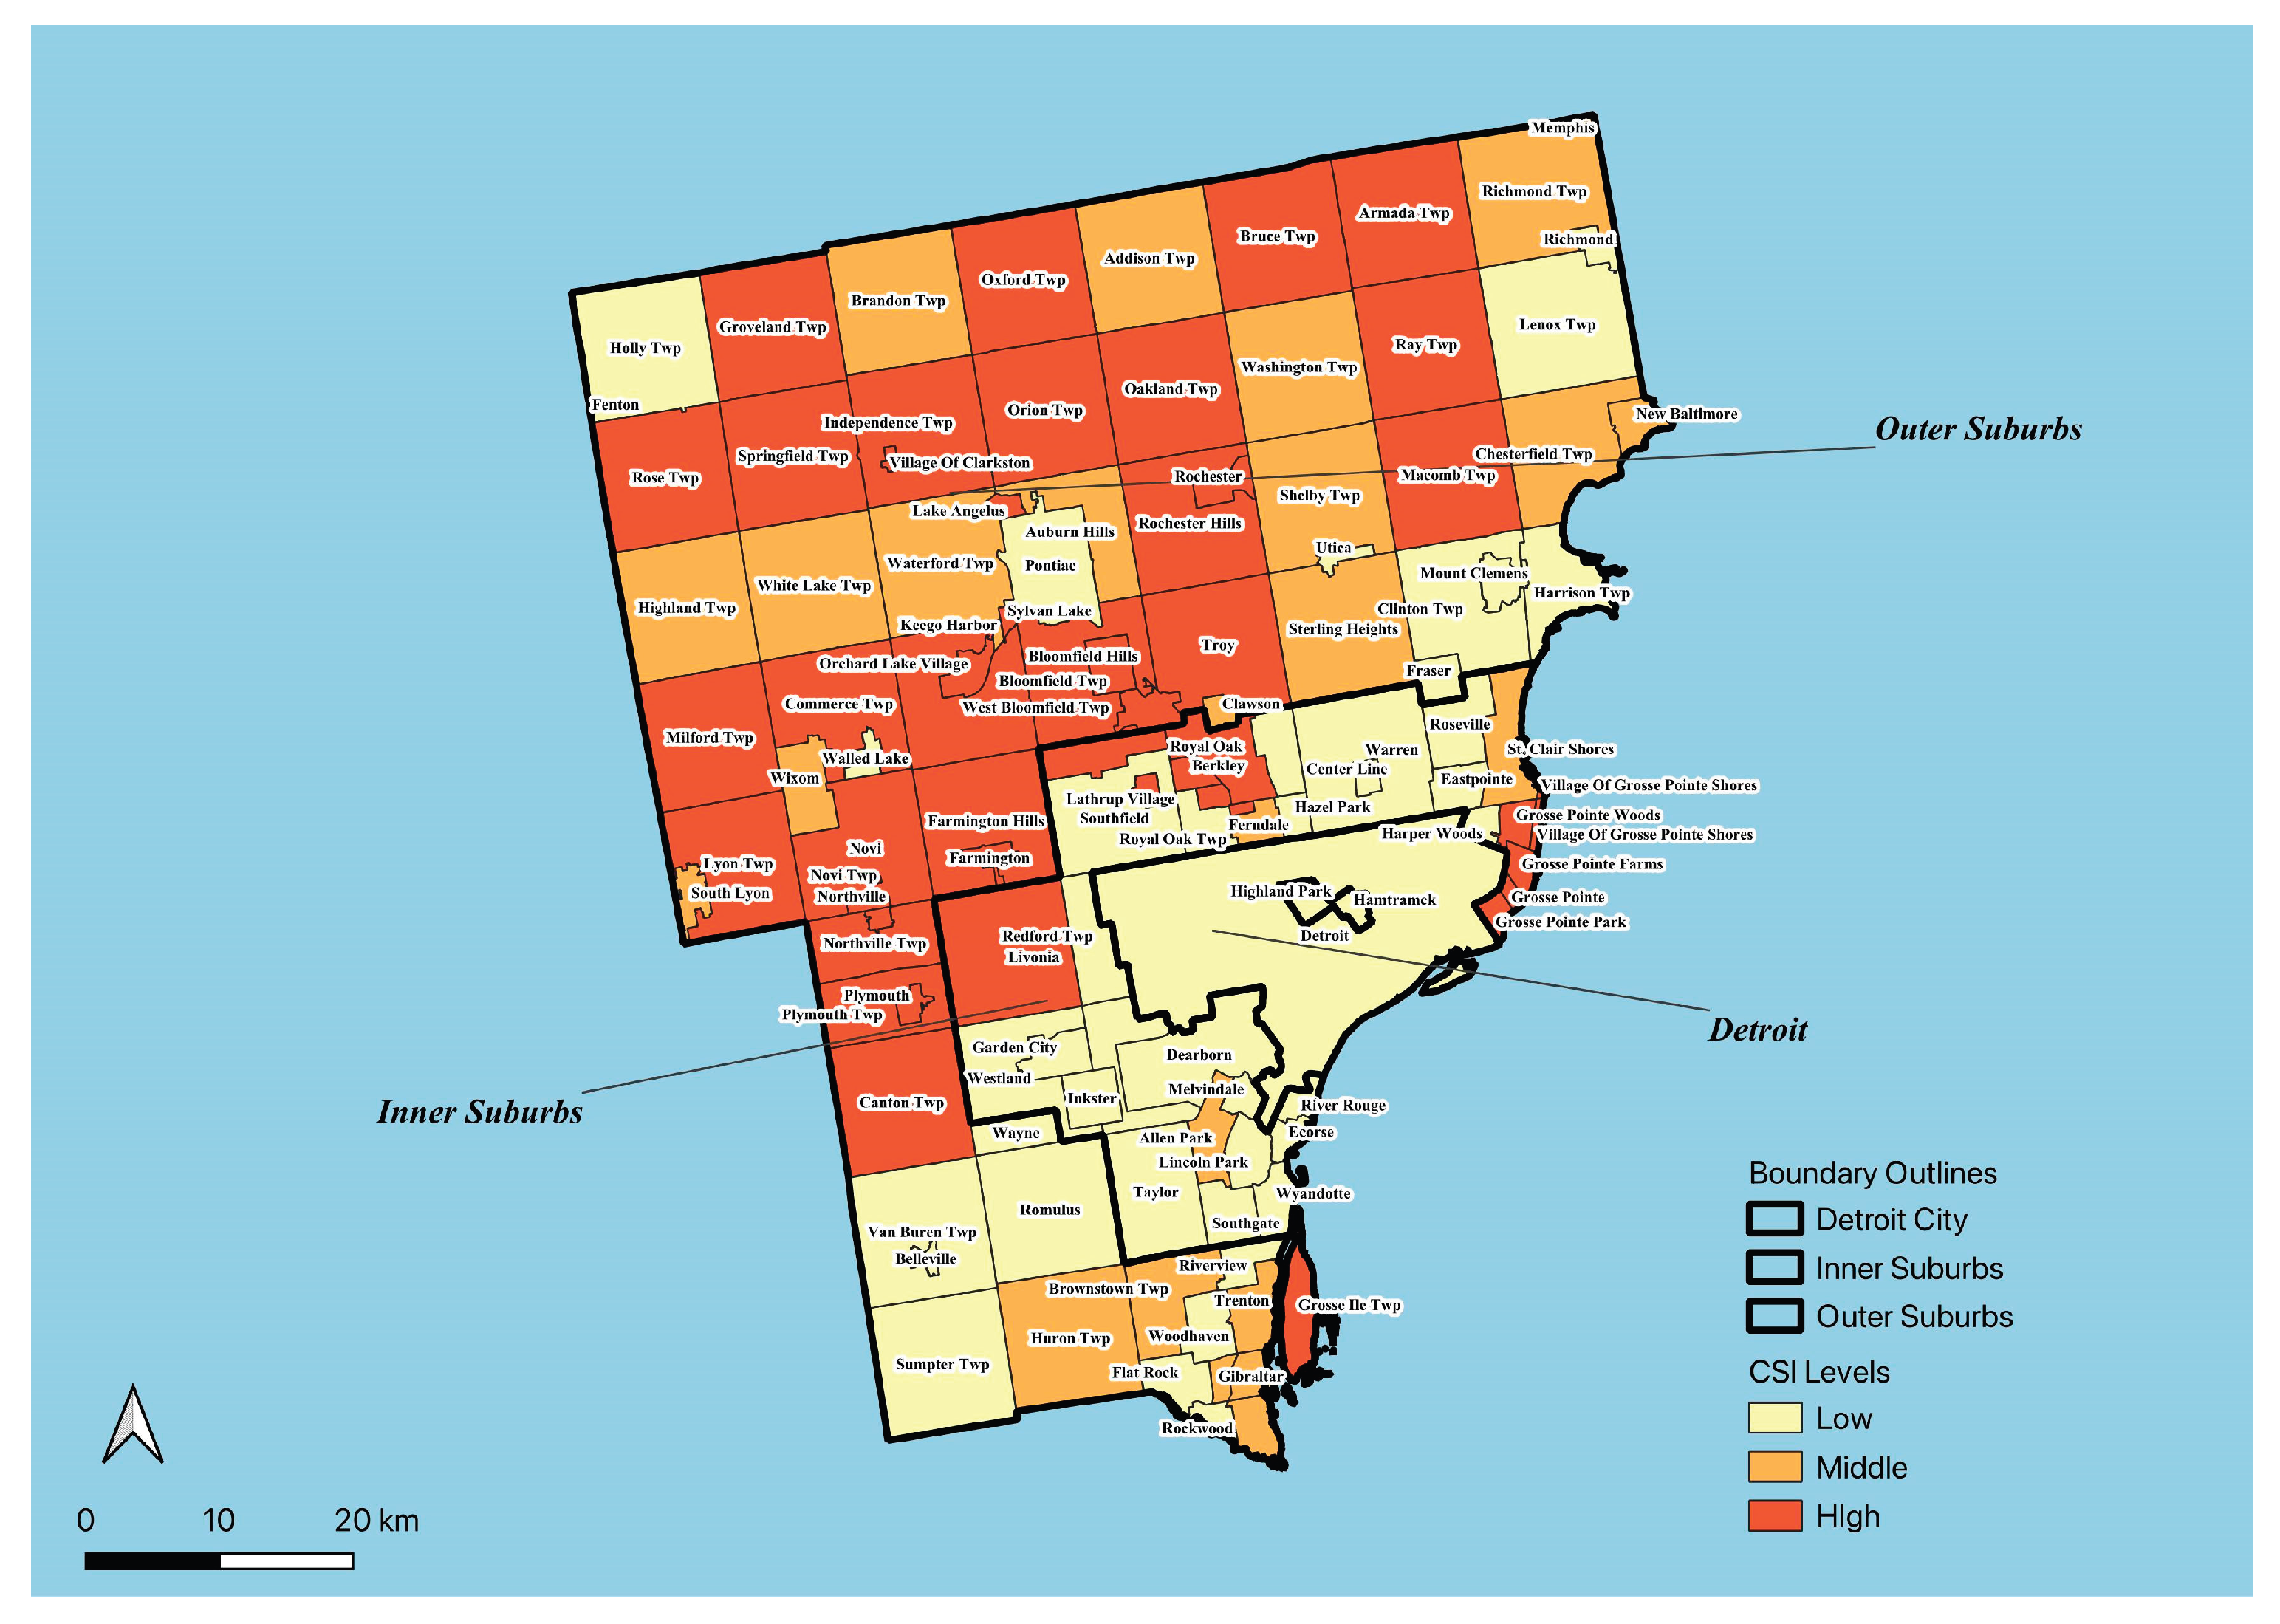
Figure 2.
Socioeconomic Transitions Across Detroit and Its Suburbs, 2010–2023.
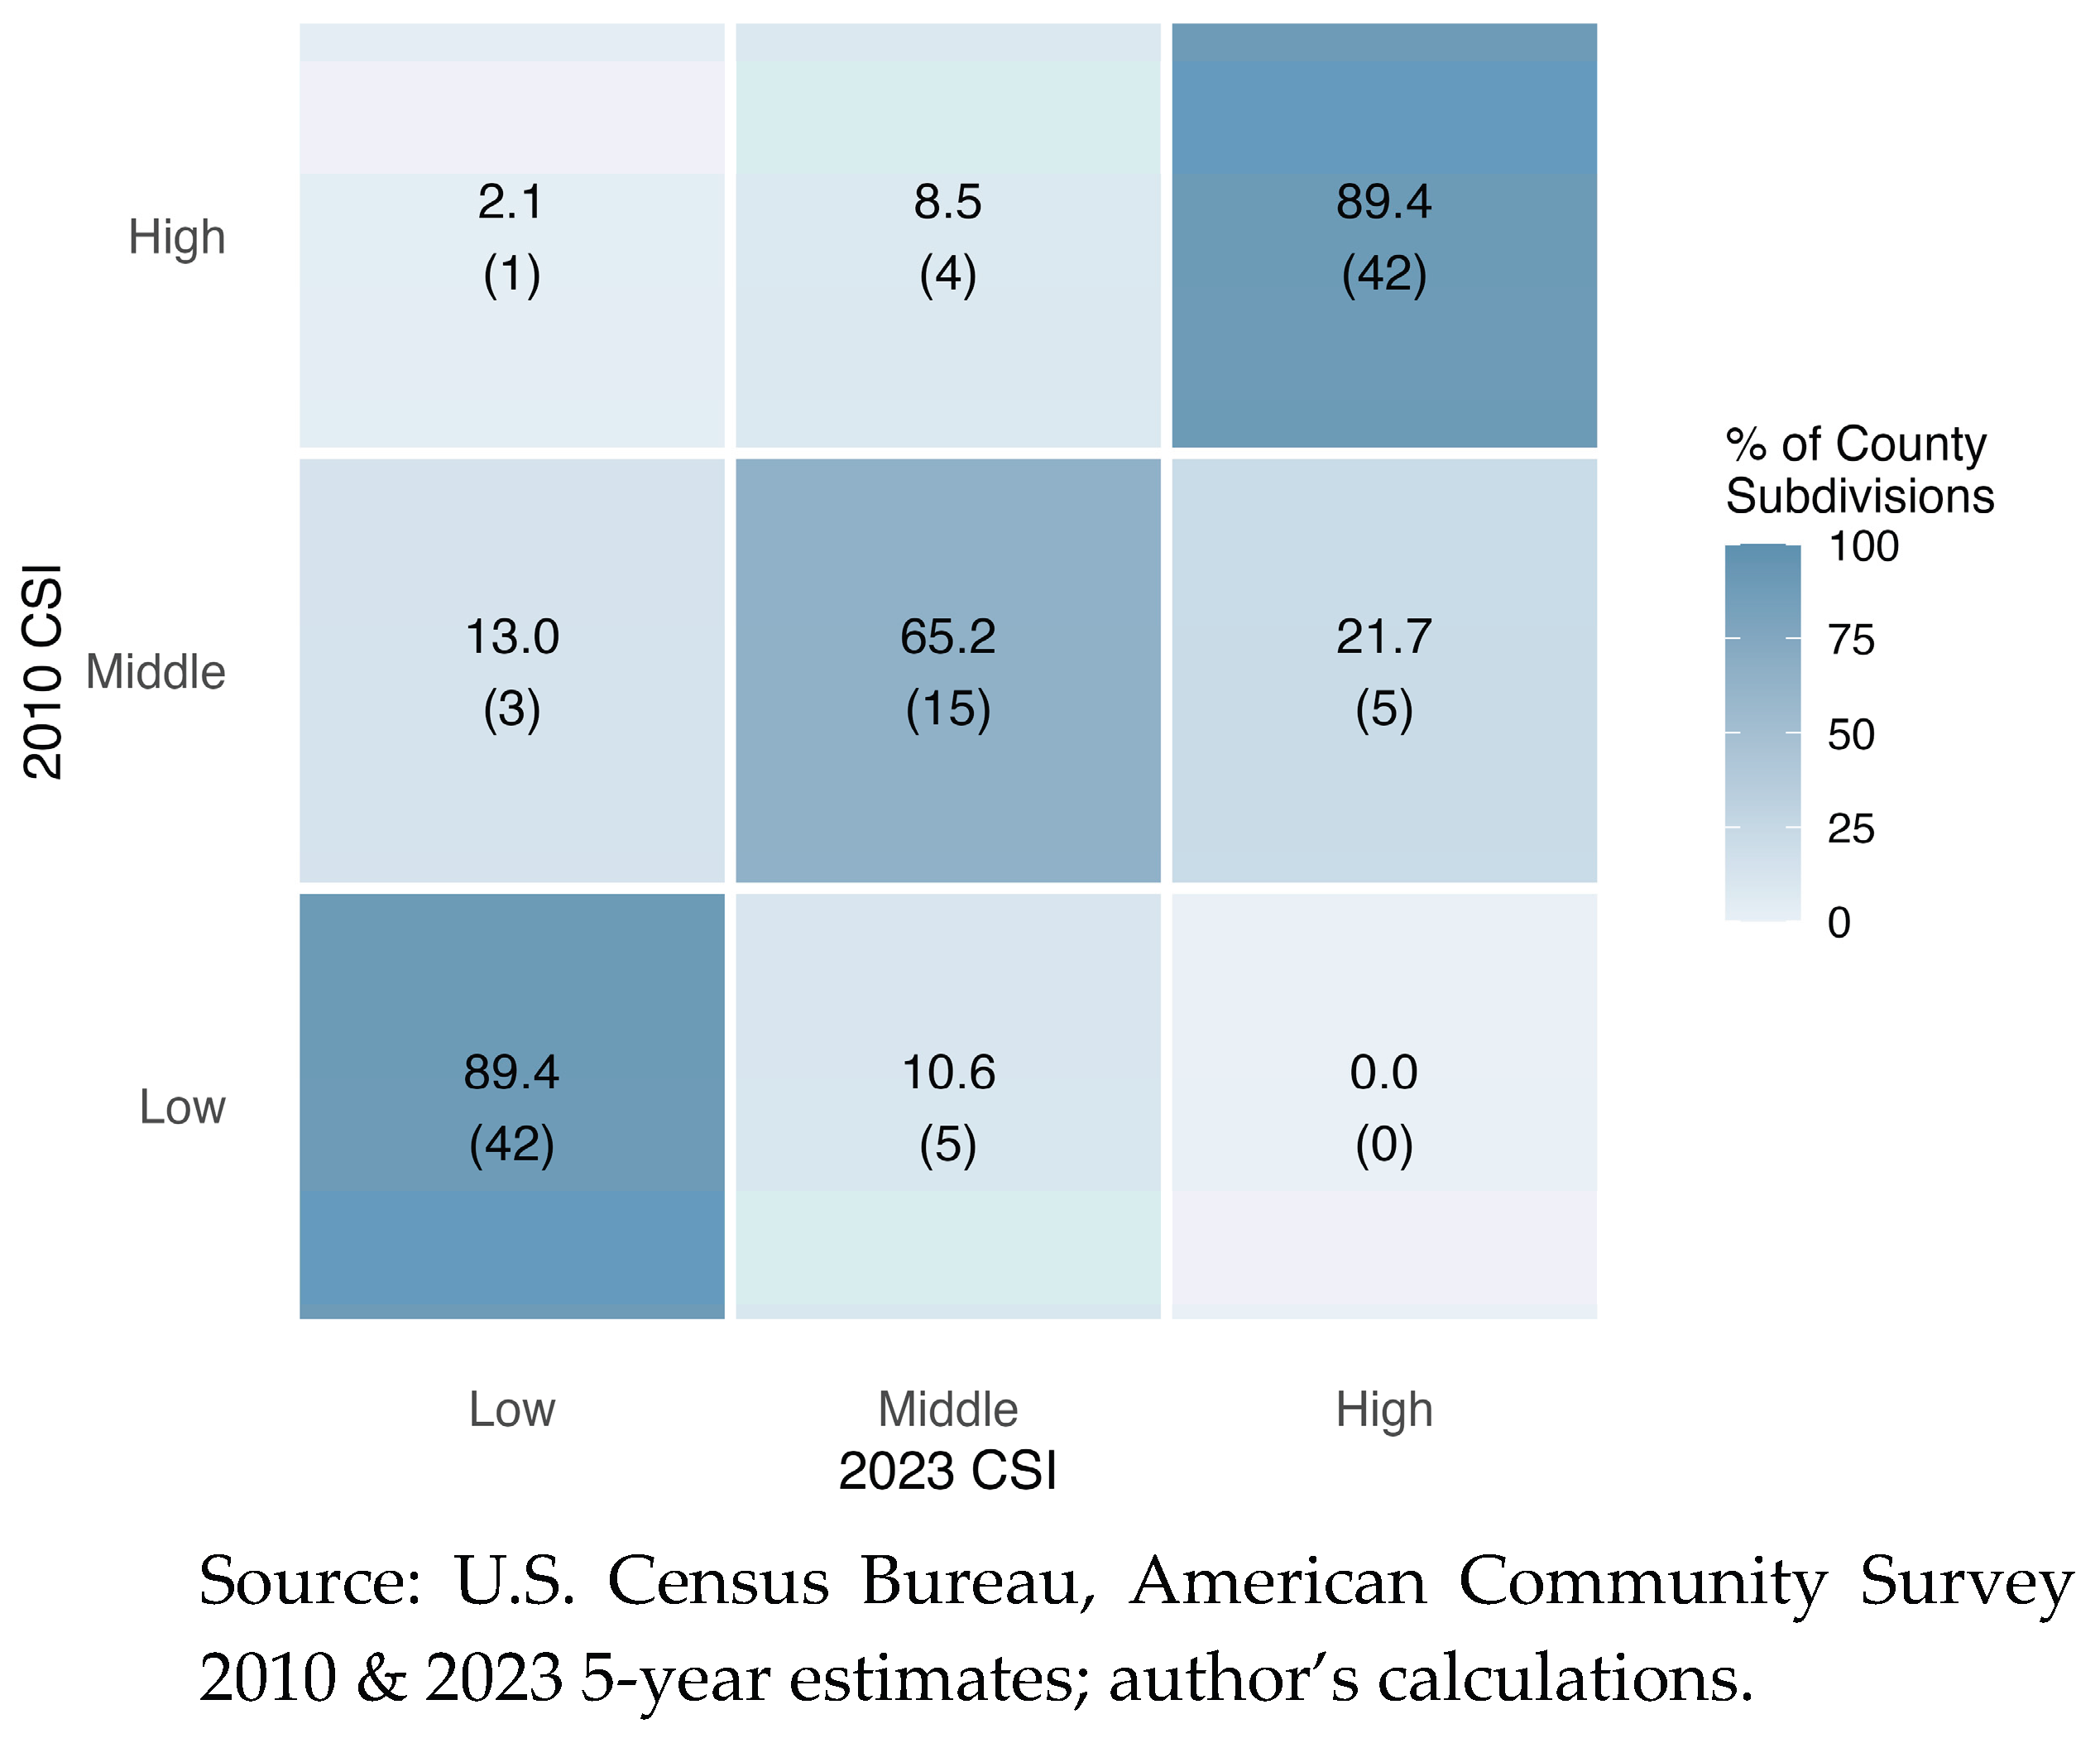
Figure 3.
Socioeconomic Changes by Suburban Ring in Metro Detroit, 2010–2023.
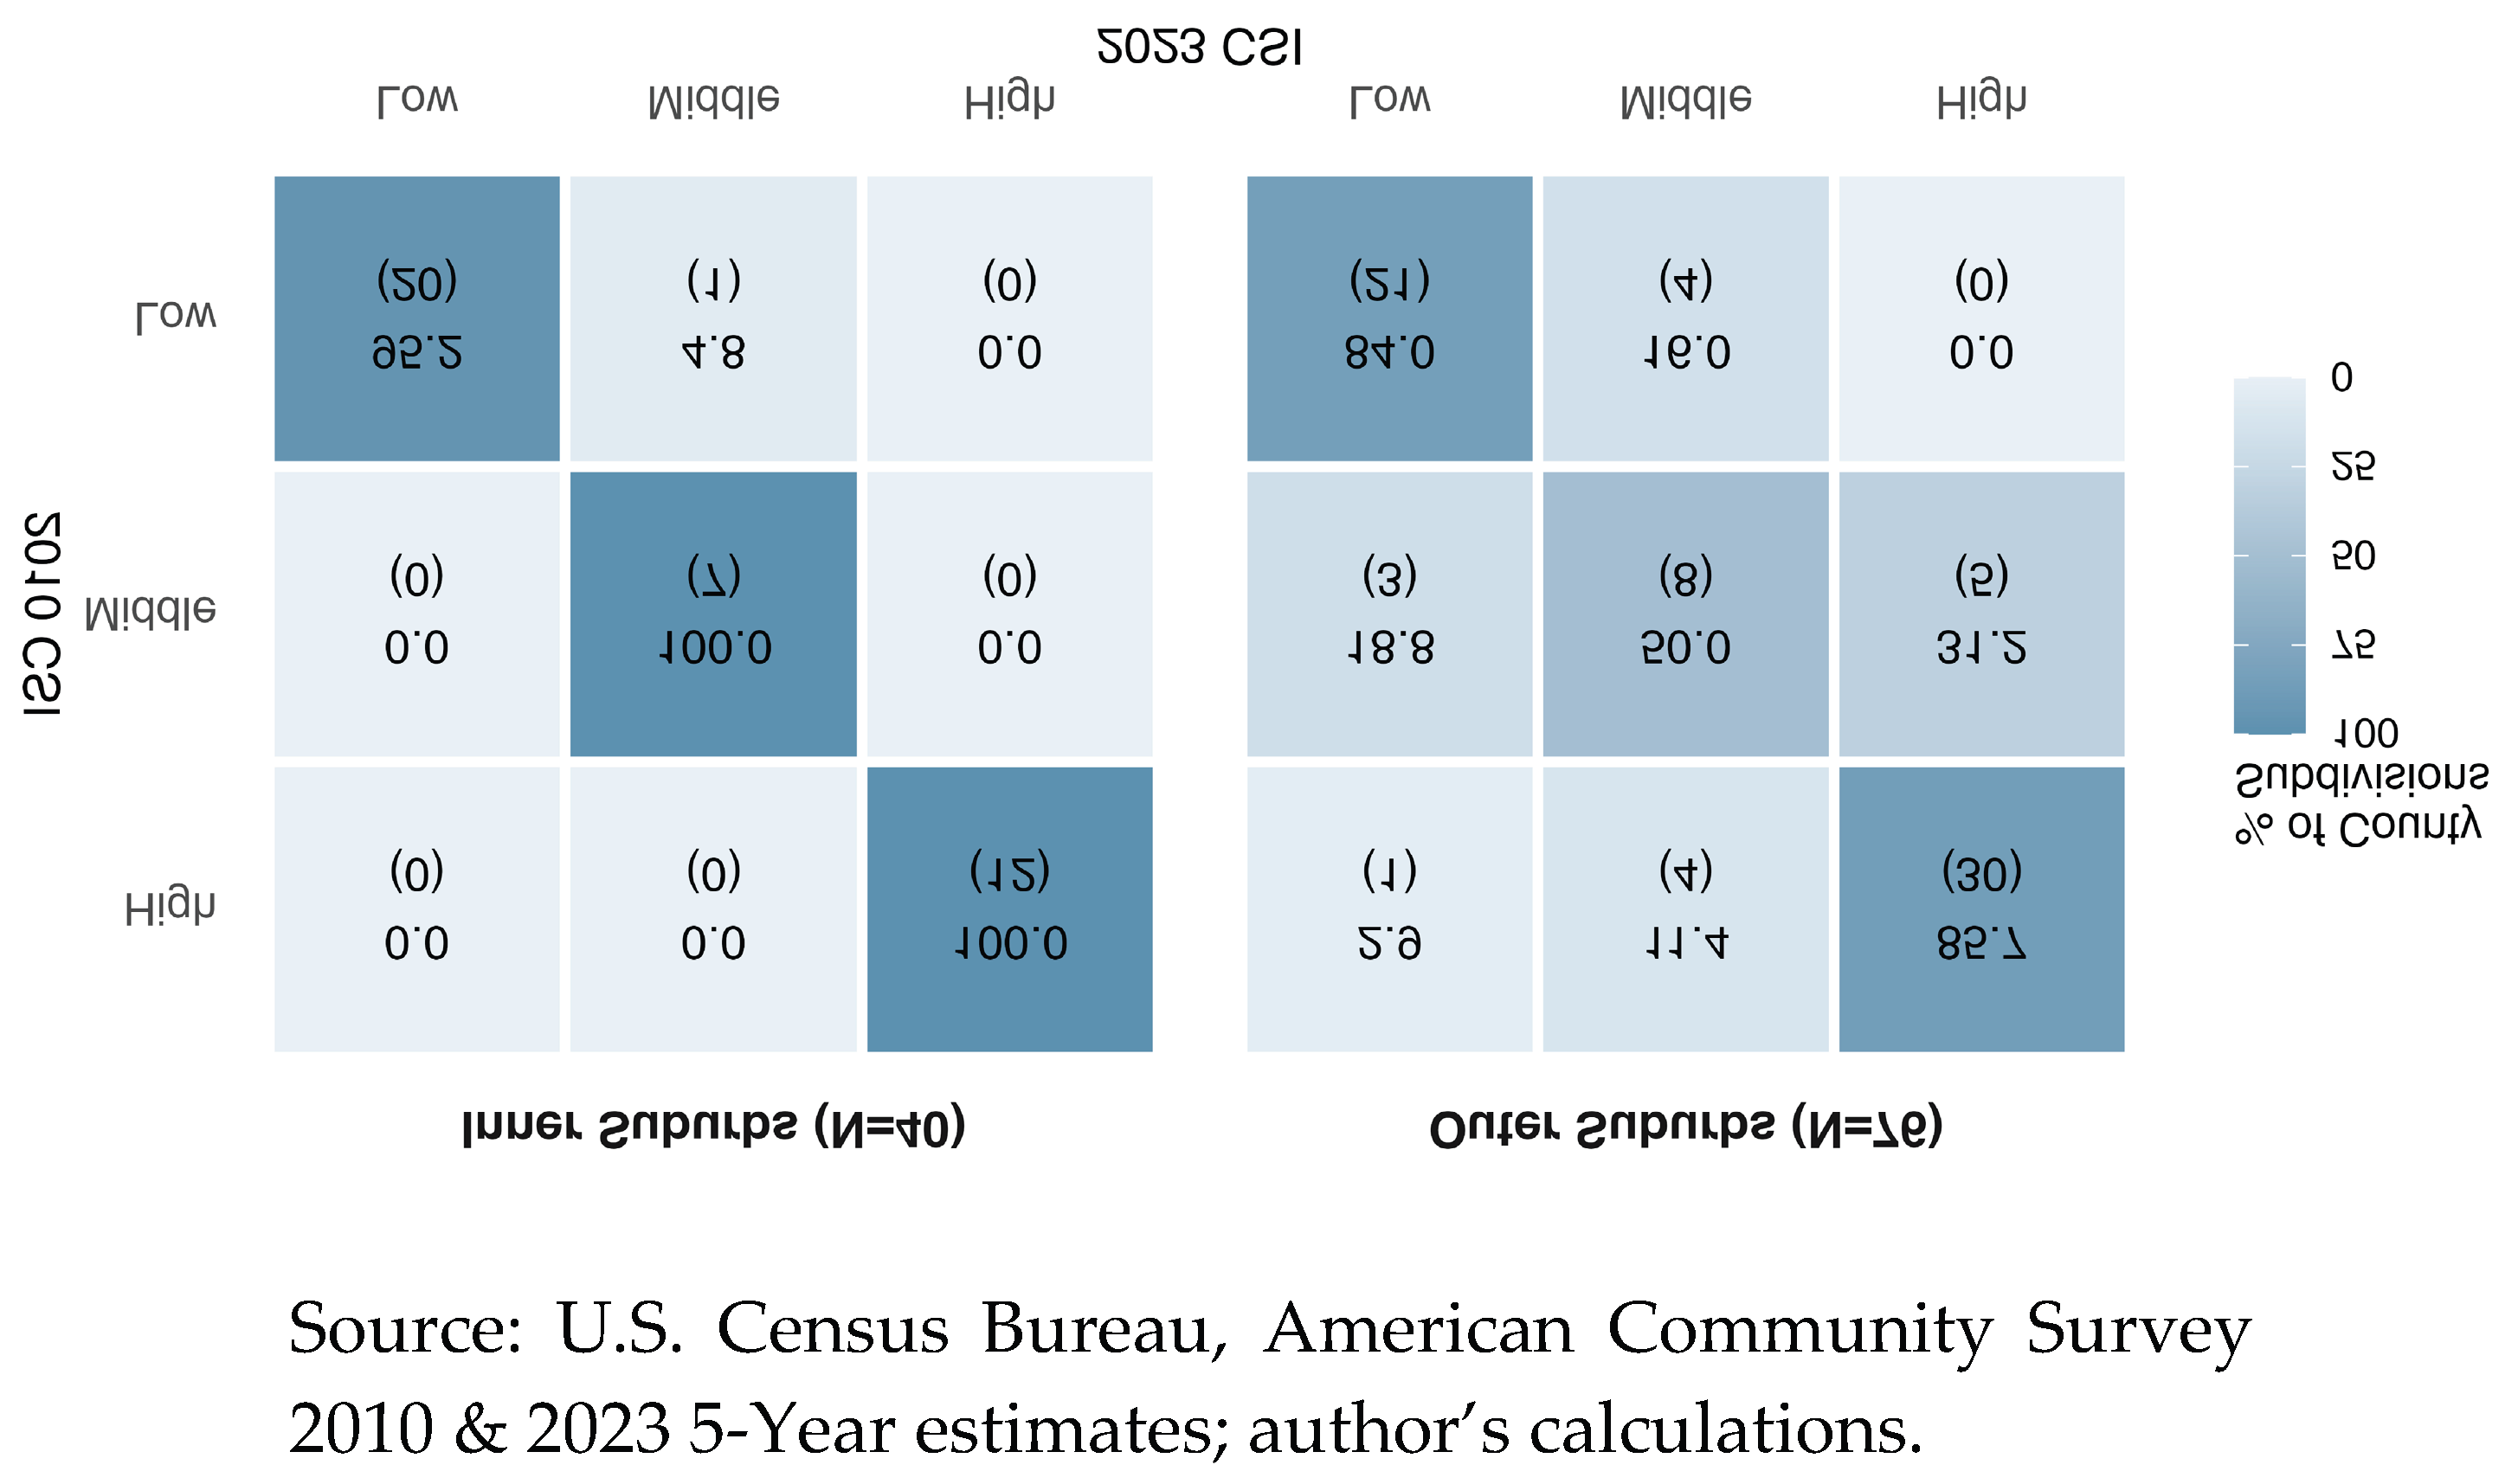
Figure 4.
Racial and Ethnic Distribution Across Detroit and Suburban SEP Levels.
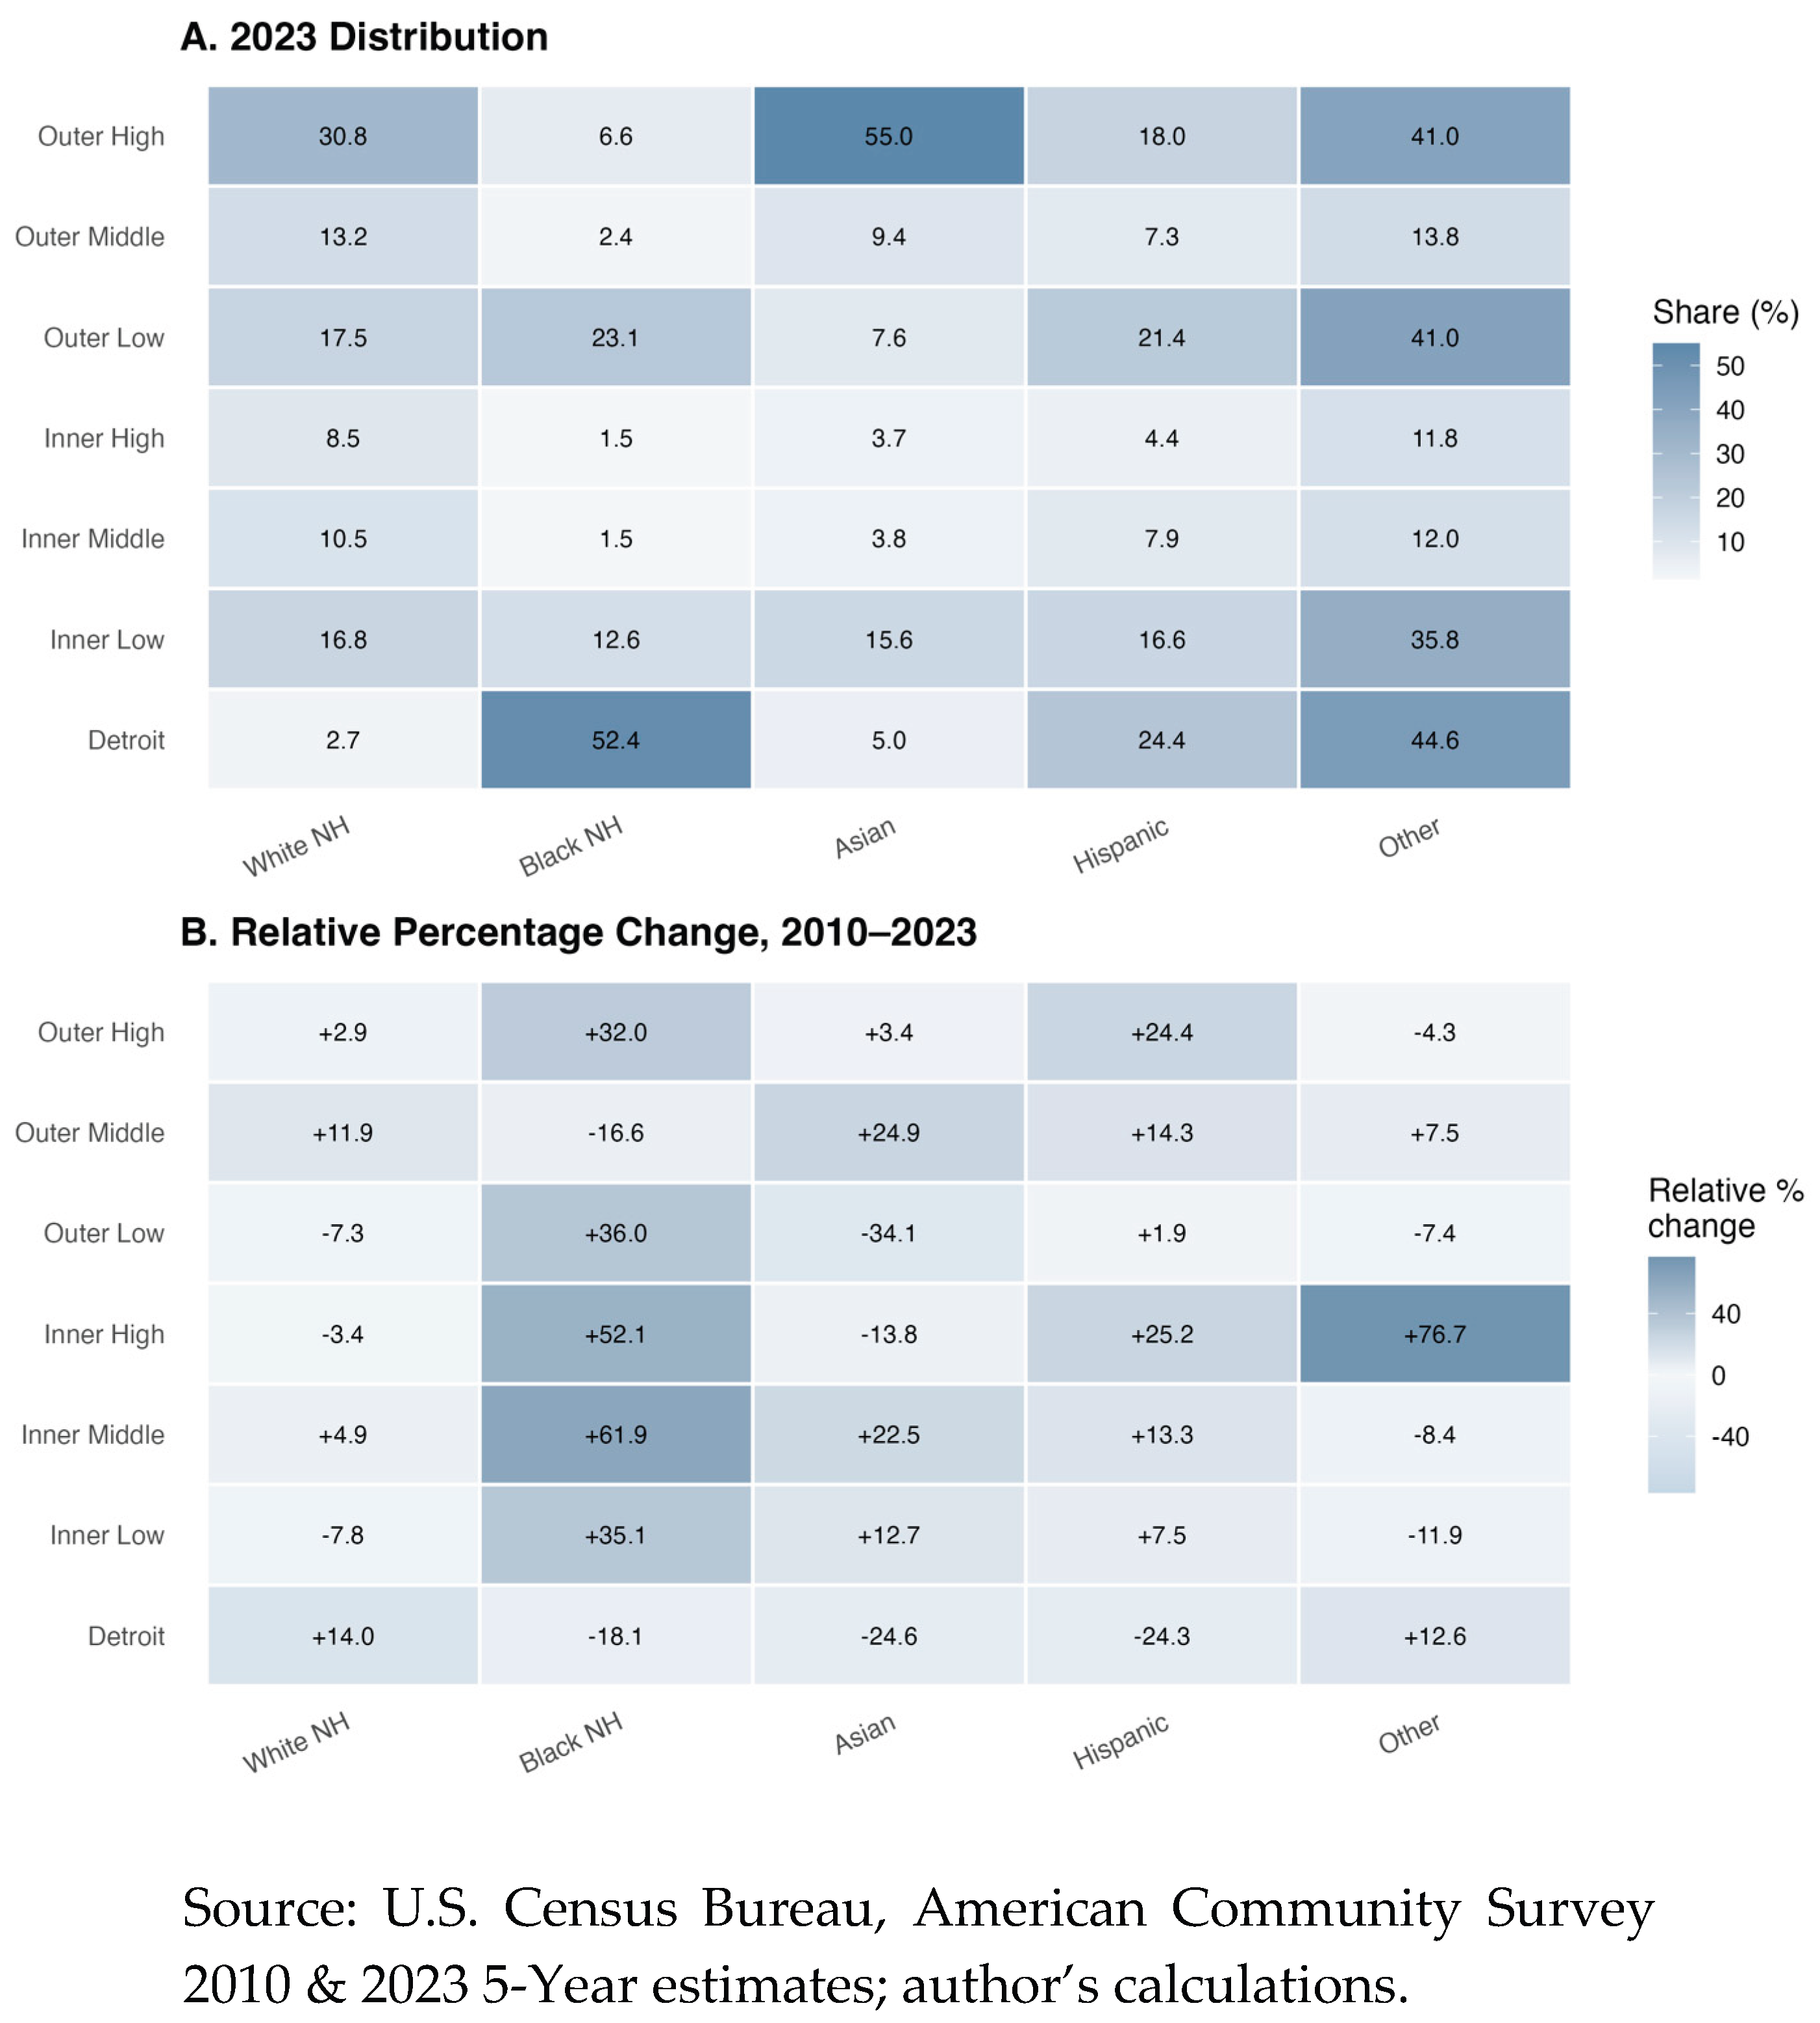
Figure 5.
Foreign-Born Population by Arrival Cohort Across Detroit and Suburban SEP Levels.
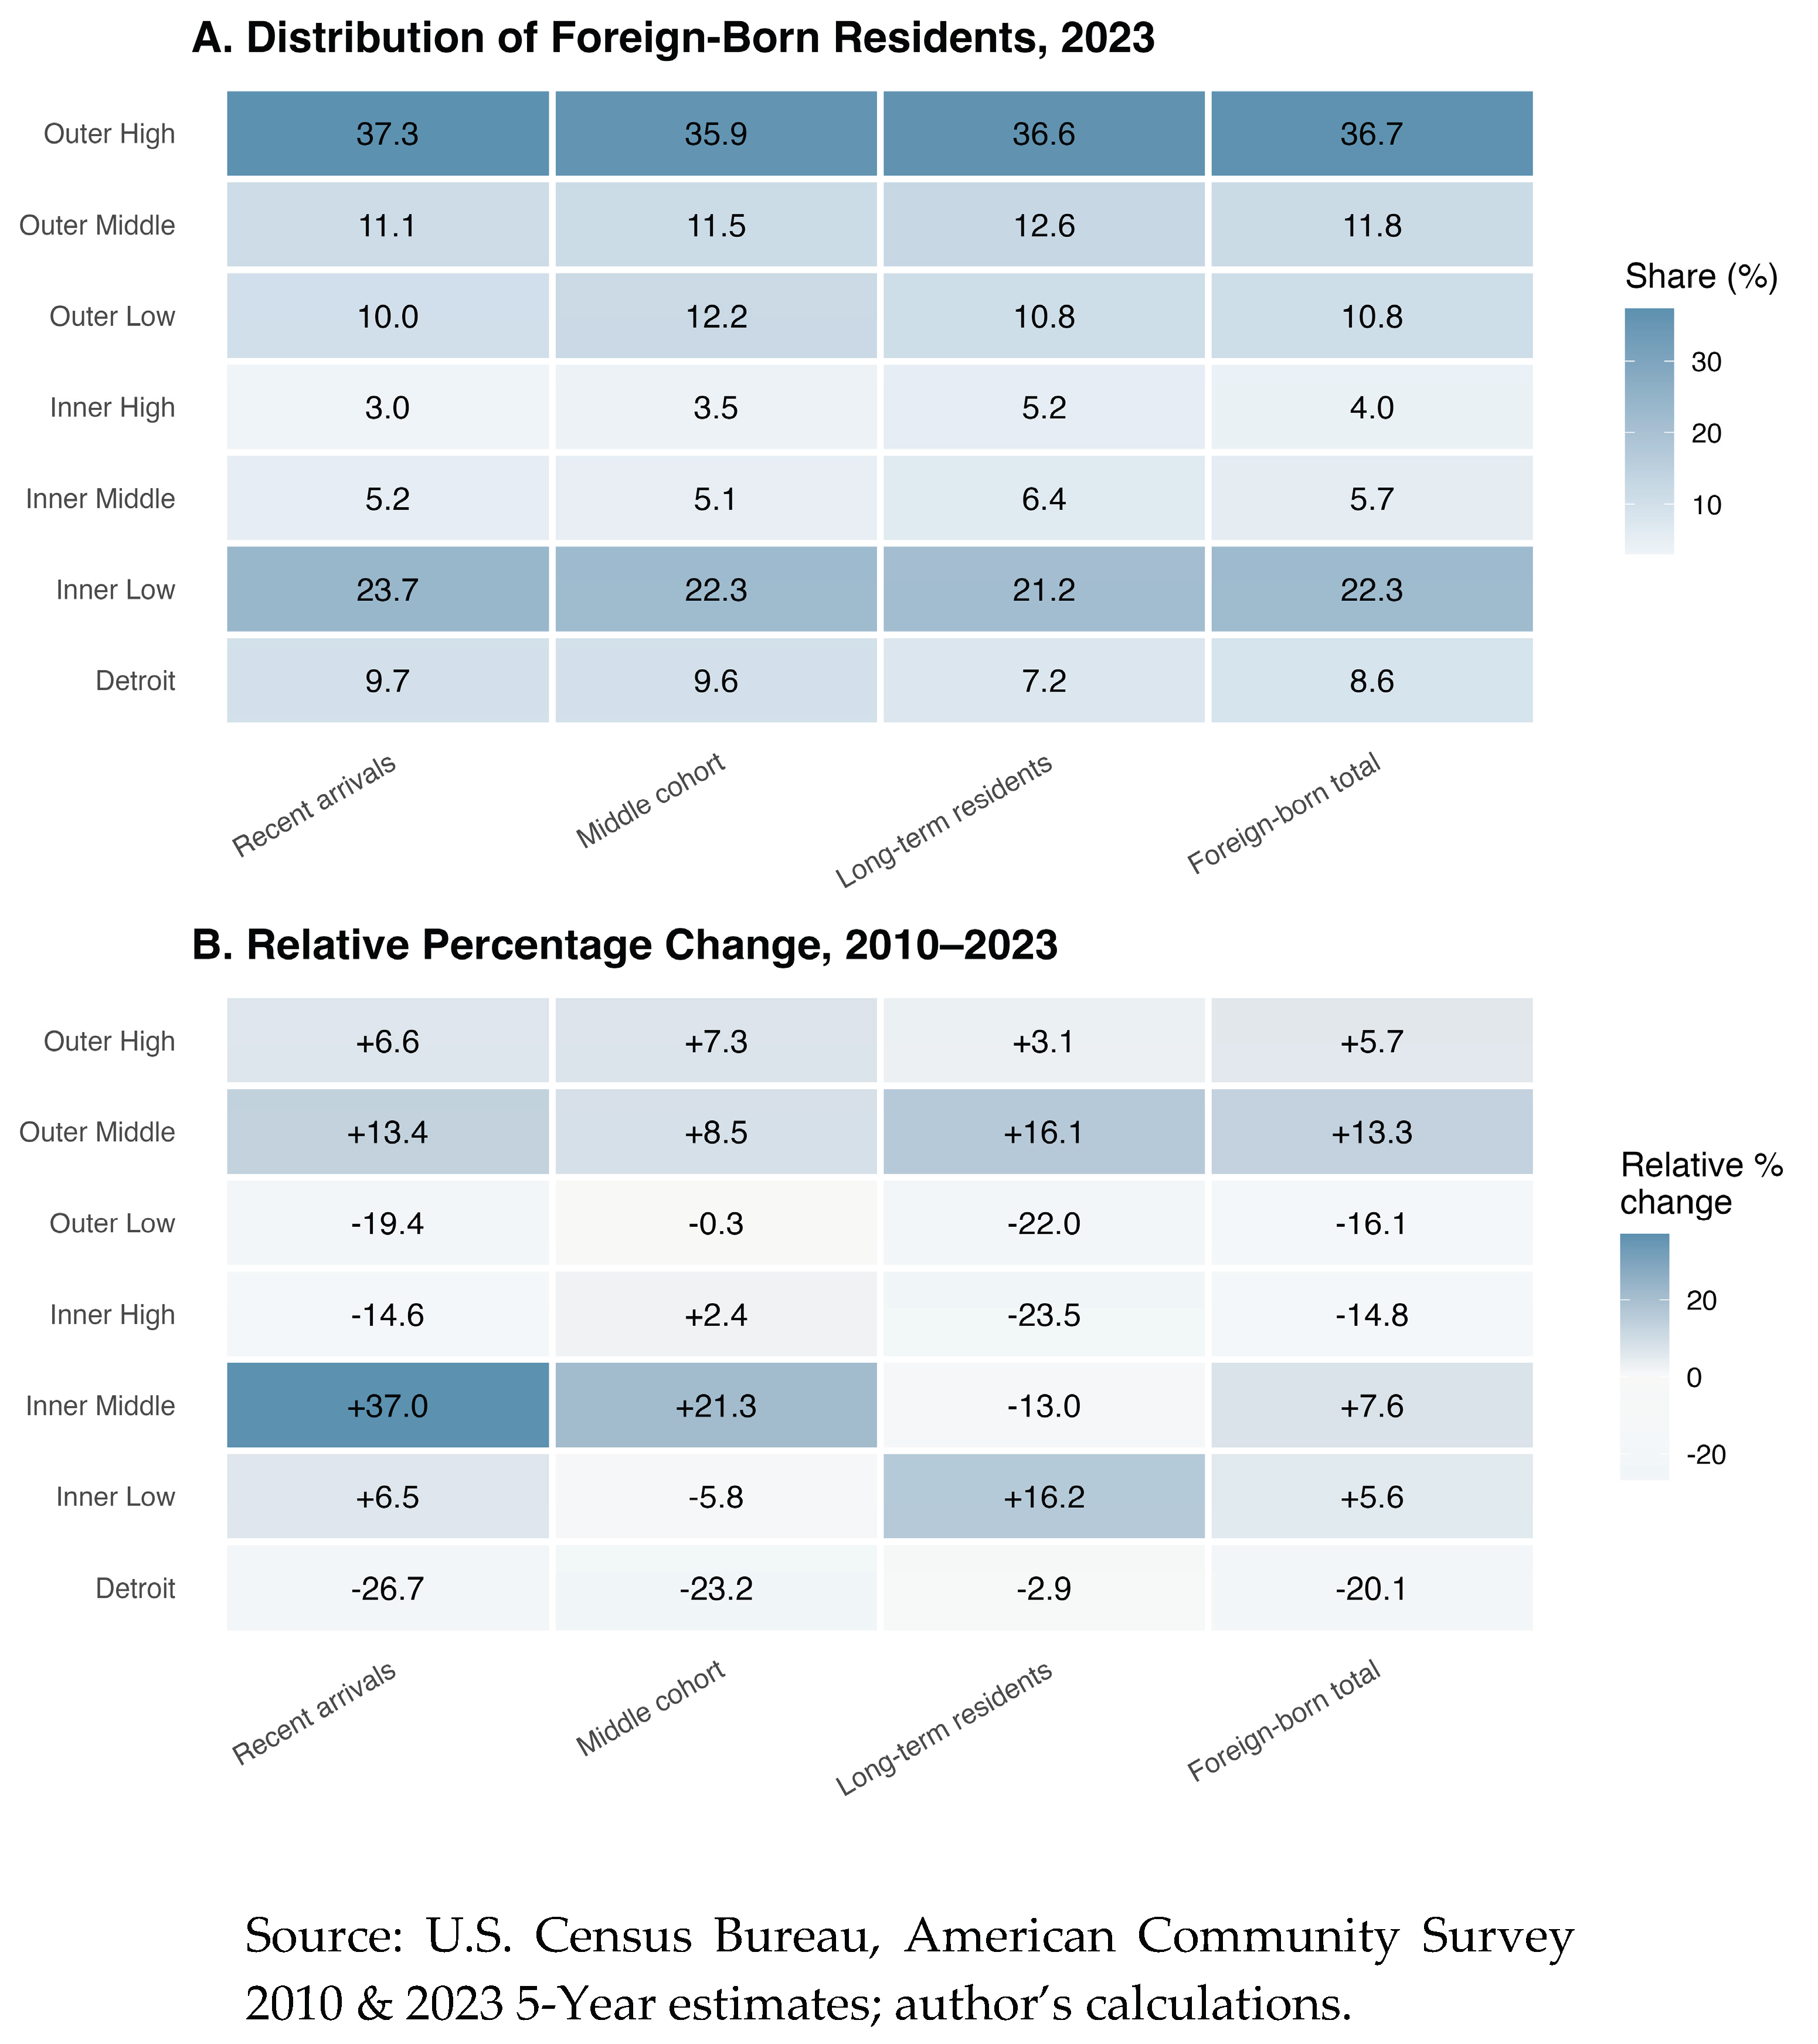
Figure 6.
Family and Household Characteristics Across Detroit and Suburban SEP Levels.
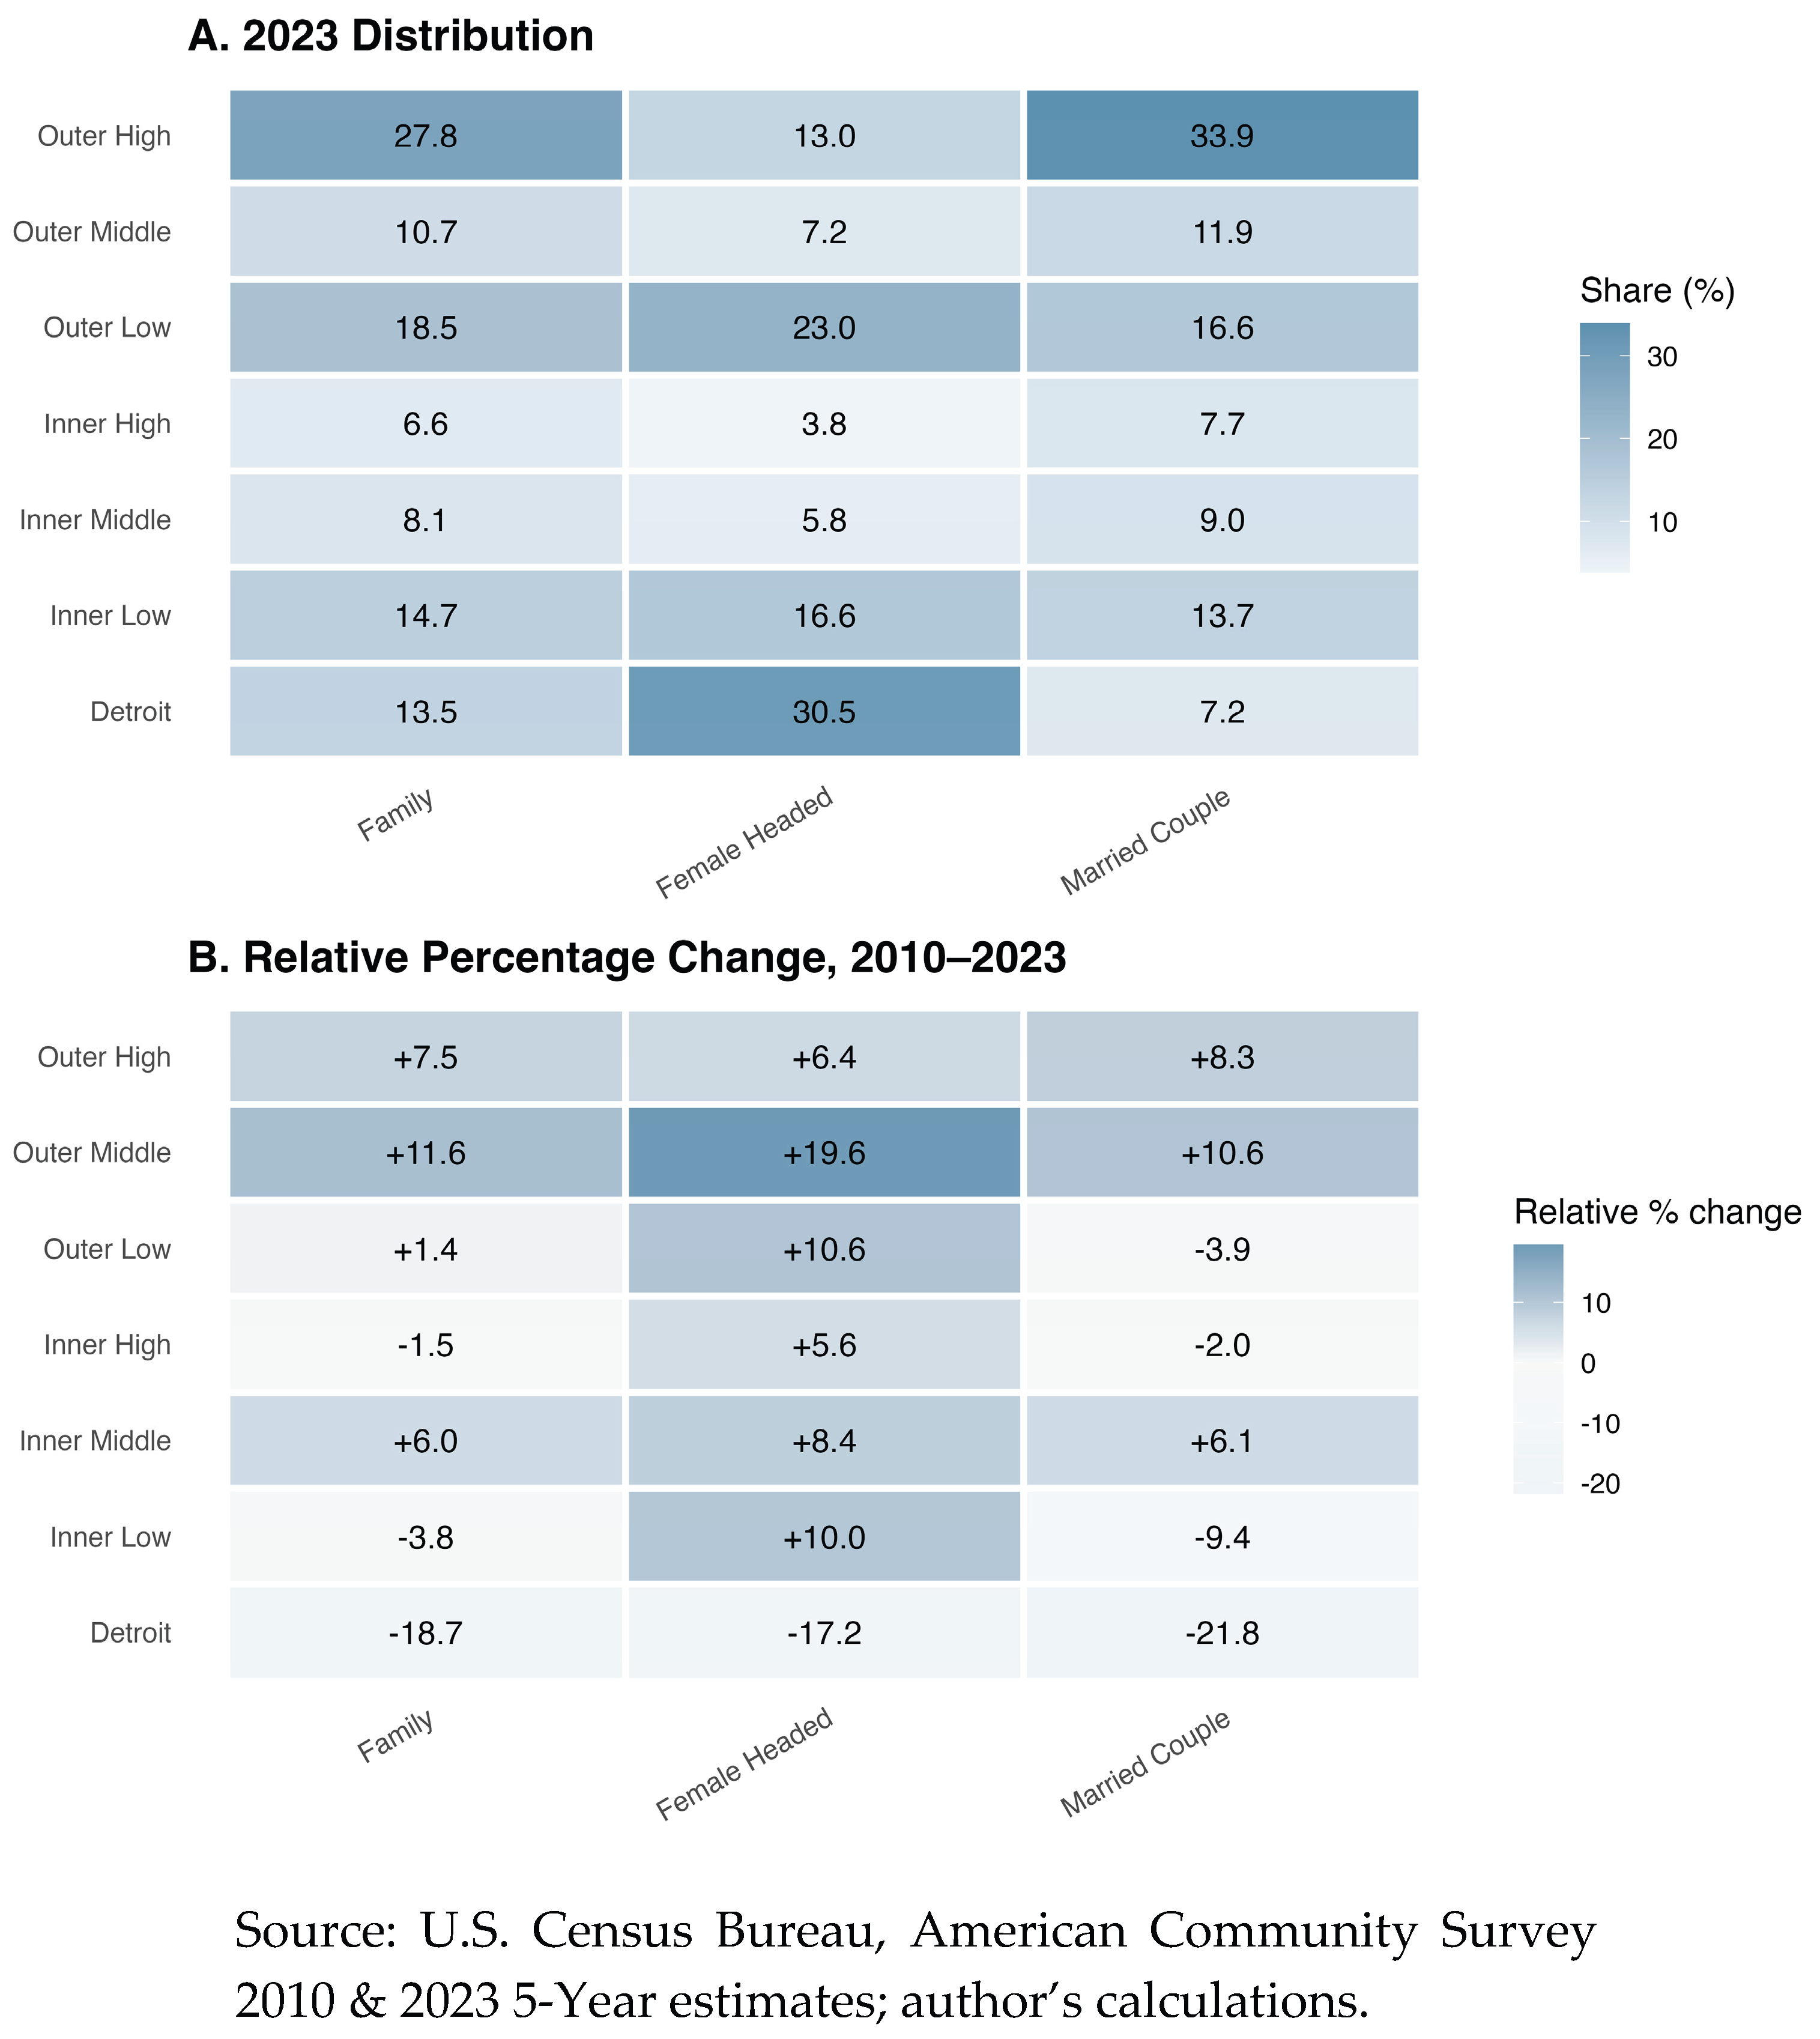

Table 1A.
Socioeconomic Indicators Used in the CSI, 2023.
| BA+ (%) | Unemployed (%) | Management (%) | Poverty (%) | No vehicle (%) | Owner-occupied (%) | Median HH income | Median home value | Median gross rent | |
| Detroit | |||||||||
| Detroit | 7.8 | 29.0 | 8.1 | 36.9 | 40.0 | 11.5 | $41,044 | $96,069 | $1,032 |
| Inner Suburbs | |||||||||
| Low | 9.7 | 17.1 | 10.9 | 22.4 | 16.2 | 14.3 | $56,376 | $144,826 | $1,097 |
| Middle | 8.2 | 5.2 | 8.9 | 4.2 | 4.6 | 9.3 | $84,908 | $240,168 | $1,139 |
| High | 10.9 | 4.0 | 10.1 | 2.2 | 3.1 | 7.8 | $139,627 | $431,320 | $1,335 |
| Total Inner Suburbs | 28.7 | 26.2 | 29.8 | 28.7 | 23.9 | 31.5 | $87,058 | $209,846 | $1,163 |
| Outer Suburbs | |||||||||
| Low | 12.9 | 20.1 | 15.0 | 18.7 | 19.8 | 18.1 | $68,052 | $194,162 | $1,065 |
| Middle | 9.4 | 8.3 | 10.1 | 6.4 | 5.7 | 11.1 | $92,292 | $295,750 | $1,190 |
| High | 41.2 | 16.4 | 37.0 | 9.2 | 10.6 | 27.8 | $125,331 | $393,718 | $1,406 |
| Total Outer Suburbs | 63.5 | 44.8 | 62.1 | 34.4 | 36.0 | 57.0 | $99,534 | $297,300 | $1,204 |
Source: U.S. Census Bureau, American Community Survey 2010 & 2023 5-Year estimates; author’s calculations.
Table 1B.
Percent Change in CSI Components, 2010–2023.
| BA+ (%) | Unemployed (%) | Management (%) | Poverty (%) | No vehicle (%) | Owner-occupied (%) | Median HH income | Median home value | Median gross rent | |
| Detroit | |||||||||
| Detroit | 1.4 | -6.5 | -6.1 | -17.3 | -10.5 | -15.7 | 39.6 | 18.5 | 34.5 |
| Inner Suburbs | |||||||||
| Low | -4.4 | 7.2 | -5.0 | 24.4 | -3.4 | -9.0 | 33.4 | 28.7 | 43.1 |
| Middle | 8.9 | -17.9 | 9.3 | 5.6 | -1.7 | 6.4 | 50.1 | 64.8 | 37.0 |
| High | -5.9 | -1.6 | -2.1 | 1.2 | -6.9 | -0.2 | 49.6 | 63.6 | 53.8 |
| Total Inner Suburbs | -1.6 | -0.2 | -0.1 | 19.2 | -3.6 | -2.7 | 44.9 | 45.1 | 45.3 |
| Outer Suburbs | |||||||||
| Low | -0.3 | 4.4 | 0.2 | 5.7 | 14.1 | 2.5 | 41.0 | 43.1 | 50.0 |
| Middle | 13.0 | -1.0 | 6.5 | 24.9 | 20.7 | 9.2 | 40.5 | 55.0 | 55.3 |
| High | -1.6 | 8.7 | -0.2 | 9.2 | 25.3 | 6.1 | 43.8 | 55.6 | 55.0 |
| Total Outer Suburbs | 0.6 | 4.9 | 0.9 | 9.8 | 18.2 | 5.5 | 42.5 | 45.8 | 53.0 |
Source: U.S. Census Bureau, American Community Survey 2010 & 2023 5-Year estimates; author’s calculations.
Disclaimer/Publisher’s Note: The statements, opinions and data contained in all publications are solely those of the individual author(s) and contributor(s) and not of MDPI and/or the editor(s). MDPI and/or the editor(s) disclaim responsibility for any injury to people or property resulting from any ideas, methods, instructions or products referred to in the content. |
© 2026 by the authors. Licensee MDPI, Basel, Switzerland. This article is an open access article distributed under the terms and conditions of the Creative Commons Attribution (CC BY) license (http://creativecommons.org/licenses/by/4.0/).
Copyright: This open access article is published under a Creative Commons CC BY 4.0 license, which permit the free download, distribution, and reuse, provided that the author and preprint are cited in any reuse.