
Submitted:
07 July 2026
Posted:
08 July 2026
You are already at the latest version
Abstract
Accurate monitoring of forest carbon stocks represents a critical prerequisite for achieving carbon neutrality. However, conventional remote sensing‑based estimation methods frequently overlook forest heterogeneity, causing systematic overestimation or underestimation. To address this gap, we propose a novel forest carbon stock esti-mation framework that integrates two complementary strategies: (1) forest type‑specific modeling to account for forest heterogeneity, and (2) hyperparameter op-timization to enhance Random Forest model performance. Using ground‑measured carbon stocks and a CCDC‑derived forest vegetation classification map for Hangzhou City, China, we built forest‑type‑specific Random Forest models based on ICESat‑2 canopy height metrics and optimized each model via hyperparameter tuning. The re-sults show that the 70th-90th percentiles and the mean canopy height are relatively highly correlated with carbon stock. Forest‑type‑specific modeling improves estima-tion accuracy, yielding R² gains of 0.10–0.17 and reduced RMSE by 2.28–7.43 Mg C/ha over the non‑stratified model. Integrating forest classification and hyperparameter op-timization strategies improved model R² by 0.16–0.23 and lowered RMSE by 3.05–8.20 Mg C/ha. Overall, this study demonstrates that accounting for forest heterogeneity and applying hyperparameter optimization can significantly enhance the accuracy of for-est carbon stock estimation.
Keywords:
carbon stock
; forest heterogeneity
; ICESat-2
; CCDC
; hyperparameter optimization
1. Introduction
Forests constitute the largest carbon pool in terrestrial ecosystems and play an indispensable role in the global carbon cycle [1,2]. Accurate monitoring of forest carbon stocks is therefore fundamental to understanding carbon dynamics and supporting climate change mitigation efforts [3]. In the context of global climate change and carbon neutrality goals, forest ecosystems have become a focal point in both research and policy, underscoring the urgent need for accurate and efficient forest monitoring methods [4]. Traditional manual survey methods are labor-intensive and time-consuming, and suffer from limited temporal continuity and timeliness. Remote sensing technology provides an efficient means for rapid monitoring of forest carbon stocks at large scales [5].
Passive optical remote sensing is limited in its ability to capture forest vertical structure and is prone to saturation issues [6]. The advent of Light Detection and Ranging (LiDAR) remote sensing has effectively addressed these limitations, as it enables high-accuracy acquisition of three-dimensional forest structure information [7]. Depending on the platform, LiDAR can be categorized into three types: terrestrial, airborne, and spaceborne. Terrestrial LiDAR, based on ground stations or mobile platforms, focuses on high-precision local-scale observations [8,9], but its spatial coverage is limited. Airborne LiDAR, mounted on unmanned aerial vehicles or aircraft, enables rapid data acquisition over medium-to-large areas [10]; however, its operational capability is constrained by weather and terrain conditions, making it difficult to achieve consistent periodic observations. In contrast, spaceborne LiDAR exhibits superior performance in multi-scale and multi-temporal carbon stock estimation, owing to its broad observational coverage, high data stability, and excellent spatiotemporal consistency [11,12].
The Ice, Cloud, and Land Elevation Satellite-2 (ICESat-2) employs micropulse, multibeam, and photon-counting LiDAR technologies, enabling sub-meter measurement of tree canopy height [13,14,15]. Leveraging this technological advantage, numerous studies have utilized ICESat-2 data to estimate forest canopy height [16], aboveground biomass (AGB) [17] or carbon stock [18]. Early studies primarily focused on evaluating the feasibility of ICESat-2 photon-counting data for AGB estimation. For example, Narine et al. [19] demonstrated that ICESat-2 canopy height metrics can be used for AGB estimation and showed the feasibility of generating a 30 m AGB map by integrating Landsat 8 data. Duncanson et al. [20] compared ICESat-2, the Global Ecosystem Dynamics Investigation (GEDI), and the NASA-ISRO Synthetic Aperture Radar (NISAR) for AGB estimation and found that ICESat-2 performed reasonably over short, open canopies.
With the growing availability of ICESat-2 data, research priorities have shifted toward data quality control, multi-source data integration, and algorithmic refinement [12,21,22]. First, ICESat-2 data quality is influenced by multiple factors, including acquisition time (diurnal cycle), beam strength, snow cover, seasonal canopy conditions, and terrain slope, which have been systematically investigated [23]. For example, Varvia et al. [24] comprehensively evaluated the effects of diurnal cycle, beam strength, and snow cover, and found that nighttime strong-beam data under snow-free conditions yielded the best performance. Zhou et al. [25] found that leaf-off ICESat-2 observations unexpectedly improved AGB estimation accuracy and model transferability. Second, multi-source data fusion has become a prevailing paradigm, where ICESat-2 provides vertical canopy structure information, while optical and radar data complement spectral characteristics and spatial continuity [26]. For example, Guerra-Hernández et al. [27] integrated ICESat-2 with Sentinel-1/2, ALOS-2/PALSAR-2, and topographic data for AGB mapping. Duncanson et al. [22] used ICESat-2 to fill data gaps in GEDI coverage over high-latitude boreal regions, and combined with harmonized Landsat and Sentinel-2 data, produced a global 30 m AGB product for 2020. Third, methods have evolved from single-parameter regressions to machine learning, such as ensemble learning and deep learning, further supported by error-in-variables upscaling and spatial residual correction to enhance large-scale extrapolation. For example, Varvia et al. [28] proposed a hierarchical hybrid inference method that accounts for systematic modeling error propagation, achieving 2.9% relative standard error. Zhen et al. [29] combined individual-tree and area-based approaches with Random Forest (RF) and Empirical Bayesian Kriging (EBK) for spatial residual correction to upscale AGB from tree to regional scales.
Different forest communities exhibit significant variation in species composition and diversity, which considerably affect carbon content and AGB [30]. A recent study demonstrated that forest-type-specific AGB models can substantially improve estimation accuracy, highlighting the potential of forest type classification for enhancing AGB estimates [31]. However, the effectiveness of combining ICESat-2 LiDAR data with forest type stratification for AGB estimation remains unclear. Even with similar canopy height characteristics, carbon stocks may differ markedly among forest communities; without considering forest heterogeneity, estimation results are prone to systematic overestimation or underestimation. To address this gap, we propose a carbon stock estimation framework that integrates forest classification and hyperparameter optimization strategies, using ICESat-2 LiDAR data over Hangzhou, Zhejiang Province (Figure 1). This study aims to address three specific scientific questions: (i) Which canopy height metrics are more strongly correlated with forest carbon stock? (ii) Do forest-type-specific models improve carbon stock estimation accuracy over a non-stratified model? (iii) Can hyperparameter optimization significantly enhance the predictive performance, and how does it interact synergistically with forest classification?
2. Materials and Methods
2.1. Study Area
Hangzhou, the capital of Zhejiang Province, is situated downstream of the Qiantang River and at the southern end of the Beijing–Hangzhou Grand Canal. The city lies at 29°11′–30°34′ N and 118°20′–120°37′ E, with a total area of 16,850 km². It comprises ten districts (Shangcheng, Gongshu, Xihu, Binjiang, Xiaoshan, Yuhang, Linping, Qiantang, Fuyang, and Lin’an), two counties (Tonglu and Chun’an), and one county-level city (Jiande) (Figure 2). The terrain is higher in the west than in the east, with hills and mountains accounting for 65.6% of the total land area. The forest coverage rate is 65.74%, the highest among provincial capitals in China. Hangzhou has a subtropical monsoon climate, with an annual mean temperature of 17.5–17.8 °C and an annual precipitation of approximately 1,139–1,454 mm. The regional vegetation in Hangzhou is subtropical evergreen broadleaved forest. However, the complex topography with pronounced elevational gradients supports a variety of communities, including evergreen broadleaved, deciduous broadleaved, coniferous, mixed coniferous–broadleaved, and bamboo forests. Dominant tree species include Schima superba, Castanopsis carlesii, Quercus glauca, Cinnamomum subavenium, Castanopsis sclerophylla, and Lithocarpus glaber. With its rich forest types and strong carbon sink function, Hangzhou is ideal for carbon stock estimation that accounts for forest heterogeneity.
2.2. ICESat-2 Data
ICESat-2 was launched in September 2018, equipped with the Advanced Topographic Laser Altimeter System (ATLAS). ATLAS emits a total of six laser beams. These beams are arranged in parallel along the track direction in three groups. Each group consists of one strong beam and one weak beam. ICESat-2 provides standard data products at four levels and 21 types, all stored in HDF5 format and named ATL01 to ATL21. ATL08 (land and vegetation height data) provides information such as latitude, longitude, canopy height metrics, terrain slope, and canopy height uncertainty for each 100-m segment along the track (Table 1). One important distinction of these canopy height metrics compared to those derived from other LiDAR systems (e.g., LVIS or GEDI) is that they are relative heights (RH) above the ground surface [14].
We used the ATL08 from July 2019 to September 2019 to correspond with the time period of the forest ground survey. ATL08 can be downloaded free from the National Snow and Ice Data Center in the United States (https://nsidc.org/data). Previous research indicated that nighttime strong-beam data have higher signal-to-noise ratios and generally superior data quality [24,32]; thus, daytime weak-beam data were excluded from the analysis. The canopy height uncertainty value less than the average height uncertainty were used for carbon stock modeling [33]. Ultimately, 21,134 valid ICESat-2 photons were retained for further analysis (Figure 1).
2.3. Forest Ground Survey Data and Carbon Stock Estimates
Forest ground survey data were obtained from the 2019 Forest Resource Inventory of (FRI) Hangzhou City, which includes information such as the longitude, latitude, dominant tree species, species composition, diameter at breast height (DBH), and tree height of forest stands. We spatially matched the forest polygon of FRI with ICESat-2 photons in the four districts of Hangzhou City. We collected species-specific allometric biomass equations for different tree organs (stem, branch, leaf, and root) along with the corresponding carbon fraction coefficients for the major dominant tree species in Hangzhou (Table S1). We then calculated the forest carbon stock density (Mg C/ha) within each photon using these allometric biomass equations and carbon fraction coefficients. Finally, we grouped the photons into five forest types according to their dominant tree species: evergreen broadleaf forest, evergreen coniferous forest, deciduous broadleaf forest, mixed coniferous-broadleaf forest, and bamboo. These grouped data were subsequently used for classification-based modeling and validation.
2.4. Forest Vegetation Type Mapping
The forest vegetation type data for Hangzhou City were derived from a 30 m long-term land cover dataset that we interpreted and produced ourselves [34]. This dataset was generated by employing the high-performance Continuous Change Detection and Classification (CCDC) algorithm [35], integrating Landsat 30m surface reflectance data, visual interpretation samples from high-resolution Google Earth images, the FRI data, and the widely used land cover datasets [36,37]. The dataset comprises ten land cover types: evergreen broadleaved forest, evergreen coniferous forest, deciduous broadleaved forest, mixed coniferous–broadleaved forest, bamboo forest, cropland, grassland, built-up land, water bodies, and bare land. Detailed procedures of dataset generation and accuracy assessment are provided in [34].
2.5. Random Forest Modeling and Hyperparameter Optimization
We built RFregression model for carbon stock estimation using Python 3.12 within the PyCharm IDE, and then applied hyperparameter optimization to further enhance its predictive performance. RF is a nonlinear, nonparametric model. Compared with other machine learning methods such as support vector machines (SVM) and back propagation (BP) neural networks, RF exhibits lower susceptibility to noise and effectively mitigates overfitting caused by multicollinearity. Prior to modeling, we performed a Pearson correlation analysis to identify canopy height metrics that were highly correlated with carbon stock (p < 0.05). Then we used these metrics as independent variables in the RF model.
Using the RandomizedSearchCV function (random search) from the scikit-learn library in Python 3.12, we performed hyperparameter optimization—i.e., setting the optimal model parameters prior to model training. The parameters with their descriptions are presented in Table 2. We performed random search with 200 iterations and three-fold cross-validation to determine an initial range for the hyperparameters. Three-fold cross-validation randomly splits the training dataset into three equal-sized subsets. In each iteration, two subsets are used for training and the remaining one for validation, rotating the validation subset across all three folds. The final performance is the average across the three folds. Three-fold cross-validation offers high flexibility and stability, reducing computational cost while maintaining reliable model generalization. We then conducted a grid search for more refined tuning. While keeping max_depth, min_samples_split, and min_samples_leaf fixed, we further narrowed the search space for n_estimators and max_depth to identify the best parameter combination.
Finally, we used three-fold cross-validation in conjunction with the coefficient of determination (R²), root mean square error (RMSE), and overall estimation accuracy (P1) to assess the accuracy of carbon stock estimation. The three evaluation metrics are calculated as follows:
where is the ground-measured carbon stock, is the predicted carbon stock, is the mean of measured carbon stock, n is the number of samples.
3. Results
3.1. Correlation Between ICESat-2 Metrics and Carbon Stocks
Using Python 3.12 within the PyCharm IDE, we performed a Pearson correlation analysis between the measured carbon stocks and the ICESat-2 derived metrics to identify variables with relatively high correlation as candidate predictors for the carbon stock model. Figure 3 presents the six canopy height metrics most strongly correlated with measured carbon stocks, ranked in descending order of their Pearson correlation coefficients: RH70 (r = 0.543), RH75 (r = 0.534), mean canopy height (r = 0.534), RH80 (r = 0.530), RH85 (r = 0.527), and RH90 (r = 0.516). This result indicates that within the study area, both the high percentiles (70–90%) and the mean canopy height exhibit strong associations with carbon stocks, whereas lower percentiles (e.g., below 50%) show relatively weaker correlations.
3.2. The Individual Effect of Forest Classification and Hyperparameter Optimization
As shown in Figure 4, the non-stratified model across Hangzhou City achieved an R² of 0.60, an RMSE of 10.00 Mg C/ha, and a P1 of 77.20%. Compared to this non-stratified model, the forest-type-specific models for evergreen broadleaved forest, deciduous broadleaved forest, evergreen coniferous forest, mixed coniferous–broadleaved forest, and bamboo achieved improvements in R2 of 0.15, 0.04, 0.07, 0.09, and 0.03, respectively; reductions in RMSE of 2.88, 1.36, 4.18, 1.12, and 7.82 Mg C/ha, respectively; and increases in P1 of 5.41%, 7.09%, 2.44%, 5.99%, and 13.51%, respectively.
We then optimized the hyperparameters of all RF models, covering both the non-stratified model (i.e., without forest classification) and each forest-type-specific model. Using random search and grid search methods, we obtained the optimized hyperparameters for each model (Table 3). After hyperparameter optimization, the non-stratified model achieved an increase in R² of 0.06, a reduction in RMSE of 0.77 Mg C/ha, and an improvement in P1 of 3.27% (Figure 4 and Figure 5).
After hyperparameter optimization, the forest-type-specific models—evergreen broadleaved, deciduous broadleaved, evergreen coniferous, mixed coniferous–broadleaved, and bamboo forests—achieved R² increases of 0.15, 0.10, 0.15, 0.17, and 0.16; RMSE reductions of 3.18, 2.28, 4.85, 2.70, and 7.43 Mg C/ha; and P1 improvements of 5.62%, 5.58%, 3.29%, 7.96%, and 13.34%, respectively, compared with the non-stratified model (Figure 5).
3.3. The combined Effect of Forest Classification and Hyperparameter Optimization
After integrating hyperparameter optimization and classification-based modeling, the optimized models for evergreen broadleaved forest, deciduous broadleaved forest, evergreen coniferous forest, mixed coniferous–broadleaved forest, and bamboo forest achieved R² values of 0.81, 0.76, 0.81, 0.83, and 0.82, respectively (Figure 5). Compared with the baseline model (without either strategy), the R² increased by 0.21, 0.16, 0.21, 0.23, and 0.22; RMSE decreased by 3.95, 3.05, 5.62, 3.47, and 8.20 Mg C/ha; and P1 improved by 8.89%, 8.85%, 6.56%, 11.23%, and 16.61%, respectively (Table 4). These results demonstrate that the combination of forest classification and hyperparameter optimization can substantially enhance the accuracy of carbon stock estimation, with an average increase of R² exceeding 0.20.
3.4. Spatial Distribution of Carbon Stocks for ICESat-2 Forest Photons
We estimated carbon stocks for 14,496 ICESat-2 photons over forested areas in Hangzhou City using the optimized RF model that integrates forest classification and hyperparameter optimization. The carbon stocks of the forest photons ranged from 13.91 to 78.15 Mg C/ha, with a mean value of 33.56 Mg C/ha (Figure 6). Areas with high carbon stocks (58.14–78.15 Mg C/ha) were mainly distributed around Qiandao Lake in Chun’an County, the southwestern part of Lin’an District, and the West Lake Scenic Area, whereas low-value areas were mainly concentrated in built-up zones across various districts and counties. These photon-based carbon stocks, which are highly correlated with canopy height and forest type, provide valuable samples for spatially continuous inversion across larger spatial scales.
4. Discussion
4.1. Selection of Canopy Height Metrics from ICESat-2
In this study, the six canopy height metrics most strongly correlated with carbon stocks were the 70th, 75th, 80th, 85th, and 90th percentiles, together with the mean canopy height. The ranking highlights the dominant role of upper-canopy structure in carbon stock estimation, while the inclusion of mean canopy height suggests the complementary value of overall stand vertical information. These findings are consistent with the general trend of applying ICESat-2 data to forest carbon stock estimation in previous studies [24,38]. For example, Narine, Popescu [39]) developed an AGB estimation model using RH98 and RH100, achieving a R² exceeding 0.62. However, most existing studies have preferentially adopted RH98 or RH100 as standard features, whereas our results indicate that the 70–90% percentiles yield higher correlations. This discrepancy may be attributed to the relatively simple vertical structure, continuous canopy, and high canopy closure in Hangzhou, which render the mid-to-high percentiles more stable and less noisy than the extreme percentiles. It may also be related to the higher sensitivity of RH100 to noise and outliers from ICESat-2, which can compromise its accuracy under specific topographic conditions [27].
Compared with the Global Ecosystem Dynamics Investigation (GEDI) mission, which provides full-waveform data capable of characterizing the canopy vertical profile more finely, GEDI’s canopy height metrics (e.g., RH98) generally show higher correlations with carbon stocks in plain regions (e.g., 0.96 vs. 0.82 for ICESat-2) [38]. However, ICESat-2 has the advantages of global coverage, repeated observations, and better adaptability to sparse vegetation and steep terrain [40]. Our results further demonstrate that by optimizing percentile selection (e.g., adopting 70–90% rather than extreme values), ICESat-2 can significantly enhance its synergy with carbon stocks, providing a useful reference for subsequent multi-source data fusion and regional-scale carbon estimation.
Several potential factors that affect the correlation between canopy height and carbon stocks warrant careful consideration. First, forest type and structural complexity play a decisive role — in structurally simple plantations or secondary forests, a single fixed percentile height may be sufficient to characterize carbon stocks, whereas in multi-layered, uneven-aged natural forests, it may be necessary to combine multiple height metrics or even full-waveform information. Second, the ICESat-2 data preprocessing pipeline, including adaptive denoising and photon classification thresholds, directly influences the extracted canopy height values, thereby altering their statistical relationship with carbon stocks. Third, the spatiotemporal matching of ground reference data — such as discrepancies between plot size and footprint extent, as well as mismatches in measurement timing — together with the choice of modeling methods (e.g., linear regression, random forest, deep learning), can introduce systematic biases into the feature ranking. Consequently, the ranking results of this study may be to some extent method-dependent.
4.2. Impact of Forest Type-Specific Modeling
Different forest types exhibit significant differences in species composition, stand structure, and canopy characteristics. If a unified estimation model is constructed without distinguishing among them, it tends to introduce considerable systematic errors [31]. Zeng, Zou [41]) developed a three-level hierarchical biomass and carbon stock modeling system based on data from 52,700 fixed sample plots of the China National Forest Inventory. Their findings demonstrated that as the classification hierarchy became more refined, the model accuracy R2 increased progressively. This result fully demonstrates that sound forest classification can effectively reduce model prediction errors and serves as a prerequisite for improving the accuracy of carbon stock estimation. In this study, by performing detailed forest type classification and constructing separate models for each type, the carbon stock prediction accuracy was significantly enhanced, further corroborating the effectiveness of the stratified modeling strategy.
In this study, bamboo forests achieved the highest R² among all forest types after classification-based modeling. This may be attributed to the sufficient sample size and relatively simple community structure of bamboo stands, where the measured data exhibited smaller errors, thereby rendering the relationship between ICESat-2/ATLAS canopy height metrics and carbon stocks more stable. This finding is consistent with the observation by [39] that it is difficult to achieve high accuracy in structurally complex natural forest areas. Evergreen broadleaved forests and mixed coniferous–broadleaved forests also yielded relatively high R² values, likely due to their adequate sample sizes and comprehensive carbon stock gradients, which allowed the models to more fully capture their carbon stock characteristics. In contrast, deciduous broadleaved forests showed a relatively modest improvement in accuracy, probably owing to seasonal leaf shedding that may cause fluctuations in canopy height metrics.
4.3. Effect of Hyperparameter Optimization
Although numerous studies indicate that default RF hyperparameters generally perform well, machine learning models contain numerous hyperparameters whose selection directly governs model fitting and generalization performance [42]. For example, Wang, Wang [43] used the Optuna framework for hyperparameter optimization and found that the optimized stacking ensemble model effectively mitigated the issues of underestimation at high carbon density values and overestimation at low values. Similarly, [44] combined global hyperparameter optimization with local sample weighting in a SVM framework, obtaining an R² of 0.76. These findings demonstrate that systematic hyperparameter optimization substantially improves both the accuracy and robustness of carbon stock estimation models. In this study, we adopted a RF model with hyperparameter optimization. Compared with modeling without optimization, the accuracy of the RF models for all five forest types increased, indicating that hyperparameter optimization can improve the capability of carbon stock modeling across different forest types.
5. Conclusions
Accurate forest carbon stock estimation is essential for tracking progress toward carbon neutrality, yet conventional remote sensing approaches often fail to capture the structural heterogeneity of forests, leading to substantial estimation biases. To address this challenge, we proposed and validated an integrated framework that combines ICESat-2/ATLAS photon-counting lidar data with forest vegetation classification and hyperparameter optimization.
Using over 14,000 ICESat-2 photons acquired over Hangzhou, we extracted multiple canopy height metrics and established forest-type-specific RF models linking these metrics to ground-based carbon stock measurements. Our results identified the 70th–90th percentile heights and the mean canopy height as the most informative predictors of carbon stocks. More importantly, we found that classification-based stratified modeling alone increased R² by 0.10–0.17 and reduced RMSE by 2.28–7.43 Mg C/ha across different forest types. When hyperparameter optimization was added to the stratified models, the combined strategy yielded further improvements, with R² gains of 0.16–0.23 and RMSE reductions of 3.05–8.20 Mg C/ha.
Collectively, this study provides a robust and transferable methodological framework for region-scale forest carbon stock estimation. The integration of ICESat-2’s unique canopy-sensing capability with intelligent modeling strategies holds promise for supporting carbon monitoring, particularly in regions with heterogeneous forest landscapes. Future work could extend this framework to larger spatial scales, incorporate additional remote sensing data (e.g., GEDI, Sentinel-1/2), and explore deep learning approaches for further accuracy gains.
Author Contributions
Conceptualization, D.Z. and G.H.; methodology, D.Z. and Z.C.; software, D.Z. and Z.C.; validation, D.Z., Z.C., and G.H.; formal analysis, Z.C., D.Z. and G.H.; investigation, D.Z. and K.Y.; resources, X.W. and Q.X.; data curation, X.W. and Q.X.; writing—original draft preparation, Z.C., D.Z. and K.Y.; writing—review and editing, D.Z.; visualization, Z.C. and D.Z.; supervision, X.W. and G.H.; project administration, X.W.; funding acquisition, D.Z. and G.H.
Funding
This research was funded by the “Zhejiang Provincial Natural Science Foundation of China, grant number ZCLQN25C0301”, “the National Natural Science Foundation of China, grant number 32171570”, and “the Zhejiang Provincial ‘Leading Goose’ R&D Program, grant number. 2025C02052”.
Conflicts of Interest
The authors declare no conflicts of interest.
References
- Keenan, T.F. and C.A. Williams, The Terrestrial Carbon Sink. Annual Review of Environment and Resources, 2018. 43(1): p. 219-243.
- Pugh, T.A.M., et al., Role of forest regrowth in global carbon sink dynamics. Proceedings of the National Academy of Sciences of the United States of America, 2019. 116(10): p. 4382-4387. [CrossRef]
- Yu, Z., et al., Forest expansion dominates China’s land carbon sink since 1980. Nature Communications, 2022. 13(1): p. 5374. [CrossRef]
- Friedlingstein, P., et al., Global Carbon Budget 2025. Earth System Science Data, 2026. 18(5): p. 3211-3288.
- Xiao, J., et al., Remote sensing of the terrestrial carbon cycle: A review of advances over 50 years. Remote Sensing of Environment, 2019. 233. [CrossRef]
- Healey, S.P., et al., Highly Local Model Calibration with a New GEDI LiDAR Asset on Google Earth Engine Reduces Landsat Forest Height Signal Saturation. Remote Sensing, 2020. 12(17): p. 2840. [CrossRef]
- Maeda, E.E., et al., Expanding forest research with terrestrial LiDAR technology. Nature Communications, 2025. 16(1). [CrossRef]
- Su, R., et al., Aboveground Carbon Stock Estimation Based on Backpack LiDAR and UAV Multispectral Imagery at the Forest Sample Plot Scale. Remote Sensing, 2024. 16(21): p. 3927. [CrossRef]
- Molina-Valero, J.A., et al., Use of close-range LiDAR devices and statistical inference approaches in operational stand-level forest inventories. Remote Sensing of Environment, 2025. 325. [CrossRef]
- Tian, Y., et al., Aboveground biomass of typical invasive mangroves and its distribution patterns using UAV-LiDAR data in a subtropical estuary: Maoling River estuary, Guangxi, China. Ecological Indicators, 2022. 136: p. 108694. [CrossRef]
- Jiang, F., et al., Integrating spaceborne LiDAR and Sentinel-2 images to estimate forest aboveground biomass in Northern China. Carbon Balance Management, 2022. 17(1): p. 12. [CrossRef]
- Neuenschwander, A., et al., Towards global spaceborne lidar biomass: Developing and applying boreal forest biomass models for ICESat-2 laser altimetry data. Science of Remote Sensing, 2024. 10: p. 100150. [CrossRef]
- Markus, T., et al., The Ice, Cloud, and land Elevation Satellite-2 (ICESat-2): Science requirements, concept, and implementation. Remote Sensing of Environment, 2017. 190: p. 260-273. [CrossRef]
- Neuenschwander, A., et al., ATLAS/ICESat-2 L3A Land and Vegetation Height Quick Look, Version 6. 2023, NASA National Snow and Ice Data Center Distributed Active Archive Center.
- Martino, A.J., et al. ICESat-2 mission overview and early performance. in Remote Sensing. 2019.
- Li, W., et al., High-resolution mapping of forest canopy height using machine learning by coupling ICESat-2 LiDAR with Sentinel-1, Sentinel-2 and Landsat-8 data. International Journal of Applied Earth Observation and Geoinformation, 2020. 92: p. 102163. [CrossRef]
- Narine, L.L., et al., Estimating aboveground biomass and forest canopy cover with simulated ICESat-2 data. Remote Sensing of Environment, 2019. 224: p. 1-11. [CrossRef]
- Qin, H., et al., Estimating aboveground carbon stocks of urban trees by synergizing ICESat-2 LiDAR with GF-2 data. Urban Forestry & Urban Greening, 2022. 76: p. 127728. [CrossRef]
- Narine, L.L., S.C. Popescu, and L. Malambo, Using ICESat-2 to Estimate and Map Forest Aboveground Biomass: A First Example. Remote Sensing, 2020. 12(11): p. 1824. [CrossRef]
- Duncanson, L., et al., Biomass estimation from simulated GEDI, ICESat-2 and NISAR across environmental gradients in Sonoma County, California. Remote Sensing of Environment, 2020. 242: p. 111779. [CrossRef]
- Chen, D.P., et al., A Dual-Variable Selection Framework for Enhancing Forest Aboveground Biomass Estimation via Multi-Source Remote Sensing. Remote Sensing, 2025. 17(14). [CrossRef]
- Duncanson, L., et al., Global and boreal estimates of woody aboveground biomass for 2020: Filling GEDI’s northern data gap with ICESat-2 and harmonized Landsat Sentinel-2. Remote Sensing of Environment, 2026. 340. [CrossRef]
- Li, Y.S., et al., Examining the Impact of Topography and Vegetation on Existing Forest Canopy Height Products from ICESat-2 ATLAS/GEDI Data. Remote Sensing, 2024. 16(19). [CrossRef]
- Varvia, P., et al., How to consider the effects of time of day, beam strength, and snow cover in ICESat-2 based estimation of boreal forest biomass? Remote Sensing of Environment, 2022. 280. [CrossRef]
- Zhou, J.L., et al., Influence of seasonal canopy conditions on ICESat-2-based aboveground biomass estimation in deciduous forests. Ecological Informatics, 2026. 93. [CrossRef]
- Fu, H.C., et al., Forest aboveground carbon storage estimation and uncertainty analysis by coupled multi-source remote sensing data in Liaoning Province. Ecological Indicators, 2025. 176. [CrossRef]
- Guerra-Hernández, J., et al., Aboveground biomass mapping by integrating ICESat-2, SENTINEL-1, SENTINEL-2, ALOS2/PALSAR2, and topographic information in Mediterranean forests. GIScience & Remote Sensing, 2022. 59(1): p. 1509-1533. [CrossRef]
- Varvia, P., et al., Estimation of boreal forest biomass from ICESat-2 data using hierarchical hybrid inference. Remote Sensing of Environment, 2024. 311: p. 114249. [CrossRef]
- Zhen, Z., et al., A hybrid method for forest aboveground biomass estimation: fusion of individual tree- and area-based approaches over northeast China. Giscience & Remote Sensing, 2025. 62(1). [CrossRef]
- Wallis, C.I.B., et al., Remotely sensed carbon content: The role of tree composition and tree diversity. Remote Sensing of Environment, 2023. 284. [CrossRef]
- Zhou, J., et al., Remote sensing estimation of aboveground biomass of different forest types in Xinjiang based on machine learning. Scientific Reports, 2025. 15(1). [CrossRef]
- Yang, C.C., et al., Performance evaluation and improvement of ICESat-2 and GEDI forest canopy height retrievals in Northeast China. GIScience & Remote Sensing, 2025. 62(1). [CrossRef]
- Nandy, S., R. Srinet, and H. Padalia, Mapping Forest Height and Aboveground Biomass by Integrating ICESat-2, Sentinel-1 and Sentinel-2 Data Using Random Forest Algorithm in Northwest Himalayan Foothills of India. Geophysical Research Letters, 2021. 48(14). [CrossRef]
- Zhang, D., et al., Near real-time monitoring of carbon effects from continuous forest change in rapidly urbanizing region of China from 2000 to 2020. Forest Ecosystems, 2025. 13. [CrossRef]
- Tang, X., et al., Spatiotemporal assessment of land use/land cover change and associated carbon emissions and uptake in the Mekong River Basin. Remote Sensing of Environment, 2021. 256: p. 112336. [CrossRef]
- Yang, J. and X. Huang, The 30 m annual land cover dataset and its dynamics in China from 1990 to 2019. Earth System Science Data, 2021. 13(8): p. 3907-3925. [CrossRef]
- Zhang, X., et al., GLC_FCS30: global land-cover product with fine classification system at 30 m using time-series Landsat imagery. Earth System Science Data, 2021. 13(6): p. 2753-2776. [CrossRef]
- Duncanson, L., et al., Aboveground biomass density models for NASA’s Global Ecosystem Dynamics Investigation (GEDI) lidar mission. Remote Sensing of Environment, 2022. 270. [CrossRef]
- Narine, L.L., S.C. Popescu, and L. Malambo, Synergy of ICESat-2 and Landsat for Mapping Forest Aboveground Biomass with Deep Learning. Remote Sensing, 2019. 11(12). [CrossRef]
- Wang, R.Q., et al., Improving extraction of forest canopy height through reprocessing ICESat-2 ATLAS and GEDI data in sparsely forested plain regions. GIScience & Remote Sensing, 2024. 61(1). [CrossRef]
- Zeng, W.S., et al., A Three-Level Model System of Biomass and Carbon Storage for All Forest Types in China. Forests, 2024. 15(8). [CrossRef]
- Regis, R.G. Hyperparameter Tuning of Random Forests Using Radial Basis Function Models. in Machine Learning, Optimization, and Data Science. 2023. Cham: Springer Nature Switzerland.
- Wang, K., et al., Remote sensing estimation of forest carbon stoage in Jangxi Province based on ensemble learning algorithm and Optuna tuning. Acta Ecologica Sinica, 2025. 45(02): p. 685-700.
- Chen, X., et al., Forest carbon stock estimation in a mountainous region using locally adaptive machine learning approaches. Environ Monit Assess, 2026. 198(5). [CrossRef]
Figure 1.
Research framework and methodological workflow.
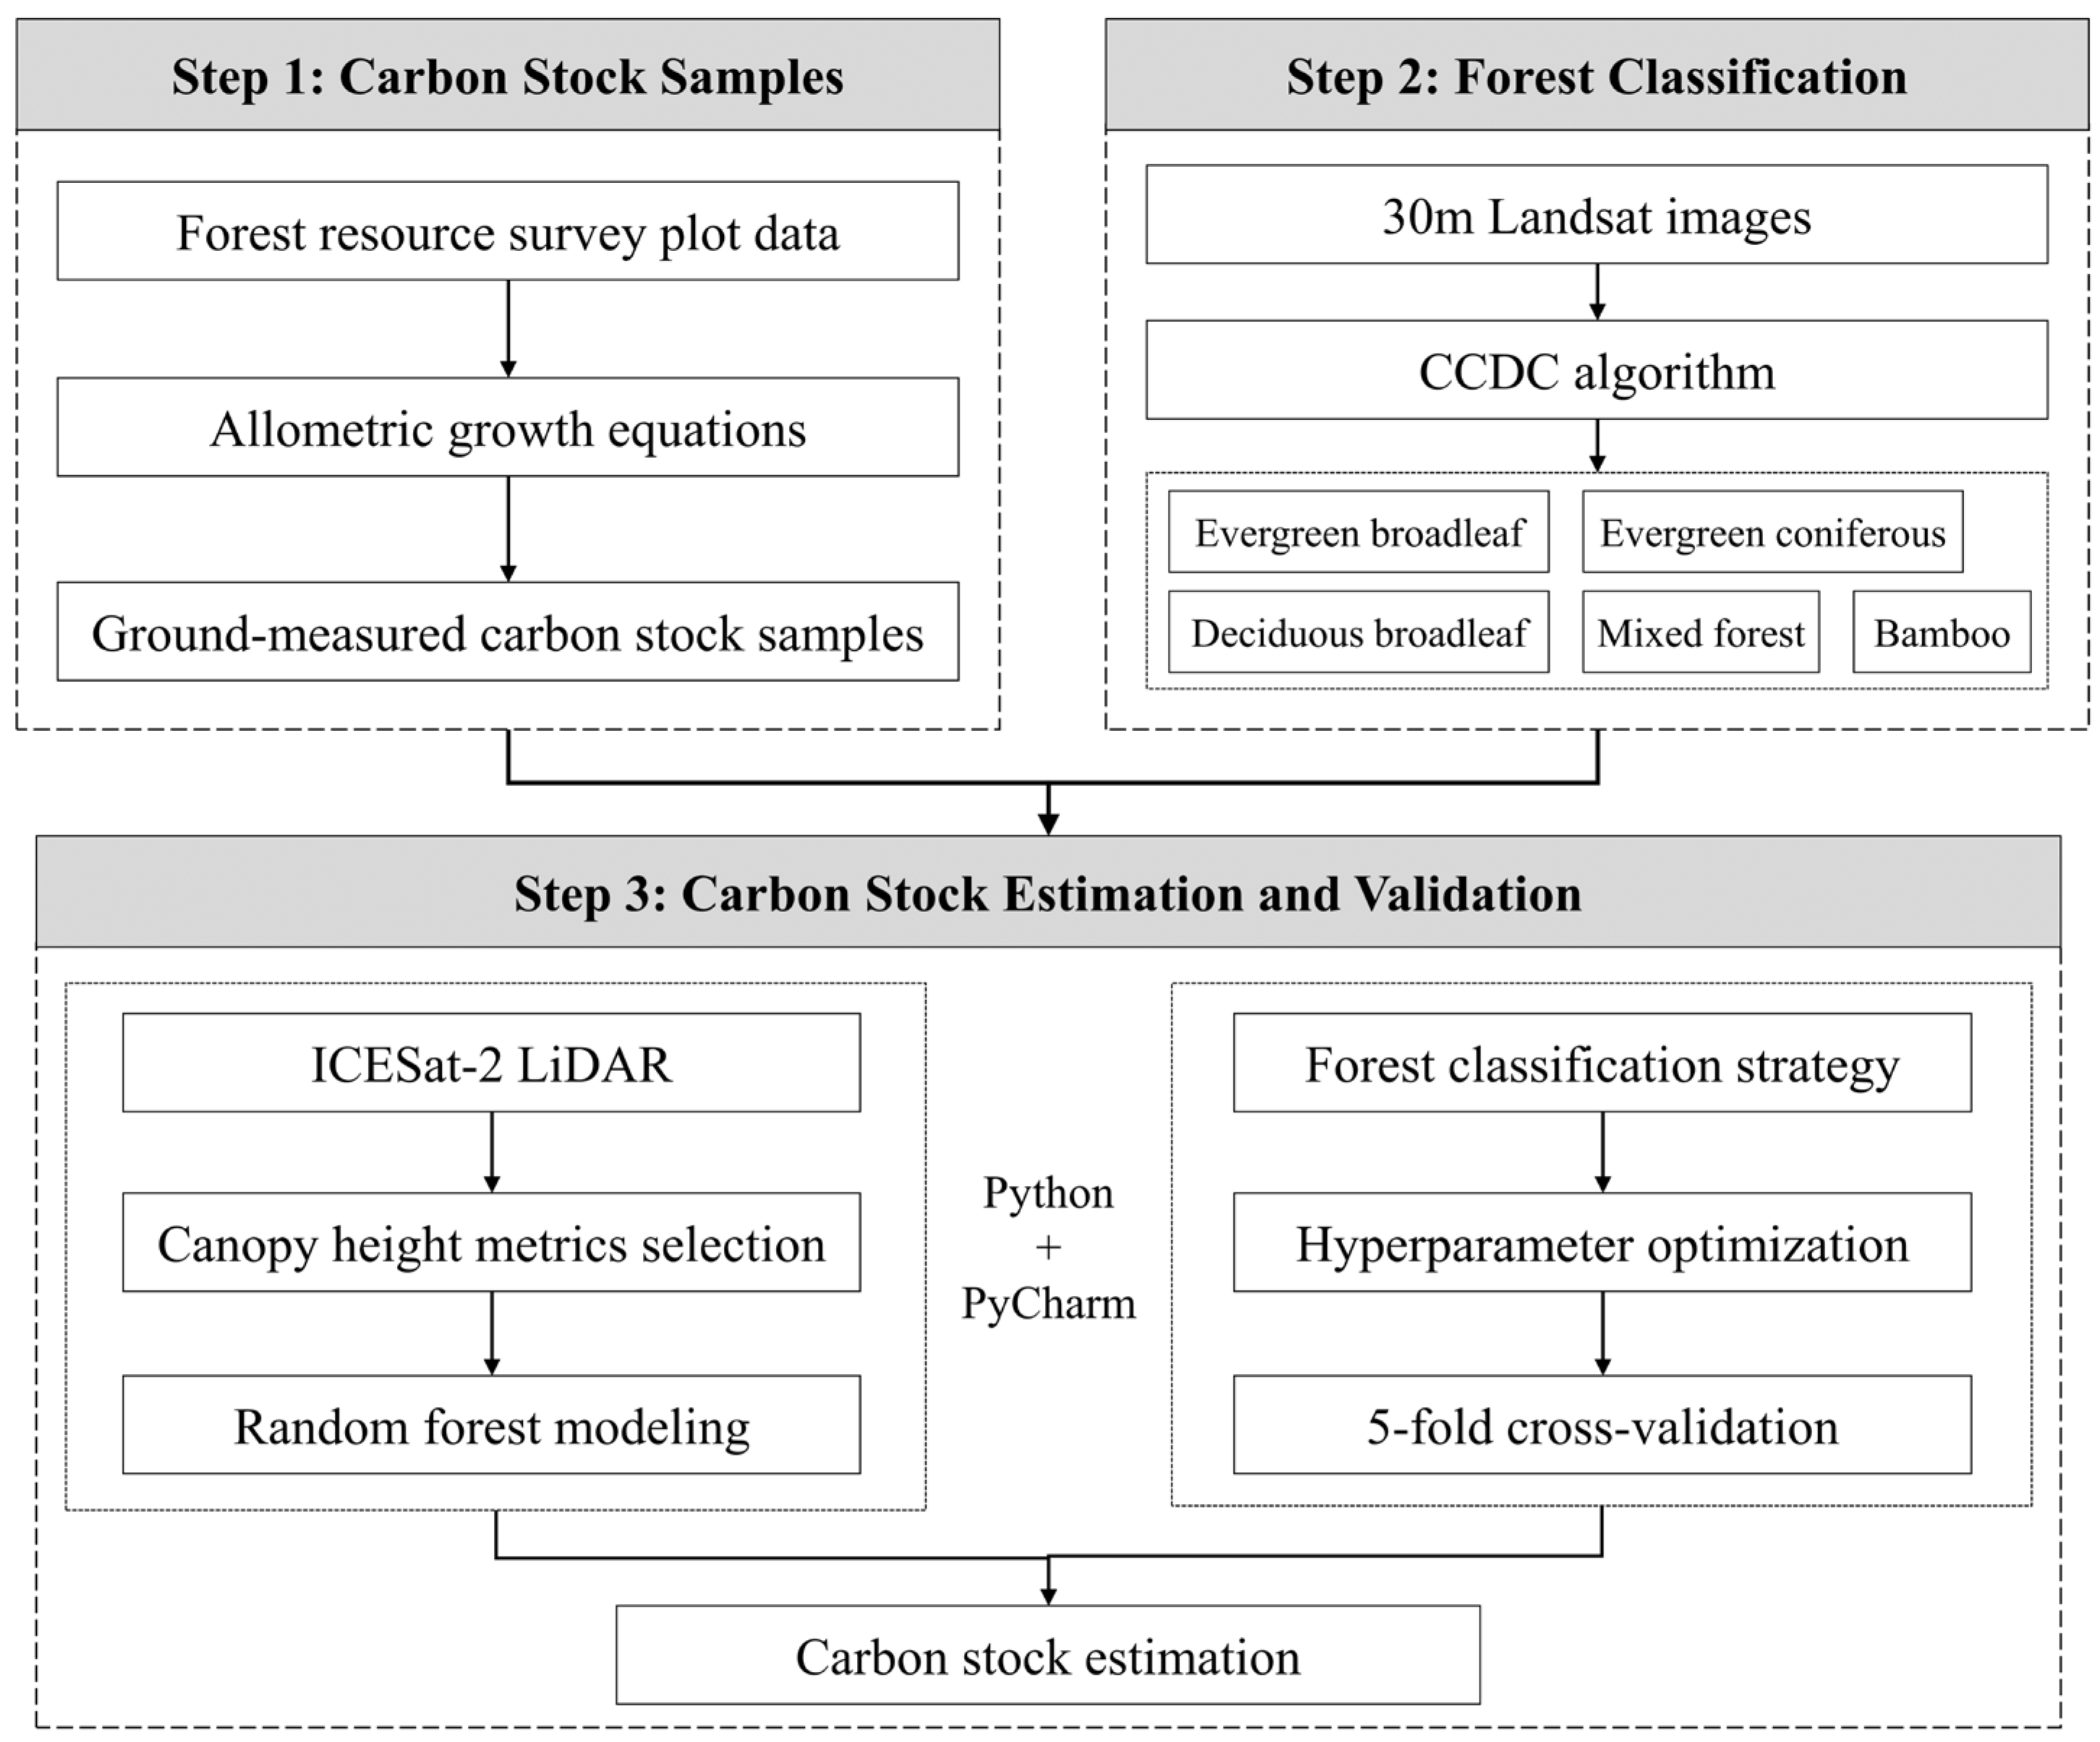
Figure 2.
Study area and ICEsat-2 data.
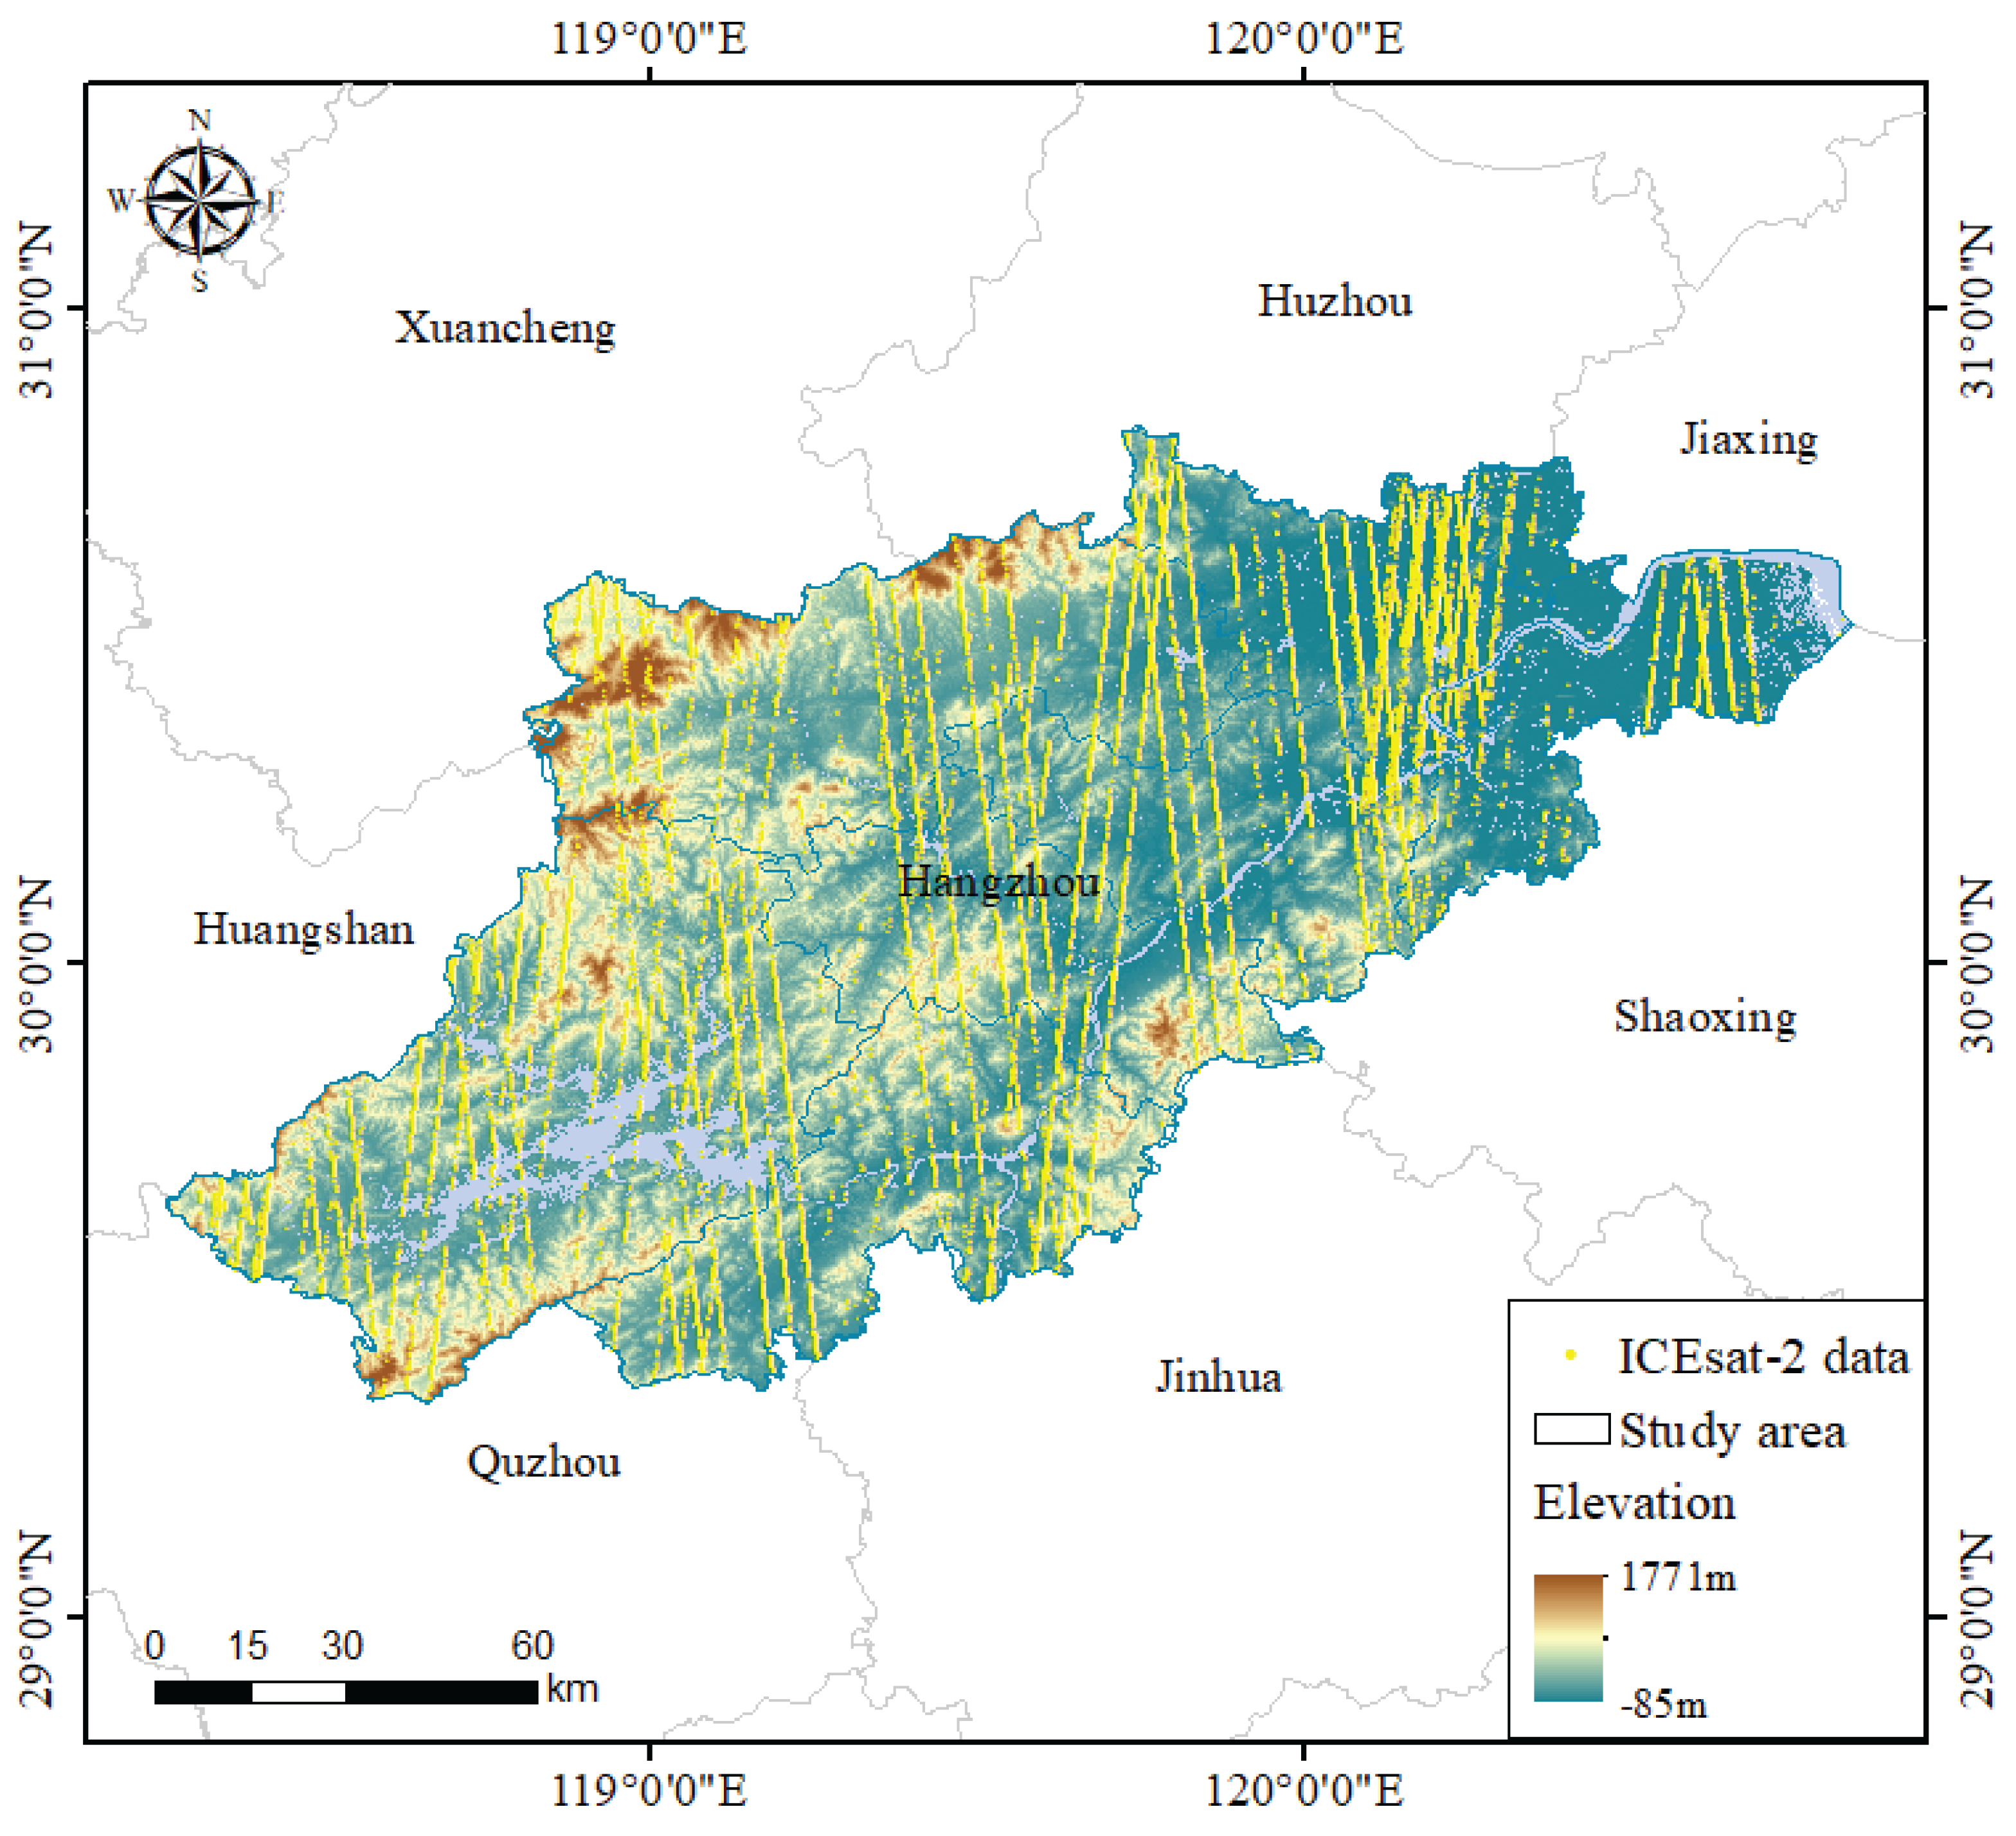
Figure 3.
Correlation between the measured carbon stocks and the ICESat-2 derived metrics. Orange, green, and blue scatter points represent correlations > 0.5, 0.3–0.5, and < 0.3, respectively. RH10–RH95 denote the 10th to 95th percentile canopy heights at 5% increments.
Figure 3.
Correlation between the measured carbon stocks and the ICESat-2 derived metrics. Orange, green, and blue scatter points represent correlations > 0.5, 0.3–0.5, and < 0.3, respectively. RH10–RH95 denote the 10th to 95th percentile canopy heights at 5% increments.
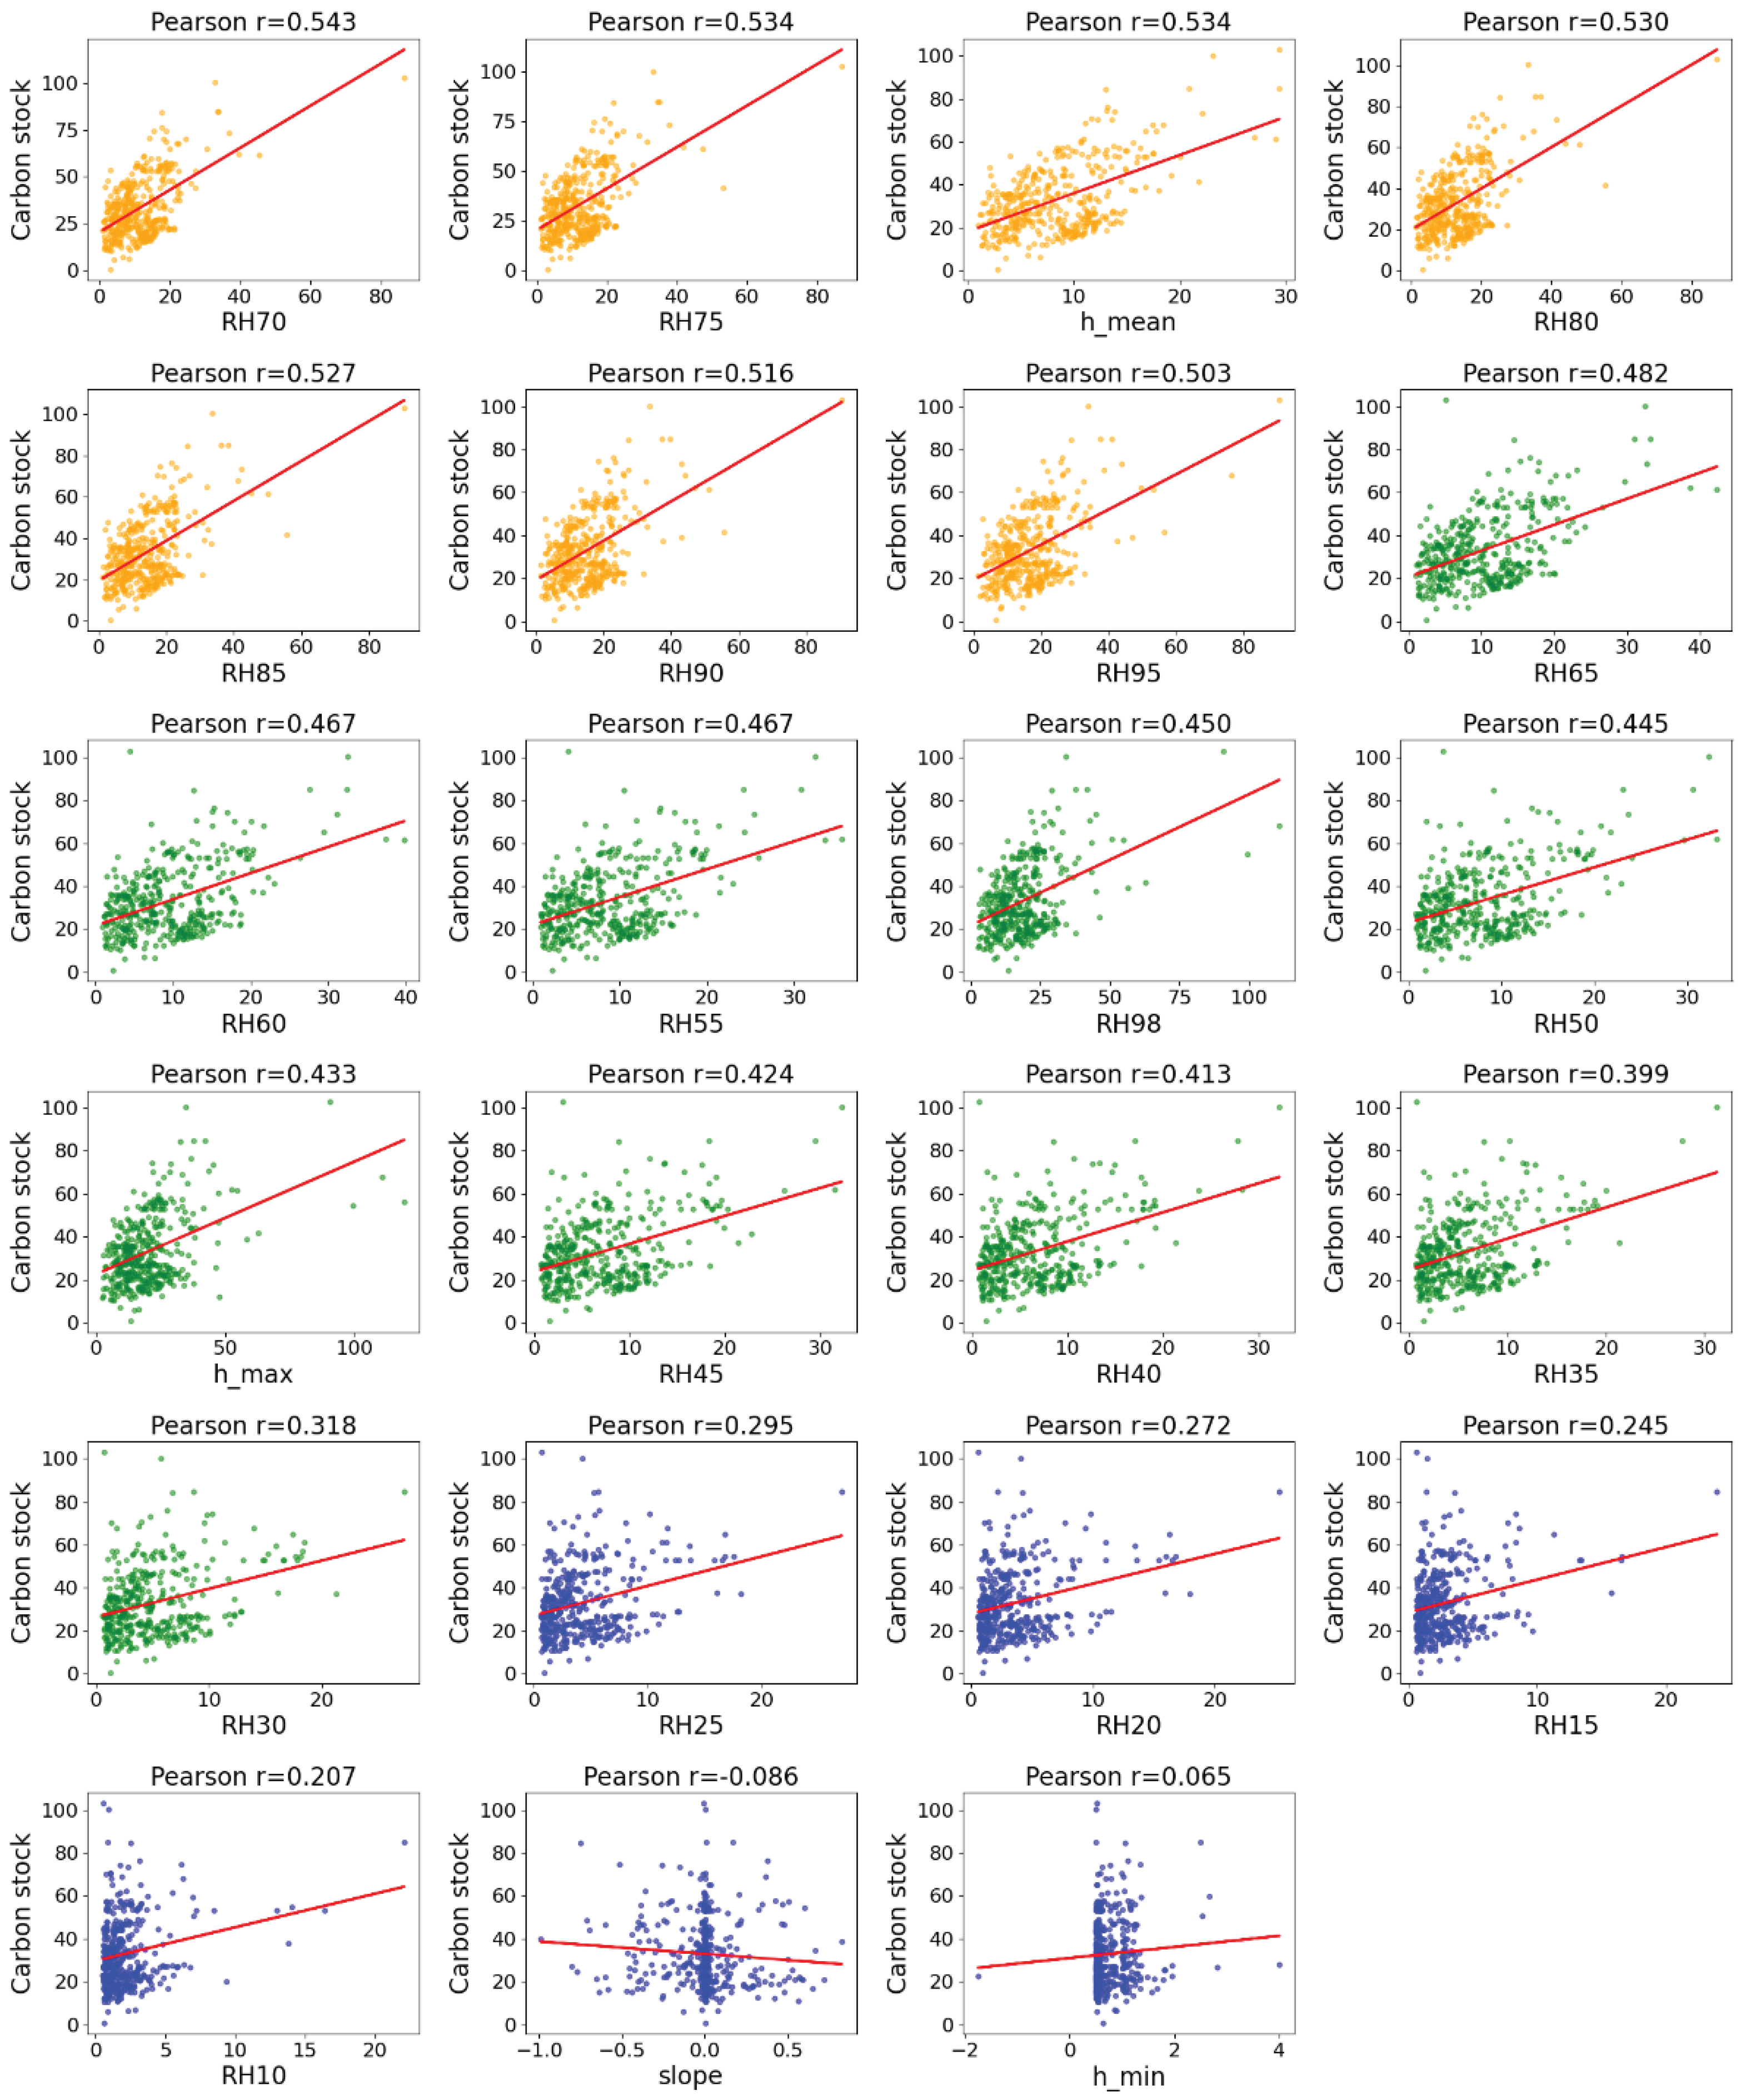
Figure 4.
Comparison of carbon stock model accuracy before and after forest classification.
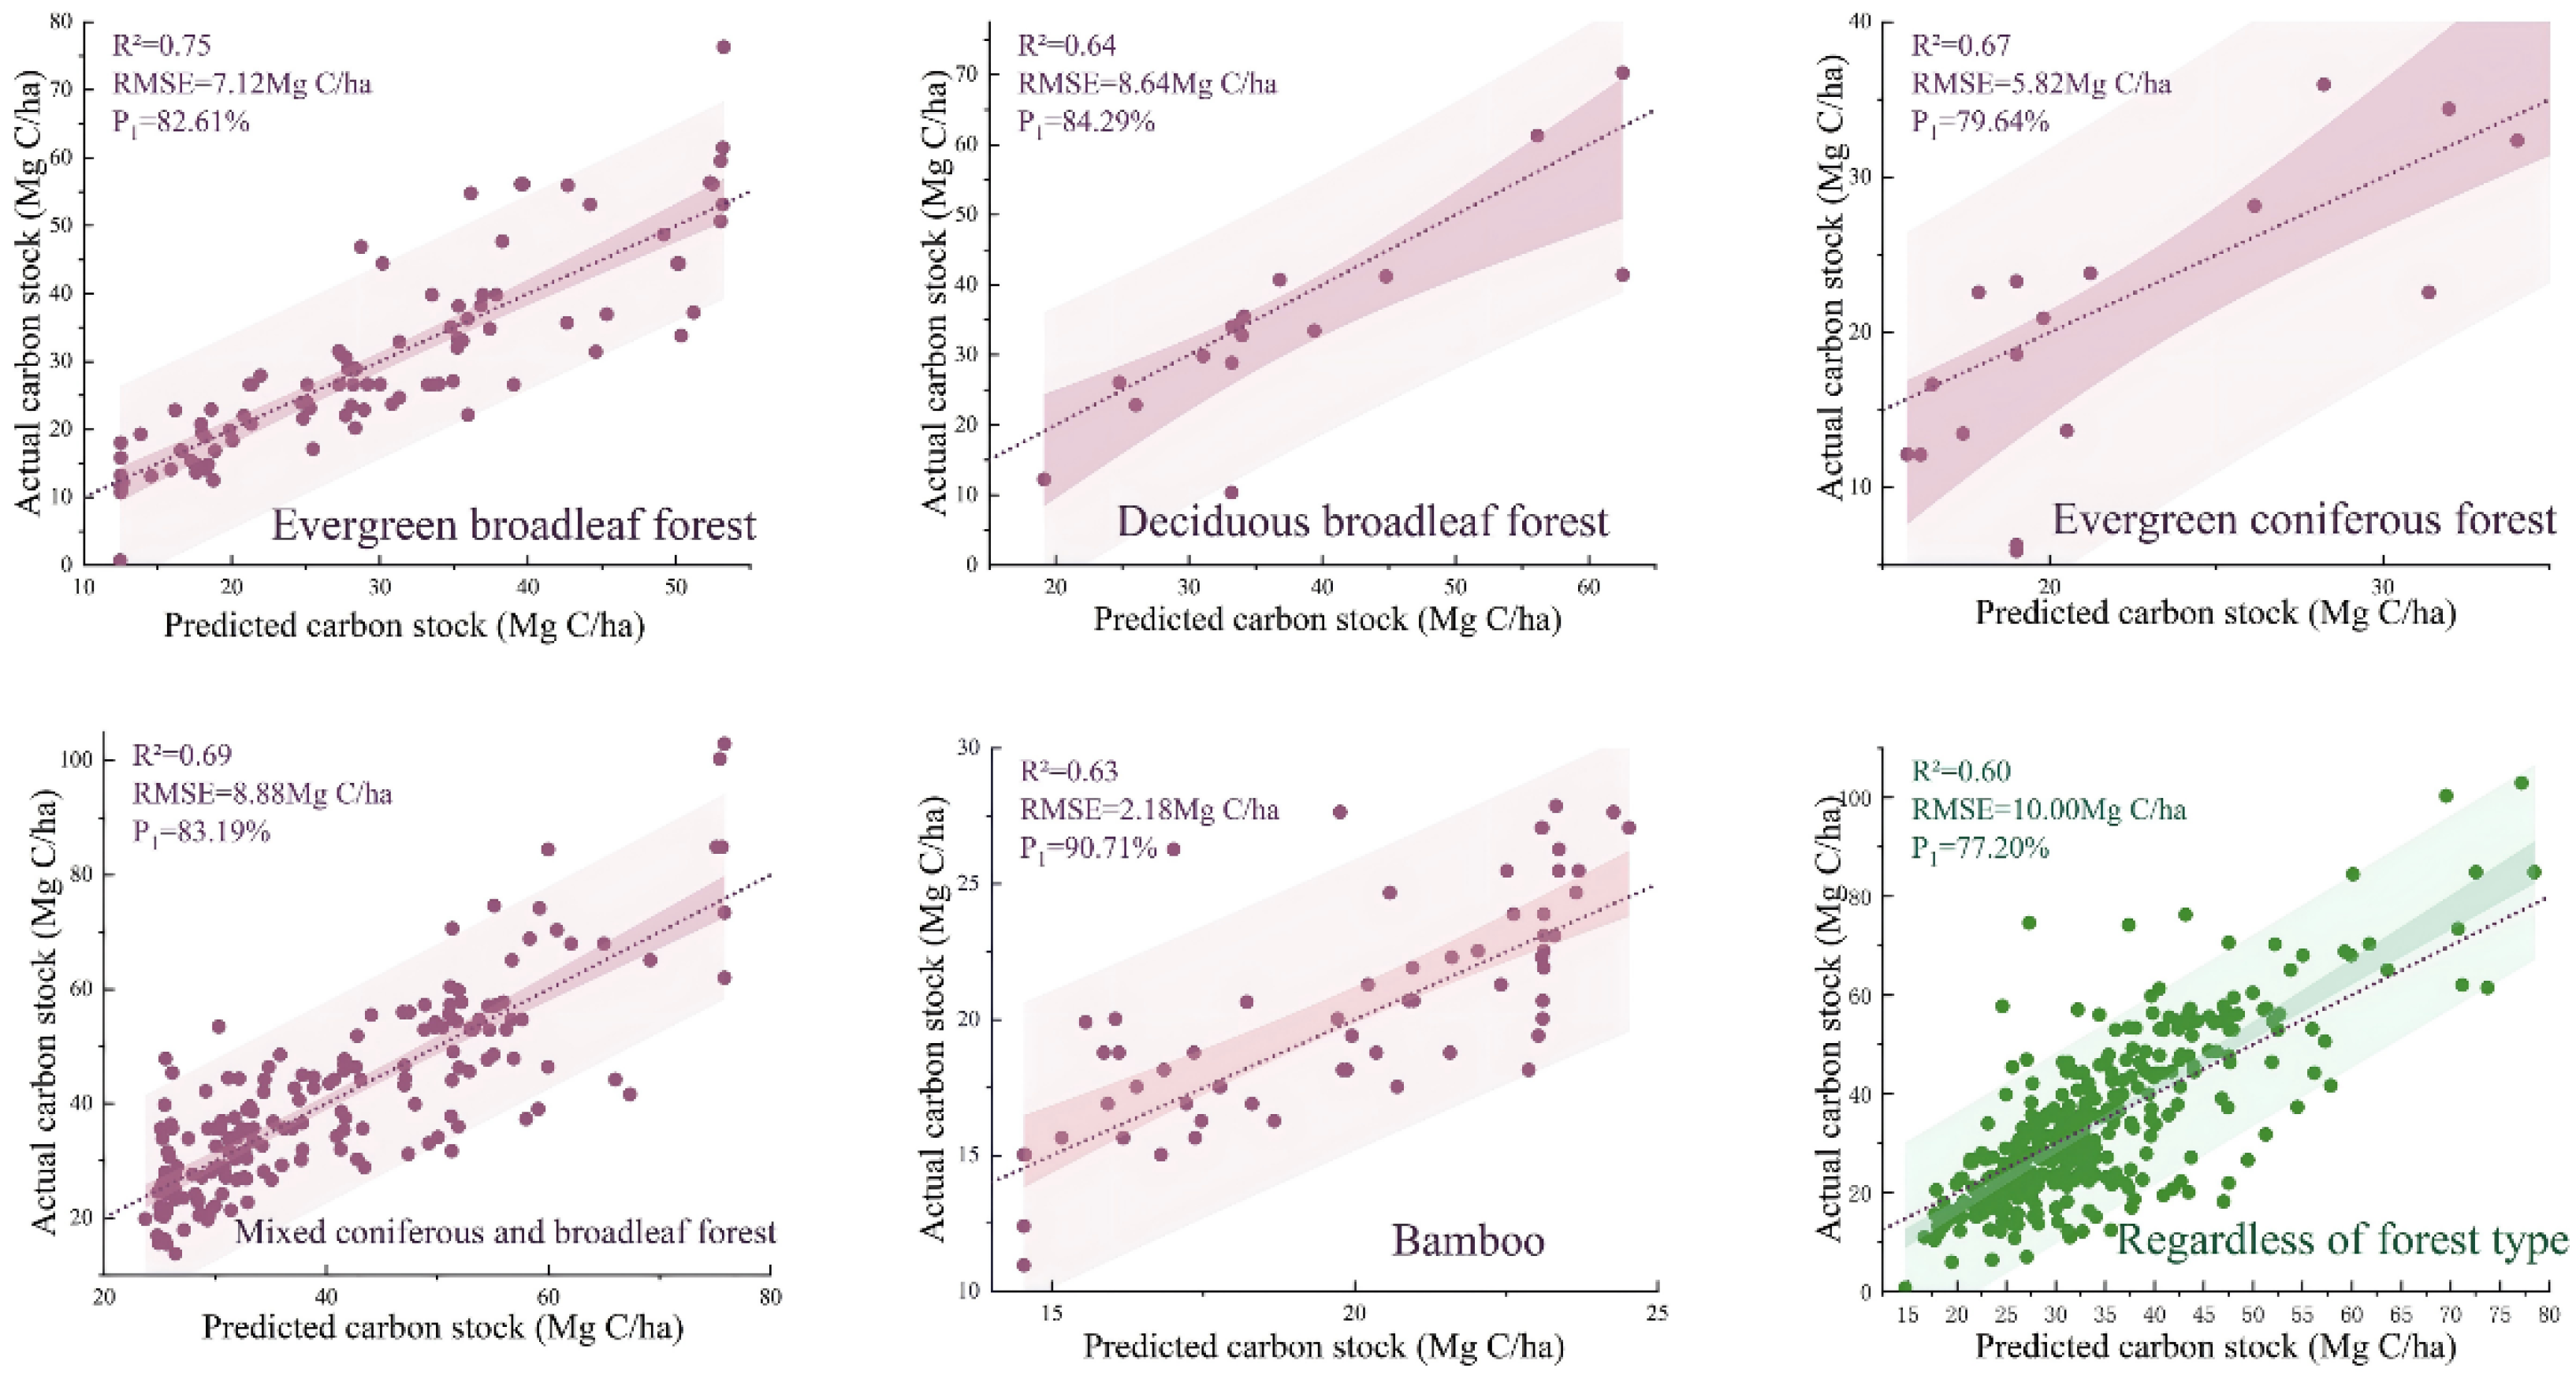
Figure 5.
The accuracy of all carbon stock models after hyperparameter optimization.
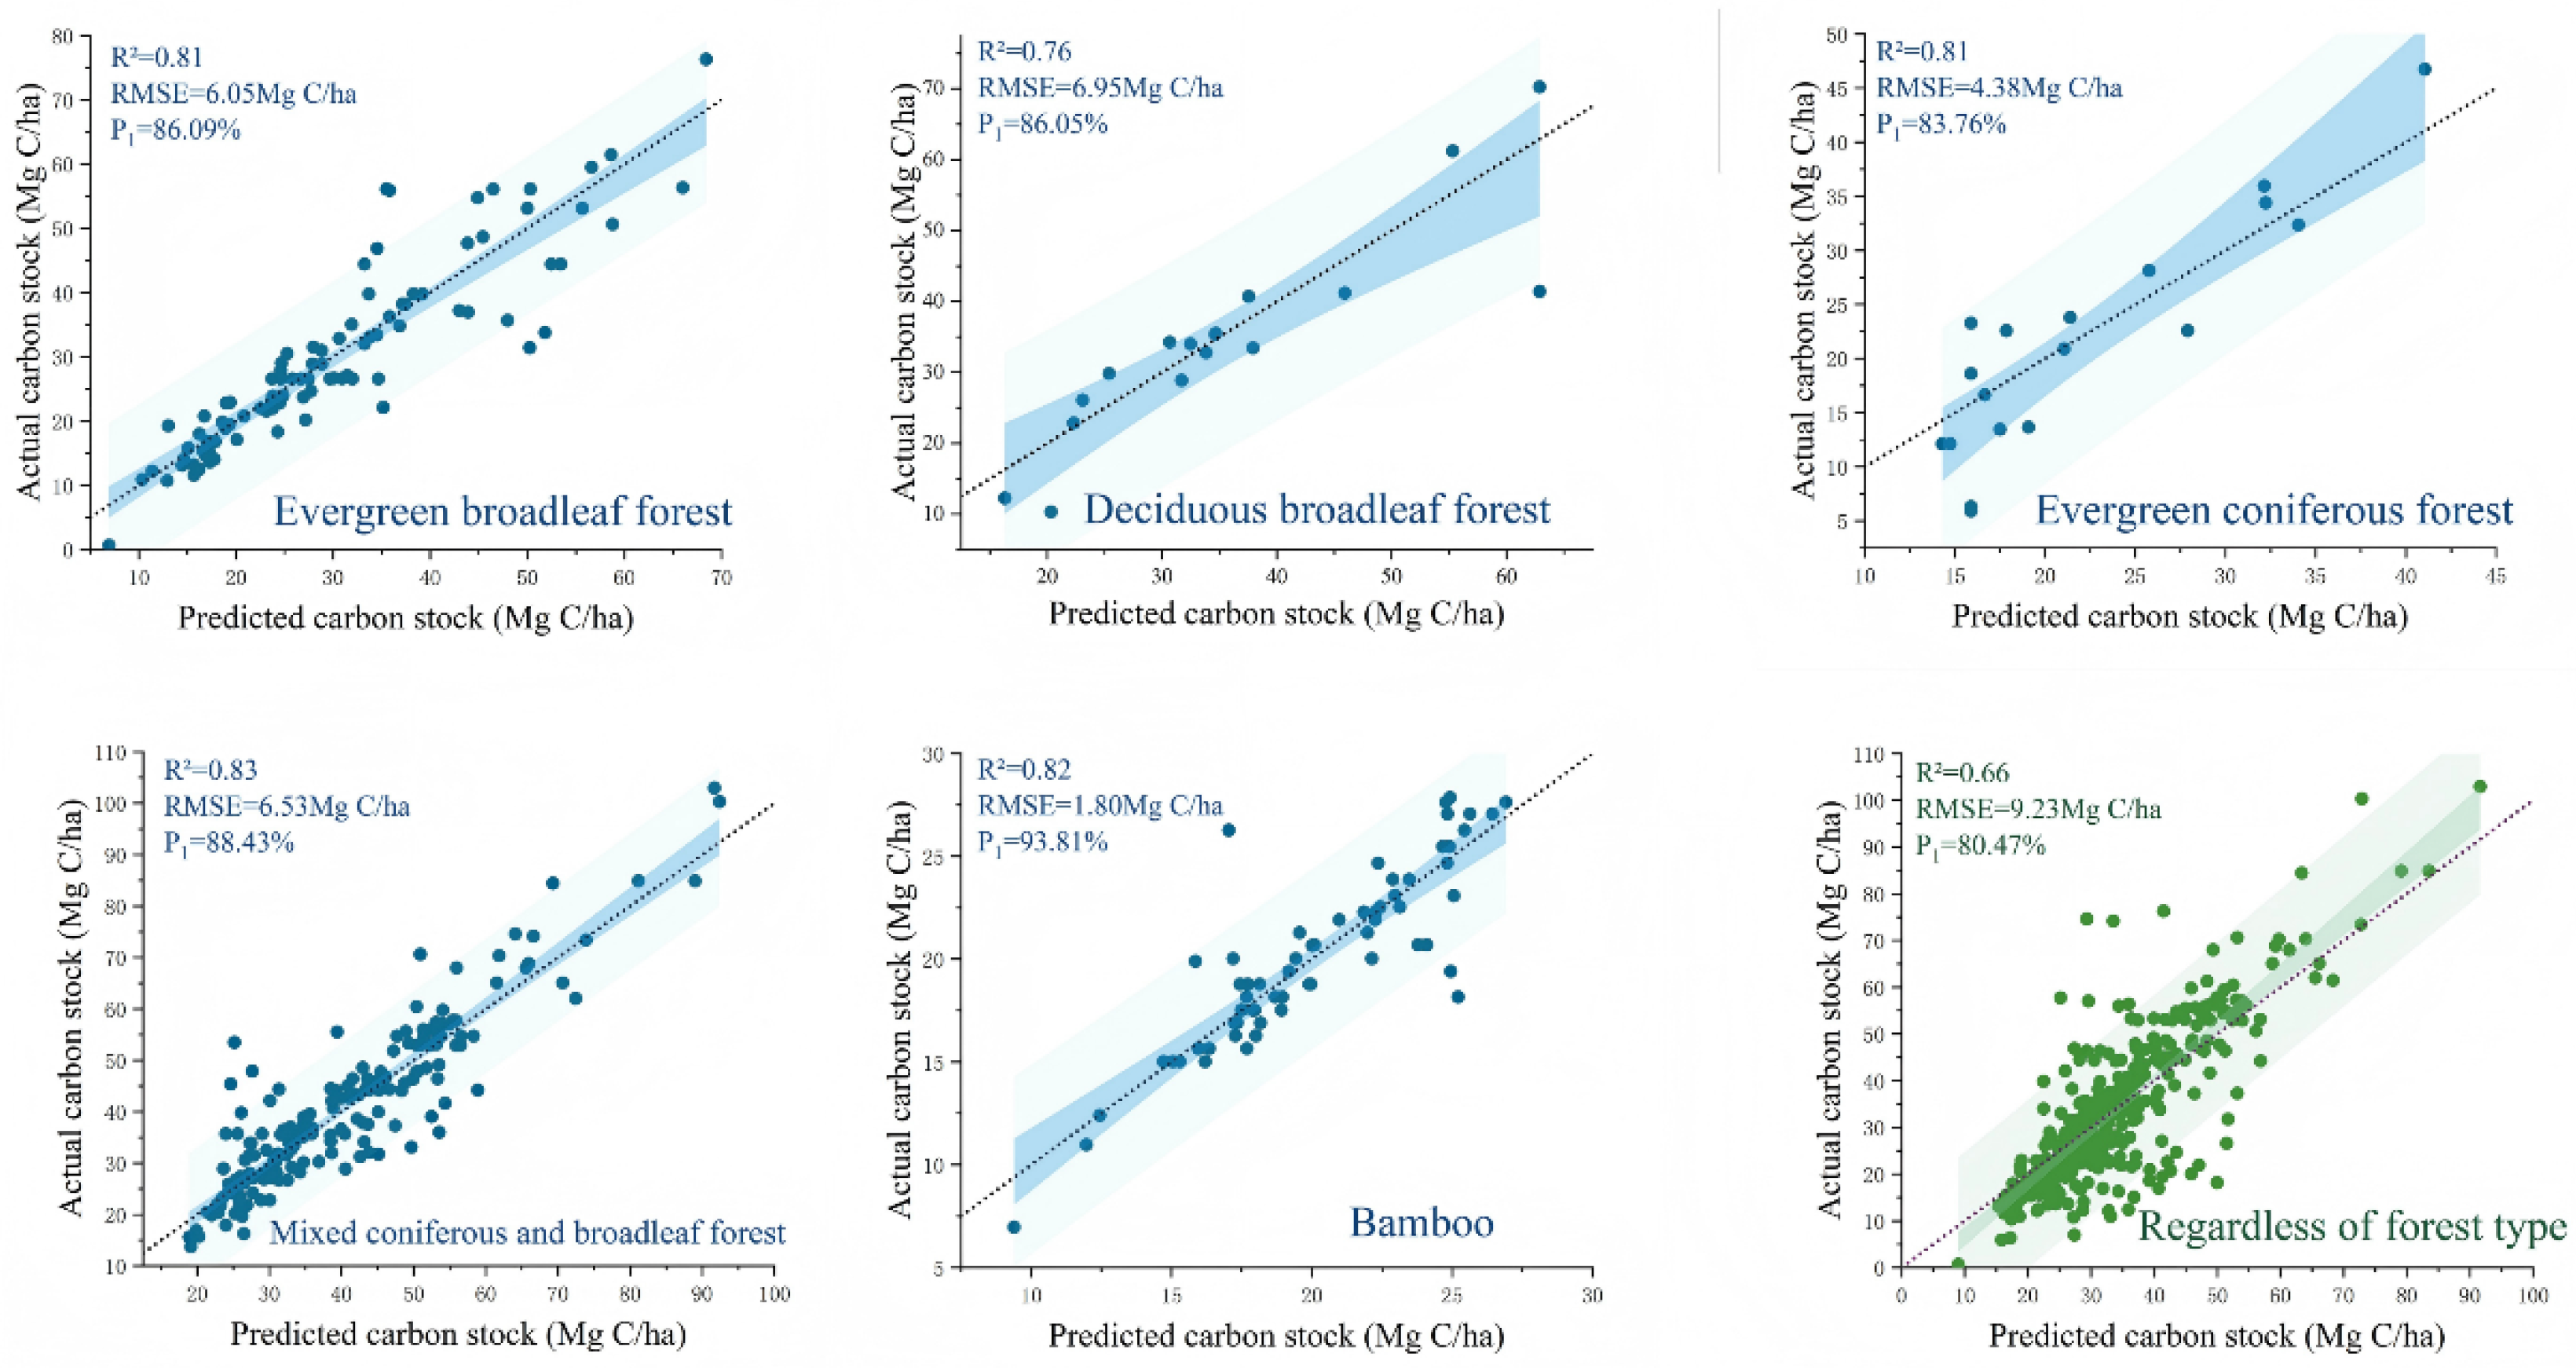
Figure 6.
Spatial distribution of carbon stocks for ICESat-2 forest photons in Hangzhou.
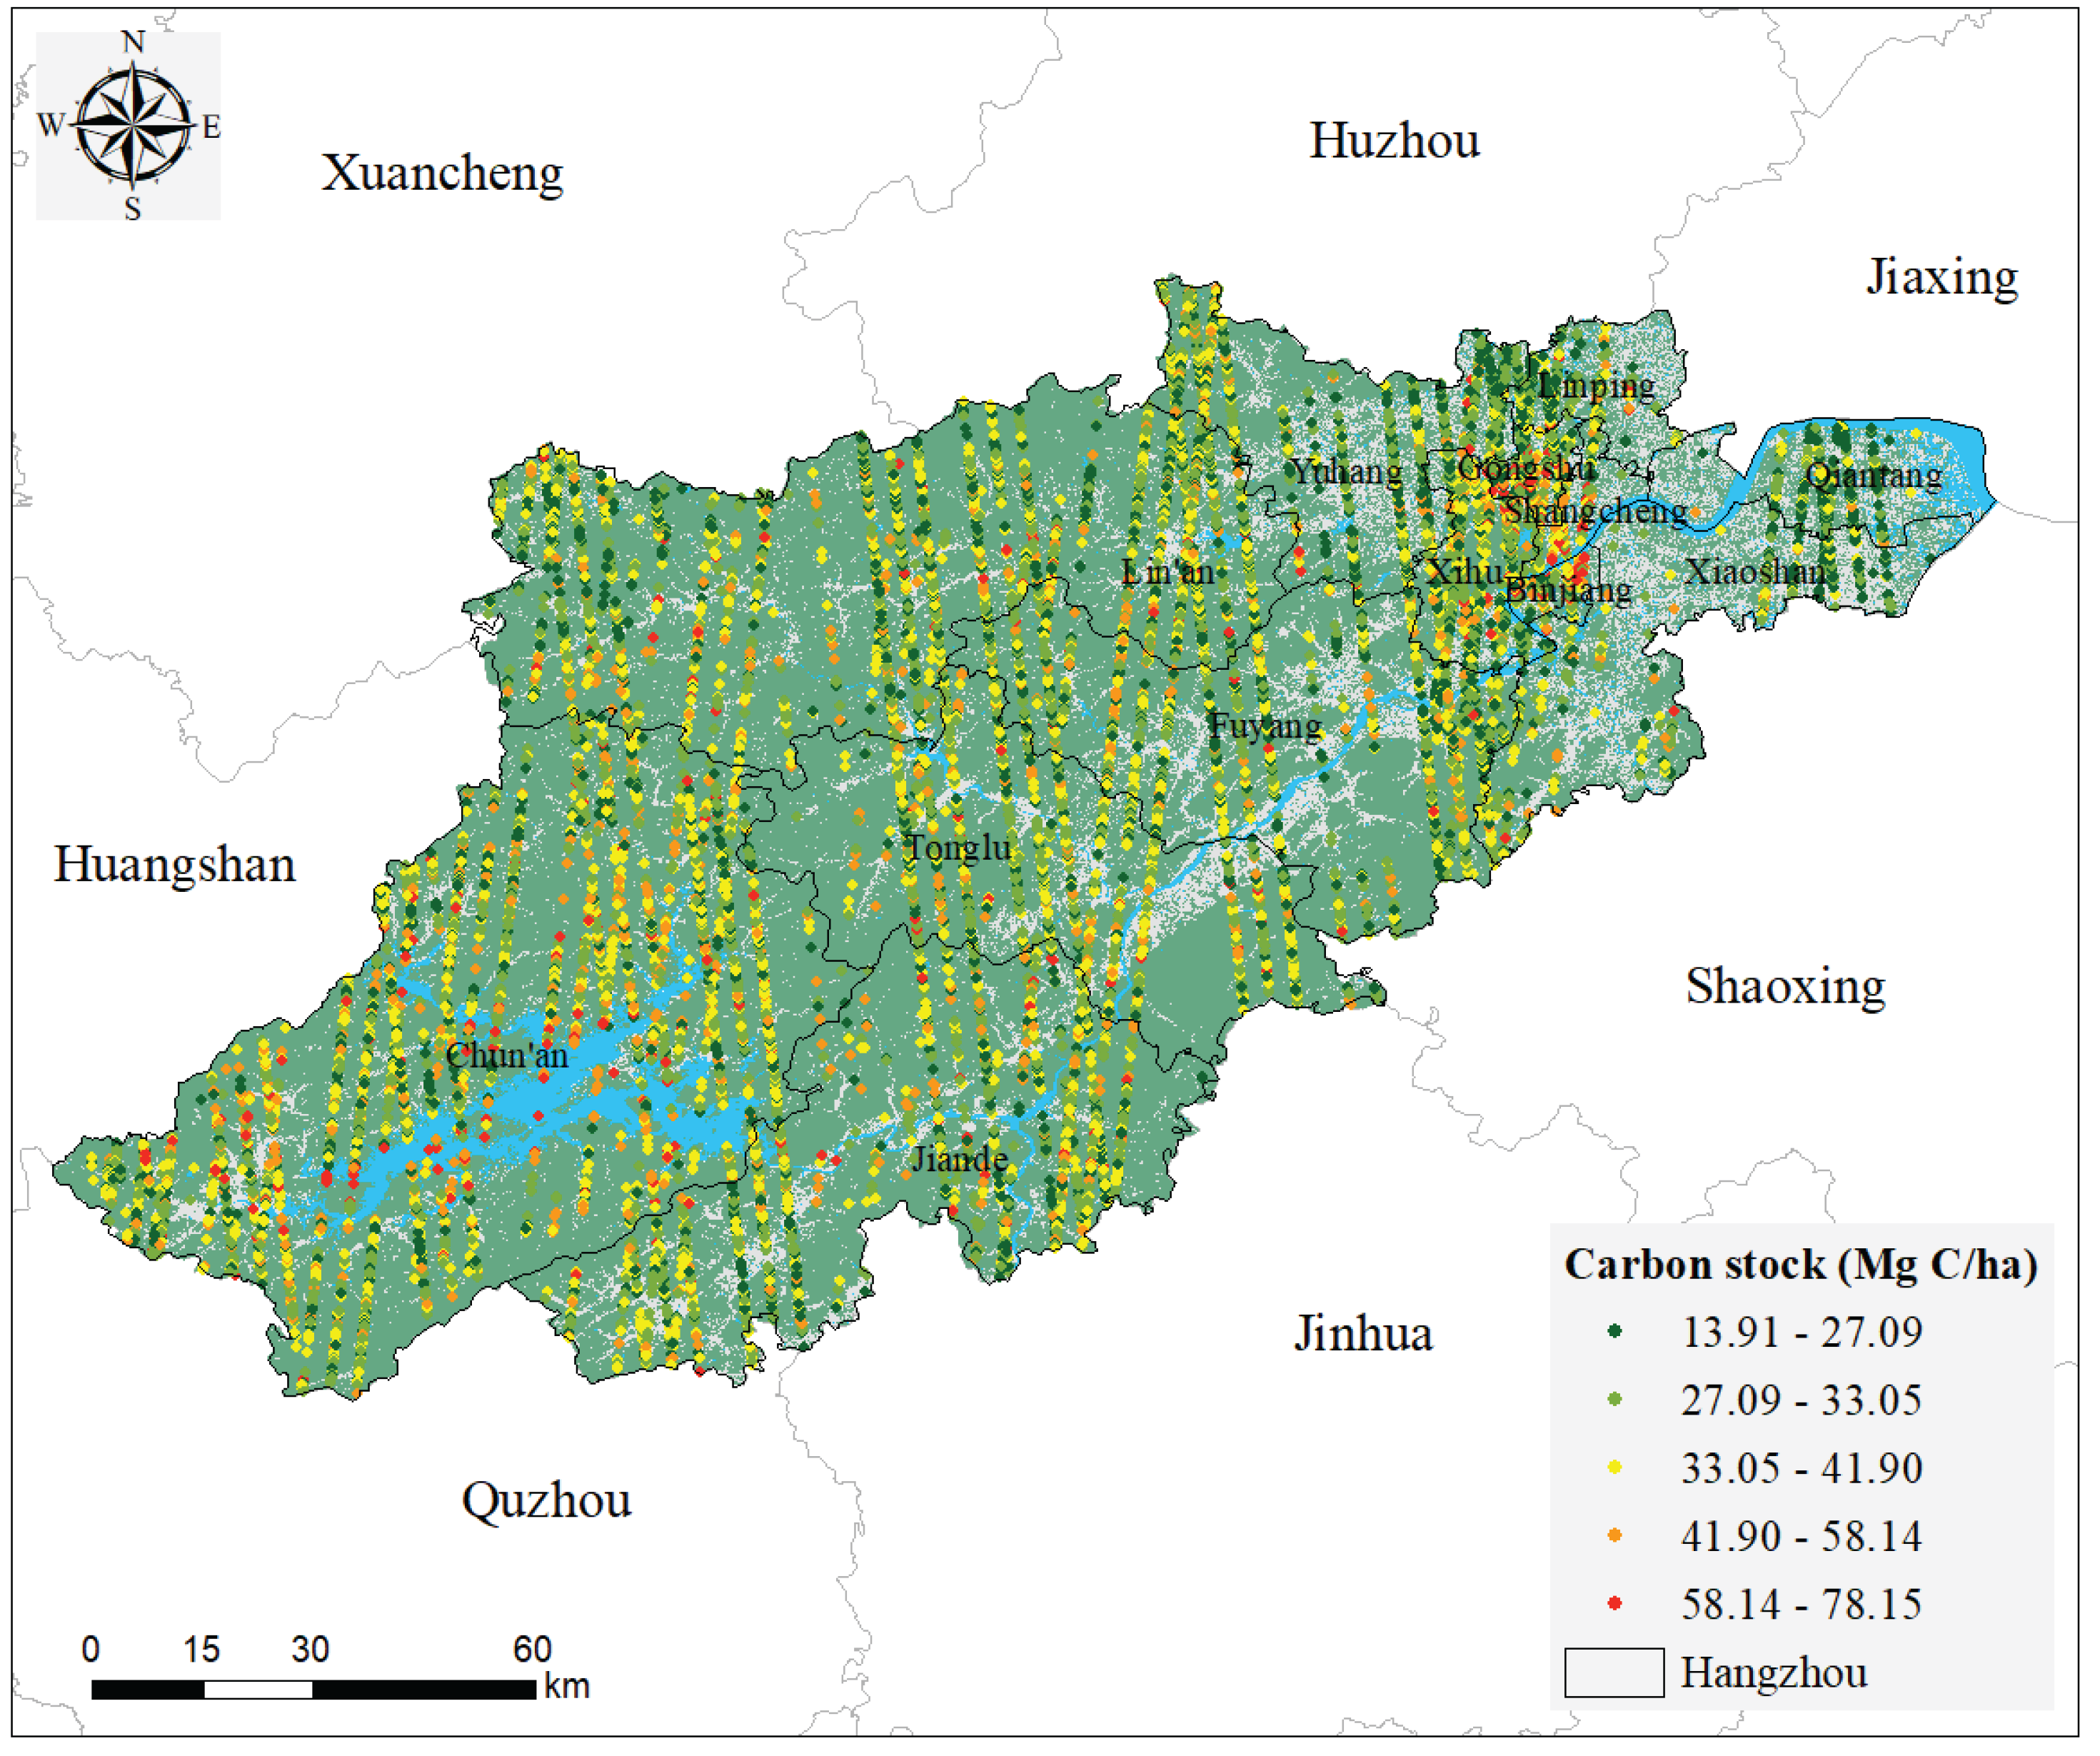

Table 1.
ICESat-2/ATL08 data parameter information used in this study.
| Label | Full name | Unit | Description |
|---|---|---|---|
| latitude | latitude | degree | Latitude of the center-most signal photon within each segment. |
| longitude | longitude | degree | Longitude of the center-most signal photon within each segment. |
| canopy_h_metrics | Canopy height metrics | meters | Relative canopy height percentiles at 5% intervals from 10% to 95% are denoted as RH10–RH95. Relative canopy heights have been computed by differencing the canopy photon height from the estimated terrain surface. |
| h_max_canopy | Maximum canopy height | meters | Maximum of individual relative canopy heights within segment. |
| h_mean_canopy | Mean canopy height | meters | Mean of individual relative canopy heights within segment. |
| h_min_canopy | Minimum canopy height | meters | Minimum of individual relative canopy heights within segment. |
| h_canopy | Height canopy | meters | The 98th percentile of the relative canopy height for the segment above the estimated terrain surface. |
| terrain_slope | segment terrain slope |
1 | The along-track slope of terrain, within each segment; computed by a linear fit of terrain classified photons. Slope is in units of delta height over delta along track distance. |
| h_canopy_uncertainty | segment canopy height uncertainty | meters | Uncertainty of the relative canopy heights for the segment. Incorporates all systematic uncertainties as well as uncertainty from errors of identified photons. |
| sc_orient | Spacecraft Orientation | 1 | This parameter tracks the spacecraft orientation between forward, backward and transitional flight modes. (Meanings: [012]) (Values: [‘backward’, ‘forward’, ‘transition’]) |
Table 2.
Hyperparameter to be optimized for the Random Forest model.
| Parameters | Search ranges | Descriptions |
|---|---|---|
| n_estimators | Integers between 50 and 3000, with 60 equally spaced values | Number of decision trees |
| max_features | [‘sqrt’, ‘log2’, None] | Maximum number of features considered at each split |
| max_depth | Integers between 10 and 500, with 50 equally spaced values, plus None as an additional candidate. | Maximum depth of each decision tree |
| min_samples_split | [2,5,10] | Minimum number of samples required to split an internal node |
| min_samples_leaf | [1,2,4,8] | Minimum number of samples required at a leaf node |
Table 3.
The optimized hyperparameters for each Random Forest model.
| Forest types | n_estimators | max_features | max_depth | min_samples_split | min_samples_leaf |
|---|---|---|---|---|---|
| Non-stratified model | 350 | Sqrt | 390 | 10 | 2 |
| Evergreen broadleaved | 250 | None | 300 | 5 | 4 |
| Deciduous broadleaved | 400 | sqrt | None | 5 | 1 |
| Evergreen coniferous | 950 | None | 200 | 5 | 1 |
| Mixed forest | 300 | None | 50 | 5 | 4 |
| Bamboo | 700 | Log2 | 170 | 10 | 4 |
Table 4.
Comparison of model accuracy before and after forest classification and hyperparameter optimization.
Table 4.
Comparison of model accuracy before and after forest classification and hyperparameter optimization.
| Forest types | Before hyperparameter optimization | After hyperparameter optimization | ||||
|---|---|---|---|---|---|---|
| R² | RMSE (Mg C/ha) |
P1 | R² | RMSE (Mg C/ha) |
P1 | |
| Non-stratified model | 0.60 | 10.00 | 77.20% | 0.66 | 9.23 | 80.47% |
| Evergreen broadleaf | 0.75 | 7.12 | 82.61% | 0.81 | 6.05 | 86.09% |
| Deciduous broadleaf | 0.64 | 8.64 | 84.29% | 0.76 | 6.95 | 86.05% |
| Evergreen coniferous | 0.67 | 5.82 | 79.64% | 0.81 | 4.38 | 83.76% |
| Mixed forest | 0.69 | 8.88 | 83.19% | 0.83 | 6.53 | 88.43% |
| Bamboo | 0.63 | 2.18 | 90.71% | 0.82 | 1.80 | 93.81% |
Disclaimer/Publisher’s Note: The statements, opinions and data contained in all publications are solely those of the individual author(s) and contributor(s) and not of MDPI and/or the editor(s). MDPI and/or the editor(s) disclaim responsibility for any injury to people or property resulting from any ideas, methods, instructions or products referred to in the content. |
© 2026 by the authors. Licensee MDPI, Basel, Switzerland. This article is an open access article distributed under the terms and conditions of the Creative Commons Attribution (CC BY) license (http://creativecommons.org/licenses/by/4.0/).
Copyright: This open access article is published under a Creative Commons CC BY 4.0 license, which permit the free download, distribution, and reuse, provided that the author and preprint are cited in any reuse.