

Submitted:
06 July 2026
Posted:
07 July 2026
You are already at the latest version
Abstract
Rapid urbanization and inadequate sanitation infrastructure threaten water security in many sub-Saharan African cities. This study presents the first integrated assessment of groundwater, surface water, and wastewater quality in Bangui, Central African Repub-lic, using physicochemical, trace metal, and microbiological indicators. A total of 28 sampling sites were analyzed using standardized methods, including ion chromatog-raphy, ICP-OES, ICP-MS, and membrane filtration. Results revealed a clear contamina-tion gradient. Wastewater showed the highest electrical conductivity, turbidity, chlo-ride concentrations, and microbial loads, reaching 2.41 × 10⁶ CFU/100 mL for total coli-forms and 1.93 × 10⁶ CFU/100 mL for fecal coliforms. Groundwater exhibited high ni-trite levels and low dissolved oxygen, indicating vulnerability to sewage infiltration. Surface waters were characterized by high turbidity and widespread fecal contamina-tion despite relatively good oxygenation. In contrast, trace metal concentrations gener-ally remained below World Health Organization guideline values. Geochemical anal-yses identified distinct elemental signatures for each water type. Microbial contamina-tion emerged as the dominant factor affecting water quality. High fecal coliform/fecal streptococci ratios (13.08-22.16) indicated predominantly human-derived pollution linked to untreated wastewater and inadequate sanitation systems. The association between elevated nitrite concentrations and fecal indicators suggests active contami-nation pathways connecting wastewater, surface water, and shallow aquifers. These findings highlight the urgent need for improved wastewater management, groundwa-ter protection, and long-term monitoring to ensure sustainable urban water security in Bangui.
Keywords:
groundwater
; surface water
; wastewater
; microbiological contamination
; trace metals
; urbanization
; water security
; Bangui
; Central African Republic
1. Introduction
Ensuring access to safe water remains one of the major environmental and public health challenges of the twenty-first century, particularly in developing countries where rapid urbanization and inadequate sanitation infrastructure continue to compromise water resources. In response, the United Nations (UN) adopted the 2030 Agenda for Sustainable Development, with Sustainable Development Goal 6 (SDG 6) aiming to ensure the availability and sustainable management of water and sanitation for all. Despite these efforts, sub-Saharan African countries, including the Central African Republic (CAR), continue to face major constraints related to insufficient water infrastructure, rapid population growth, anthropogenic pressures, and socio-political instability.
Anthropogenic activities, including industrial effluents, municipal waste disposal, untreated wastewater discharges, agriculture, and livestock production, introduce a broad range of contaminants into aquatic systems, such as heavy metals, pesticides, pharmaceutical residues, and pathogenic microorganisms [1,2,3,4,5,6,7,8,9,10,11,12]. These pressures are amplified by rapid urbanization, with projections indicating that 68% of the global population will reside in urban areas by 2060 [13]. Consequently, water quality degradation is frequently associated with elevated organic loads, toxic agricultural inputs, and untreated domestic and industrial discharges.
Fecal contamination from human and animal sources represents a major pathway for the introduction of enteric pathogens into aquatic systems, posing significant risks to public health. In many rapidly urbanizing regions, wastewater management remains inadequate to cope with demographic growth and urban expansion, increasing the release of untreated effluents into the environment. Waterborne diseases account for more than 3.4 million deaths annually worldwide [14]. Fecal coliforms (FC) are widely used as indicators of microbiological contamination, highlighting the need for effective water quality monitoring [15,16]. Heavy metals constitute another major class of contaminants of concern. Chronic exposure to metals such as Pb, Cd, and Cr may cause neurological disorders, renal dysfunction, and chronic kidney disease. Metals including Cd, Pb, Cu, Ni, U, As, and Fe are recognized nephrotoxic agents capable of inducing tubular and glomerular injury [17,18,19,20,21].
In Bangui, the capital of the CAR, rapid and largely unplanned urban expansion has intensified environmental pressures. Limited sanitation infrastructure and the proximity of industrial and informal activities facilitate the release of contaminants into surface water and groundwater, the main sources of domestic water supply. The discharge of untreated human and animal waste promotes microbial proliferation and may render water unsafe for consumption. According to the WHO, nearly 450 million people in Africa lack access to safe drinking water, and up to 80% of diseases are linked to contaminated water. In Bangui, untreated wastewater is frequently discharged into natural water bodies, increasing environmental vulnerability and raising concerns regarding ecosystem integrity, fish safety, and recreational water use. Furthermore, a substantial proportion of the population relies directly on untreated groundwater and surface water for daily needs.
Despite the growing dependence of urban populations on groundwater and surface water resources in Central Africa, information on the occurrence, sources, and pathways of water contamination remains scarce. In Bangui, rapid demographic growth, inadequate sanitation infrastructure, uncontrolled wastewater disposal, and increasing anthropogenic pressures have likely enhanced the vulnerability of both surface and groundwater systems. To our knowledge, this study provides the first integrated assessment of physicochemical properties, trace metal fingerprints, and microbiological contamination across groundwater, surface water, and wastewater systems in the Central African Republic.
The objectives were to (i) assess the physicochemical quality of groundwater, surface water, and wastewater in Bangui; (ii) determine the occurrence and distribution of trace metals among these water compartments; (iii) evaluate the extent of microbiological contamination and identify potential contamination sources; and (iv) examine interactions between wastewater discharges, surface water, and groundwater systems. We hypothesized that untreated wastewater is the primary driver of microbial contamination within the urban hydrological network, that groundwater quality is increasingly affected by urban infiltration processes, and that trace metal concentrations are mainly controlled by natural geochemical conditions rather than severe anthropogenic contamination. By combining chemical and microbiological indicators, this study provides the first comprehensive baseline assessment of urban water quality in Bangui and contributes to a broader understanding of water security challenges in rapidly urbanizing tropical African cities.
2. Materials and Methods
The Materials and Methods should be described with sufficient details to allow others to replicate and build on the published results. Please note that the publication of your manuscript implicates that you must make all materials, data, computer code, and protocols associated with the publication available to readers. Please disclose at the submission stage any restrictions on the availability of materials or information. New methods and protocols should be described in detail while well-established methods can be briefly described and appropriately cited.
2.1. Study Area
Bangui, the capital of the CAR, is located on the right bank of the Oubangui River and covers an area of approximately 60 km². The city is bordered by Bégoua to the north, Bimbo to the west, and Zongo (Democratic Republic of Congo) to the south, across the Oubangui River. With an estimated population of approximately 1.5 million inhabitants, Bangui accounts for nearly 25% of the national population [22]. The region is characterized by a Guinean forest climate, with a rainy season extending from April to October and a dry season from December to February - March. Rainfall follows a bimodal pattern, with peaks occurring during June–July and August–October. Meteorological records from the Bangui-Mpoko station indicate a mean annual precipitation of 1,434 mm over the period 2000-2017, with interannual variability ranging from 1,197 mm (2012) to 1,935 mm (2001). Monthly rainfall exceeds 120 mm from May to October, with a maximum in August (199 mm) and a minimum in January (20 mm). Figure 1 illustrates the study area and the location of sampling sites. The characteristics of each sampling site are presented in Table 1.
2.2. Sampling
Sampling sites were selected to represent the main water resources used by the population of Bangui, including traditional wells, boreholes, surface waters (rivers and tributaries), and wastewater. A total of 28 sampling locations were identified. Site selection was based on water use intensity and proximity to potential pollution sources, such as densely populated areas, markets, hospitals, and industrial zones. Sampling campaigns were conducted in October 2025, during which 28 water samples were collected. Samples were stored at 4 °C and transported to the laboratory for analysis. The geographic coordinates of all sampling points were recorded using a GPS device, enabling spatial mapping of the sampling locations (Figure S1). Some physico-chemical parameters were measured in situ at each sampling site. Field measurements were performed using calibrated portable instruments. Temperature, pH, electrical conductivity, and dissolved oxygen were recorded using a Multi 3630 IDS multiparameter probe (WTW). Turbidity was determined using a HACH 2100Q turbidimeter. Geographical coordinates were recorded using a Garmin GPSMAP 64st device to enable spatial analysis. Hydrogeological parameters were assessed using a piezometric probe and a 100 m graduated measuring tape (1 cm resolution), allowing the determination of static water levels and water column height in wells.
2.3. Physico-Chemical and Trace Metal Analyses
In the laboratory, 15 mL aliquots were filtered through 0.45 µm Whatman glass fiber filters and acidified with 50 µL of concentrated nitric acid (65%, VWR, AnalaR Normapur) prior to analysis. Major elements were quantified using an inductively coupled plasma–optical emission spectrometry system (ICP-OES 5110 Dual View, Agilent Technologies). Magnesium (Mg), aluminum (Al), barium (Ba), and zinc (Zn) were analyzed in axial mode, whereas calcium (Ca), potassium (K), and sodium (Na) were determined in radial mode. Trace metal elements including Cr, Mn, Co, Ni, Cu, Pb, Cd and others were determined using inductively coupled plasma–mass spectrometry (ICP-MS 7850, Agilent Technologies). Anions (nitrate, nitrite, chloride, and sulfate) were analyzed by ion chromatography (Dionex ICS-3000, Thermo Fisher Scientific) using an ion-exchange column with 30 mM KOH as the eluent at a flow rate of 1.1 mL/min. The column temperature was maintained at 30 °C to ensure analytical stability. Quality assurance and quality control (QA/QC) procedures were implemented throughout sampling and analytical workflows. For chemical analyses, certified reference materials were used to assess analytical accuracy. ICP-OES measurements, validated using the EnviroMAT EU-H standard (Analytichem), yielded recoveries ranging from 86% (Na) to 114% (Ca). ICP-MS accuracy was verified using the SLRS-6 certified reference material (National Research Council Canada), with recoveries ranging from 98% (Ni) to 112% (Pb). Internal standards (Re for Pb and Ge for other elements) were added to correct for instrumental drift. ICP-MS analyses were conducted in helium collision mode using kinetic energy discrimination to minimize spectral interferences. Limits of detection for all analyzed elements are provided in Table 2 and Table 3.
2.4. Microbiological Analyses
Microbiological analyses were performed following standard methods [23] using membrane filtration techniques. A 100 mL aliquot of each water sample was filtered through a sterile 0.45 µm membrane filter, which was subsequently placed on selective culture media. Total and fecal coliforms were enumerated after incubation at 37 °C for 24-48 h on lactose agar supplemented with TTC. Fecal enterococci were cultured on Slanetz and Bartley agar and confirmed on Bile Esculin Azide agar. Results were expressed as colony-forming units per 100 mL (CFU/100 mL). All microbiological procedures were conducted under aseptic conditions using sterilized equipment. Quality control measures included analytical blanks and duplicate samples to assess contamination and reproducibility. Culture media quality was verified prior to use, and reference bacterial strains were periodically employed to ensure analytical performance. Only plates containing 30-300 colonies were considered for enumeration. Incubation conditions were strictly controlled using calibrated equipment. Where necessary, confirmatory biochemical tests (e.g., indole test using Kovacs reagent) were performed according to standardized protocols to ensure accurate identification.
3. Results
3.1. Physicochemical Characterization of Water
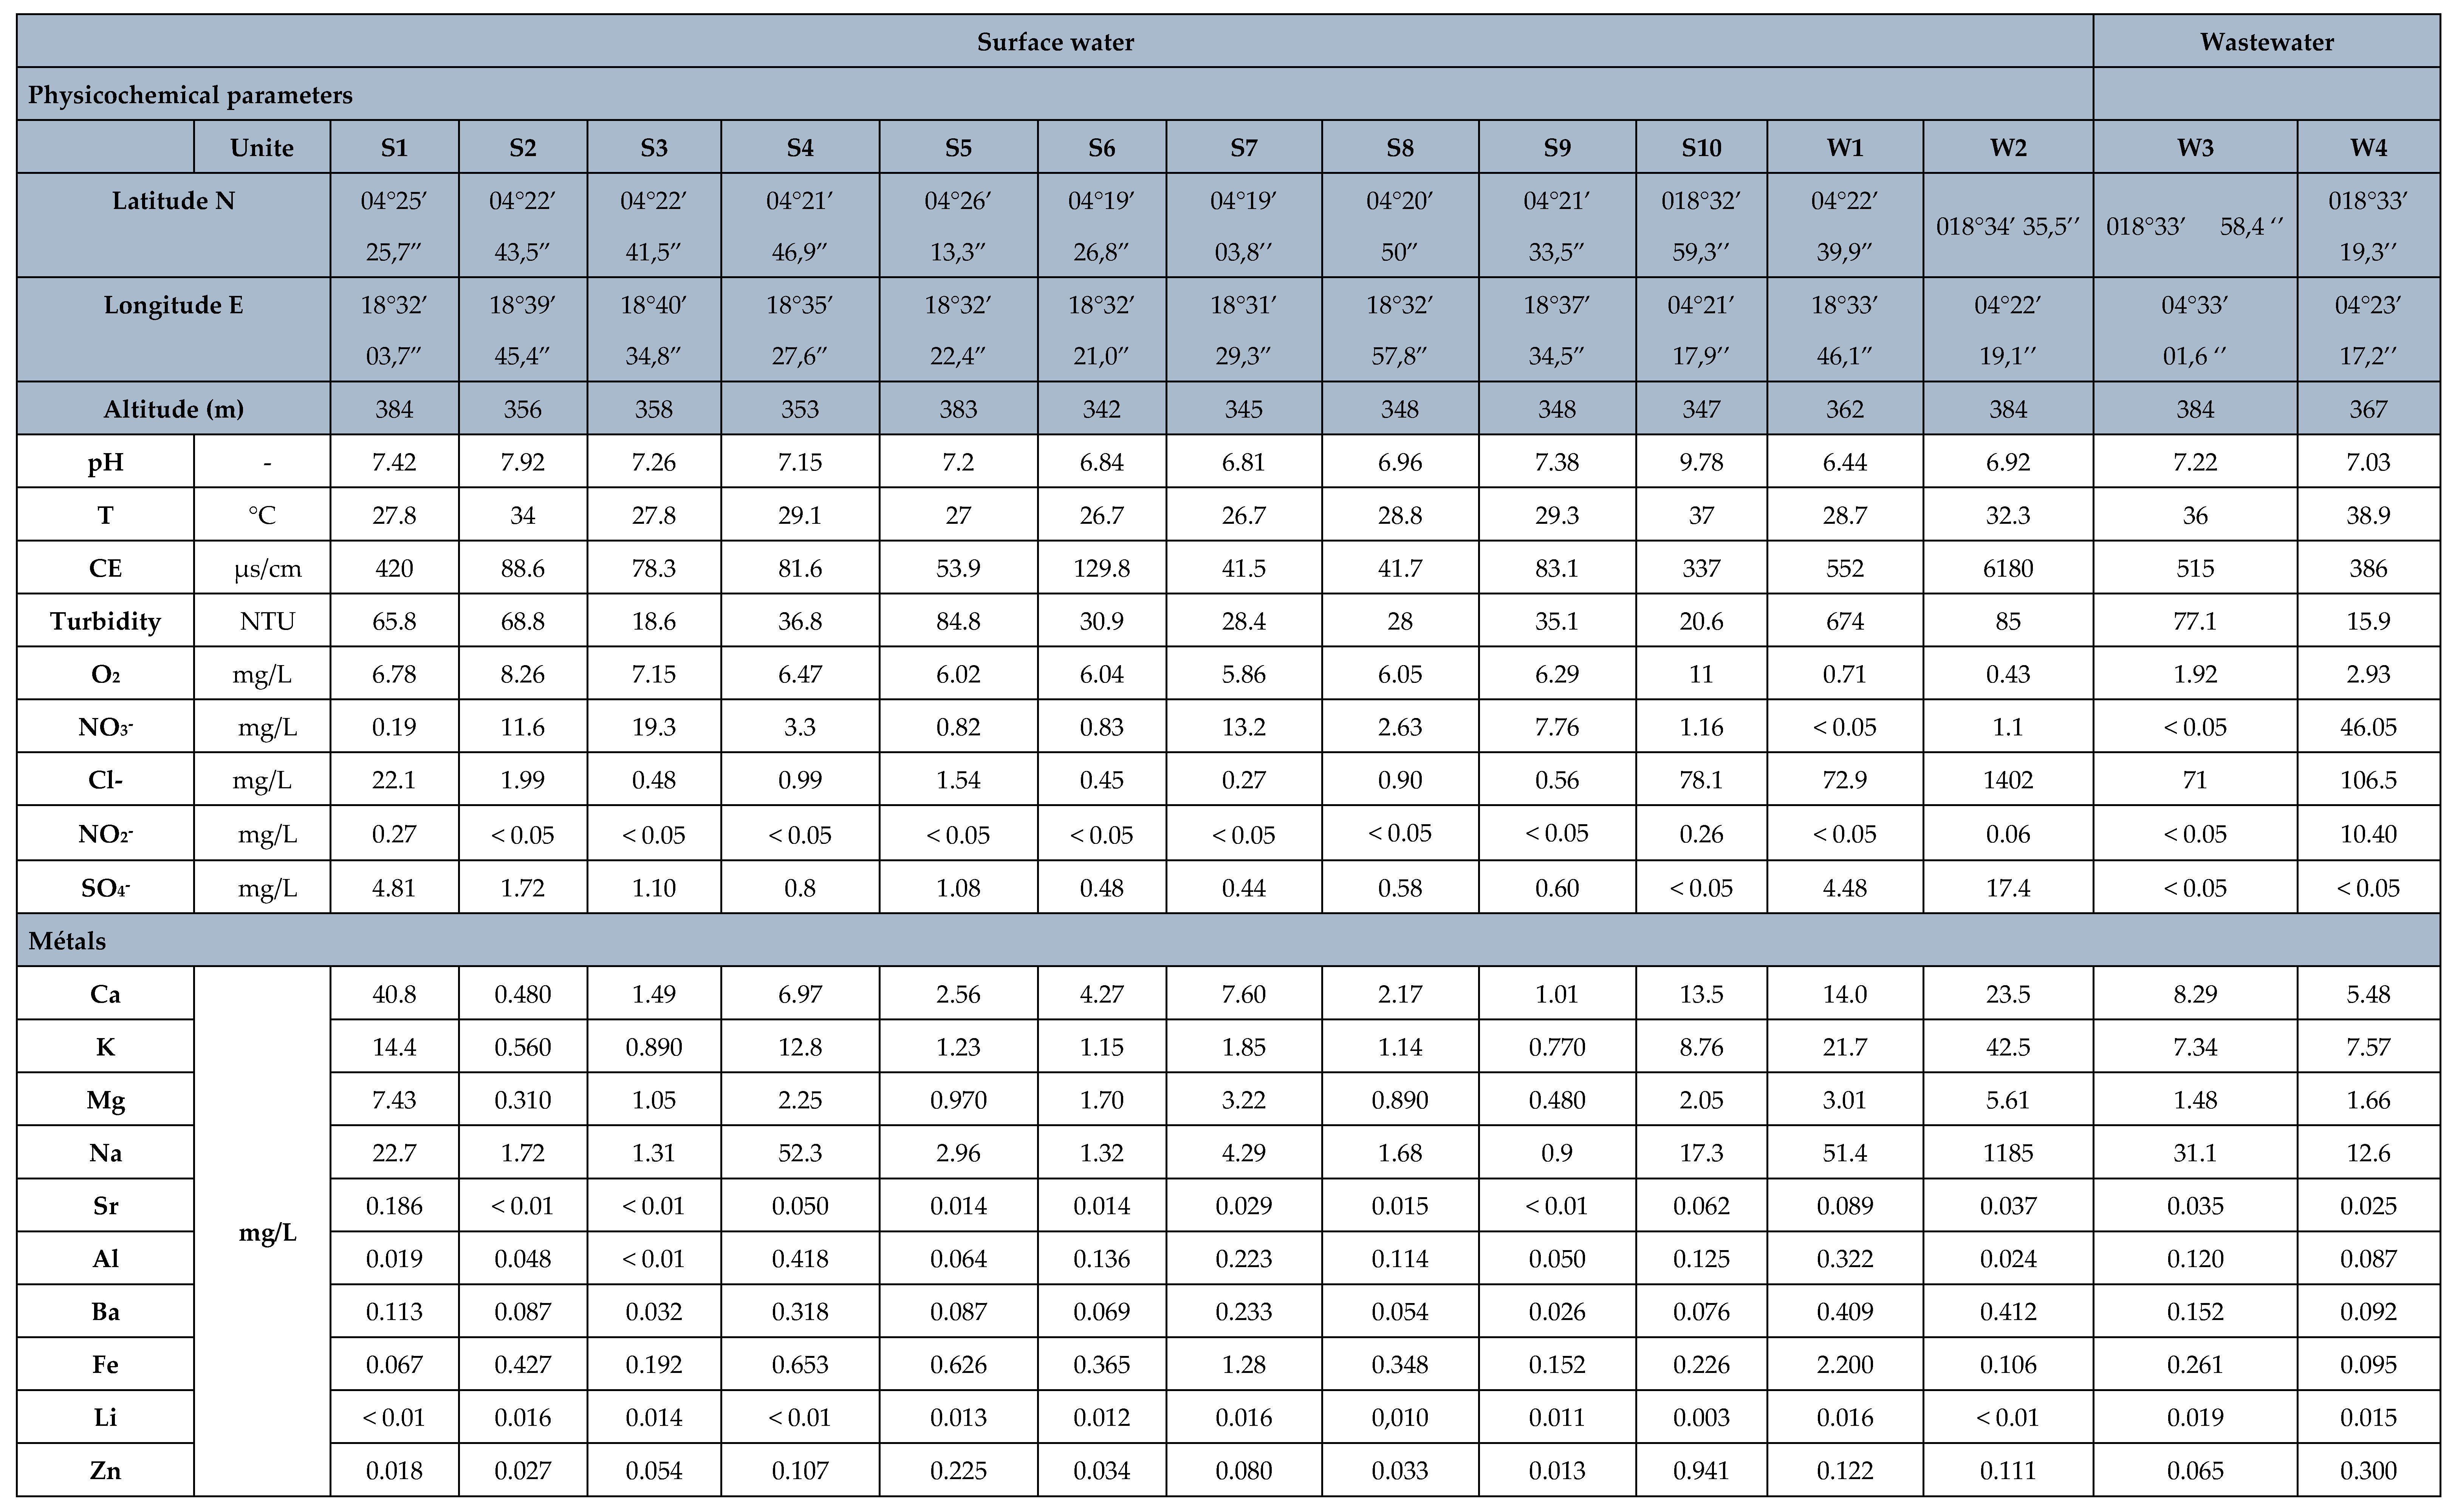
The evaluation of physicochemical parameters is a fundamental component of water quality assessment, as these variables directly influence aquatic ecosystem functioning and determine the suitability of water for domestic, agricultural, and environmental purposes. In the present study, key physicochemical parameters were analyzed, including pH, temperature, electrical conductivity (EC), turbidity, dissolved oxygen (DO), nitrate (NO₃⁻), nitrite (NO₂⁻), chloride (Cl⁻), and sulfate (SO₄²⁻). The physicochemical characteristics of surface water, groundwater, and wastewater samples are presented in Table 2 with the aveary values in Table 3 and compared with the guideline values recommended by the World Health Organization (WHO). The results reveal significant variations among water sources, reflecting differences in environmental conditions and anthropogenic influences.
The results highlight significant variability in water quality across different compartments. Wastewater represents the most contaminated system, followed by groundwater, while surface water is comparatively less impacted but still affected by anthropogenic inputs.
3.1.1. Temperature
Water temperatures exceeded the WHO reference value of 25 °C in all water sources, with average values of 29.15 ± 2.00 °C, 31.00 ± 3.40 °C, and 32.48 ± 3.98 °C for surface water, groundwater, and wastewater, respectively. These elevated temperatures are characteristic of tropical environments and may influence biological activity, oxygen solubility, and microbial growth. These findings are consistent with studies conducted in West and Central Africa, where surface water temperatures typically range between 27 and 32 °C in urban environments [24].
3.1.2. pH
The pH values ranged from 5.79 ± 0.66 in groundwater to 7.32 ± 0.50 in surface water. Surface water and groundwater exhibited pH values within the WHO recommended range (5.5-9.0), except for slightly acidic groundwater. This acidity may increase metal solubility and corrosion processes. The slightly alkaline nature of surface waters likely reflects inputs from domestic, industrial and urban effluents, as reported in similar African urban system in Nigeria and Benin by Lebbie et al. [24].

Table 2.
Concentration of the physicochemical characteristics, metals and microbiological indocators in each sampling sites in groundwater (14 studied sites), surface water (10 studied sites) and wastewater (4 studied sites).
Table 2.
Concentration of the physicochemical characteristics, metals and microbiological indocators in each sampling sites in groundwater (14 studied sites), surface water (10 studied sites) and wastewater (4 studied sites).
| Groundwater | |||||||||||||||
|---|---|---|---|---|---|---|---|---|---|---|---|---|---|---|---|
| Each studied site | G1 | G2 | G3 | G4 | G5 | G6 | G7 | G8 | G9 | G10 | G11 | G12 | G13 | G14 | |
| Well depth (m) | 6.70 | 4.40 | 7.10 | 2.24 | 12.40 | 9.91 | 4.6 | 8.0 | 5.0 | 5.7 | 5.9 | 6.6 | 1.65 | ||
| Static water level (m) | 3 | 1.85 | 5.96 | 0.90 | 7.63 | 6.65 | 2.2 | 2.8 | 3.8 | 4.3 | 2.4 | 2.8 | 1.1 | ||
| Latitude N |
04°27’ 01,3” |
04°23’ 20,6” |
04°24’ 19,1” |
04°22’ 32,4” |
04°24’ 47,9” |
04°27’ 36,9” |
04°24’ 08,1” |
018°32’ 27,4’’ |
018°32’ 53,6’’ |
018°29’ 48,1’’ |
018°32’ 32,1’’ |
018°304’ 36,3’’ | 018°32’ 03,4’’ |
018°33’ 25,2’’ |
|
| Longitude E |
18°32’ 25,5” |
18°32’ 28,5” |
18°34’ 50,9” |
18°33’ 26,5” |
18°324 31,3” |
18°31’ 56,0” |
18°32’ 57,2” |
04°19’5 4,0’’ |
04°20’ 58,7’’ |
04°23’ 08,2’’ |
04°24’ 02,9’’ |
04° 27’ 50,8’’ | 04° 19’ 28,7’’ |
04°21’ 51,3’’ |
|
| Altitude (m) | 358 | 360 | 398 | 359 | 388 | 399 | 374 | 350 | 345 | 359 | 366 | 366 | 354 | 351 | |
| Physicochemical parameters | |||||||||||||||
| Unite | |||||||||||||||
| pH | - | 5.18 | 5.9 | 4.02 | 6.02 | 4.45 | 5.79 | 4.89 | 6.23 | 6.55 | 6.31 | 6.5 | 6.16 | 6.74 | 6.3 |
| T | °C | 28.3 | 28.6 | 29.1 | 28.1 | 27.9 | 27.4 | 28.1 | 36 | 37.8 | 33.7 | 28.7 | 29 | 34.9 | 36.4 |
| CE | µs/cm | 785 | 958 | 62.3 | 354 | 141.5 | 208 | 368 | 437 | 574 | 48.6 | 540 | 115.4 | 93.8 | 585 |
| Turbidity | NTU | 20.1 | 39.9 | 12.3 | 42.4 | 1.05 | 9.76 | 3.45 | 8.41 | 26.1 | 203 | 9.88 | 19.9 | 94.4 | 85.8 |
| O2 | mg/L | 4.65 | 4.38 | 4.04 | 4.02 | 4.19 | 4.64 | 3.17 | 3.37 | 3.64 | 4.84 | 3.29 | 4.25 | 2.27 | 2.93 |
| NO3- | mg/L | < 0.05 | < 0.05 | < 0.05 | 1.18 | 49 | < 0.05 | < 0.05 | 8.83 | 34.91 | 3.52 | 30.57 | < 0.05 | 2.28 | < 0.05 |
| Cl- | mg/L | 156.2 | 163.3 | 17.75 | 35.5 | 6.69 | 42.6 | 28.4 | 209.45 | 198.8 | 35.5 | 113.6 | 77.66 | 56.8 | 177.5 |
| NO2- | mg/L | < 0.05 | < 0.05 | < 0.05 | < 0.05 | < 0.05 | < 0.05 | < 0.05 | 1,99 | 7.88 | 0.8 | 6.9 | < 0.05 | 0.52 | < 0.05 |
| SO4- | mg/L | < 0.05 | < 0.05 | < 0.05 | 16.6 | 0.37 | < 0.05 | < 0.05 | < 0.05 | < 0.05 | < 0.05 | < 0.05 | < 0.05 | < 0.05 | < 0.05 |
| Metals | |||||||||||||||
| Ca |
mg/L |
8.49 | 24.8 | 1.62 | 16.6 | 6.01 | 3.25 | 8.28 | 6.81 | 5.81 | 1.31 | 1.38 | 5.66 | 0.560 | 29.6 |
| K | 25.0 | 28.4 | 2.95 | 20.6 | 9.73 | 3.47 | 16.7 | 5.82 | 14.4 | 0.860 | 24.5 | 7.80 | 1.21 | 24.0 | |
| Mg | 3.53 | 11.7 | 0.86 | 3.52 | 2.62 | 2.49 | 3.46 | 1.83 | 1.82 | 0.180 | 0.720 | 1.33 | 0.190 | 7.55 | |
| Na | 122 | 134 | 3.73 | 31.7 | 16.8 | 11.0 | 36.4 | 24.5 | 83.4 | 1.17 | 46.5 | 18.2 | 2.59 | 78.6 | |
| Sr | 0.063 | 0.144 | 0.011 | 0.090 | 0.039 | 0.025 | 0.048 | 0.123 | 0.047 | < 0.01 | < 0.01 | 0.028 | < 0,01 | 0,183 | |
| Al | 0.061 | 0.014 | 0.045 | < 0.01 | 0.403 | 0.229 | 0.622 | 0.136 | 0.336 | 0.277 | 0.024 | 0.446 | 0.120 | 0.121 | |
| Ba | 0.238 | 0.129 | 0.050 | 0.118 | 0.316 | 0.149 | 0.306 | 1.78 | 0.519 | 0.058 | 0.072 | 0.182 | 0.037 | 0.243 | |
| Fe | < 0,01 | < 0.01 | < 0.01 | < 0.01 | 0.019 | 0.044 | 0.010 | 0.017 | 0,366 | 0.061 | 0.006 | 0.377 | 0,022 | 0.177 | |
| Li | 0.015 | < 0.01 | 0.015 | 0.014 | < 0.01 | 0.017 | < 0.01 | 0.019 | 0.012 | 0.014 | 0.015 | < 0.01 | 0.014 | 0.014 | |
| Zn | 0.051 | 0.055 | 0.032 | 0.028 | 0.053 | 0.107 | 0.028 | 0.065 | 0.104 | 0.032 | 0.019 | 3.217 | 0.048 | 0.447 | |
| Ti | µg/L | <0.197 | <0.197 | <0.197 | <0.197 | <0.197 | <0.197 | <0.197 | <0.197 | 0,871 | <0.197 | <0.197 | 22.0 | <0.197 | 2.07 |
| V | 0.399 | 0.753 | 0.069 | 0.018 | 0.021 | <0.010 | 0.067 | 0.023 | 1.43 | 0.313 | 0.163 | 1.04 | 0.528 | 0.267 | |
| Cr | 0.175 | 0.108 | 0.251 | 0.067 | 0.121 | 0.250 | 0.100 | 0.178 | 0.967 | 0.204 | 0.135 | 2.08 | 0.205 | 1.00 | |
| Mn | 324 | 186 | 11.70 | 203 | 459 | 103 | 127 | 333 | 136 | 9.90 | 6.43 | 112 | 16.0 | 452 | |
| Co | 8.32 | 1.07 | 1.12 | 0.922 | 11.3 | 5.78 | 2.68 | 78.2 | 13.0 | 0.118 | 0.052 | 2.64 | 0.854 | 7.11 | |
| Ni | 8.13 | 1.62 | 2.29 | 0.638 | 8.05 | 7.69 | 4.22 | 39.3 | 7.70 | 0.417 | 0.396 | 10.00 | 0.808 | 7.95 | |
| Cu | 2.52 | 1.31 | 2.25 | 1.18 | 4.68 | 12,3 | 4.88 | 3.28 | 2.71 | 0.453 | 0.63 | 11.5 | 0.697 | 3.21 | |
| As | 0.105 | 0.121 | <0.028 | 0.132 | 0.107 | 0.119 | 0.131 | 0.028 | 0.354 | <0.028 | 0.040 | 0.290 | <0.028 | 0.344 | |
| Se | 0.107 | 0.117 | <0.044 | 0.088 | 0.047 | <0.044 | 0.107 | 0.074 | 0.045 | <0.044 | 0.055 | 0,048 | <0.044 | 0.186 | |
| Mo | 0.062 | 0.077 | <0.018 | 0.025 | <0.018 | <0.018 | 0.086 | <0.018 | 0.035 | <0.018 | 0.021 | 0,065 | <0.018 | 0.22 | |
| Cd | 0.077 | 0.045 | 0.027 | 0.018 | 0.074 | 0.103 | 0.081 | 0.109 | 0.049 | <0.017 | <0.017 | 0,086 | <0.017 | 0.088 | |
| Sb | 0.064 | 0.081 | 0.016 | 0.037 | 0.023 | 0.051 | 0.071 | 0.018 | 0.077 | 0.031 | 0.029 | 0,059 | <0.012 | 0.141 | |
| Pb | 0.473 | 0.103 | 0.343 | 0.014 | 1.461 | 2.911 | 4.524 | 2.22 | 0.813 | 0.142 | 0.029 | 1.35 | 0.221 | 0.265 | |
| U | 0.049 | 0.039 | 0.033 | 0.013 | 0.076 | 0.205 | 0.166 | 0.086 | 0.080 | 0.016 | 0.011 | 0.049 | 0.019 | 0.048 | |
| Bacteriological indicators | |||||||||||||||
| CT |
UFC/ 100 mL |
300 | 750 | 200 | 8000 | 10 | 10 | 150 | 600 | 750 | 2120 | 150 | 1150 | 1800 | 1200 |
| CF | 200 | 500 | 109 | 7500 | 5 | 8 | 100 | 430 | 585 | 2030 | 100 | 920 | 1200 | 100 | |
| SF | 75 | 165 | 90 | 300 | <LQ | 6 | 5 | 1 | 19 | 70 | 14 | 160 | 30 | 610 | |
| CF/SF | 2.66 | 3.03 | 1.21 | 25 | >5 | 1.33 | 20.00 | 430 | 30.78 | 29 | 7.14 | 5.75 | 40.00 | 0.16 | |
Figure 1.
This is a figure. Schemes follow the same formatting.
3.1.3. Electrical Conductivity (CE)
EC, an indicator of dissolved ions and mineralization, varied considerably among water types. Surface water exhibited the lowest EC (119 ± 82 µS/cm), followed by groundwater (376 ± 239 µS/cm), while wastewater showed markedly higher values (1532 ± 1859 µS/cm) (Table 3 and Figure 2). This pattern reflects the accumulation of dissolved salts derived from domestic wastewater, detergents, food residues and human activities. Groundwater values remained within the WHO recommended range (400–1000 µS/cm) for most sampling locations, whereas wastewater exceeded this range, suggesting a higher level of mineral and pollutant loading. Similar patterns have been observed in major African cities such as Lagos in Nigeria, Abidjan in Cöte d’Ivoire, and Douala in Cameroon, where wastewater conductivity frequently exceeds 1200 µS/cm [25].
Table 3.
Mean concentrations (± SD) of physicochemical parameters in groundwater (14 sampling sites), surface water (10 sampling sites), and wastewater (4 sampling sites), compared with World Health Organization (WHO) guideline values.
Table 3.
Mean concentrations (± SD) of physicochemical parameters in groundwater (14 sampling sites), surface water (10 sampling sites), and wastewater (4 sampling sites), compared with World Health Organization (WHO) guideline values.
| Parameter | LOQ | Unit | WHO Guidelines | Surface water | Groundwater | Wastewater |
|---|---|---|---|---|---|---|
| pH | - | 5.5 ≤ pH ≤ 9 | 7.32 ± 0.5 | 5.79 ± 0.66 | 6.85 ± 0.25 | |
| T | °C | 25 | 29.15 ± 2.00 | 31 ± 3.40 | 32.48 ± 3.98 | |
| CE | µs/cm | 400 < χ < 1000 | 119 ± 82 | 376 ± 239 | 1532 ± 1859 | |
| Turbidity | NTU | ≤ 5 | 43 ± 18 | 41 ± 37 | 174 ± 200 | |
| O2 | mg/L | 5 mg/L | 6.79 ± 0.93 | 3.83 ± 0.62 | 2.57 ± 1.86 | |
| NO3 - | 0.05 | mg/L | 50 mg/L | 6.53 ± 5.14 | 8.76± 11.77 | 11.79 ± 17.13 |
| Cl- | 0.05 | mg/L | 250 mg/L | 9.1 ± 13.7 | 93.2 ± 57.4 | 331 ± 428 |
| NO2 - | 0.05 | mg/L | 0.5 mg/L | 0.04 ± 0.07 | 1.22 ± 1.75 | 2.09 ± 3.32 |
| SO4 2- | 0.05 | mg/L | 500 mg/L | 1.06 ± 0.75 | 1.13 ± 2.06 | 4.38 ± 5.25 |
3.1.4. Turbidity
Turbidity values were substantially higher than the WHO guideline limit of 5 NTU in all water categories. Mean turbidity reached 43 ± 18 NTU in surface water, 41 ± 37 NTU in groundwater, and 174 ± 200 NTU in wastewater. The exceptionally high turbidity observed in wastewater indicates a large amount of suspended solids and organic matter, while elevated values in surface and groundwater may result from sediment transport, runoff, and inadequate protection of water sources. Similar results were repported by Bwire et al. [1] with high tubidity (>50 NUT) in Kinshasa (DRC), Lomé (Togo), and Ouagadougou (Burkina Faso) during the rainy season, primarily driven by urban runoff, soil erosion, and inadequate drainage infrastructure.
3.1.5. Dissolved Oxygen (DO)
DO concentrations differed significantly among water types. Surface water exhibited the highest mean DO concentration (6.79 ± 0.93 mg/L), exceeding the minimum WHO guideline value of 5 mg/L and indicating well-aerated conditions. In contrast, groundwater (3.83 ± 0.62 mg/L) and wastewater (2.57 ± 1.86 mg/L) showed markedly lower levels, suggesting reduced oxygen availability, likely driven by organic matter decomposition and microbial respiration. Dissolved oxygen is essential for sustaining aquatic organism respiration [26]. Notably, in Bangui, untreated wastewater is discharged directly into surface water bodies, and such low DO concentrations (<3 mg/L) may pose critical risks to many aquatic species.
3.1.6. Chloride
Chloride concentrations displayed considerable variation among water sources. Surface water contained the lowest concentration (9.1 ± 13.7 mg/L), while groundwater and wastewater contained 93.2 ± 57.4 mg/L and 331 ± 428 mg/L, respectively. Although the average chloride concentration in groundwater remained below the WHO guideline value of 250 mg/L, wastewater exceeded this threshold, suggesting contamination from domestic effluents and other anthropogenic activities.
3.1.7. Nitrate
Nitrate concentrations remained well below the WHO guideline value of 50 mg/L in all water sources. Mean concentrations were 6.53 ± 5.14 mg/L in surface water, 8.76 ± 11.77 mg/L in groundwater, and 11.79 ± 17.13 mg/L in wastewater. Although these levels do not pose an immediate health concern, the higher concentrations observed in wastewater may indicate inputs from agricultural runoff, domestic sewage, and organic waste decomposition. Relatively low concentrations in surface waters suggest a dilution effect in the natural environment, consistent with observations in minimally impacted river systems [27].
3.1.8. Nitrite
Nitrite concentrations showed a different pattern. Surface water presented very low levels (0.04 ± 0.07 mg/L), remaining below the WHO guideline value of 0.5 mg/L. However, groundwater (1.22 ± 1.75 mg/L) and wastewater (2.09 ± 3.32 mg/L) exceeded the recommended limit, indicating possible contamination from sewage infiltration, organic matter decomposition, or agricultural activities. Elevated nitrite concentrations are of particular concern because of their potential health effects and their indication of recent pollution events. Similar observations have been reported in several African studies, where human activities constitute a significant source of water resource pollution [28,29]. These findings underscore the need for monitoring nitrite levels, particularly in areas impacted by urban and agricultural effluents.
3.1.9. Sulfate
Sulfate concentrations were low in all water sources and remained well below the WHO guideline value of 500 mg/L. Mean concentrations were 1.06 ± 0.75 mg/L in surface water, 1.13 ± 2.06 mg/L in groundwater, and 4.38 ± 5.25 mg/L in wastewater. These results suggest that sulfate contamination is not a major concern in the study area.
Overall, the results indicate that while most chemical parameters complied with WHO guidelines, several indicators, including turbidity, dissolved oxygen, chloride (in wastewater), and nitrite (in groundwater and wastewater), revealed signs of water quality deterioration. Wastewater exhibited the highest degree of contamination, characterized by elevated conductivity, turbidity, chloride, and nitrite concentrations, whereas surface water showed better oxygenation but remained affected by high turbidity. Groundwater generally presented intermediate characteristics but displayed low dissolved oxygen and elevated nitrite concentrations, suggesting vulnerability to anthropogenic contamination. These findings emphasize the need for continuous monitoring and the implementation of effective water resource management strategies to protect public health and environmental quality.
3.2. Trace Metals in Water Samples
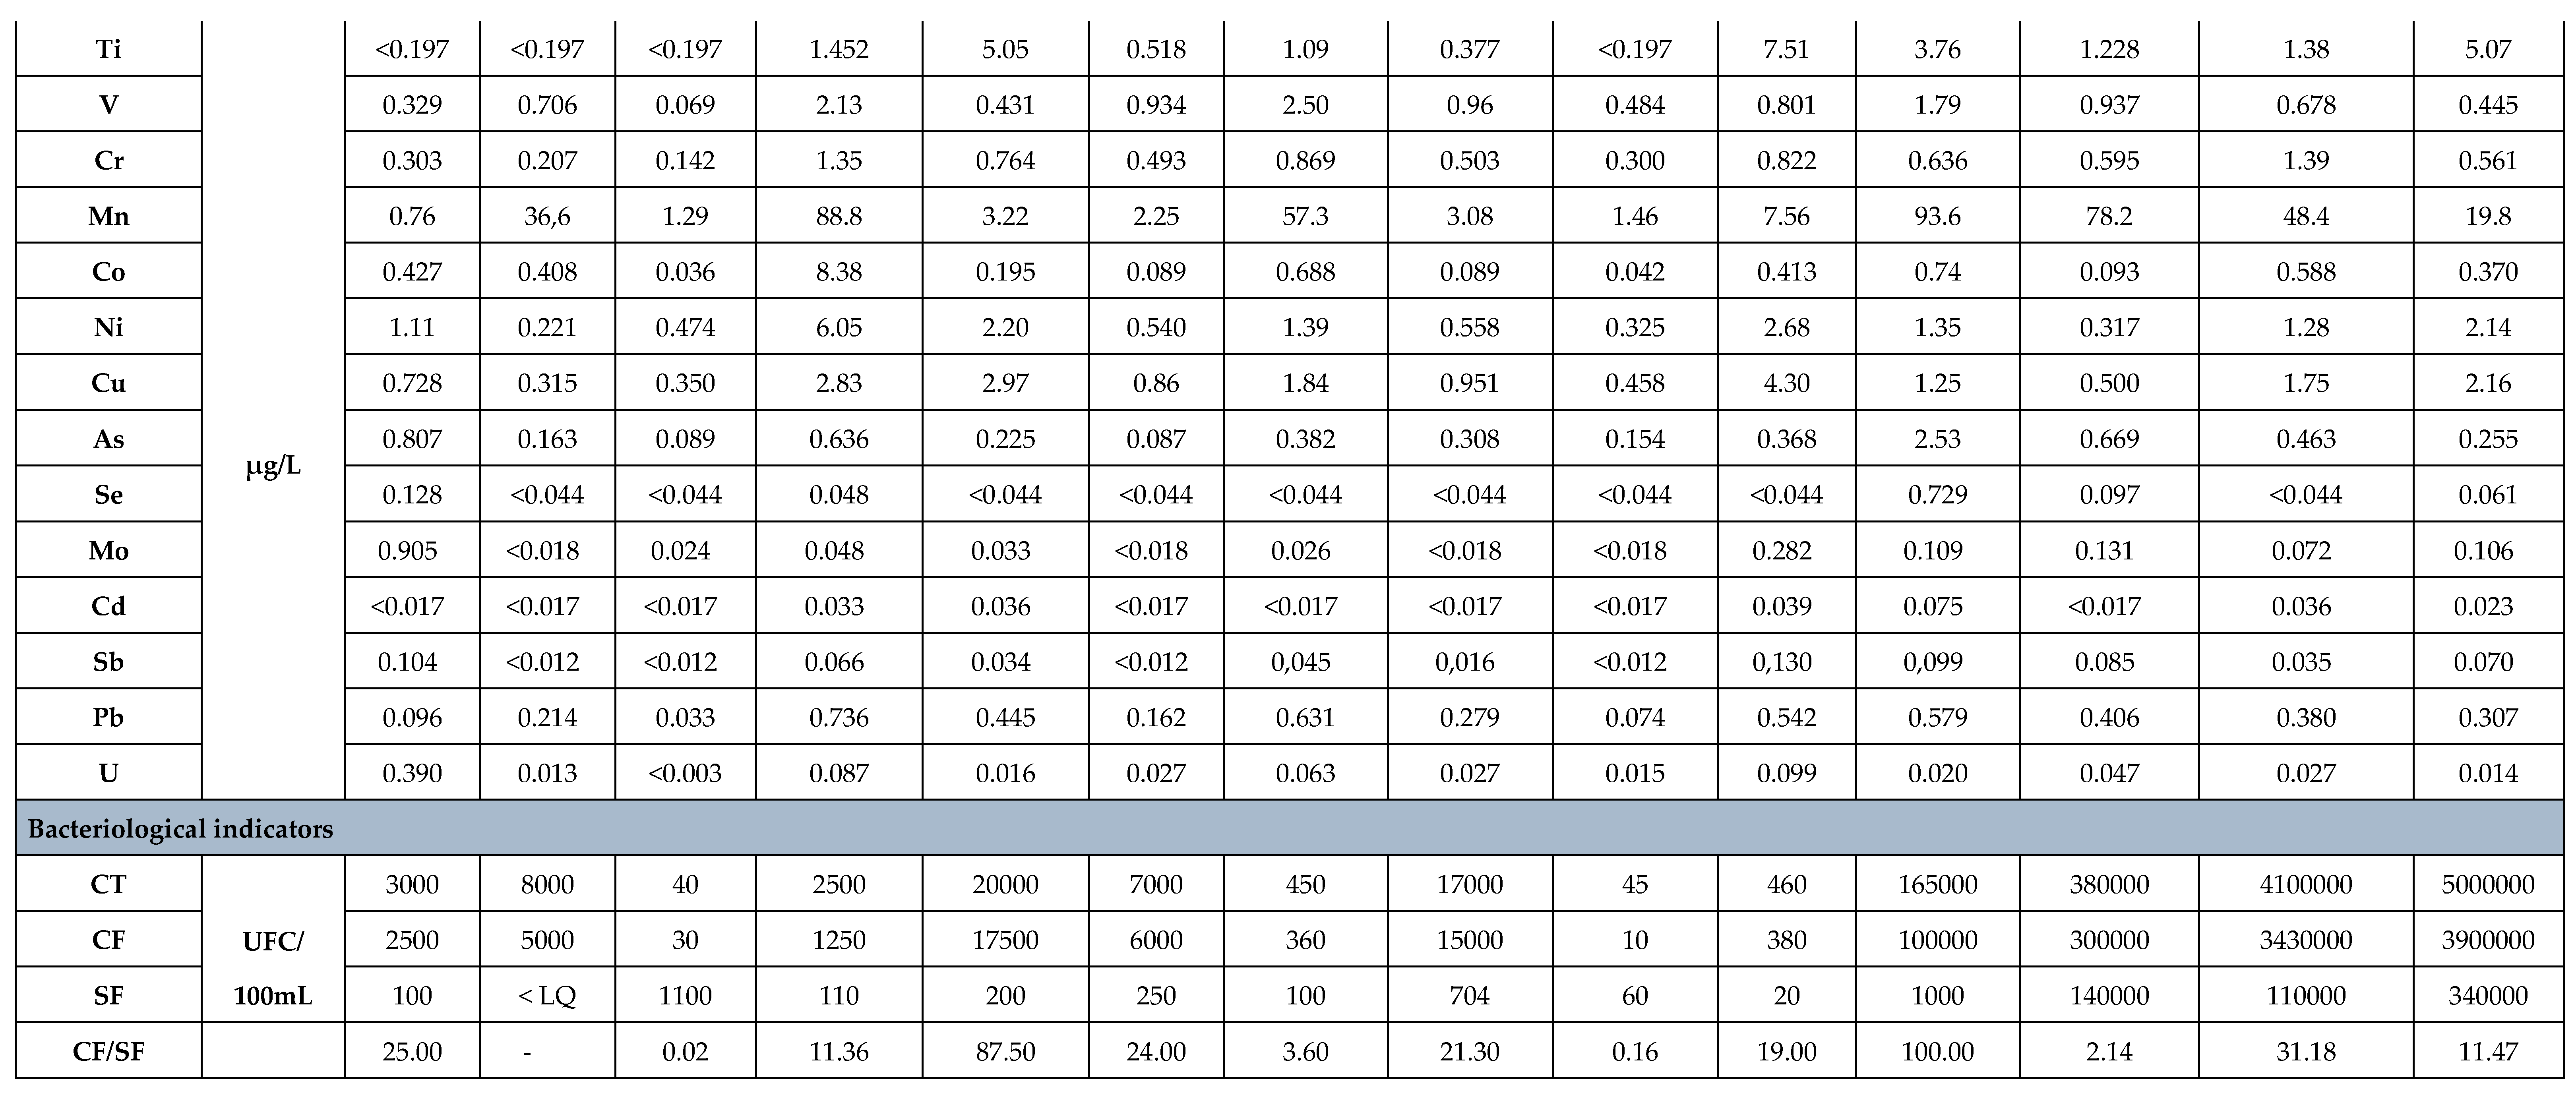
The concentrations of trace metals and bacteriological indicators measured in groundwater, surface water, and wastewater are presented in Table 3. Overall, most metal concentrations remained below the guideline values established by the World Health Organization [30], suggesting a generally low level of metal contamination in the study area. However, significant variations were observed among water sources, reflecting differences in geological conditions and anthropogenic influences (Table 3, Figure 3 and Figure 4).
Table 3.
Mean concentrations (± SD) of trace metals and bacteriological indicators in groundwater (14 sites), surface water (10 sites), and wastewater (4sites) samples collected in Bangui (µg/L.
Table 3.
Mean concentrations (± SD) of trace metals and bacteriological indicators in groundwater (14 sites), surface water (10 sites), and wastewater (4sites) samples collected in Bangui (µg/L.
| Metals | Unite | LOQ | Groundwater | Surface water | Wastewater |
|---|---|---|---|---|---|
| Al | µg/L | 10 | 202 ± 190 | 120 ± 121 | 121 ± 199 |
| As | µg/L | 0.028 | 0.127 ± 0.121 | 0.322 ± 0.239 | 0.424 ± 0.352 |
| Ba | µg/L | 0.027 | 300 ± 445 | 110 ± 93 | 138 ± 125 |
| Ca | mg/L | 0.005 | 8.59 ± 8.95 | 8.08 ± 12.16 | 12.44 ± 19.12 |
| Cd | µg/L | 0.017 | 0.054 ± 0.039 | 0.011 ± 0.017 | 0.008 ± 0.016 |
| Co | µg/L | 0.01 | 9.50 ± 20.21 | 1.08 ± 2.57 | 2.31 ± 4.05 |
| Cr | µg/L | 0.02 | 0.42 ± 0,57 | 0.57 ± 0.37 | 0.50 ± 0.57 |
| Cu | µg/L | 0.03 | 3.69 ± 3.67 | 1.56 ± 1.37 | 1.06 ± 1.20 |
| Fe | µg/L | 10 | 78.5 ± 134 | 433 ± 535 | 335 ± 259 |
| K | mg/L | 0.5 | 13.24 ± 9.90 | 4.36 ± 5.46 | 7.17 ± 7.47 |
| Li | µg/L | 10 | 11 ± 7 | 10 ± 6 | 8 ± 9 |
| Mg | mg/L | 0.005 | 2.99 ± 3.14 | 2.04 ± 2.09 | 2.76 ± 3.21 |
| Mn | µg/L | 8 | 177 ± 158 | 20 ± 30 | 32 ± 41 |
| Mo | µg/L | 0.018 | 0.042 ± 0.060 | 0.132 ± 0.285 | 0.244 ± 0.441 |
| Na | mg/L | 0.5 | 43.63 ± 44.05 | 10.65 ± 16.51 | 19.52 ± 24.05 |
| Ni | µg/L | 0.15 | 7.09 ± 9.93 | 1.56 ± 1.78 | 1.96 ± 2.75 |
| Pb | µg/L | 0.01 | 1.06 ± 1.34 | 0.32 ± 0.25 | 0.27 ± 0.32 |
| Sb | µg/L | 0.012 | 0.046 ± 0.036 | 0.040 ± 0.047 | 0.043 ± 0.051 |
| Se | µg/L | 0.044 | 0.062 ± 0.055 | 0.018 ± 0.042 | 0.044 ± 0.060 |
| Sr | µg/L | 10 | 57 ± 58 | 37 ± 56 | 59 ± 88 |
| Ti | µg/L | 0.197 | 0.210 ± 0.582 | 1.599 ± 2.581 | <0.197 |
| U | µg/L | 0.003 | 0.063 ± 0.057 | 0.073 ± 0.116 | 0.122 ± 0.182 |
| V | µg/L | 0.01 | 0.36 ± 0.44 | 0.93 ± 0.78 | 0.81 ± 0.92 |
| Zn | µg/L | 0.054 | 306 ± 84 | 153 ± 283 | 52 ± 40 |
| Microbial parameters | |||||
| CT | UCF/100 mL | 5850±7269 | 5850±7269 | 2411250±2498341 | |
| CF | UCF/100 mL | 4803±6509 | 4803±6409 | 1932500±2011357 | |
| SF | UCF/100 mL | 264±357 | 264±357 | 147750±141399 | |
| CF/SF | 22.16 | 18.16 | 13.08 | ||
Aluminum (Al) concentrations were highest in groundwater (202 ± 190 µg/L), compared with surface water (120 ± 121 µg/L) and wastewater (121 ± 199 µg/L). This pattern may be related to natural weathering of aluminosilicate minerals within aquifer formations. Similarly, barium (Ba), sodium (Na), potassium (K), calcium (Ca), magnesium (Mg), and strontium (Sr) were generally more abundant in groundwater, reflecting prolonged water–rock interactions and mineral dissolution processes. Relative distribution of major metals is illustrated the Figure 3.
Arsenic (As) concentrations were low in all water sources, ranging from 0.127 ± 0.121 µg/L in groundwater to 0.424 ± 0.352 µg/L in wastewater, and remained well below the WHO guideline value of 10 µg/L. Likewise, concentrations of chromium (Cr), copper (Cu), nickel (Ni), lead (Pb), selenium (Se), uranium (U), and vanadium (V) were considerably lower than their respective guideline values, indicating no significant risk associated with these elements.
Cadmium (Cd) concentrations were very low in all samples, with mean values below 0.06 µg/L. Cobalt (Co) and molybdenum (Mo), for which no WHO guideline values are available, were detected at relatively low concentrations, although groundwater exhibited higher Co levels (9.50 ± 20.21 µg/L) than surface water and wastewater. Iron (Fe) showed marked variability, with the highest concentration recorded in surface water (433 ± 535 µg/L), followed by wastewater (335 ± 259 µg/L) and groundwater (78.5 ± 134 µg/L). Elevated iron concentrations in surface waters may result from soil erosion, runoff, and the mobilization of iron-rich sediments. Manganese (Mn) concentrations were highest in groundwater (177 ± 158 µg/L), reflecting reducing conditions commonly encountered in aquifers. However, the mean Mn concentration remained below the WHO guideline value of 400 µg/L. Manganese occurs naturally in rocks that come into contact with water. It does not appear to be toxic, but it can cause the water to take on a metallic color and taste. Manganese emerges as the predominant minor TME, exhibiting particularly high concentrations in groundwater (177.1 µg/L), exceeding the standard limit of 400 µg/L, whereas wastewater shows lower levels (5.97 µg/L). Groundwater generally displays the highest concentrations of Mn, cobalt (Co), and Ni, likely attributable to natural geochemical processes such as water–rock interactions and mineral dissolution within the aquifer.
Zinc (Zn) concentrations were highest in groundwater (306 ± 84 µg/L) and lower in surface water (153 ± 283 µg/L) and wastewater (52 ± 40 µg/L). Despite this variation, all measured values remained within acceptable limits and are unlikely to pose health concerns.
Overall, the trace metal analysis indicates that the studied water resources are not significantly affected by metal pollution. The observed variations appear to be primarily controlled by natural geochemical processes rather than anthropogenic contamination.
Figure 4B shows that wastewater exhibits the highest concentrations of major elements, particularly sodium (Na) and potassium (K), likely due to domestic discharges and urban activities. Groundwater also displays significant levels of calcium (Ca), magnesium (Mg), and Na, reflecting water–rock interactions within the aquifers. Surface water generally presents the lowest concentrations, attributable to dilution and exchanges with sediments. These patterns are comparable to observations from other African countries: in Ghana and Benin, wastewater and groundwater show elevated Na, K, Ca, and Mg concentrations associated with anthropogenic inputs and local geochemical processes, whereas surface waters exhibit lower levels due to natural dilution [28,29].
3.3. Trace Fingerprinting and Geochemical Signatures of Water Sources
To better understand the relative contribution of trace metals across sampling sites, the proportional distribution of metals was examined using compositional profiles (Figure 5). The normalized metal fingerprints revealed marked differences between groundwater, surface water, and wastewater, reflecting the combined influence of lithological controls, hydrological processes, and anthropogenic activities.
3.3.1. Groundwater
Our results showed the dominance of Cr, Al, Zn, and Mn in groundwater. Groundwater samples displayed highly heterogeneous elemental signatures among sites (G1-G14). Cr represented the dominant fraction in several wells, particularly at G7, G8, and G11, where it accounted for more than 50% of the total metal composition. Al was also a major contributor in sites G10 and G13, while Zn dominated the signature of G12 and G14. Mn showed substantial contributions in G1, G4, and G6. The predominance of Cr, Mn, and Al in groundwater is consistent with geogenic mobilization from aquifer materials. Under reducing conditions, commonly reflected by the low dissolved oxygen concentrations observed in groundwater (3.83 ± 0.62 mg/L), manganese-bearing minerals may dissolve and release Mn into solution. Similarly, elevated Al and Cr proportions may originate from weathering of aluminosilicate and mafic minerals. The high variability among wells indicates strong spatial heterogeneity in aquifer geochemistry and suggests localized hydrogeochemical processes rather than a regional contamination source.
The relatively high proportions of Zn in some wells may indicate additional anthropogenic influences, including corrosion of metallic infrastructure, agricultural inputs, or infiltration of domestic wastewater. However, the absolute Zn concentrations remained below levels considered hazardous for drinking water.
3.3.2. Surface Water
Iron-Dominated Geochemical Signature is observed in surface water. Surface waters exhibited a much more homogeneous composition than groundwater. Fe was the dominant element in nearly all sites, frequently accounting for 50-80% of the total metal assemblage. This trend was particularly evident in S2, S3, S5, S7, S8, and S9. Secondary contributions originated from Cr, Zn, and Al, whereas other trace elements represented only minor fractions. The predominance of Fe is consistent with the elevated mean concentration measured in surface water (433 ± 535 µg/L). Such enrichment is commonly associated with runoff-induced erosion, resuspension of iron-rich sediments, and weathering of ferruginous soils. In tropical environments, where intense rainfall accelerates soil erosion, iron often becomes the major dissolved and particulate metal transported to surface waters. The relative uniformity of the Fe-dominated pattern across sampling points suggests that natural geochemical processes are the principal source of metals in surface water. Nevertheless, localized increases in Zn and Al may reflect diffuse anthropogenic contributions from urban runoff, agricultural activities, or domestic discharges.
3.3.3. Wastewater
In waster, a mixed anthropogenic signature is observed. Wastewater samples (W1-W4) exhibited more complex metal fingerprints characterized by substantial contributions from Fe, Cr, Zn, and Al. Unlike surface water, where Fe consistently dominated, wastewater showed variable elemental distributions among sampling points. W1 was strongly enriched in Fe, while W4 displayed a marked contribution from Zn. Cr and Al also represented important fractions in several samples. This heterogeneous composition reflects the multiple sources contributing to wastewater, including domestic effluents, household products, urban runoff, plumbing systems, and small-scale industrial activities. The elevated relative abundance of Zn and Cr in wastewater is particularly indicative of anthropogenic inputs, as these elements are commonly associated with galvanized materials, detergents, pigments, corrosion products, and industrial residues.
Comparison of the three water matrices reveals distinct geochemical fingerprints, groundwater is characterized by a mixed assemblage dominated by Cr, Al, Zn, and Mn, reflecting strong lithological control and localized hydrogeochemical conditions. Surface water is overwhelmingly dominated by Fe, indicating the influence of soil erosion, sediment transport, and natural weathering processes. Wastewater exhibits a more diversified metal composition, reflecting multiple anthropogenic sources and complex urban inputs. Despite these differences in metal distribution patterns, the absolute concentrations of most trace metals remained below WHO guideline values. This finding suggests that the study area is not currently affected by severe metal pollution. However, the compositional analysis provides valuable insights into the environmental processes governing metal mobility and highlights clear distinctions between natural geochemical signatures and anthropogenic influences. The predominance of Fe in surface waters, contrasted with the more heterogeneous metal composition of groundwater and wastewater, suggests that trace metal contamination is currently not a major water-quality concern in the study area. Nevertheless, the spatial variability observed for Zn, Cr, Al, and Mn warrants continued monitoring, as these elements may serve as sensitive indicators of emerging anthropogenic pressures and hydrogeochemical changes.
3.4. Microbiological Indicators
The bacteriological analysis revealed substantial microbial contamination, particularly in wastewater samples. TC, FC, and FS were detected in all water categories, indicating widespread fecal contamination (Table 1, Table S1; Figure 6). Wastewater exhibited extremely high microbial loads, with mean concentrations of 2,411,250 ± 2,498,341 CFU/100 mL for total coliforms, 1,932,500 ± 2,011,357 CFU/100 mL for fecal coliforms, and 147,750 ± 141,399 CFU/100 mL for FS. These values greatly exceed international standards for water intended for human use and reflect direct inputs of untreated domestic and organic waste.
Groundwater and surface water showed considerably lower contamination levels; however, the recorded concentrations remained significant. Total coliform and fecal coliform counts averaged 5,850 ± 7,269 CFU/100 mL and 4,803 ± 6,509 CFU/100 mL, respectively, while fecal streptococci averaged 264 ± 357 CFU/100 mL. The presence of these microorganisms indicates that both surface and groundwater resources are affected by fecal pollution and may be vulnerable to contamination from wastewater infiltration, agricultural activities, or inadequate sanitation infrastructure. According to WHO guidelines, the limit for TC in surface waters is 5.0 × 10³ CFU/100 mL, while drinking water should be free of TC (Directive (EU) 2020/2184) [31]. Among the ten surface water sites, TC ranged from 45 to 2.0 × 10⁴ CFU/100 mL, with 40% exceeding the WHO threshold (Figure 6; Table 1S). These findings are consistent with reports from Kenya, Ethiopia, and Ghana, where surface waters frequently exceed WHO standards due to inadequate sanitation and untreated discharges [32,33]. Similar contamination of groundwater has been documented across Africa, reflecting increasing aquifer vulnerability to infiltration and runoff processes [1]. Comparable FC levels have also been reported in well waters in Cameroon (1 to 7.2 × 10³ CFU/100 mL) [12]. Given that groundwater represents a primary source of drinking water in many African cities, including Bangui, the presence of TC raises significant public health concerns. In similar contexts such as Bukavu (Congo), surface water degradation has been linked to uncontrolled waste discharge, while rivers remain heavily used for domestic purposes, increasing exposure to fecal-oral pathogens through consumption and direct contact [34,35,36].
The large standard deviations reflect marked spatial variability (Table 1), likely driven by fluctuating urban discharges and runoff. Figure 6 presents the concentrations of bacteriological indicators TC, FC, and FS in groundwater, surface water, and wastewater samples. The observed variations can be explained by the environmental characteristics and anthropogenic pressures associated with each sampling site.
For groundwater samples, the highest bacterial concentrations were recorded at G4, G10 and G13. G4 (Benz Vie Well) exhibited the highest concentrations of total coliforms (TC) and fecal coliforms (FC) among the investigated wells. This well is located in a topographic depression that is particularly susceptible to surface runoff accumulation and infiltration. During rainfall events, runoff may facilitate the transport of fecal material and other microbial contaminants into the subsurface, thereby increasing the vulnerability of groundwater to contamination. In addition, the well is situated within a densely urbanized area in close proximity to major institutions, including the University of Bangui, the Ledger Plaza Bangui Hotel, several healthcare facilities, and the central business district. Field observations revealed the presence of indiscriminately disposed solid waste, poorly managed refuse, nearby sanitation facilities, and visible wastewater discharges. The combined effects of inadequate waste management, insufficient sanitation infrastructure, and uncontrolled wastewater disposal are likely to enhance contaminant migration into the aquifer, thereby contributing to the elevated bacterial concentrations observed at this site. G10 (Ngoulekpa Well) is situated within a low-lying agricultural zone characterized by intensive vegetable production and the frequent application of cattle dung and manure as organic fertilizers. The relatively high TC and FC concentrations recorded at this location may reflect the influence of surrounding agricultural activities. The repeated application of animal-derived organic amendments can increase the abundance of fecal microorganisms in surface soils, which may subsequently be mobilized and transported to the aquifer via infiltration and runoff pathways. Given the marshy nature of the area and the likely hydraulic connectivity between surface and subsurface environments, these factors may collectively explain the elevated microbial contamination observed in G10.
G13 (USACA Well) also exhibited elevated levels of microbial contamination. This well is located in a low-lying area that is frequently affected by flooding events and lies in close proximity to a waste disposal (landfill) site. Such environmental conditions may increase the vulnerability of the aquifer to contamination, as floodwaters can facilitate the mobilization and transport of contaminants from surrounding sources into the subsurface. In addition, landfill leachates and other waste-derived pollutants may infiltrate the groundwater system, particularly where hydrogeological conditions favor vertical percolation. The combined influence of recurrent flooding and nearby waste disposal activities may therefore contribute to the elevated concentrations of total coliforms (TC) and fecal coliforms (FC) observed at this site.
For surface water (Figure 6E), Total coliform counts vary considerably among sampling sites (S1–S10) with the highest contamination was recorded at S5 (≈20,000 UFC/100 mL), followed by S8 (≈17,000 UFC/100 mL). Relatively high counts were also observed at S2 (≈8,000 UFC/100 mL) and S6 (≈7,000 UFC/100 mL). Moderate levels were found at S1 (≈3,000 UFC/100 mL) and S4 (≈2,500 UFC/100 mL). Very low or nearly undetectable concentrations were measured at S3, S7, S9, and S10. Overall, surface water shows substantial bacterial contamination, with some sites exhibiting extremely high coliform levels, suggesting strong fecal or environmental pollution inputs.
Wastewater samples contained the highest bacterial loads overall, particularly at W3 and W4 (Figure 6F). W4 (Community University Hospital) recorded the highest concentrations of TC and FC. The hospital accommodates many inpatients, and family members often stay on-site, carrying out domestic activities such as cooking, washing, and laundry. These activities significantly increase the organic and microbial load of the wastewater. W3 (Ledger Plaza Hotel) also showed extremely high bacterial concentrations. Wastewater from the hotel is discharged without prior treatment, and the strong odor noted during sampling indicates a high level of organic pollution that supports microbial growth. While, W2 (General Teaching Hospital) displayed intermediate contamination levels associated with outpatient medical and sanitary activities. W1 (University Restaurant Wastewater) had the lowest concentrations among wastewater samples, although bacterial contamination remained evident due to food preparation and cleaning activities.
The FC/FS ratio has been widely used to identify the origin of fecal contamination. Values greater than 4 generally indicate contamination predominantly of human origin, whereas values below 0.7 suggest an animal source. In the present study, FC/FS ratios were 22.16 in groundwater, 18.16 in surface water, and 13.08 in wastewater. These elevated ratios strongly suggest that fecal contamination is primarily of human origin, likely resulting from domestic wastewater discharges without any treatment, septic tank leakage, and inadequate sanitation practices in Bangui.
5. Conclusions
This study provides the first comprehensive and integrated assessment of groundwater, surface water, and wastewater quality in Bangui, Central African Republic, by combining physicochemical parameters, trace metal distribution, and microbiological indicators. The results revealed a clear contamination gradient among water compartments, with wastewater representing the most degraded system, followed by groundwater and surface water.
Microbiological contamination emerged as the dominant factor controlling water quality degradation. Extremely high concentrations of total and fecal coliforms, together with elevated FC/FS ratios, indicate that untreated domestic wastewater and inadequate sanitation infrastructure constitute the principal sources of pollution. The occurrence of elevated nitrite concentrations in groundwater, combined with low dissolved oxygen levels and strong fecal contamination, provides compelling evidence of hydraulic connectivity between wastewater, surface water, and shallow aquifers through infiltration processes.
In contrast, trace metal concentrations generally remained below World Health Organization guideline values, suggesting that, under current conditions, microbial pollution represents a much greater threat to human health than metal contamination. Nevertheless, the distinct geochemical signatures identified among the three water compartments demonstrate that both natural geological processes and anthropogenic activities influence water chemistry.
Beyond documenting contaminant concentrations, this study improves our understanding of the mechanisms governing urban water degradation in rapidly expanding tropical African cities. The findings highlight the urgent need to strengthen wastewater collection and treatment systems, protect vulnerable groundwater resources, and implement integrated monitoring programs combining physicochemical and microbiological indicators. Such actions are essential to safeguard drinking water resources and reduce waterborne disease risks.
Finally, this work establishes a robust baseline dataset for Bangui and provides valuable scientific evidence to support future investigations on contaminant transport, seasonal dynamics, quantitative microbial and chemical health risk assessment, and the evaluation of sustainable water management strategies under continuing urbanization and climate change. More broadly, the approach developed here may serve as a reference framework for improving urban water security in other rapidly growing cities across sub-Saharan Africa.
Supplementary Materials
The following supporting information can be downloaded at the website of this paper posted on Preprints.org.
Author Contributions
Conceptualization, Janice Alafei, Oscar Allahdin and Sopheak Net; methodology, Janice Alafei, Veronique Alaimo, Salma Bessadok and Sopheak Net; software, Janice Alafei and Sopheak Net; validation, Sopheak Net, Oscar Allahdin and Eric Foto; formal analysis, Janice Alafei; investigation, Janice Alafei, Véronique Alaimo, Salma Bessadok and Sopheak Net; resources, Oscar Allahdin and Eric Foto; data curation, Janice Alafei and Sopheak Net; writing- original draft preparation, Janice Alafei and Sopheak Net; writing - review and editing, all co-authors; visualization, all co-authors; supervision, Sopheak Net and Oscar Allahdin; project administration, Oscar Allahdin, Sopheak Net and Eric Foto; funding acquisition, Oscar Allahdin and Eric Foto. All authors have read and agreed to the published version of the manuscript.
Funding
This work was supported by the French Embassy in Bangui and the CPER ECRIN program.
Acknowledgments
We thank the Ambassade de France for funding the doctoral thesis of Janice ALAFEI. We also thank the Région Hauts-de-France, the Ministère de l’Enseignement Supérieur et de la Recherche, and the CPER ECRIN program. The authors also thank Yassikra BAKAMBA for her assistance with the analysis of microvial contamination. Finally, we thank Professor Michel WARTEL for his invaluable support in acquiring equipment for the University of Bangui, which enabled us to carry out part of this work using the facilities made available through this initiative.
Conflicts of Interest
Declare conflicts of interest or state “The authors declare no conflicts of interest.” Authors must identify and declare any personal circumstances or interest that may be perceived as inappropriately influencing the representation or interpretation of reported research results. Any role of the funders in the design of the study; in the collection, analyses or interpretation of data; in the writing of the manuscript; or in the decision to publish the results must be declared in this section. If there is no role, please state “The funders had no role in the design of the study; in the collection, analyses, or interpretation of data; in the writing of the manuscript; or in the decision to publish the results”.
References
- Bwire, G., Sack, D. A., Kagirita, A., Obala, T., Debes, A. K., Ram, M., Komakech, H., George, C. M., & Orach, C. G. The quality of drinking and domestic water from the surface water sources (lakes, rivers, irrigation canals and ponds) and springs in cholera prone communities of Uganda: An analysis of vital physicochemical parameters. BMC Public Health, 2020, 20, 1128. [CrossRef]
- Kodom, K.J. ; T., Dougna A.A., Eloh K., Sodomon A.K., Net S., Bawa M.L. Occurrence and Risk Assessment of Pyrethroids and Organophosphorus Pesticides in the Middle Part of Mono River Basin. International Journal of Environmental Monitoring and Analysis, 2024, 12(1): 14-20. [CrossRef]
- Tlili I., Caria G., Sghaier R.B., Net S., Ghorbel-Abid I., Ternane R., Ouddane B., Trabelsi-Ayadi M. Occurrence of 28 human and veterinary antibiotics residues in waters, North-eastern Tunisia by liquid chromatography-tandem mass spectrometry. Chemistry Africa, 2022, 5, 2163-2172. [CrossRef]
- Komlan, K. J.; Dougna, A. A.; Eloh, K.; Kodom, T.; Net, S.; Grasset, L. Health risks of pesticide use and agricultural products contamination in the Plateaux region of Togo, West Africa. Environmental Toxicology and Chemistry, 2026, 45(5), 1132–1143. [CrossRef]
- Chbib, C.; Net, S.; Hamzeh, M.; Dumoulin, D.; Ouddane; B.; Baroudi; M. Assessment of pesticides contamination in groundwater of Akkar (Northern- Lebanon). Environmental Science and Pollution Research, 2018, 25, 14302-14312. [CrossRef]
- Moustafa, A.; Hamzeh, M.; Baroudi, M.; Ouddane, B.; Net, S. 55 xenobiotic organic compounds in Tripoli landfill–Lebanon leachate and their fluxes to the Abou Ali River and Mediterranean Sea. Environmental Monitoring and Assessment, 2022, 194(12), 856. [CrossRef]
- Moustafa, A.; Hamzeh, M.; Net, S.; Baroudi, M.; Ouddane, B. Seasonal variation of leachate from municipal solid waste landfill of Tripoli–Lebanon (case study). International Journal of Environmental Science and Technology, 2023, 20(11), 12545–12558. [CrossRef]
- Ben Sghaier, R.; Tlili, I.; Latrous El Atrache, L.; Net, S.; Ghorbel-Abid, I.; Ouddane, B.; Ben Hassan-Chehimi, D.; Trabelsi-Ayadi, M. A Combination of Factorial Design, Off-line SPE and GC–MS Method for Quantifying Seven Endocrine Disrupting Compounds in Water. International Journal of Environmental Research, 2017, 11(5-6), 613-624. [CrossRef]
- Rabodonirina, S.; Net, S.; Ouddane, B.; Merhaby, D.; Dumoulin, D.; Popescu, T.; Ravelonandro, P. Distribution of persistent organic pollutants (PAHs, Me-PAHs, PCBs) in dissolved, particulate and sedimentary phases in freshwater systems. Environmental Pollution, 2015, 206, 38–48. [CrossRef]
- Net, S.; Rabodonirina, S.; Ben Sghaier, R.; Dumoulin, D.; Chbib, C.; Tlili, I.; Ouddane, B. Distribution of phthalates, pesticides and drug residues in the dissolved, particulate and sedimentary phases from transboundary rivers (France–Belgium). Science of the Total Environment, 2015, 521–522, 152–159. [CrossRef]
- Net, S.; Dumoulin, D.; El-Osmani, R.; Rabodonirina, S.; Ouddane, B. Case Study of PAHs, Me-PAHs, PCBs, Phthalates and Pesticides Contamination in the Somme River Water, France. International Journal of Environmental Research, 2014, 8(4), 1159–1170. [CrossRef]
- Nola, M.; Njine, T.; Djuikom, E.; Sikati Foko, V. Faecal coliforms and faecal streptococci community in the underground water in an equatorial area in Cameroon (Central Africa): The importance of some environmental chemical factors. Water Research, 2002, 36(13), 3289–3297. [CrossRef]
- Branchet, P. (2018). Caractérisation de l’impact des activités humaines sur la qualité de la ressource en eau en milieu urbain sub-saharien : étude de la contamination du bassin versant de la Méfou (Région Centre du Cameroun) par les pesticides et les résidus pharmaceutiques (Thèse de doctorat, Sciences de l’Eau). IMT Mines Alès, Alès, France. NNT : 2018EMAL0003. Disponible sur HAL : https://theses.hal.science/tel-02005690 et sur theses.fr : https://theses.fr/2018EMAL0003.
- World Health Organization (WHO). (2022). Guidelines for Drinking-water Quality: Fourth Edition Incorporating the First and Second Addenda. Geneva: World Health Organization. ISBN: 978-92-4-004506-4.
- Scott, L. C.; Esser, S. M.; Aubee, A.; Lee, N.; Flood, M. T.; Aw, T. G. Use of microbial fecal indicator monitoring and fecal source tracking as a park management tool in Rocky Mountain National Park. Environmental Challenges, 2022, 8, Article 100583. [CrossRef]
- Gomes, I. B.; Lemos, M.; Mathieu, L.; Simões, M.; Simões, L. C. The action of chemical and mechanical stresses on single and dual species biofilm removal of drinking water bacteria. Science of the Total Environment, 2018, 631–632, 987–993. [CrossRef]
- Bineshpour, M.; Payandeh, K.; Nazarpour, A.; Sabzalipour, S. Status, source, human health risk assessment of potential toxic elements (PTEs), and Pb isotope characteristics in urban surface soil, case study: Arak city, Iran. Environmental Geochemistry and Health, 2021, 43(12), 4939–4958. [CrossRef]
- Karaouzas, I.; Kapetanaki, N.; Mentzafou, A.; Kanellopoulos, T. D.; Skoulikidis, N. Heavy metal contamination status in Greek surface waters: A review with application and evaluation of pollution indices. Chemosphere, 2021, 263, Article 128192. [CrossRef]
- Mukherjee, I.; Singh, U. K.; Singh, R. P.; Anshumali, Kumari, D.; Jha, P. K.; Mehta, P. Characterization of heavy metal pollution in an anthropogenically and geologically influenced semi-arid region of east India and assessment of ecological and human health risks. Science of the Total Environment, 2020, 705, 135801. [CrossRef]
- Proshad, R.; Islam, S.; Roy Tusher, T.; Zhang, D.; Khadka, S.; Gao, J.; Kundu, S. Appraisal of heavy metal toxicity in surface water with human health risk by a novel approach: A study on an urban river in vicinity to industrial areas of Bangladesh. Toxin Reviews, 2021, 40(4), 1216–1234. [CrossRef]
- Tokatli, C.; Ustaoğlu, F. Health risk assessment of toxicants in Meriç River Delta Wetland, Thrace Region, Turkey. Environmental Earth Sciences, 2020, 79(18), Article 426. [CrossRef]
- Foto, E., Allahdin, O., Biteman, O., & Poumaye, N. Dissolution of Trace Metal Elements in Water by Permeation: The Case of the Drinking Water Network of the City of Bangui in the Central African Republic. American Journal of Applied Chemistry, 2023, 11(5), 130–136. [CrossRef]
- Rodier, J., Legube, B., Merlet, N., Brunet, R., Lanson, G., Leroy, P., Mialocq, J., Moulin, L., et al. (2009). L’analyse de l’eau : Eaux naturelles, eaux résiduaires, eau de mer. Chimie, physico-chimie, microbiologie, biologie, interprétation des résultats (9ᵉ éd.). Paris : Dunod, 2029, 1 579 p. ISBN 978-2-10-054179-9.
- Lebbie, S. E.; Lawal, O.; Kanneh, U. Analysis of Physico-chemical Parameters to Evaluate the Drinking Water Quality Between Two Districts Kambia and Tonkolili in Sierra Leone. World Journal of Applied Chemistry, 2025, 10(1), 1–17. [CrossRef]
- Stevens, M. G.; Owuor, P. O.; Muthini, J. M.; Asamba, M. N. Seasonal comparative assessment of physio-chemical water quality of tap, bottled, river, and borehole water in Nairobi County, Kenya across wet and dry seasons. Applied Water Science, 2026, 16(2), Article 39. [CrossRef]
- El Kabdani, Y.; Damsiri, Z.; Ait Ballagh, F. E.; El Kalay, K.; Khalil, K. The first assessment of surface water quality in Lksob River (Essaouira, Morocco): Physico-chemical parameters and nutrients distribution. Journal of African Earth Sciences, 2025, 226, Article 105584. [CrossRef]
- Claessens, J., van Gils, D., Brussée, T. J., van Duijnen, R., Oosterwoud, M., Vrijhoef, A., Plette, A. C. C., Kotte, M. C., Rozemeijer, J. C., Ouwerkerk, K., Gosseling, M., Roskam, J. L., & Taconis, F. (2024). Agricultural practices and water quality in the Netherlands: Status (2020–2023) and trends (1992–2023): The 2024 Nitrate report with the results of the monitoring of the effects of the EU Nitrates Directive Action Programmes. RIVM Report 2024-0209. Bilthoven, The Netherlands: National Institute for Public Health and the Environment (RIVM). 294 p. [CrossRef]
- Agyei, P.; Agyeman, K.; Boateng, D. Assessment of groundwater quality for drinking and irrigation purposes in Ghana. Environmental Monitoring and Assessment, 2019, 191, 1–14.
- Totin, H. S., Zannou, A., & Boko, M. (2013). Caractérisation physico-chimique et pollution des eaux souterraines au Bénin. International Journal of Biological and Chemical Sciences, 7(4), 1737–1752.
- World Health Organization (WHO). (2017). Guidelines for Drinking-water Quality (4th ed., incorporating the 1st addendum). Geneva, Switzerland: World Health Organization. ISBN: 978-92-4-154995-0.
- Directive (EU) 2020/2184 ; Directive (EU) 2020∕2184, Annex I — Minimum requirements for parametric values used to assess the quality of water intended for human consumption.
- Yasin, M.; Ketema, T.; Bacha, K. Physico-chemical and bacteriological quality of drinking water of different sources, Jimma zone, Southwest Ethiopia. BMC Research Notes 2015, 8, 541. [CrossRef]
- Mosi, L.; Adadey, S.M.; Sowah, S.A.; Yeboah, C. Microbiological assessment of sachet water “pure water” from five regions in Ghana. AAS Open Research 2019, 1, 12. [CrossRef]
- Bisimwa, M.A.; Mwanuzi, F.; Nobert, J. Water Quality Management in Lake Kivu Basin, DR Congo: Estimation of Nutrient and Sediment Loading into Lake Kivu from Bukavu Sub-Basin; LAP Lambert Academic Publishing: Germany, 2014; 128 p. ISBN 978-3659645563.
- Bisimwa, A.M.; Amisi, F.M.; Bamawa, C.M.; Muhaya, B.B.; Kankonda, A.B. Water Quality Assessment and Pollution Source Analysis in Bukavu Urban Rivers of the Lake Kivu Basin (Eastern Democratic Republic of Congo). Environmental and Sustainability Indicators, 2022, 14, Article 100183. [CrossRef]
- Aleke, A. L.; Buregea, H.; Mindele, U.; Bouezmarni, M.; Vasel, J.-L. Parasitological loads of rivers crossing the city of Bukavu, Democratic Republic of Congo. International Journal of Innovation and Scientific Research 2015, 19(2), 412–422. ISSN 2351-8014.
Figure 1.
Study area and the location of sampling sites.
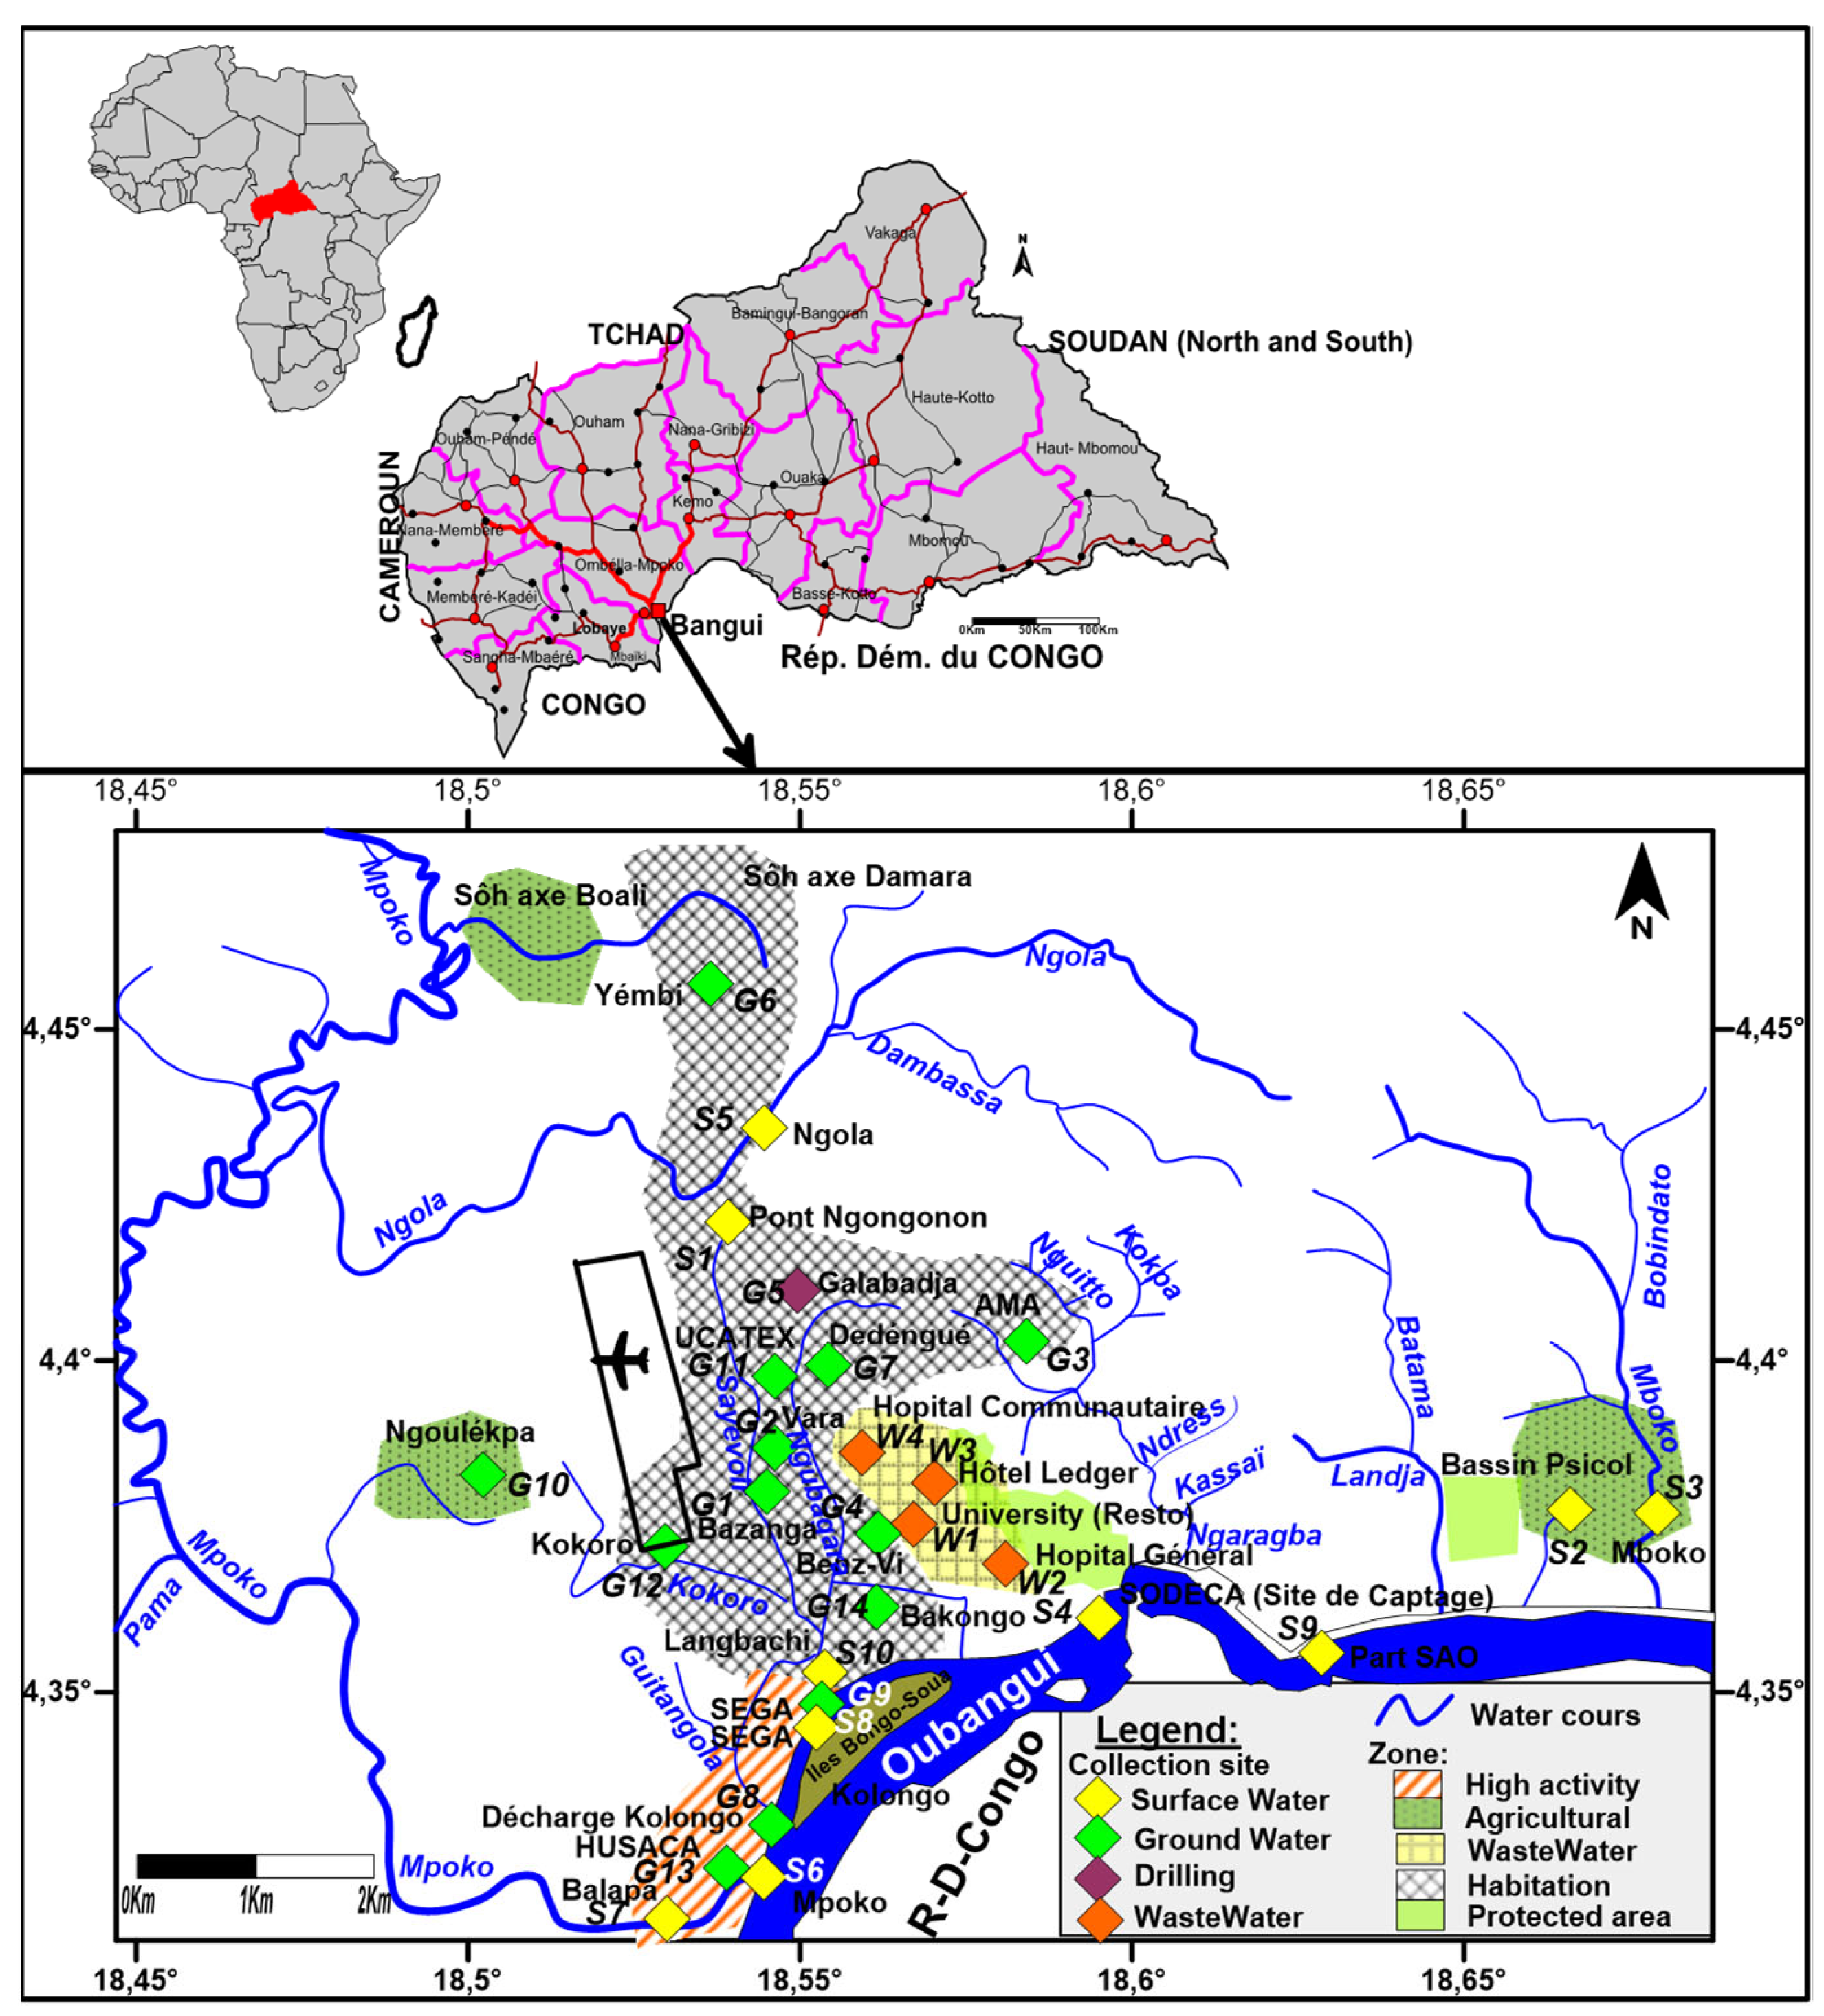
Figure 2.
Concentration (means ± SD) of the physicochemical characteristics in groundwater (14 studied sites), surface water (10 studied sites) and wastewater (4 studied sites).
Figure 2.
Concentration (means ± SD) of the physicochemical characteristics in groundwater (14 studied sites), surface water (10 studied sites) and wastewater (4 studied sites).
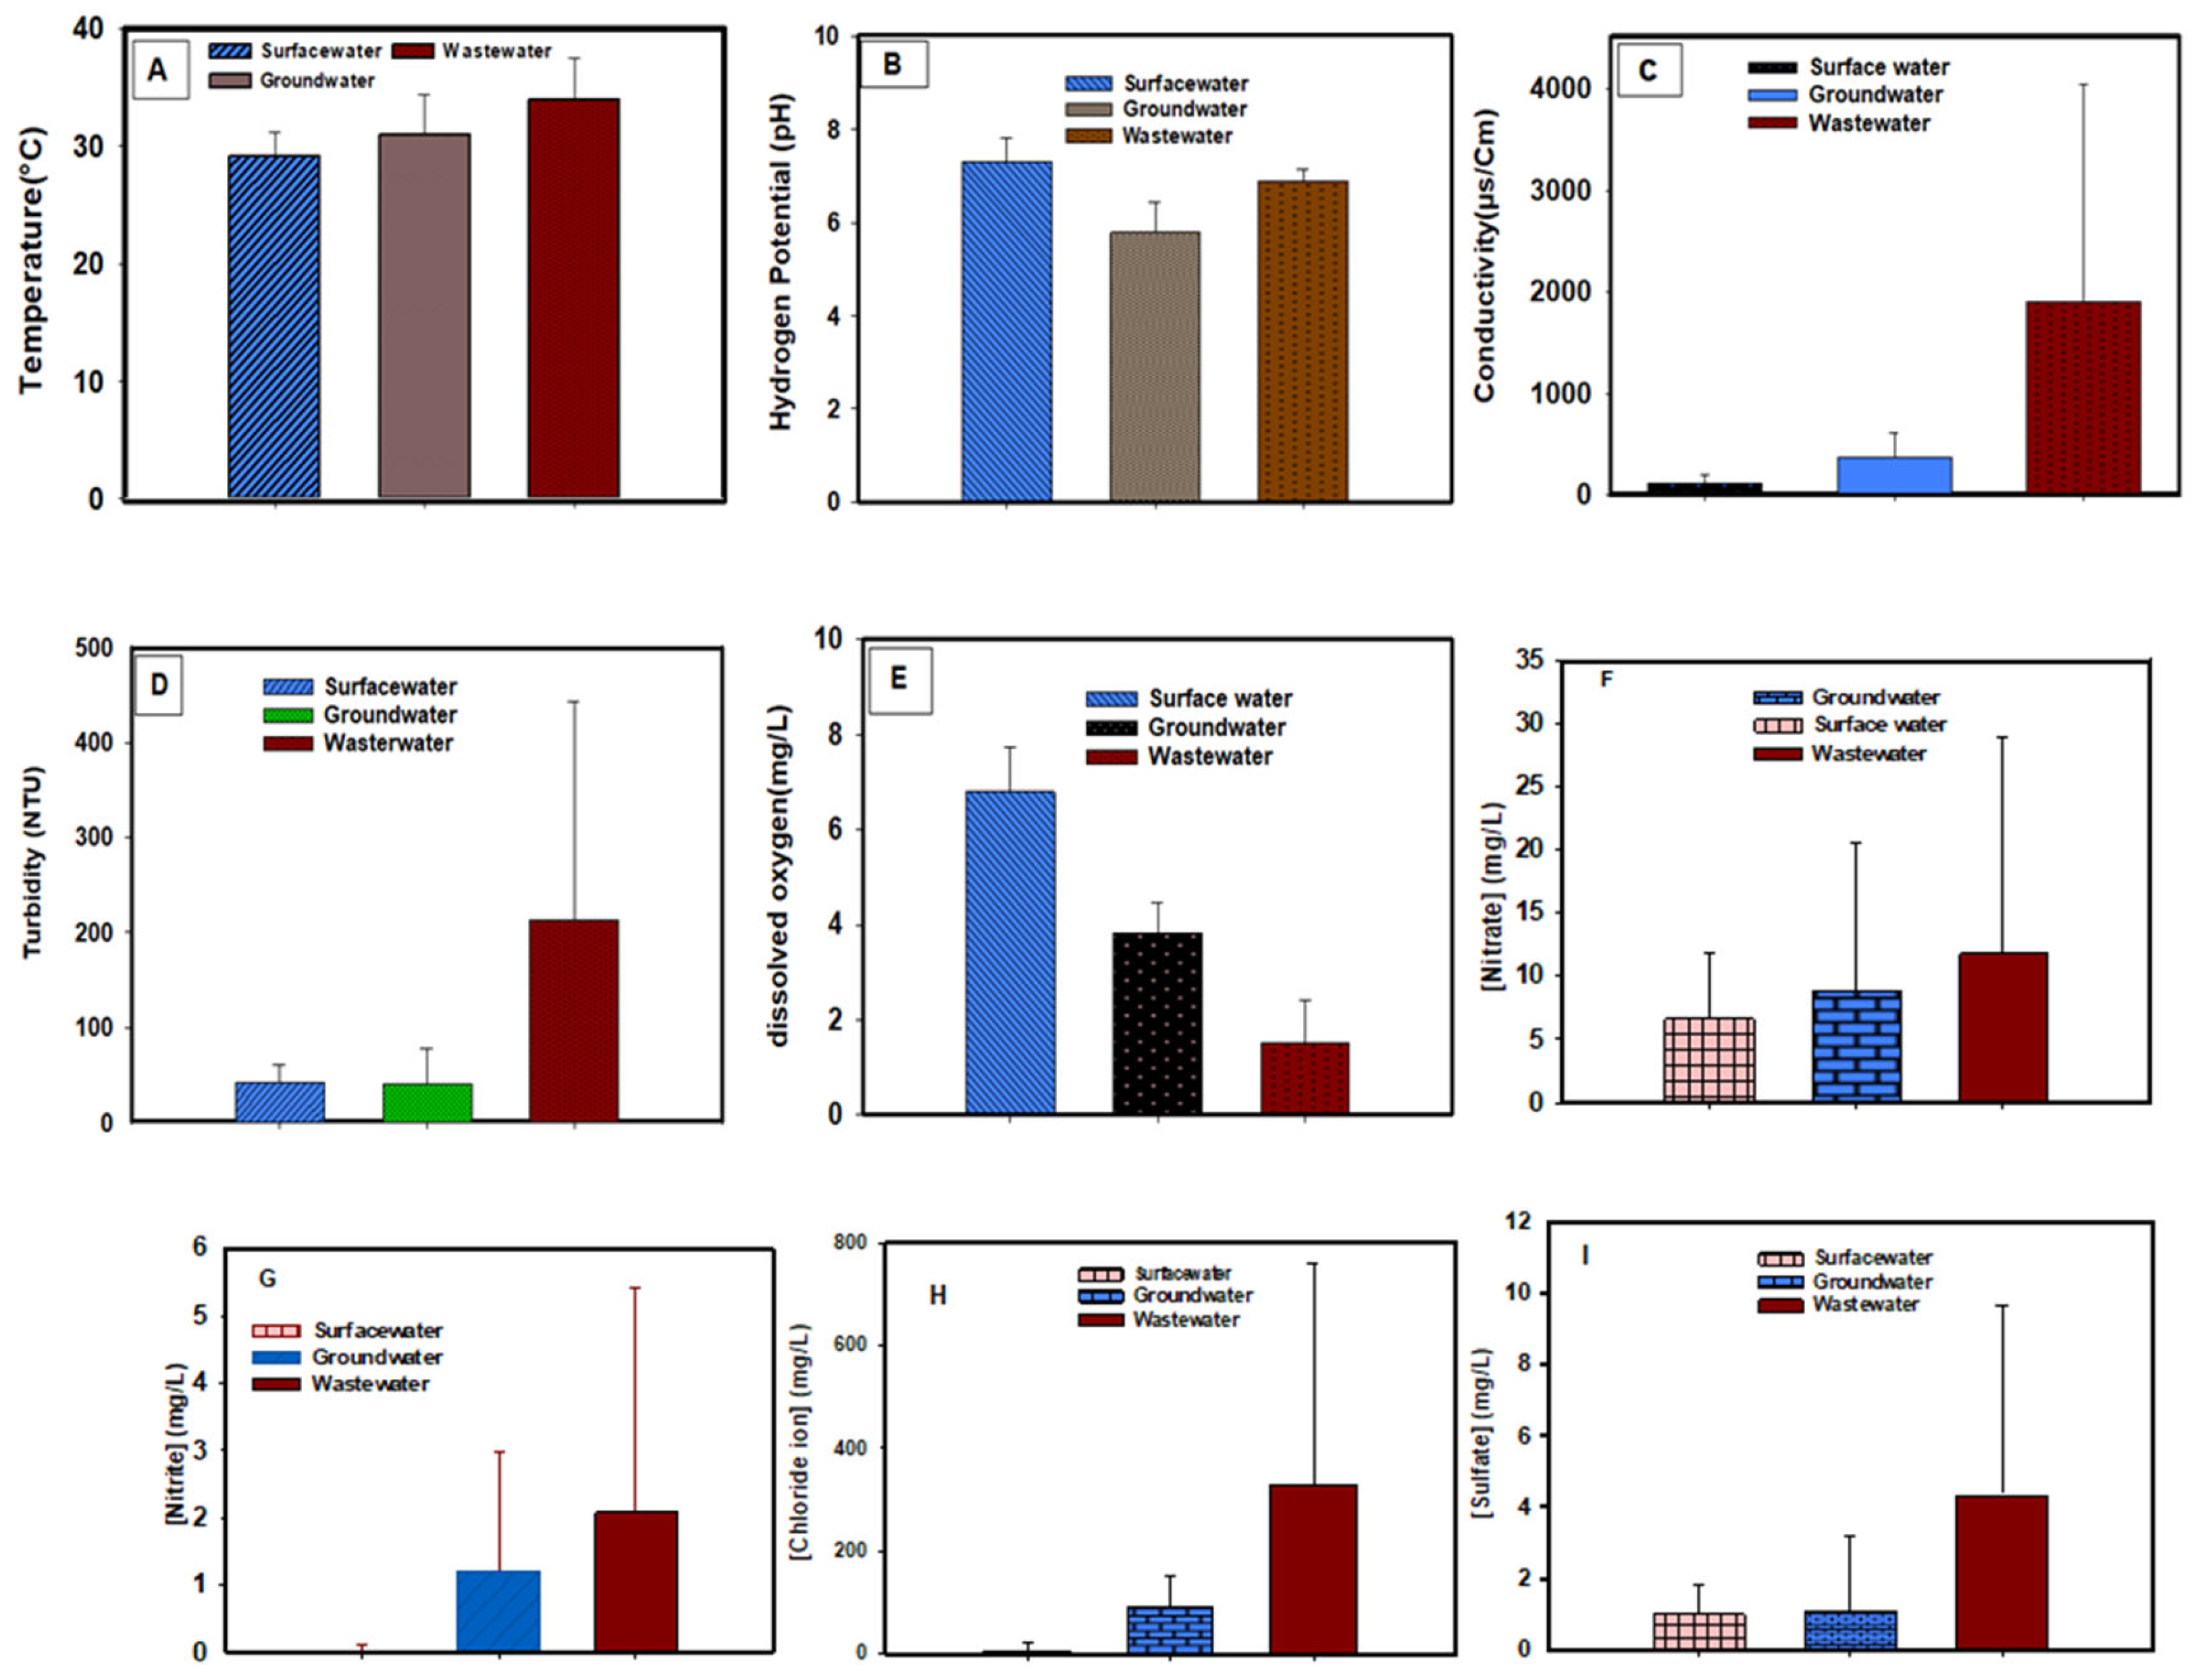
Figure 3.
Relative distribution (%) of major metals (A) in groundwater, (B) in surface water and (C) in wastewater.
Figure 3.
Relative distribution (%) of major metals (A) in groundwater, (B) in surface water and (C) in wastewater.
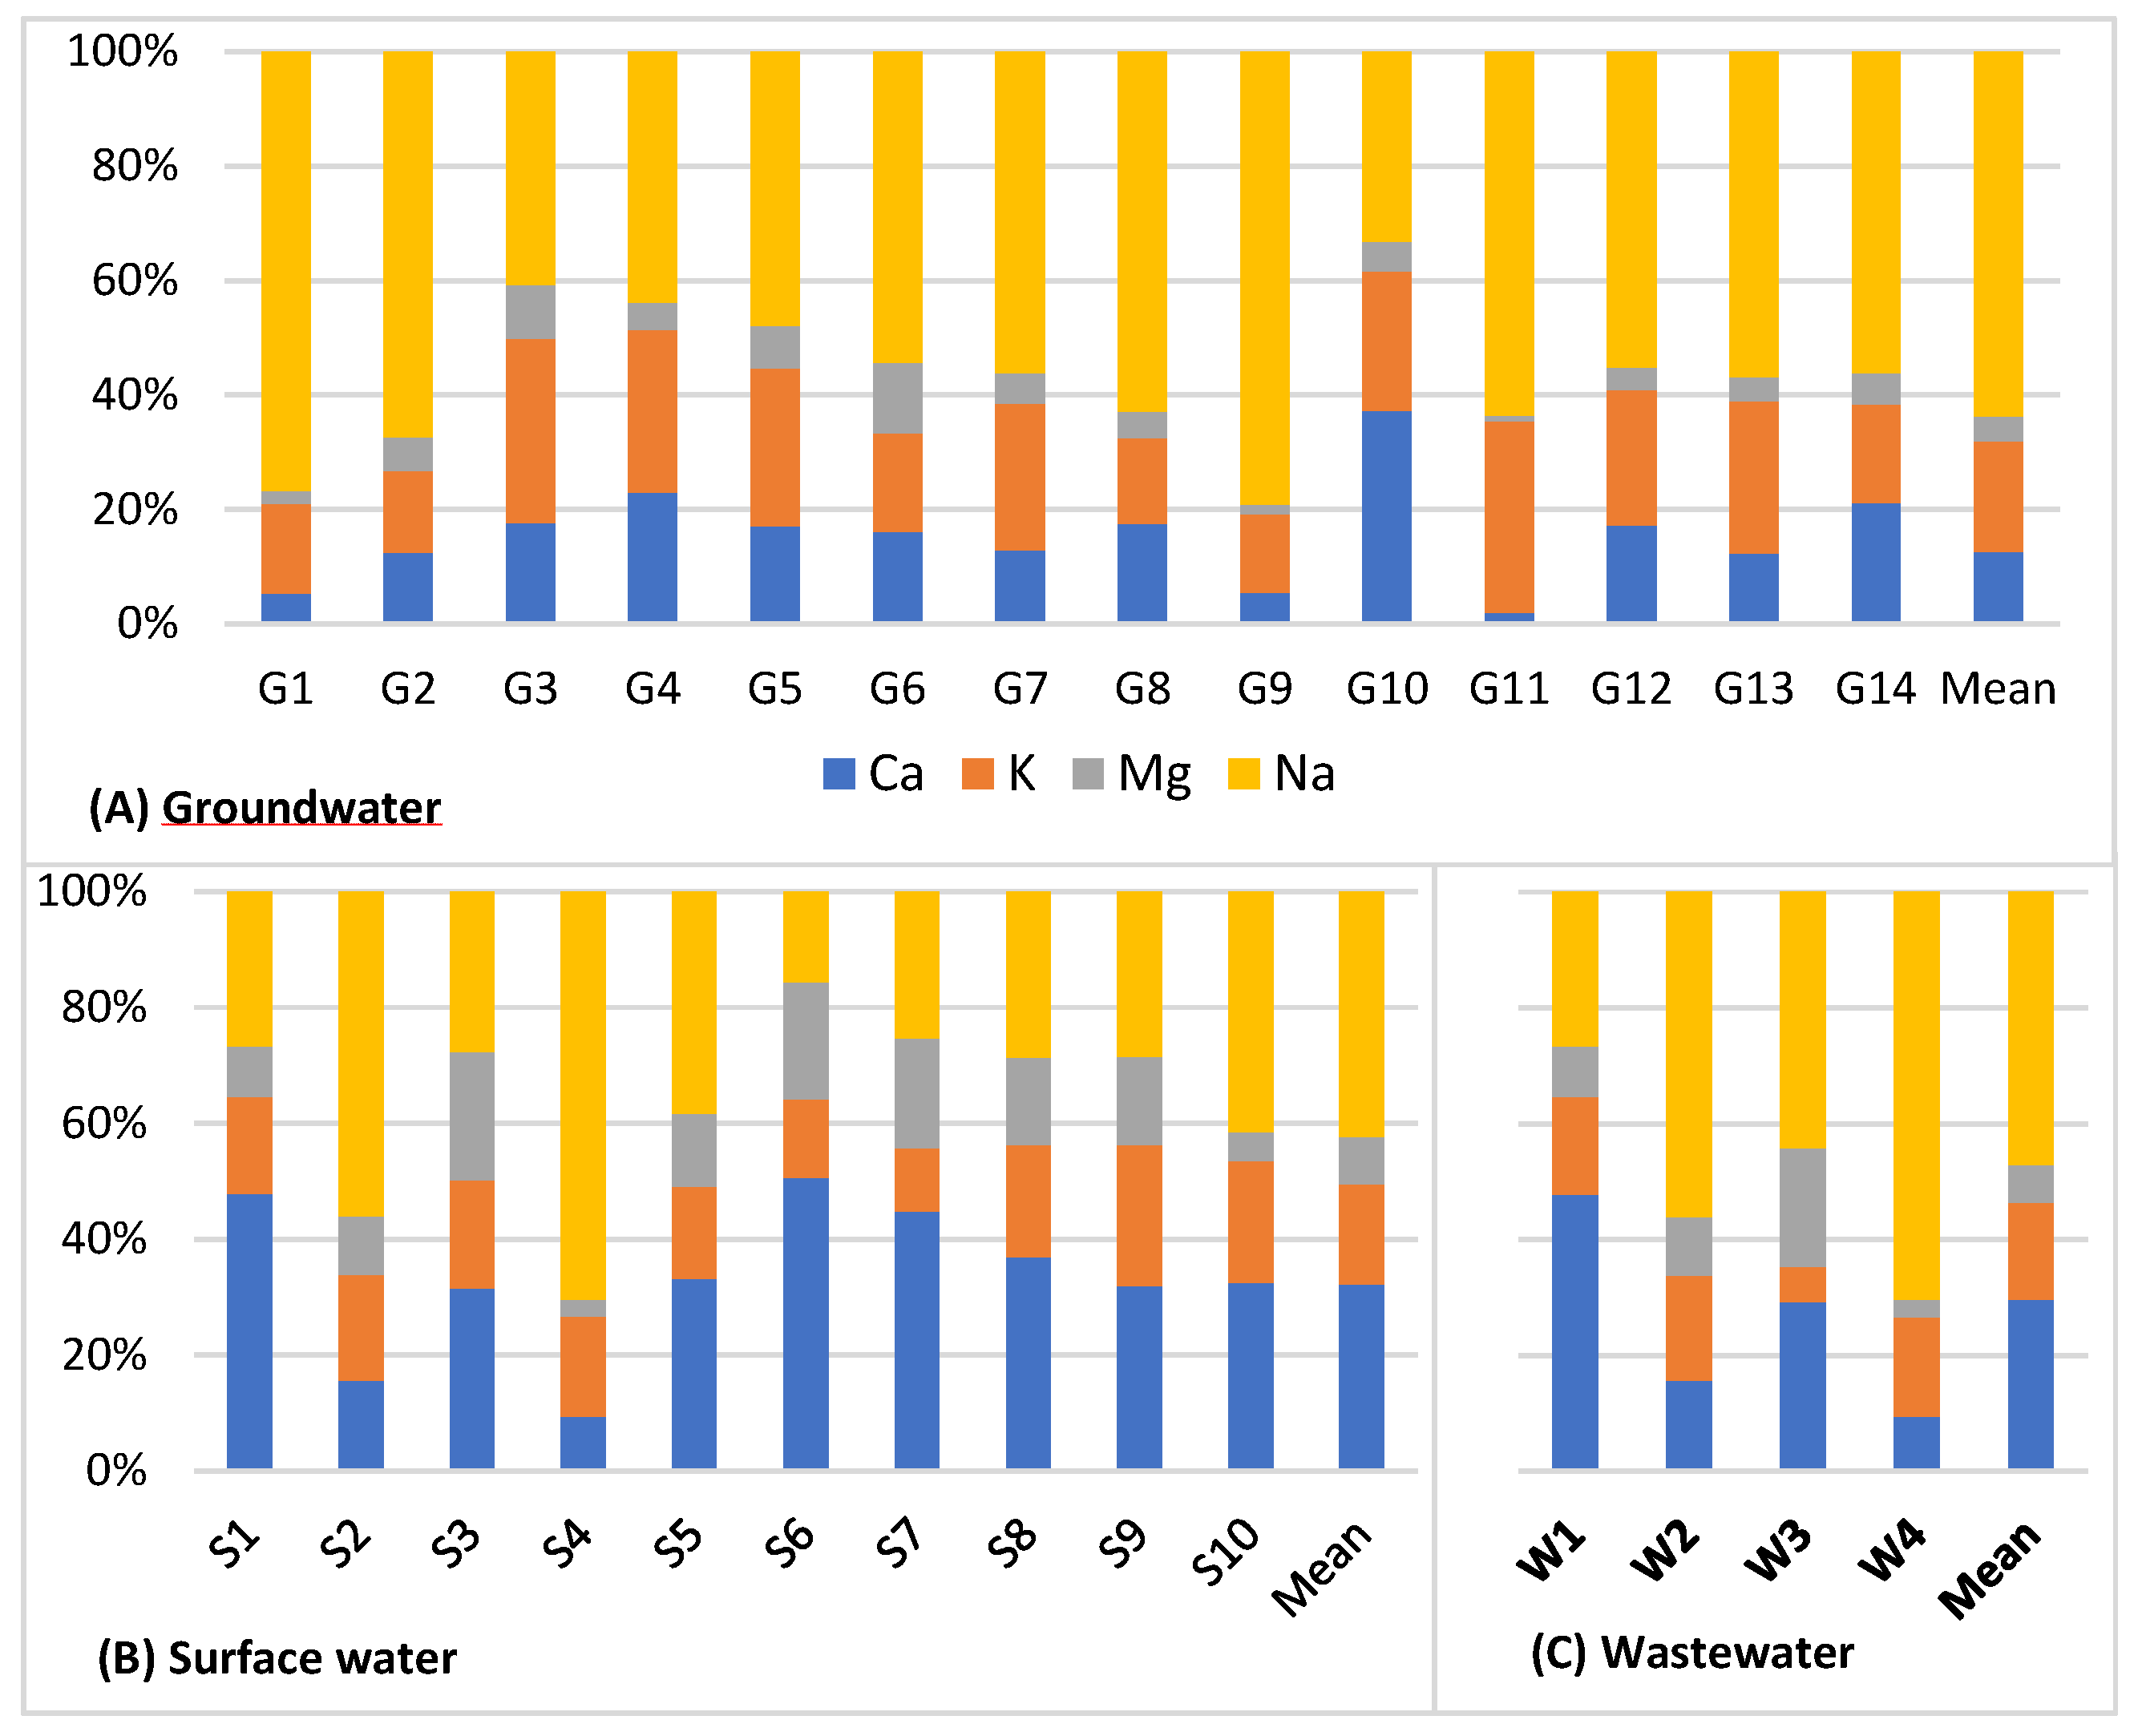
Figure 4.
Concentrations of metal major elements (Ca, K, Mg and Na) and metal trace elements in surface water, groundwater, and wastewater.
Figure 4.
Concentrations of metal major elements (Ca, K, Mg and Na) and metal trace elements in surface water, groundwater, and wastewater.
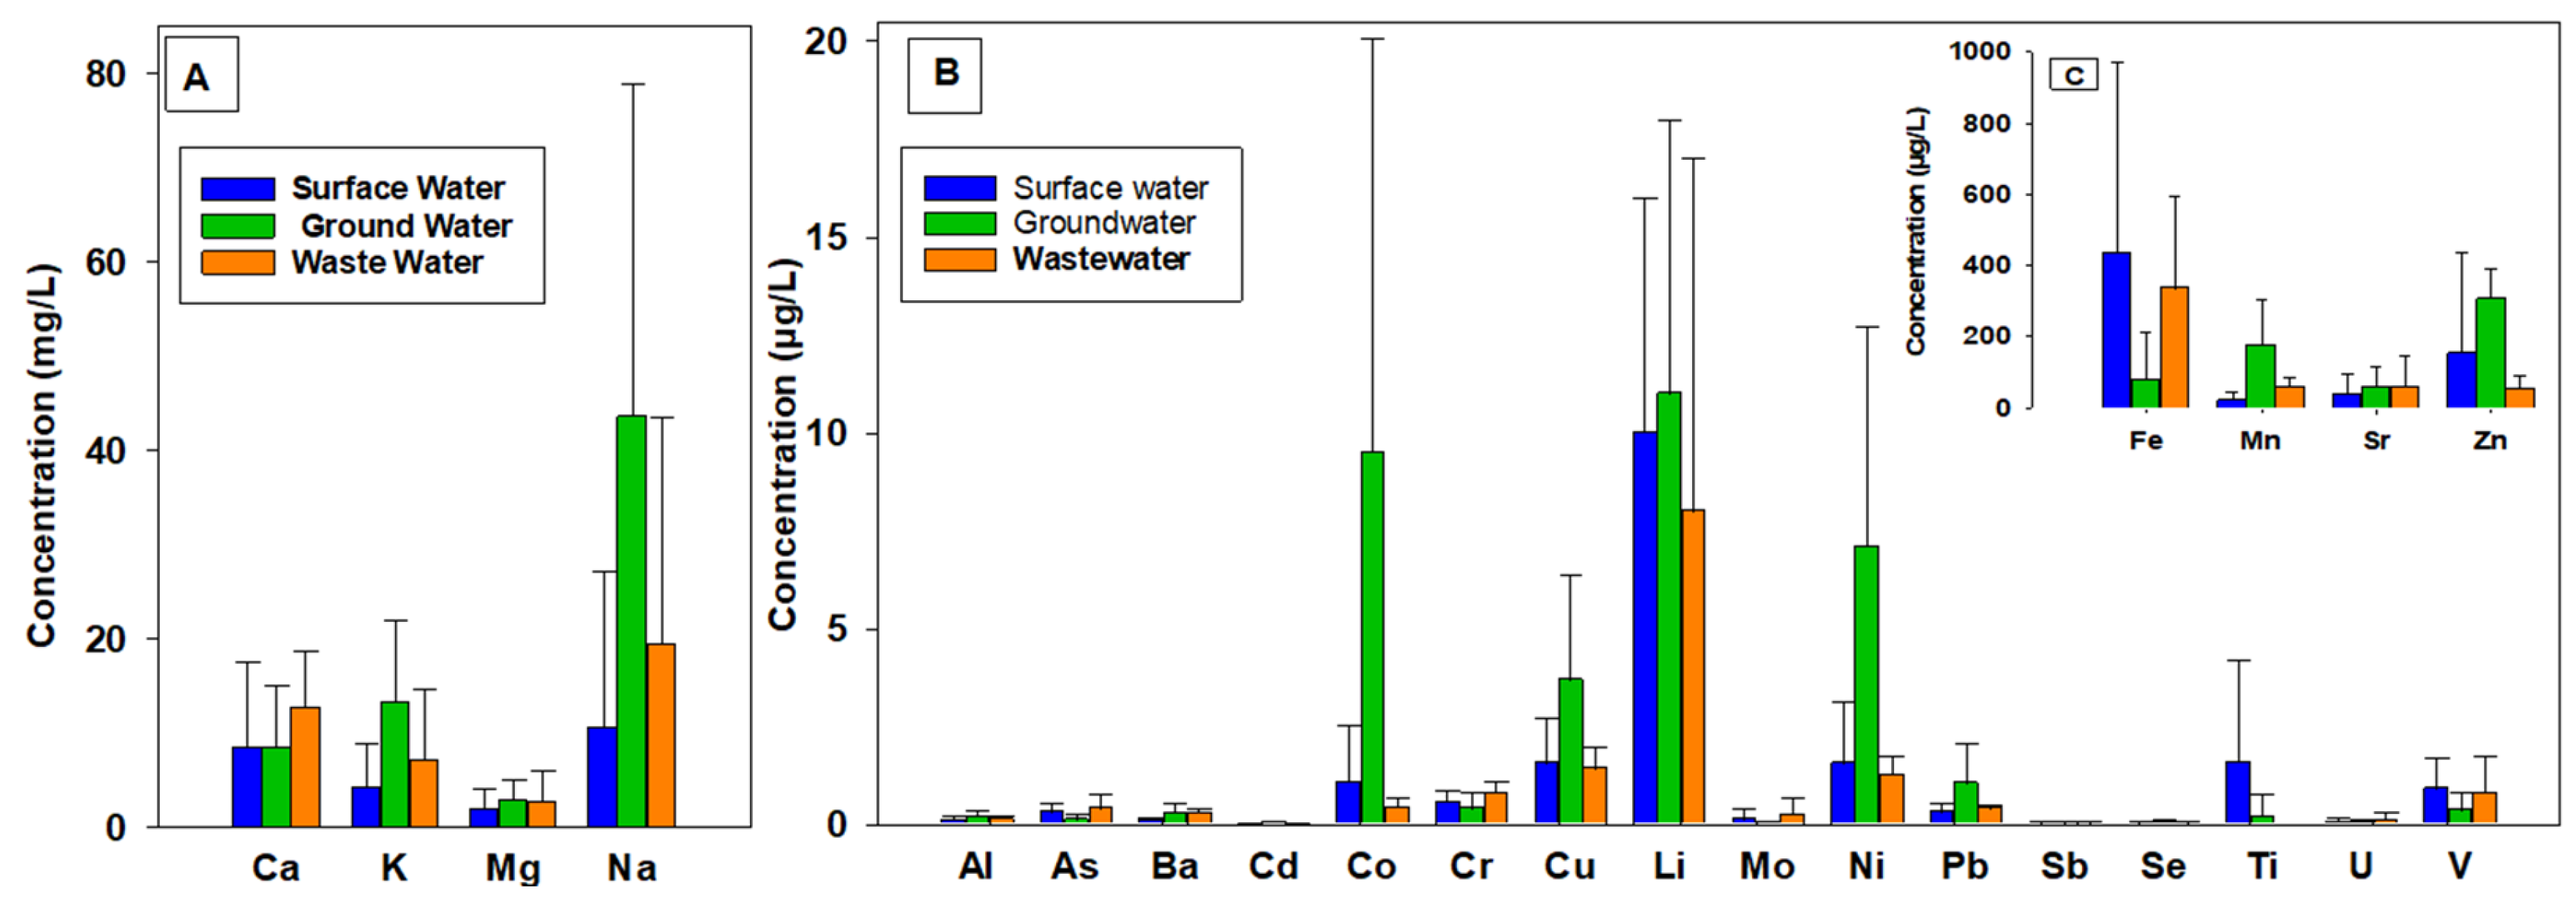
Figure 5.
Relative distribution (%) of trace metal elements in groundwater, surface water and in wastewater.
Figure 5.
Relative distribution (%) of trace metal elements in groundwater, surface water and in wastewater.
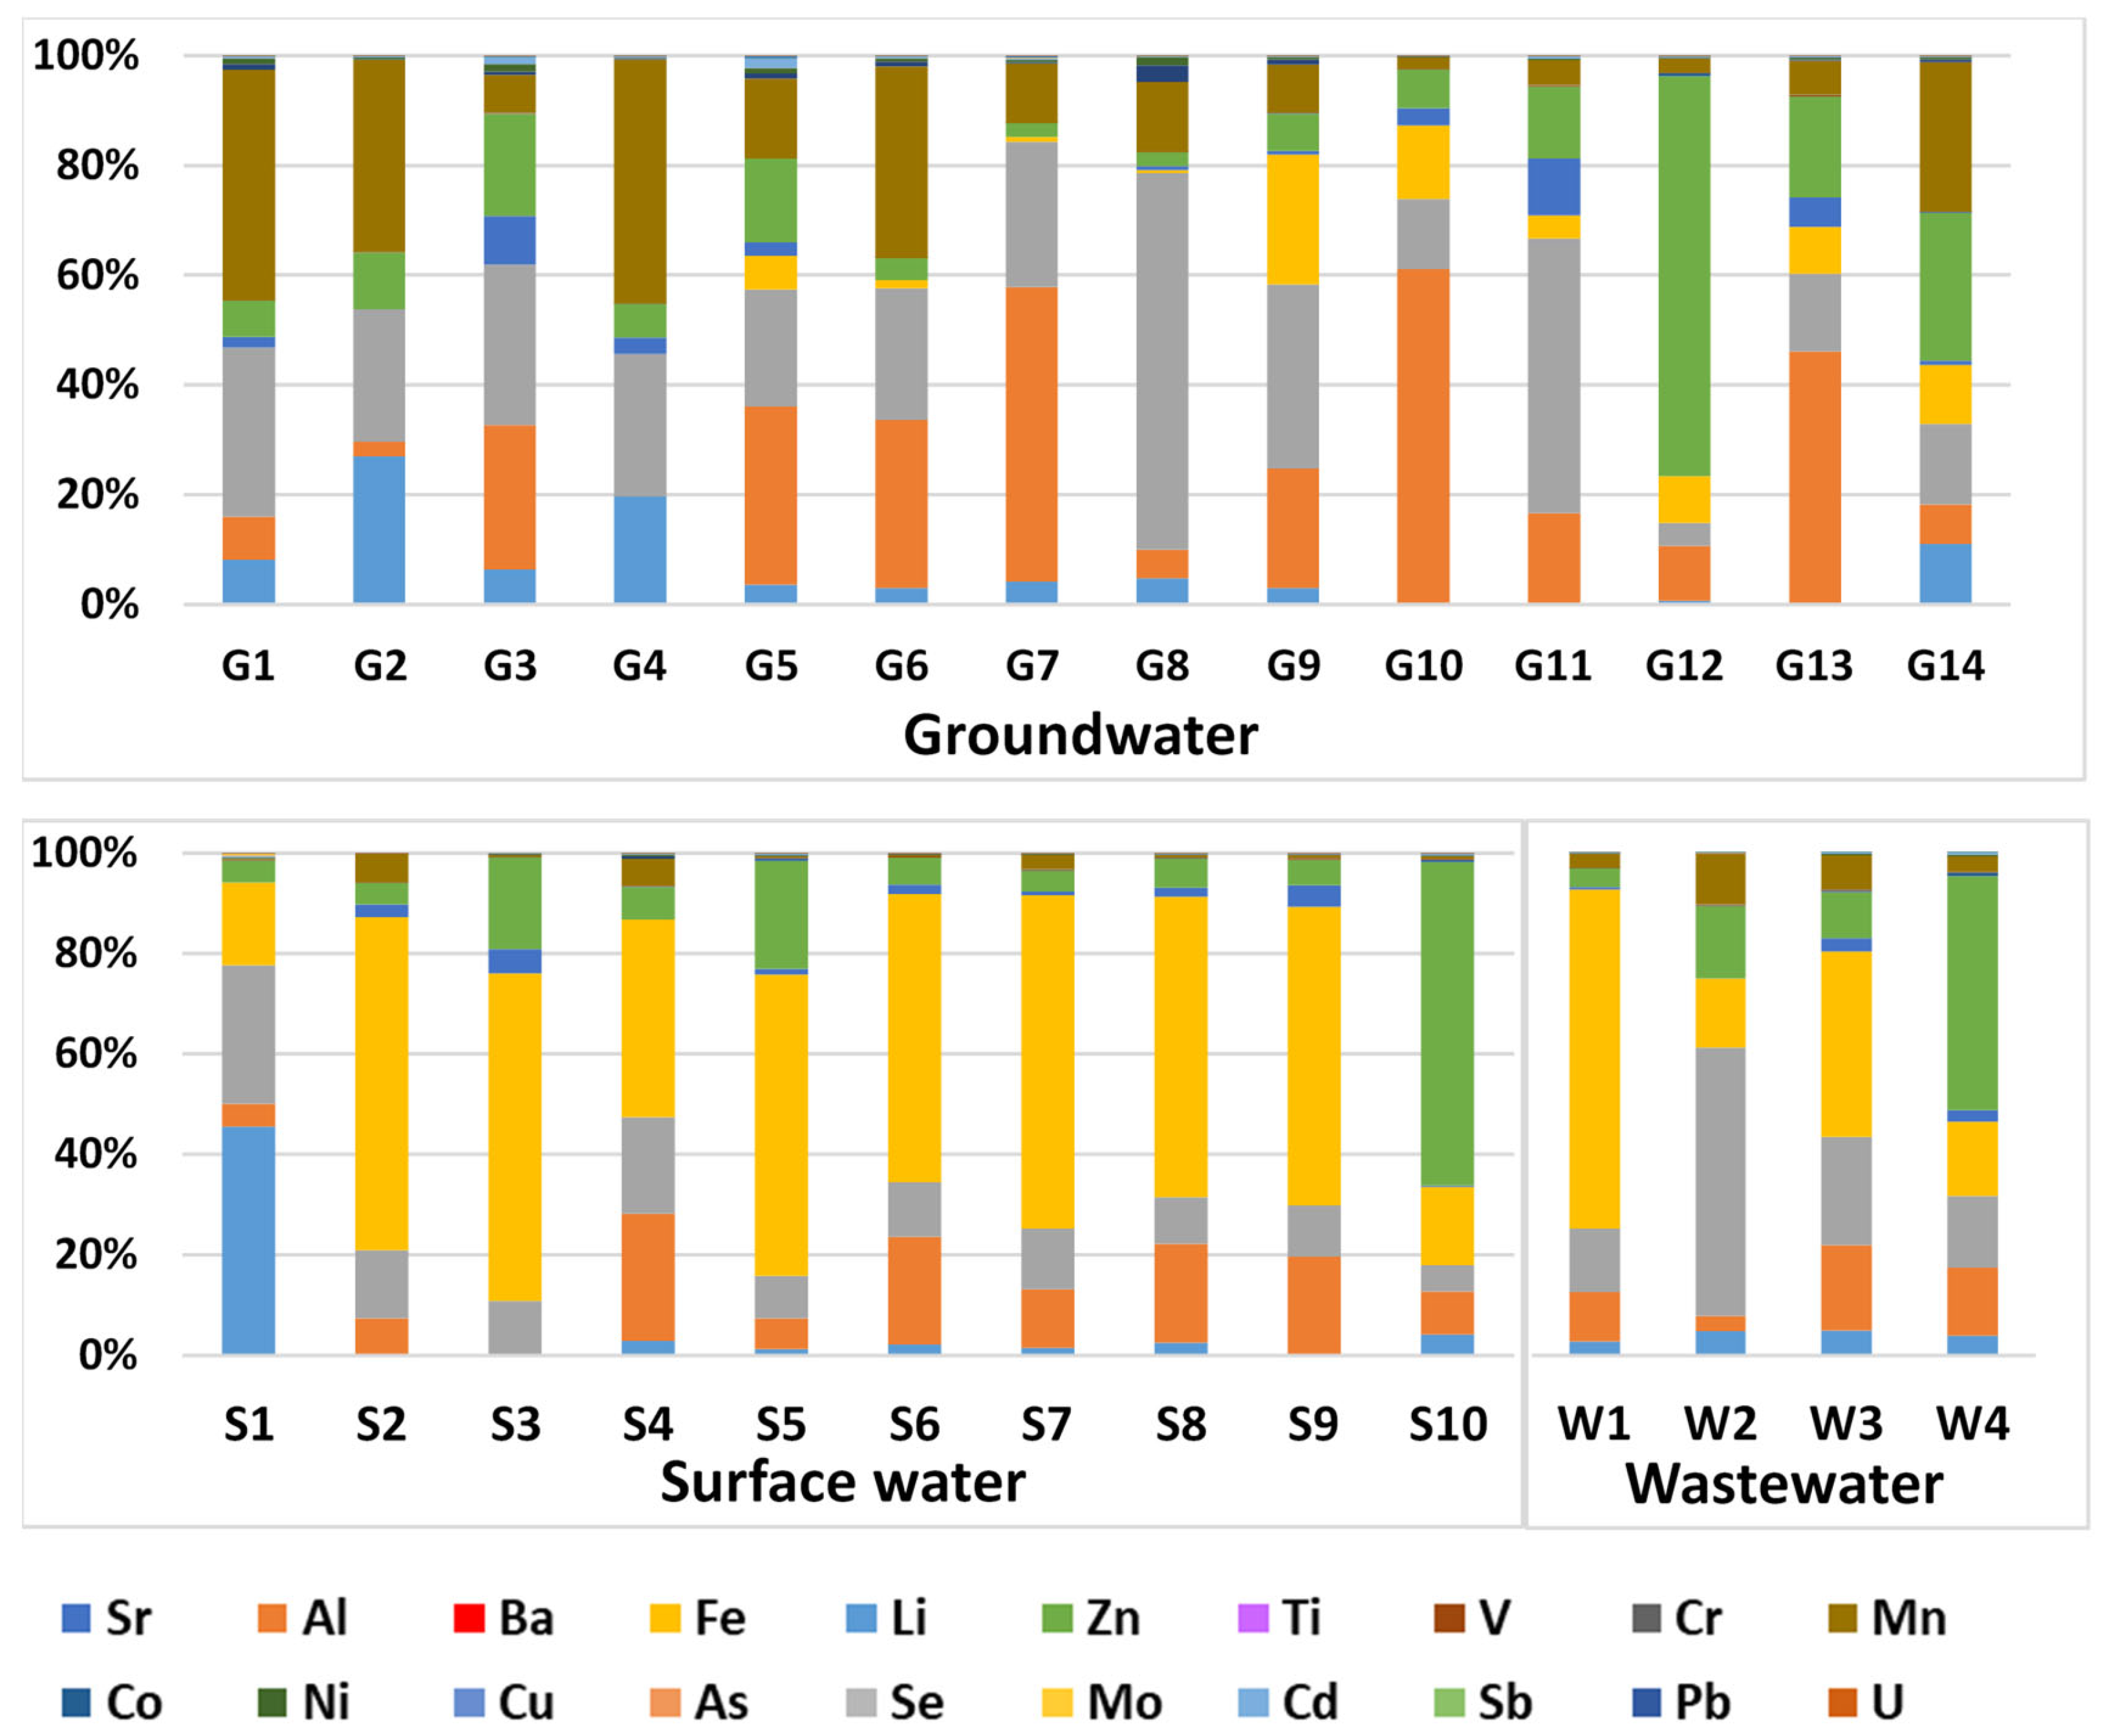
Figure 6.
Microvial contamination level in surface water and in groundwater.
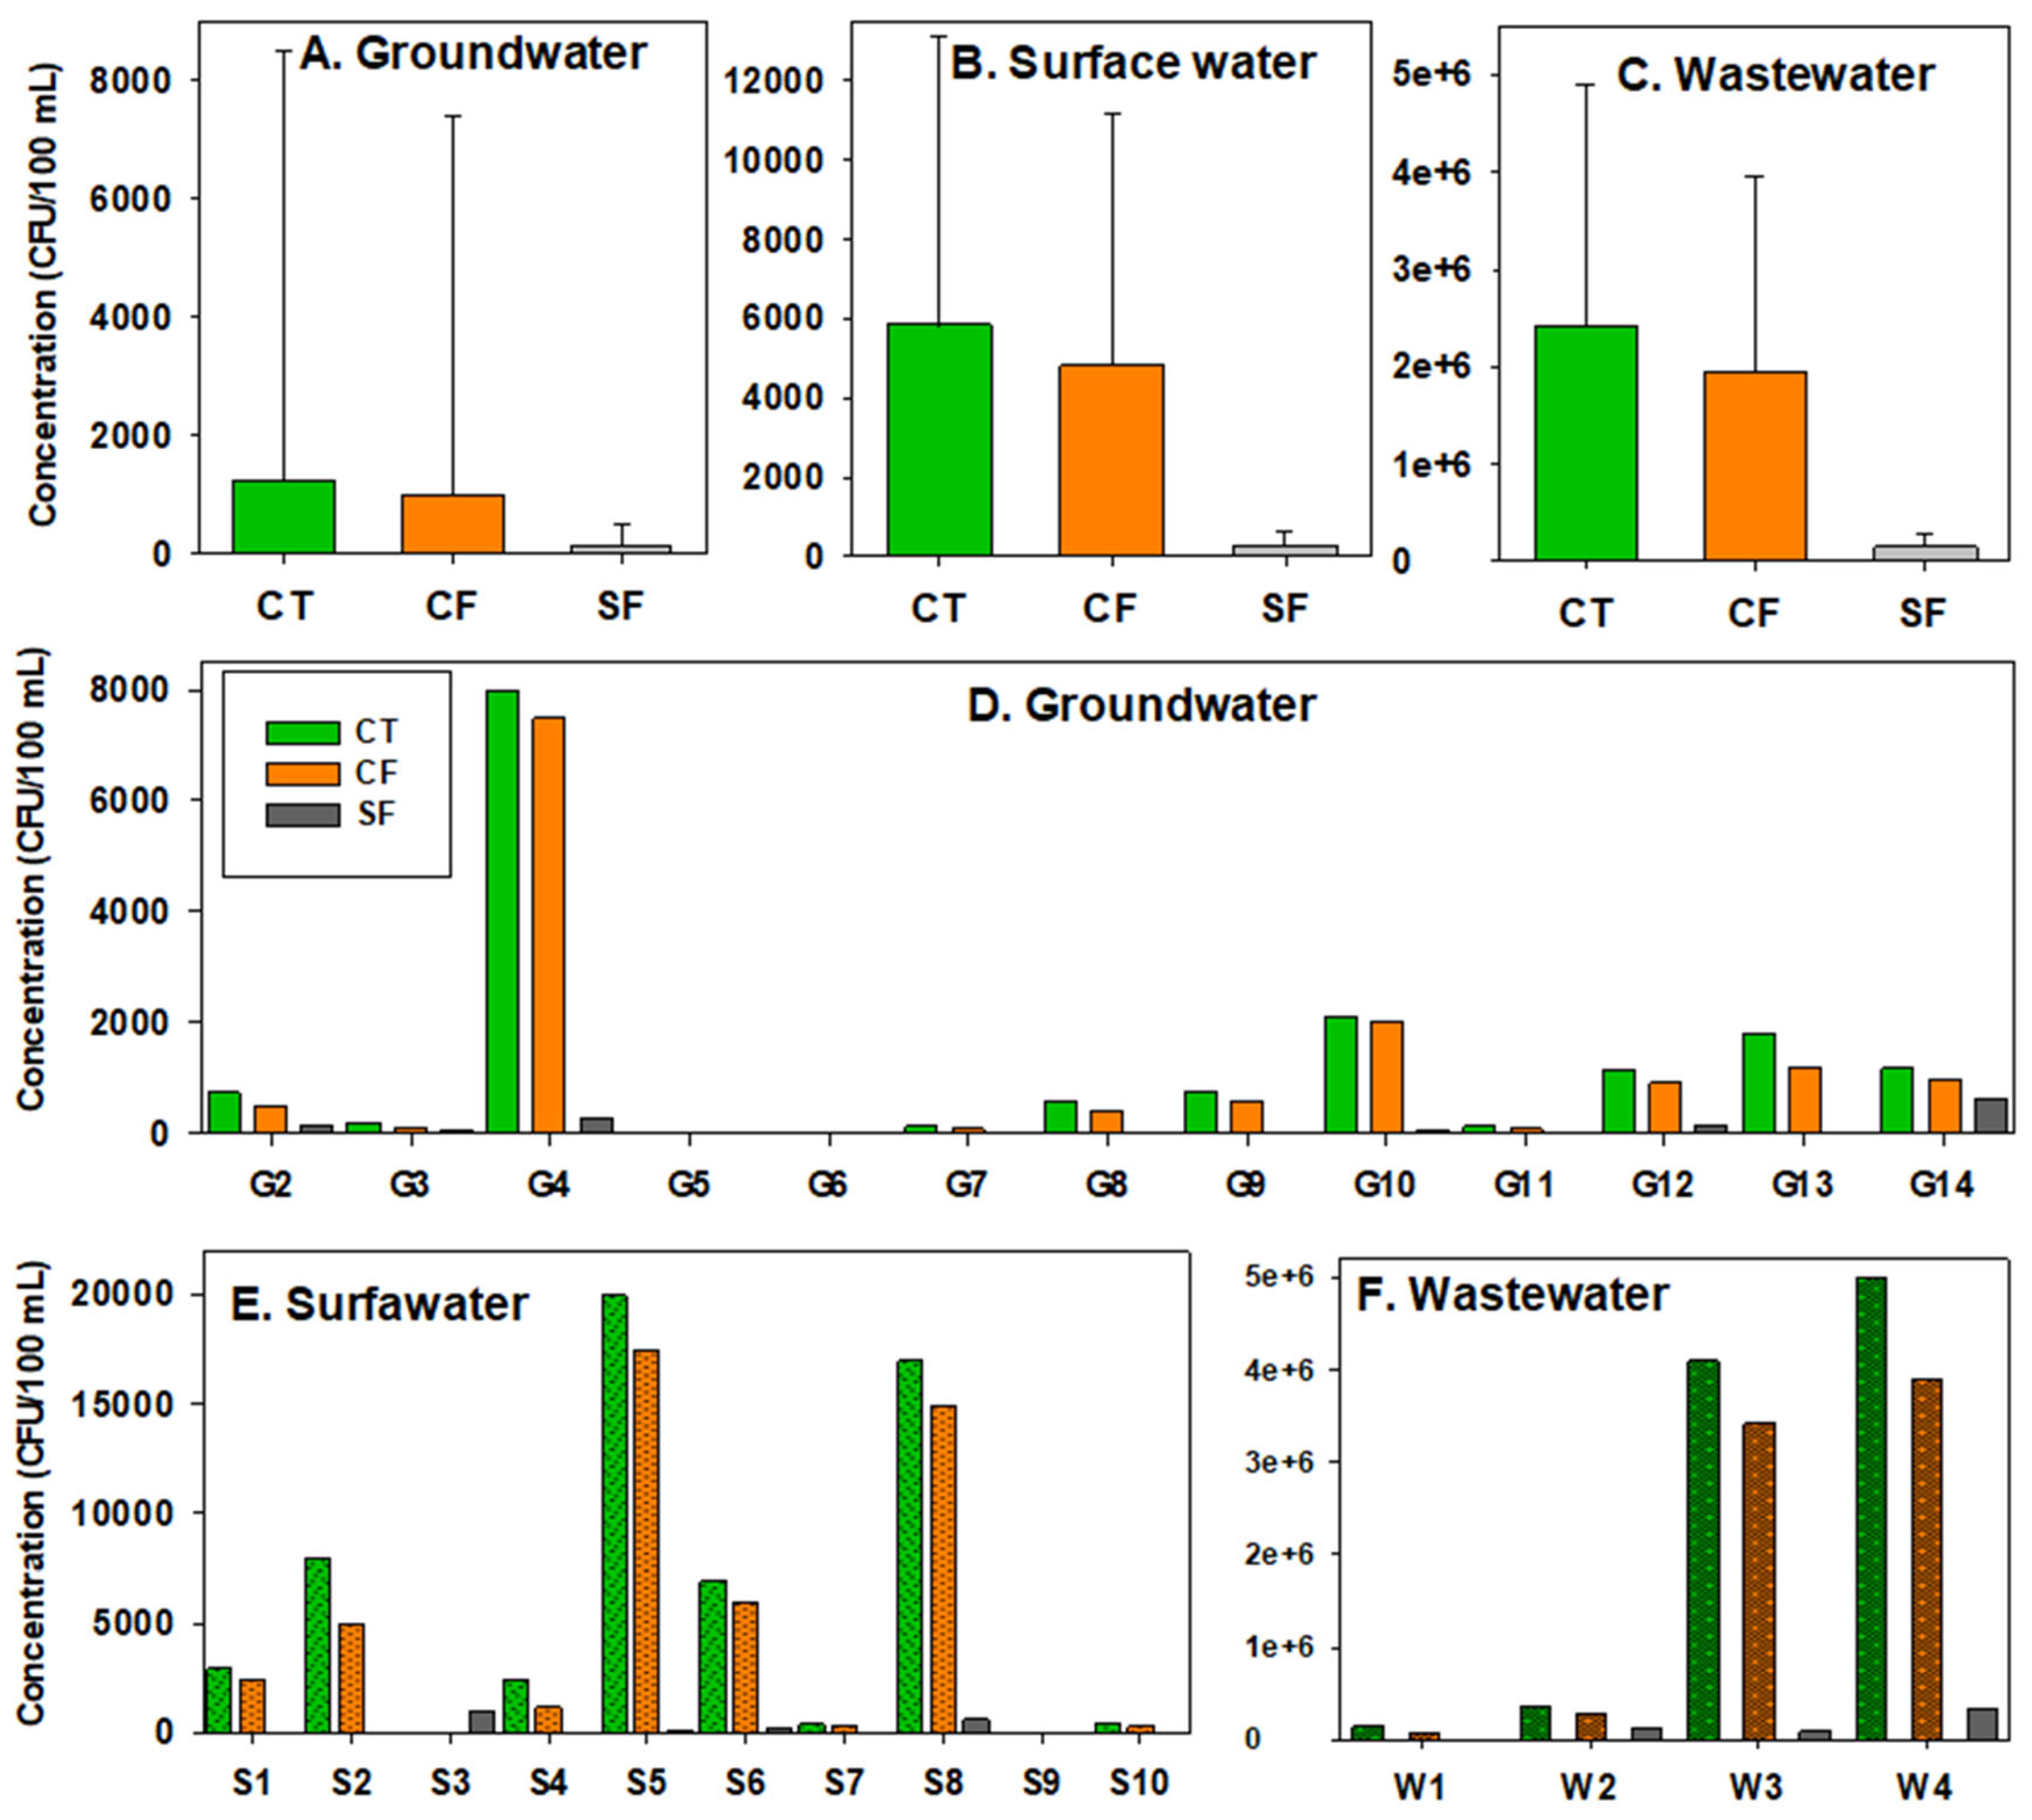
Table 1.
Information on the location and characteristics of the sampling points.
| Groundwaters |
Latitude N ; Longitude E |
Environmental Characteristics of the Study Sites |
| Altitude (m) | ||
| G1. Well Bazanga (358 m) | 04°27’01,3” 18°32’25,5” |
This well is a community well with a well-constructed parapet, used by local residents. |
| G2. Well Vara (360 m) | 04°23’20,6” 18°32’28,5” |
A well characterized by a defective protective parapet, yet commonly used by inhabitants of the locality. |
| G3. Well Ama (398 m) | 04°24’19,1” 18°34’50,9” |
A well located in a neighborhood adjacent to cemeteries. The well is used by the owners and nearby residents for various domestic purposes. |
| G4. Well Benz Vie (359 m) | 04°22’32,4” 18°33’26,5” |
A well situated in a low-lying zone prone to the infiltration of surface runoff, and regularly used by local residents. |
| G5. Drilled well Galabadja (388 m) | 04°24’47,9” 18°32431,3” |
This drilled well is used as a source of drinking water. |
| G6. Well Yembi (399 m) | 04°27’36,9” 18°31’56,0” |
The Yembi well is situated in a residential area and serves the surrounding population for domestic water use. |
| G7. Well Dedegue 5 (374 m) |
04°24’08,1” 18°32’57,2” |
The Dedegue 5 well is situated in a residential area and serves as a water source for nearby households, supporting a range of domestic activities such as washing, laundry, and, occasionally, food preparation. |
| G8. Well Decharge Kolongo (350 m) | 018°32’27,4’’ 04°19’54,0’’ |
This well is situated near a waste disposal (landfill) site. |
| G9. Well SEGA (345 m) | 018°32’53,6’’ 04°20’58,7’’ |
The SEGA well is situated within the same neighborhood and lies near the facilities of the Slaughterhouse Management Company. |
| G10. Well Ngoulekpa (359 m) |
018°29’48,1’’ 04° 23’08,2’’ |
The well is situated in a lowland agricultural area characterized by intensive vegetable cultivation and fertilizer use, and serves as a source of irrigation water. |
| G11. Well UCATEX (366 m) |
018°32’32,1’’ 04°2’02,9’’ |
The well is located within a family-owned compound and features a well-constructed parapet. It is situated in a neighborhood where a former textile manufacturing facility is located. |
| G12. Well KOKORO (357 m) |
018°31’27,7’’ 04°22’26,6’’ |
A frequently used well with poor maintenance conditions, located adjacent to a stagnant water body, which may increase its vulnerability to contamination. |
| G13. Well USACA (354 m) | 018°32’03,4’’ 04°19’28,7’’ |
Situated in an area frequently affected by flooding events. |
| G14. Well BAKONGO (351 m) |
018°33’25,2’’ 04°21’ 51,3’’ |
The well is situated in a lowland area surrounded by stagnant water bodies and is characterized by a deteriorated parapet. The surrounding neighborhood is prone to recurrent flooding. |
| Surface water | ||
| S1. Ngongonon Stream (384 m) | 04°25’25,7” 18°32’03,7” |
The stream traverses several densely populated neighborhoods characterized by substantial solid waste accumulation. Sampling point S1 is located in the upstream section, and the watercourse flows through sampling point S10 before discharging into the Oubangui River. |
| S2. Aquaculture pond (356 m) | 04°22’43,5” 18°39’45,4” |
An aquaculture pond used for household-scale fish production. |
| S3. MBoko Stream (358 m) | 04°21’46,9” 18°40’34,8” |
The site is located in a rural area east of Bangui. Surface water is extensively used by local communities for domestic activities such as laundry, bathing, and food preparation. The area is also characterized by artisanal fired-brick manufacturing. The stream eventually discharges into the Oubangui River. |
| S4. SODECA drinking water abstraction site (353 m) |
04°26’13,3” 18°35’27,6” |
This sampling site is located in Oubangui River. The site is operated by the Central African Water Distribution Company (SODECA), which abstracts raw water for drinking water production. It is exposed to effluents from the SAO port, a hub of commercial and transport-related activities, as well as discharges from two major hotels. Upstream, sand mining activities are practiced, while the riverbanks are characterized by diverse commercial operations. Water samples were collected directly from the Oubangui River. |
| S5. Ngola River (383 m) |
04°22’41,5” 18°32’22,4” |
Sampling site S5 is situated in a neighborhood characterized by significant household waste accumulation. The water is commonly used by local residents for laundry and other domestic activities. The watercourse subsequently drains into the Mpoko River, which ultimately joins the Oubangui River. |
| S6. Mpoko River (342 m) |
04°19’26,8” 18°32’21,0” |
Near its confluence with the Oubangui River, the river is influenced by effluent discharges from the MOCAF brewery. The surrounding area supports a wide range of commercial activities, including river-based transport of firewood and charcoal, as well as informal food vending along the riverbanks. The site also functions as an important marketplace for local communities. Water samples were collected by canoe approximately 2 km downstream of the confluence, beyond the primary mixing zone of the two water bodies. |
| S7. Balapa River (345 m) |
04°19’03,8’’ 18°31’29,3” |
Sampling site S7 (Balapa) is situated on the Oubangui River, downstream of its confluence with the Mpoko River. The site is characterized by fishing activities, canoe crossings, and informal riverside trade. River water is extensively used by nearby communities for domestic purposes, including bathing and laundry. |
| S8. SEGA River (348 m) |
04°20’50” 18°32’57,8” |
This site is exposed to direct inputs of untreated abattoir effluents, including blood and intestinal waste, discharged into the Oubangui River via an engineered drainage canal. The area is characterized by high population density and intense human activity. Water sampling was conducted by canoe at a distance of approximately 2 km from the riverbank. |
| S9. SAO River (348 m) |
04°21’33,5” 18°37’34,5” |
S9 sampling site is situated on the Oubangui River, is characterized by intensive cross-border commercial activities between Bangui and the Democratic Republic of the Congo. River water is commonly used for domestic purposes, including laundry, bathing, and occasionally food preparation, particularly by traders temporarily residing along the riverbanks during commercial operations. |
| S10. Langbashi Bridge (347 m) |
018°32’59,3’’ 04°21’17,9 ‘’ |
Sampling site S10 is situated within an urban drainage canal that traverses several residential neighborhoods and conveys stormwater contaminated with household solid waste. The canal serves as a receiving body for urban runoff and eventually drains into the Oubangui River. |
| Wastewater | ||
| W1. Wastewater from a restaurant (362 m) | 04°22’39,9” 18°33’46,1” |
Sampling point W1 is situated on the campus of the University of Bangui and corresponds to wastewater discharged from the university cafeteria. |
| W2. General Teaching Hospital. (384 m) | 018°34’35,5’’ 04° 22’19,1’’ |
Sampling point W2 corresponds to hospital wastewater from the General Teaching Hospital. The sampling location is situated at a hospital facility where wastewater is discharged into an engineered open drainage ditch that serves as a decentralized (non-sewered) wastewater disposal system. The hospital provides outpatient consultation services only and does not offer inpatient hospitalization. Consequently, the wastewater generated at the facility is primarily associated with outpatient medical activities, diagnostic services, and routine staff operations. |
| W3. Wastewater from Ledger Hotel (384 m) | 018°33’58,4’’ 04°33’01,6’’ |
Sampling point W3 was established at the Ledger Plaza Bangui, where wastewater is discharged into the drainage network without prior treatment. The effluent is characterized by a pronounced odor, suggesting substantial organic contamination. Strong odor noted during sampling. |
| W4. Community University Hospital (367) | 018°33’19,3’’ 04°23’17,2’’ |
Sampling point W4 was established at the Community University Hospital. Wastewater generated by hospital activities is initially collected in a retention basin before being conveyed to a drainage canal for disposal. This is a very busy hospital where many patients are admitted for inpatient care. Family members often accompany patients and stay at the hospital throughout the entire hospitalization period. Caregivers and relatives prepare meals, do laundry, and live alongside the patients during their stay. |
Disclaimer/Publisher’s Note: The statements, opinions and data contained in all publications are solely those of the individual author(s) and contributor(s) and not of MDPI and/or the editor(s). MDPI and/or the editor(s) disclaim responsibility for any injury to people or property resulting from any ideas, methods, instructions or products referred to in the content. |
© 2026 by the authors. Licensee MDPI, Basel, Switzerland. This article is an open access article distributed under the terms and conditions of the Creative Commons Attribution (CC BY) license (http://creativecommons.org/licenses/by/4.0/).
Copyright: This open access article is published under a Creative Commons CC BY 4.0 license, which permit the free download, distribution, and reuse, provided that the author and preprint are cited in any reuse.