

Submitted:
06 July 2026
Posted:
07 July 2026
You are already at the latest version
Abstract
Korla fragrant pear diseases and pests detection faces challenges such as significant object scale variation, multi-organ target confusion, and limited computational resources for real-time inference on edge devices. To address these issues, this study proposes a lightweight object detection model, KFP-YOLO, based on YOLO26n. A multi-organ dataset, the Korla fragrant pear diseases and pests dataset (KFP-PDD), was collected, covering pear leaves, fruits, and flowers and containing 11 classes including healthy and diseased samples. To reduce computational cost while maintaining effective feature representation, an ADown lightweight downsampling module is introduced. A C3-PD feature extraction module is designed by integrating Partial convolution and SE attention to reduce redundant computation and enhance feature representation capability. Furthermore, a CFA feature enhancement module is proposed, which incorporates coordinate attention into the multi-scale feature fusion process to improve spatial information modeling and fine-grained feature representation. Experimental results show that, compared with YOLO26n, KFP-YOLO reduces parameters and GFLOPs by 23.0 % and 23.7 %, respectively, while achieving an inference speed of 278.97 FPS. Meanwhile, mAP@0.5 reaches 94.65 %, with only a 0.44 percentage point drop. Ablation studies verify the effectiveness and synergistic optimization of each proposed module. Deployment experiments on the Jetson AGX Orin platform demonstrate strong real-time performance and edge computing adaptability, indicating that the proposed method offers an efficient solution for intelligent orchard diseases and pests monitoring.
Keywords:
Korla fragrant pear
; agricultural diseases and pests detection
; lightweight object detection
; YOLO
; edge devices
1. Introduction
China is the largest producer, consumer, and exporter of pears worldwide, with pear planting area and production accounting for more than 70 % of the global total [1]. As a characteristic Chinese pear cultivar, the Korla fragrant pear has long ranked first among pear varieties in China’s regional public fruit brand value list, demonstrating significant export value as well as strong economic and industrial driving effects. In recent years, with the continuous improvement of large-scale and standardized or-chard management, the Korla fragrant pear industry has gradually become one of the important pillar industries supporting rural revitalization and farmers’ income growth in Xinjiang, China [2]. However, in practical production, Korla fragrant pears are continuously threatened by multiple diseases and pests, including pear leaf fire blight,pear leaf spot disease,pear fruit grapholita molesta infestation,pear leaf infes-tation by pear gall midge and pear leaf insect damage [3,4]. These diseases and pests are di-verse and highly complex in natural environments, characterized by large object scale variation, subtle texture differences, uneven spatial distribution, and cross-organ oc-currence.In real orchard scenarios, variations in illumination, complex canopy struc-tures, and severe occlusion further reduce the visual distinction between healthy and diseased regions, leading to frequent false positives and missed detections [5,6]. Moreover, Korla fragrant pear involves multiple organs, including leaves, fruits, and flowers, where significant differences in color, texture, and morphology increase the difficulty of unified feature learning in vision-based detection models [7]. In addition, multiple diseases and pests often coexist in orchards, and methods designed for single disease or pest detection are insufficient for fine-grained orchard management. Failure to achieve timely and accurate detection may lead to fruit quality degradation, yield loss, and economic loss [8]. Therefore, developing a robust automated detection system is essential for precision orchard management.
In recent years, fruit tree disease and pest detection methods have evolved from traditional object detection approaches, such as Faster R-CNN and SSD, to YO-LO-based end-to-end detection frameworks, and have further incorporated Trans-former architectures to enhance feature representation in complex scenarios [9,10,11]. Among these methods, the YOLO series has become the mainstream technical route in agri-cultural disease and pest detection due to its favorable balance between detection ac-curacy and inference efficiency [12]. In the field of fruit tree disease and pest recognition, Mohanty et al. developed a convolutional neural network (CNN)-based plant disease classification model that achieved automatic recognition of 26 disease classes across 14 crop species, demonstrating the feasibility of deep learning for plant disease diagnosis [13]. Ferentinos et al. constructed a large-scale plant disease dataset based on PlantVillage and developed deep learning models for classifying 58 plant–disease categories across 25 plant species, demonstrating the effectiveness of CNNs in complex agricultural vision tasks [14]. Goyal et al. proposed a lightweight CNN model, AgriVision-L5, for citrus disease classification, achieving efficient disease recognition [15]. Liu et al. developed an improved YOLOv5 model (A-Net) for apple leaf disease detection by introducing the Wise-IoU loss function, attention mechanisms, and the RepVGG module to enhance detection performance [16]. Wang et al. proposed GFCD-YOLOXS, an improved YOLOXS-based model for grape disease detection. The model enhanced multi-level feature fusion through the integration of the FOCUS module and CBAM attention mechanism, while a dual-residual structure was adopted to improve network stability, achieving promising detection performance in complex field environments [17]. More recently, Liu et al. improved YOLOv11s by incorporating a GAM attention mechanism, Haar-based downsampling, and a weighted feature utilization module to enhance apple surface disease detection [18]. These studies indicate that attention mecha-nisms, multi-scale feature fusion, and lightweight network design have become im-portant strategies for improving fruit tree disease and pest detection performance.
Significant progress has also been achieved in pear disease and pest detection. Yang et al. constructed the PDD2018 dataset and systematically analyzed the effects of image resolution and environmental factors on recognition performance, revealing that complex backgrounds and small-scale lesions are major challenges. They further improved detection performance through transfer learning and input-resolution optimization [19]. Gu et al. proposed a deep convolutional neural network-based method combined with transfer learning for the classification of six apple and pear diseases. Their results demonstrate that pre-trained models can effectively improve classification performance under limited training data conditions. Their study demonstrated that pretrained models can effectively alleviate the limitations caused by insufficient training samples and improve classification accuracy [20]. Hai et al. developed a multimodal pear disease detection model with an attention aggregation module, improving feature fusion and detection robustness in complex orchard environments [21]. Cao et al. developed a MobileNet-based model for multi-class disease classification of Korla fragrant pear. The lightweight architecture significantly reduced computational complexity while maintaining competitive recognition accuracy, demonstrating the feasibility of deploying lightweight networks on resource-constrained devices for practical orchard applications [22]. With the advancement of object detection techniques, pear disease and pest research has gradually shifted from image classification to object detection and lesion localization. Chen et al. proposed the YOLOPears dataset and evaluated the performance of multiple YOLO models for pear disease detection [23]. Zheng et al. developed a semi-supervised detection framework based on YOLOv3-Tiny, enabling pear leaf disease detection under limited annotation conditions [24]. Wang et al. combined YOLOv5s and MobileNetV2 to construct a pear disease and pest detection system and implemented integrated applications for disease detection and spraying control [25].
Overall, existing studies have achieved significant progress in disease classifica-tion, object detection, lightweight model design, and application system development [17]. However, limitations remain in the collaborative detection of multiple disease and pest categories across different plant organs under complex orchard environments [7]. In par-ticular, Korla fragrant pear orchards still face challenges such as large-scale variations, severe background interference, and stringent real-time deployment requirements, which warrant further investigation. First, due to the high cost of data acquisition and annotation, existing datasets are relatively small and lack sufficient category coverage, with most studies focusing on a limited number of typical diseases or pests, which fails to reflect real-world orchard scenarios where multiple diseases and pests coexist [24]. Second, most existing object detection methods are designed for single-organ scenarios, focusing primarily on leaf regions while neglecting the coordinated detection of leaves, fruits, and flowers, which limits model generalization in complex orchard environments [22]. In addition, many approaches fail to adequately consider critical organs such as fruits and flowers, further restricting their robustness in real-world applications. Moreover, in practical deployment scenarios, edge devices are required to perform continuous multi-stream inference under low-power constraints, imposing higher demands on computational efficiency and memory usage, making it difficult to achieve a satisfactory trade-off between accuracy and efficiency [25].
To address these challenges, this study proposes three key improvement strategies to solve the imbalance between detection accuracy and computational efficiency in complex orchard environments:
(1) Dataset construction: A multi-organ dataset, the Korla fragrant pear diseases and pests dataset (KFP-PDD) was collected, covering three types of organs (leaves, fruits, and flowers) and 11 categories, consisting of 14,092 original images and 22,735 manually annotated bounding boxes, to enhance the model’s representational capacity and generalization ability in complex orchard scenarios;
(2) Model architecture: Based on YOLO26n, an ADown lightweight downsam-pling module is introduced to reduce redundant computation. A C3-PD feature extrac-tion module integrating Partial convolution and SE attention is designed to enhance fine-grained feature representation, and a CFA feature enhancement module is pro-posed to improve multi-scale feature fusion and spatial modeling capability;
(3) Deployment perspective: The model is optimized for edge computing and or-chard real-time monitoring scenarios, and deployed on the Jetson AGX Orin platform. Through lightweight structural design, the model reduces computational complexity while maintaining detection accuracy, thereby improving real-time inference capabil-ity and deployment feasibility on embedded devices.
In summary, the proposed KFP-YOLO achieves a good balance between detection accuracy and computational efficiency through lightweight model design, providing an efficient and practical solution for intelligent diseases and pests monitoring in Korla fragrant pear orchards and real-time edge deployment.
2. Materials and Methods
2.1. Image Data Acquisition
The image dataset of healthy and diseased Korla pear samples was collected from six orchards in the Aksu region of Xinjiang, China. The primary data collection period was from April to September 2025. To enhance the coverage and robustness of the dataset under different growth stages and environmental conditions, an additional data collection campaign was conducted from April to June 2026. The basic information of the orchards is presented in Table 1, and the spatial distribution and sampling locations are illustrated in Figure 1. Images were acquired using a Canon EOS 700D digital camera equipped with an 18–55 mm zoom lens, as well as high-resolution smartphone devices.
To ensure data diversity and realism, a combined field and indoor acquisition strategy was adopted.Field image acquisition was conducted under natural lighting conditions in real orchard environments. A center-composition strategy and multi-view shooting protocol were employed, including frontal, lateral, and top-view perspectives, to capture phenotypic characteristics of targets under varying illumination conditions and complex backgrounds.Indoor image acquisition was mainly performed on detached samples. White A4 paper or black shading cloth was used as the background, and supplementary lighting was applied to reduce environmental interference and enhance lesion visibility, thereby improving the clarity and discriminability of color and texture features.
The collected samples include healthy pear samples and multiple typical diseases and pests categories, such as pear fire blight, pear leaf spot disease, pear chlorosis disease, pear fruit grapholita molesta infestation,pear leaf infestation by pear gall midge,and pear leaf insect damage. Considering the significant differences in infection sites among diseases, data collection and category construction were conducted across three organs: leaves, fruits, and flowers.Different diseases exhibit strong organ-specific characteristics. For instance, leaf spot disease primarily affects leaves, pear fruit grapholita molesta infestation damages fruits, whereas fire blight may occur on leaves, fruits, and flowers simultaneously [26]. To reflect the complexity of real orchard conditions, a multi-organ disease detection dataset was constructed, containing 11 categories of healthy and diseased samples across three organs, as shown in Figure 2.This dataset not only captures intra-disease variations across different organs but also reflects significant differences in color, texture, and morphological features among organs, providing a valuable data foundation for intelligent diseases and pests detection in complex natural environments. All collected images were manually screened to remove blurred, duplicate, and low-quality samples. After preprocessing, approximately 11,000 valid images were retained for model training and evaluation.
2.2. Dataset Construction
Based on the collected raw image data, 3006 images from the publicly available Kaggle dataset Pear Leaf Disease were incorporated as supplementary data. This dataset mainly contains two categories, namely Pear Leaf Spot Disease and Pear Leaf Healthy. All images were manually annotated using the Labelme tool. Each image contains at least one valid detection object, and all objects were labeled using rectangular bounding boxes. The generated annotation files in JSON format were then converted into YOLO-format TXT files to meet the requirements of the object detection model.After completing data annotation, multi-strategy data augmentation was further applied to improve the model’s generalization ability and robustness in complex scenarios. For indoor-collected samples, the U²-Net segmentation model was first employed to precisely extract the target regions, reducing redundant background interference and highlighting key disease regions [27]. On this basis, a Mosaic5×5 augmentation strategy was applied to construct more complex multi-object composite scenes, thereby enhancing the model’s detection capability under dense object conditions [28]. For field-collected samples, in order to improve the model’s robustness and anti-interference ability in real orchard environments, random sandstorm noise was introduced to simulate windy and dusty weather conditions. In addition, Fourier transform and Gaussian frequency-domain filtering were applied to introduce frequency-domain perturbations and smoothing effects, simulating variations in illumination, motion blur, and sensor noise [29,30]. Subsequently, a Mosaic3×3 augmentation strategy was employed to construct training samples with larger scale variations and more complex backgrounds, thereby improving the model’s adaptability to field environments. After data augmentation, the dataset size increased from 14,092 images to 25,794 images, and the total number of labeled objects increased from 22,735 to 80,900, as summarized in Table 2. All images were resized to a uniform resolution of 640 × 640 pixels, and the dataset was split into training, validation, and test sets in an 8:1:1 ratio.
2.3. Object Detection Model and Improvements
YOLO26n is a new-generation lightweight object detection model developed by the Ultralytics team for edge deployment. It adopts a single-stage end-to-end architecture, consisting of a Backbone, Neck, and Head. The overall network structure of YOLO26n is similar to YOLO11n, but it further removes the Distribution Focal Loss (DFL), adopts end-to-end NMS-free inference, and introduces ProgLoss as well as Small Target-aware Label assignment (STAL).Although YOLO26n has been optimized in terms of architecture design and inference mechanism, it still faces challenges in diseases and pests detection tasks, such as information loss during the downsampling process and redundant feature representation. Therefore, further lightweight improvements and feature enhancement are still required [31].
2.3.1. KFP-YOLO Model Architecture
To reduce the interference of complex orchard backgrounds and illumination variations on YOLO26n, mitigate information loss during the downsampling process, and enhance the model’s ability to extract fine-grained diseases and pests features as well as multi-scale feature fusion, while also meeting the requirements of lightweight deployment and real-time inference on edge devices, several improvements are introduced [12]. Specifically, the ADown module is incorporated into the backbone network to replace part of the original convolution (Conv) modules. In the feature extraction stage, the C3-PD module is adopted to replace the original C3k2 module. In addition, the CFA feature enhancement module is used to replace the original Concat feature fusion structure. Through the synergistic effect of multi-branch downsampling, Partial convolution, and coordinate attention mechanisms, the model achieves a balance between computational complexity and detection performance.The overall architecture of the KFP-YOLO model is illustrated in Figure 3.
2.3.2. Lightweight Downsampling Module ADown
The ADown module integrates average pooling and max pooling to achieve a combination of global information preservation and salient local feature extraction [32]. Compared with traditional downsampling methods that rely solely on adjusting the convolution stride, ADown can more effectively capture multi-scale features while reducing spatial resolution and minimizing information loss.As shown in Figure 4, the input feature map first passes through an average pooling layer, which compresses the spatial dimensions while preserving global contextual information. It is then split into two sub-feature maps along the channel dimension. The two sub-features are processed in parallel through separate branches with different transformation paths.Branch A directly applies convolution operations for further feature extraction. Branch B first applies max pooling to capture prominent local features such as lesion regions, followed by a convolution layer for channel-wise processing. Finally, the outputs of the two branches are concatenated to obtain the final output feature map. The process can be expressed mathematically as follows:
This multi-branch architecture introduces richer feature combinations and information interactions, enabling the model to adaptively adjust its attention to features at different scales according to environmental conditions such as illumination variations and background complexity. In the task of pear diseases and pests detection, this module helps maintain high detection accuracy under complex backgrounds, effectively preventing the loss of small-scale features, thereby reducing false detection rates and improving system reliability.
2.3.3. Lightweight Feature Extraction Module C3-PD
To further enhance the model’s ability to extract pear lesion features in complex orchard environments, the C3-PD module is designed, as illustrated in Figure 5. This module replaces the original standard Bottleneck structure with a PDBlock, aiming to balance feature extraction accuracy and computational cost.The C3-PD module adopts a dual-branch parallel topology. After the input feature map enters the module, it is processed by two parallel convolution layers for channel adjustment and preliminary feature mapping. The main branch performs deep feature evolution by stacking n consecutive PDBlocks, while the shortcut branch preserves the original shallow feature information.As the core component of the module, the PDBlock integrates Partial convolution and SE attention mechanism. Partial convolution is used to reduce computational redundancy across channels, while the SE attention mechanism adaptively reweights channel-wise lesion features [33,34]. To ensure effective information flow in deep networks and alleviate gradient vanishing, a residual addition mechanism is introduced within the PDBlock.The process can be expressed as follows:
This structure reduces redundant computations through partial connectivity while enhancing the response to critical features via the attention mechanism. As a result, it achieves a reduction in parameter count while maintaining strong feature representation capability. In diseases and pests recognition tasks, this module helps improve the model’s ability to capture fine-grained lesion regions.
2.3.4. CFA Feature Enhancement and Multi-Scale Fusion Module
The CFA module introduces a coordinate attention mechanism to model spatial positional information by decomposing directional features and reconstructing feature representations based on the input feature map, thereby enhancing the model’s ability to represent the spatial distribution of pear lesions, as illustrated in Figure 6. Specifically, the input feature maps are first concatenated along the channel dimension to obtain fused features. Then, global average pooling is applied along both horizontal and vertical directions to extract contextual information in each direction. The features from the two directions are concatenated and passed through shared convolution, batch normalization (BN), and SiLU activation functions for feature transformation and channel compression.The resulting intermediate feature is then split along the spatial dimension into horizontal component and vertical component . To enable adaptive learning of inter-channel relationships, two independent convolution layers are used to restore the original channel dimensions, followed by a Sigmoid activation function to generate attention weight maps for each direction.Finally, the generated horizontal and vertical attention weights are applied to the input feature map through element-wise multiplication, producing the final weighted output feature [35]. The process can be expressed as follows:
This mechanism aggregates features along both horizontal and vertical directions, enabling the model to more effectively locate key pathological features while suppressing complex background noise when processing fine-grained pear lesions with subtle textures.
2.4. Experimental Environment and Parameters
The experiments in this study were conducted on both a high-performance PC platform and an embedded edge computing platform to comprehensively evaluate the performance of the proposed model in terms of training efficiency and practical deployment capability. A dual-environment framework consisting of PC-based training and edge-device inference was adopted to ensure both development efficiency and engineering applicability, as summarized in Table 3. In the training stage, experiments were conducted on a workstation running Windows 11, equipped with an Intel Core i9-13900KF CPU (3.00 GHz), an NVIDIA GeForce RTX 4080 GPU, and 32 GB of RAM. The software environment included Python 3.12.12, PyTorch 2.5.1, and CUDA 12.1. The following tools and versions were employed during the experiments: Ultralytics 8.4.0 for model training and framework support, THOP 2.0.18 for computational complexity analysis, and ONNX 1.16.0 for model format conversion and deployment compatibility.In the deployment stage, the trained model was evaluated on an NVIDIA Jetson AGX Orin Developer Kit. The device runs Ubuntu 22.04 LTS and is equipped with a 12-core Arm Cortex-A78AE v8.2 64-bit CPU, an NVIDIA Ampere GPU with 2048 CUDA cores, and 64 GB LPDDR5 memory. The deployment environment was optimized using JetPack SDK 6.0 and TensorRT 10.0.1 to accelerate inference and improve real-time performance on edge devices.
Regarding experimental parameters, all input images were resized to 640 × 640 pixels. The number of training epochs was set to 300, and the batch size was set to 32. The stochastic gradient descent (SGD) optimizer was adopted, with an initial learning rate (lr0) of 0.01 and a final learning rate factor (lrf) of 0.01. To ensure reproducibility, the random seed was fixed at 0.For data augmentation, multiple strategies were applied to improve model generalization, including HSV color augmentation (hsv_h = 0.015, hsv_s = 0.7, hsv_v = 0.4), random translation (translate = 0.1), random scaling (scale = 0.5), horizontal flipping (fliplr = 0.5), and Mosaic augmentation (mosaic = 1).
Overall, the proposed experimental configuration ensures strict consistency in software versions, sufficient hardware support, and well-controlled training parameters, thereby guaranteeing the reliability, reproducibility, and practical applicability of the experimental results in real orchard scenarios.
2.5. Evaluation Metrics
In the training experiments, Precision (P), Recall (R), and mean Average Precision at different IoU thresholds (mAP@0.5 and mAP@0.5:0.95) were adopted as the primary evaluation metrics to measure detection accuracy. Precision reflects the proportion of correctly predicted positive samples among all predicted positive samples, while Recall evaluates the model’s ability to detect all ground-truth objects. Mean Average Precision provides a comprehensive measure of detection performance across multiple categories and confidence thresholds.
In addition, several metrics were introduced to evaluate model complexity and real-time performance. In terms of model complexity, Model Size (MB) denotes the actual storage size of the trained weight file, reflecting memory consumption during deployment. Params (M) represents the total number of learnable parameters in the model, which is commonly used to measure model scale. GFLOPs indicates the number of floating-point operations required during inference and is used to evaluate computational complexity.In this study, GFLOPs are calculated based on the PyTorch (.pt) model using the THOP library. To better reflect real deployment conditions, the computational cost is further extended to an end-to-end estimation, including preprocessing (e.g., image resizing and normalization) and post-processing operations (e.g., Non-Maximum Suppression and coordinate mapping). Therefore, compared with GFLOPs reported only for forward propagation, the results in this work more accurately reflect the actual computational burden in practical deployment scenarios.FPS (Frames Per Second) is a key indicator for evaluating real-time inference performance in edge-device deployment. In this work, the trained PyTorch model is first exported to ONNX format and further converted into a TensorRT engine to accelerate inference on edge devices. FPS is measured on the edge platform by recording the complete inference pipeline, including preprocessing, model inference, and post-processing. The final FPS value represents the number of images processed per second under real operating conditions, providing a more realistic evaluation of the model’s deployment efficiency in orchard monitoring systems.
3. Experimental Results and Analysis
3.1. Comparative Experiments
A series of comparative experiments were conducted using several mainstream lightweight and medium-scale object detection models. All models were trained and tested under the same training strategy and on the KFP-PDD dataset, and the corresponding results are reported in Table 4. Overall, the detection accuracy of models tends to improve as model complexity increases. Among them, YOLO26s achieved the highest detection accuracy, with mAP@0.5 reaching 96.49 %. However, its parameter count and computational cost increased to 9.96M and 22.54 GFLOPs, respectively, resulting in significantly higher model complexity and reduced suitability for edge-device deployment. YOLOv13s also achieved relatively high detection performance, with mAP@0.5 reaching 96.28 %, but it also suffered from increased computational cost and noticeable degradation in real-time performance. Among lightweight models, YOLOv5n achieved the highest inference speed, reaching 321.85 FPS; however, its mAP@0.5, Precision, and Recall were lower than those of most compared models, indicating limited feature representation capability in complex diseases and pests scenarios. YOLOv8n, YOLO12n, and YOLOv13n showed improvements in detection accuracy, but some of them experienced a noticeable drop in inference speed.In contrast, YOLO26n achieves a better balance between detection performance, model complexity, and real-time capability while maintaining low computational cost. It obtains an mAP@0.5 of 95.09 %, with Precision and Recall reaching 93.87 % and 90.73 %, respectively. Meanwhile, its computational cost is only 5.79 GFLOPs, and its inference speed reaches 259.79 FPS.Considering detection accuracy, inference speed, and edge deployment requirements, YOLO26n is selected as the baseline model for subsequent improvements to further enhance detection accuracy and efficiency.
3.2. Ablation Experiments
To evaluate the impact of each improved module on model performance, stepwise ablation experiments were conducted based on YOLO26n, and the results are presented in Table 5. After introducing the ADown module, the number of model parameters decreased from 2.51M to 2.27M, and GFLOPs were reduced from 5.79 to 5.09, while FPS increased to 272.43 FPS. This indicates that the module effectively reduces computational overhead in the downsampling stage and improves inference speed. Meanwhile, mAP@0.5 only slightly decreased from 95.09 % to 94.98 %, and mAP@0.5:0.95 dropped to 76.68 %, demonstrating that the model maintains comparable detection performance while achieving lightweight improvements.After introducing the C3-PD module, the parameter count further decreased to 2.13M and FPS increased to 304.86 FPS, showing the most significant improvement in lightweight performance. However, mAP@0.5 decreased to 94.43 %, mAP@0.5:0.95 decreased to 75.76 %, and Precision and Recall dropped to 93.17 % and 90.18 %, respectively, indicating that excessive compression of feature representation can negatively affect detection accuracy in diseases and pests scenarios.After introducing the CFA module, mAP@0.5 increased to 95.56 % and mAP@0.5:0.95 improved to 78.12 %, while Precision and Recall reached 94.28 % and 91.04 %, respectively. These results demonstrate that the CFA module effectively enhances feature extraction of key disease regions. Meanwhile, FPS remained at 267.94 FPS, indicating that the performance gain comes with only a minor computational overhead.
In the combined module experiments, a certain degree of synergistic improvement was observed among different modules. After combining ADown and C3-PD, the parameter count decreased to 1.89M and GFLOPs dropped to 4.41, with FPS increasing to 291.62 FPS, further improving model lightweight efficiency. However, due to excessive feature compression, mAP@0.5 decreased to 94.27 % and mAP@0.5:0.95 decreased to 75.48 %, resulting in a slight loss in detection accuracy.When ADown and CFA were combined, mAP@0.5 reached 95.61% and mAP@0.5:0.95 reached 78.35 %, with Precision and Recall improving to 94.46 % and 91.12 %, respectively, outperforming the baseline YOLO26n. Meanwhile, the model size is only 2.22M, and FPS reaches 270.73 FPS, indicating that the CFA module can effectively compensate for feature loss caused by lightweight design and achieve a better balance between accuracy and speed.For the combination of C3-PD and CFA, FPS reached 286.41, while mAP@0.5 and mAP@0.5:0.95 improved to 94.85 % and 76.94 %, respectively, compared with using C3-PD alone. This demonstrates that the CFA module can alleviate the feature representation degradation caused by lightweight structures to some extent.
Overall, after integrating all three proposed modules, the final KFP-YOLO reduces parameters from 2.51M to 1.93M (23.0 % reduction) and GFLOPs from 5.79 to 4.42 (23.7 % reduction), while FPS increases to 278.97 FPS (7.4 % improvement). Meanwhile, mAP@0.5 reaches 94.65 %, only 0.44 percentage points lower than the baseline. These results demonstrate that the proposed modules effectively reduce model complexity while maintaining competitive detection accuracy, providing an efficient solution for real-time orchard diseases and pests detection.
3.3. Model Feature Visualization Analysis
To further analyze the differences in feature attention for the diseases and pests detection task, a visual comparison of detection results and Grad-CAM feature heatmaps between YOLO26n and KFP-YOLO was conducted, as shown in Figure 7. From the detection results, both models are capable of accurately localizing and classifying diseases and pests targets, and their overall detection performances are relatively similar. Compared with the baseline YOLO26n model, KFP-YOLO achieves a significant reduction in both parameter count and computational cost while maintaining competitive detection performance, demonstrating that the proposed lightweight improvements effectively reduce model complexity without sacrificing recognition accuracy.From the feature heatmaps, it can be observed that YOLO26n exhibits a relatively broad distribution of high-response regions, with some activations concentrated on leaf textures and background areas. In contrast, KFP-YOLO shows more focused high-response regions, primarily concentrated on lesion and pest-related areas, with reduced responses in non-target regions. This indicates that the improved model enhances attention to key diseases and pests features while suppressing interference from complex background information, resulting in a more concentrated and discriminative feature representation.
4. Discussion
This study addresses several key challenges in Korla fragrant pear diseases and pests detection, including multi-organ target confusion, large variations in lesion scales, and strong background interference in complex orchard environments. To this end, a multi-organ diseases and pests dataset named KFP-PDD was constructed, covering pear leaves, fruits, and flowers, and a lightweight object detection model, KFP-YOLO, was proposed based on an improved YOLO26n framework.Compared with existing lightweight object detection methods, although they generally achieve good real-time performance, they still suffer from limited feature representation, poor sensitivity to small objects, and insufficient robustness against complex backgrounds in agricultural scenarios. To address these issues, this study introduces three key modules—ADown, C3-PD, and CFA to enhance YOLO26n, achieving a better balance between accuracy and efficiency.Specifically, the ADown module reduces computational cost while preserving both global and local information through a multi-branch downsampling structure. The C3-PD module enhances fine-grained lesion feature representation by combining Partial convolution with an attention mechanism. The CFA module strengthens spatial position modeling through a coordinate attention mechanism, improving the model’s ability to focus on key diseases and pests regions in complex backgrounds. The synergy of these modules enables more stable detection performance under challenging conditions such as illumination changes, occlusion, and background interference.Experimental results show that KFP-YOLO achieves a favorable trade-off between detection accuracy and computational efficiency, while significantly reducing parameter size and computational cost and improving inference speed. Compared with mainstream models such as YOLOv5n, YOLOv8n, YOLO11n, YOLO12n, YOLOv13n, and the YOLO26 series, the proposed model demonstrates superior overall performance. In addition, ablation studies further validate the effectiveness and complementary contributions of each module.Furthermore, deployment experiments on the Jetson AGX Orin edge device demonstrate that the proposed model has strong real-time inference capability and practical applicability for orchard inspection scenarios.From the feature visualization results, the improved model shows more concentrated attention on lesion and pest regions while effectively suppressing background responses, further confirming the effectiveness of the proposed feature enhancement strategy.Future work can be carried out in the following directions: (1) Expanding the dataset with more diseases and pests categories and different growth stages to improve generalization ability; (2) Improving performance for long-distance and small-object detection by integrating stronger multi-scale modeling or super-resolution techniques; and (3) Exploring multi-task learning frameworks to jointly perform pest detection and severity assessment for more comprehensive agricultural decision support.
5. Conclusions
This study proposes a lightweight object detection model, KFP-YOLO, based on an improved YOLO26n framework, and constructs a multi-organ Korla fragrant pear diseases and pests dataset KFP-PDD for complex orchard environment detection tasks.By introducing the ADown lightweight downsampling module, the C3-PD feature extraction module, and the CFA feature enhancement module, the proposed model effectively reduces parameter size and computational cost while improving multi-scale feature representation capability. This achieves a good balance among detection accuracy, model complexity, and real-time performance.Experimental results demonstrate that the proposed model achieves superior overall performance compared with several mainstream object detection models. Compared with the baseline YOLO26n model, KFP-YOLO reduces the number of parameters by approximately 23 % and decreases computational cost by about 24%, while improving inference speed to 278.97 FPS, and maintaining comparable detection accuracy. Ablation studies and visualization analyses further validate the effectiveness of each improved module. In addition, edge-device deployment results confirm its feasibility and practical applicability in real orchard inspection scenarios. In summary, KFP-YOLO provides an efficient and lightweight solution for intelligent diseases and pests detection in Korla fragrant pear orchards, with promising potential for real-world agricultural applications.
Author Contributions
Conceptualization, Z.X. and P.L.; methodology, Z.X. and R.H.; software, Z.X.; validation, Z.X. and R.H.; formal analysis, Z.X.; investigation, Z.X., R.H., Y.C., Y.Z., and Z.W.; resources, P.L. and H.D.; data curation, Z.X., R.H., Y.C., Y.Z., and Z.W.; writing—original draft preparation, Z.X. and R.H.; writing—review and editing, P.L. and H.D.; visualization, Z.X.; supervision, H.D. and P.L.; project administration, P.L.; funding acquisition, P.L. All authors have read and agreed to the published version of the manuscript.
Funding
This research was funded by the Backbone Talent Training Program for Agriculture, Rural Areas and Farmers of the Xinjiang Production and Construction Corps, grant number 2025SNGGGCC-BT09.
Institutional Review Board Statement
Not applicable.
Data Availability Statement
The KFP-PDD dataset generated and analyzed during the current study is available from the corresponding author upon reasonable request.
Acknowledgments
The authors sincerely appreciate the experimental facilities and technical support provided by Tarim University. The authors also express their gratitude to the staff and growers of the First Division 12th Regiment, 7th Company Orchard Base and the First Division 9th Regiment Orchard Base for their assistance and support during field data collection and orchard investigations. In addition, the authors thank all teachers, colleagues, and students who contributed to this study through valuable suggestions and technical assistance.
Conflicts of Interest
The authors declare no conflicts of interest. The funders had no role in the design of the study; in the collection, analyses, or interpretation of data; in the writing of the manuscript; or in the decision to publish the results.
References
- Pan, C.; Xiao, Y.; Zheng, H.; Geng, X. Spatiotemporal Evolution and Driving Factors of the Pear Production Land in China. Land 2026, 15, 279. [Google Scholar] [CrossRef]
- Zhang, X.; Yan, M.; Liu, X.; He, D.; Cui, H.; Xin, C.; et al. The Effects of Tree Growth Forms on the Photosynthetic Activity and Fruit Quality of ‘Korla Fragrant’ Pear. Agronomy 2025, 15, 2348. [Google Scholar] [CrossRef]
- Yuan, Y.; He, Z.; Wang, L.; Liu, X.; Liu, Z.; Li, Y.; Liu, H.; Zhang, W. Systematic Characterization of Cacopsylla chinensis as a Potential Vector of Erwinia amylovora on Korla Fragrant Pear in Xinjiang, China. Insects 2026, 17, 487. [Google Scholar] [CrossRef] [PubMed]
- Liu, C.; Wang, T.; Zhang, Y.; Jiang, H.; Luo, X. Biocontrol Effect and Antibacterial Mechanism of Bacillus velezensis TRMB57782 Against Alternaria gaisen Blotch in Korla Pears. Biology 2025, 14, 793. [Google Scholar] [CrossRef] [PubMed]
- Wang, X.; Liu, Q.; Wang, J.; Wang, L.; Tu, H.; Zhang, J. Identification and Occurrence of the Dominant Parasitic Wasp Therophilus festivus of Larval Grapholita molesta. Agronomy 2024, 14, 2307. [Google Scholar] [CrossRef]
- Furmanczyk, E.M.; Parveaud, C.-E.; Jacquot, M.; Warlop, F.; et al. An Overview of Pest and Disease Occurrence in Organic Pome Fruit Orchards in Europe and on the Implementation of Practices for Their Control. Agriculture 2022, 12, 2136. [Google Scholar] [CrossRef]
- Popescu, D.; Ichim, L.; Stoican, F. Orchard Monitoring Based on Unmanned Aerial Vehicles and Image Processing by Artificial Neural Networks: A Systematic Review. Front. Plant Sci. 2023, 14, 1237695. [Google Scholar] [CrossRef] [PubMed]
- Savary, S.; Willocquet, L.; Pethybridge, S.J.; et al. The global burden of pathogens and pests on major food crops. Nat. Ecol. Evol. 2019, 3, 430–439. [Google Scholar] [CrossRef] [PubMed]
- Ren, S.; He, K.; Girshick, R.; Sun, J. Faster R-CNN: Towards Real-Time Object Detection with Region Proposal Networks. In Proceedings of the IEEE Conference on Computer Vision and Pattern Recognition (CVPR), Boston, USA, 2015; pp. 1–10. [Google Scholar]
- Liu, W.; Anguelov, D.; Erhan, D.; et al. SSD: Single Shot MultiBox Detector. European Conference on Computer Vision (ECCV), Amsterdam, Netherlands, 2016; pp. 21–37. [Google Scholar]
- Vaswani, A.; et al. Attention Is All You Need. In Advances in Neural Information Processing Systems (NeurIPS); 2017; pp. 5998–6008. [Google Scholar]
- Kotthapalli, M.; Ravipati, D.; Bhatia, R. YOLOv1 to YOLOv11: A Comprehensive Survey of Real-Time Object Detection Innovations and Challenges. arXiv 2025, arXiv:2508.02067. [Google Scholar] [CrossRef]
- Mohanty, S.P.; Hughes, D.P.; Salathé, M. Using Deep Learning for Image-Based Plant Disease Detection. Front. Plant Sci. 2016, 7, 1419. [Google Scholar] [CrossRef] [PubMed]
- Ferentinos, K.P. Deep learning models for plant disease detection and diagnosis. Comput. Electron. Agric. 2018, 145, 311–318. [Google Scholar] [CrossRef]
- Goyal, P.; et al. Deep learning-based citrus plant disease classification using a computationally efficient CNN model. Sci. Rep. 2026, 16, 19316. [Google Scholar] [CrossRef]
- Liu, Z.; Li, X. An improved YOLOv5-based apple leaf disease detection method. Sci. Rep. 2024, 14, 17508. [Google Scholar] [CrossRef]
- Wang, C.; et al. Identification of Grape Diseases Based on Improved YOLOXS. Appl. Sci. 2023, 13, 5978. [Google Scholar] [CrossRef]
- Liu, D.; et al. Research on Apple Surface Disease Detection Method Based on Improved YOLOv11s. Foods 2026, 15, 1581. [Google Scholar] [CrossRef] [PubMed]
- Yang, F.; et al. Influencing factors analysis in pear disease recognition using deep learning. Peer-To-Peer Netw. Appl. 2021, 14, 1816–1828. [Google Scholar] [CrossRef]
- Gu, Y.H.; et al. Improved Multi-Plant Disease Recognition Method Using Deep CNNs. Agriculture 2022, 12, 300. [Google Scholar] [CrossRef]
- Hai, T.; et al. Implementation and Evaluation of Attention Aggregation Technique for Pear Disease Detection. Agriculture 2024, 14, 1146. [Google Scholar] [CrossRef]
- Cao, B.Y.; Zhou, P. Study on pest and disease recognition of Korla Fragrant Pear based on CNN. South Agric. Mach. 2025, 56, 38. [Google Scholar] [CrossRef]
- Chen, X.Q. Research and System Implementation of Pear Leaf Disease Grading Based on Deep Learning. Master’s Thesis, Shandong Agricultural University, Jinan, China, 2024. [Google Scholar]
- Zheng, X.K.; Li, Z.Z.; Qin, J.H. Semi-supervised learning-based pear leaf disease detection. Jiangsu Agric. Sci. 2024, 52, 192–201. [Google Scholar] [CrossRef]
- Wang, C.J. Research and Application of Pear Tree Disease and Pest Recognition Algorithm Based on CNN. Master’s Thesis, East China Normal University, Shanghai, China, 2023. [Google Scholar]
- Ames, G.K.; Born, H. Pear diseases and disorders. Available online: https://ucanr.edu (accessed on 25 June 2026).
- Wang, X.; Zhang, S.; Zhang, T. Crop insect pest detection based on dilated multi-scale attention U-Net. Plant Methods 2024, 20, 34. [Google Scholar] [CrossRef] [PubMed]
- Zhang, H.; et al. Select-Mosaic: Data Augmentation Method for Dense Small Object Scenes. arXiv 2024, arXiv:2406.05412. [Google Scholar] [CrossRef]
- Zhang, Z.; et al. A unified frequency understanding of image corruptions and its application to autonomous driving. SAE Tech. Pap. 2023. [Google Scholar] [CrossRef]
- Zhang, J.; Feng, Z.; Jiang, J.; Gui, Y. Fourier-based two-stage low-light image enhancement network via mutual learning. Digit. Signal Process. 2025, 160, 105044. [Google Scholar] [CrossRef]
- Chakrabarty, S. YOLO26: An Analysis of NMS-Free End-to-End Framework for Real-Time Object Detection. arXiv 2026, arXiv:2601.12882. [Google Scholar] [CrossRef]
- Wang, C.Y.; Yeh, I.H.; Liao, H.Y.M. YOLOv9: Learning What You Want to Learn Using Programmable Gradient Information. arXiv 2024, arXiv:2402.13616. [Google Scholar] [CrossRef]
- Park, S.; et al. PConv: Simple yet Effective Convolutional Layer for Generative Adversarial Networks. 2024. [Google Scholar] [CrossRef] [PubMed]
- Hu, J.; Shen, L.; Sun, G. Squeeze-and-Excitation Networks; CVPR, 2018; pp. 7132–7141. [Google Scholar] [CrossRef]
- Hou, Q.; Zhou, D.; Feng, J. Coordinate Attention for Efficient Mobile Network Design; CVPR, 2021; pp. 13713–13722. [Google Scholar] [CrossRef]
Figure 1.
Top-view images of six pear orchards in the dataset: (a) Orchard 1; (b) Orchard 2; (c) Orchard 3; (d) Orchard 4; (e) Orchard 5; and (f) Orchard 6.
Figure 1.
Top-view images of six pear orchards in the dataset: (a) Orchard 1; (b) Orchard 2; (c) Orchard 3; (d) Orchard 4; (e) Orchard 5; and (f) Orchard 6.
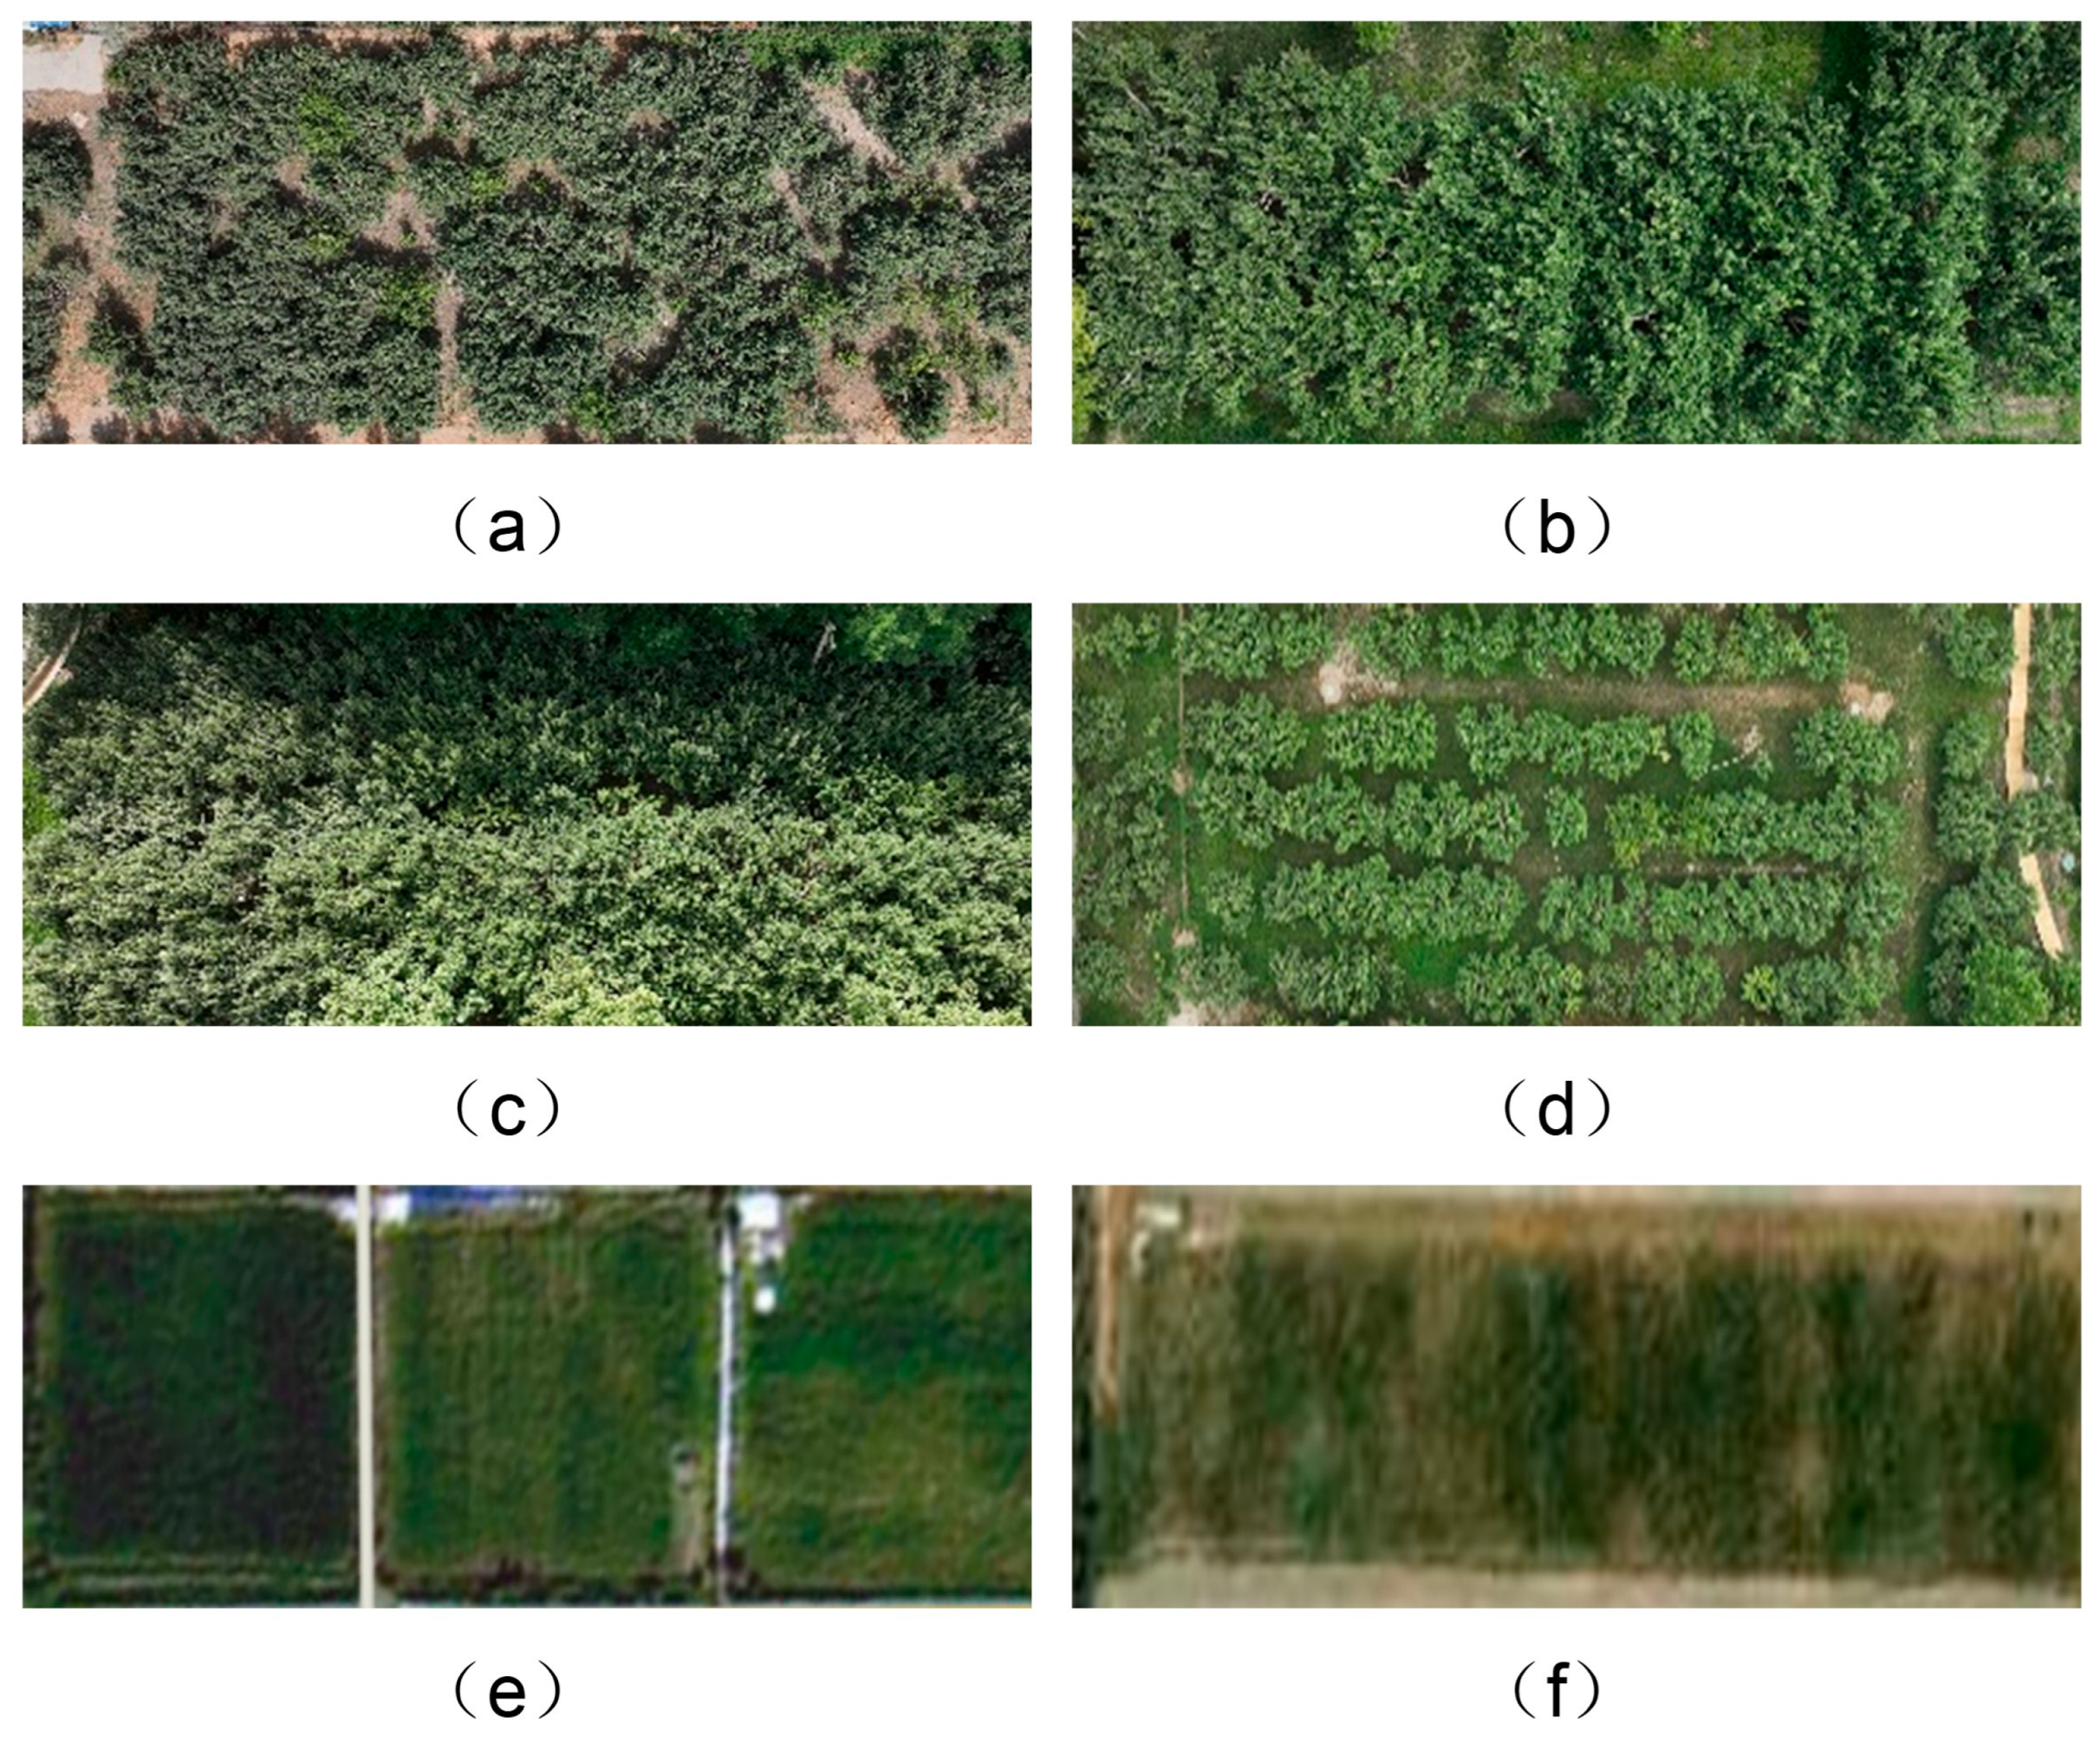
Figure 2.
Representative sample images of pear leaf, flower, and fruit categories in the dataset: (a) Pear Leaf Healthy; (b) Pear Leaf Chlorosis Disease; (c) Pear Leaf Spot Disease; (d) Pear Leaf Fire Blight; (e) Pear Leaf Insect Damage; (f) Pear Leaf Infestation by Pear Gall Midge; (g) Pear Flower Healthy; (h) Pear Flower Fire Blight; (i) Pear Fruit Healthy; (j) Pear Fruit Grapholita molesta Infestation; and (k) Pear Fruit Fire Blight.
Figure 2.
Representative sample images of pear leaf, flower, and fruit categories in the dataset: (a) Pear Leaf Healthy; (b) Pear Leaf Chlorosis Disease; (c) Pear Leaf Spot Disease; (d) Pear Leaf Fire Blight; (e) Pear Leaf Insect Damage; (f) Pear Leaf Infestation by Pear Gall Midge; (g) Pear Flower Healthy; (h) Pear Flower Fire Blight; (i) Pear Fruit Healthy; (j) Pear Fruit Grapholita molesta Infestation; and (k) Pear Fruit Fire Blight.
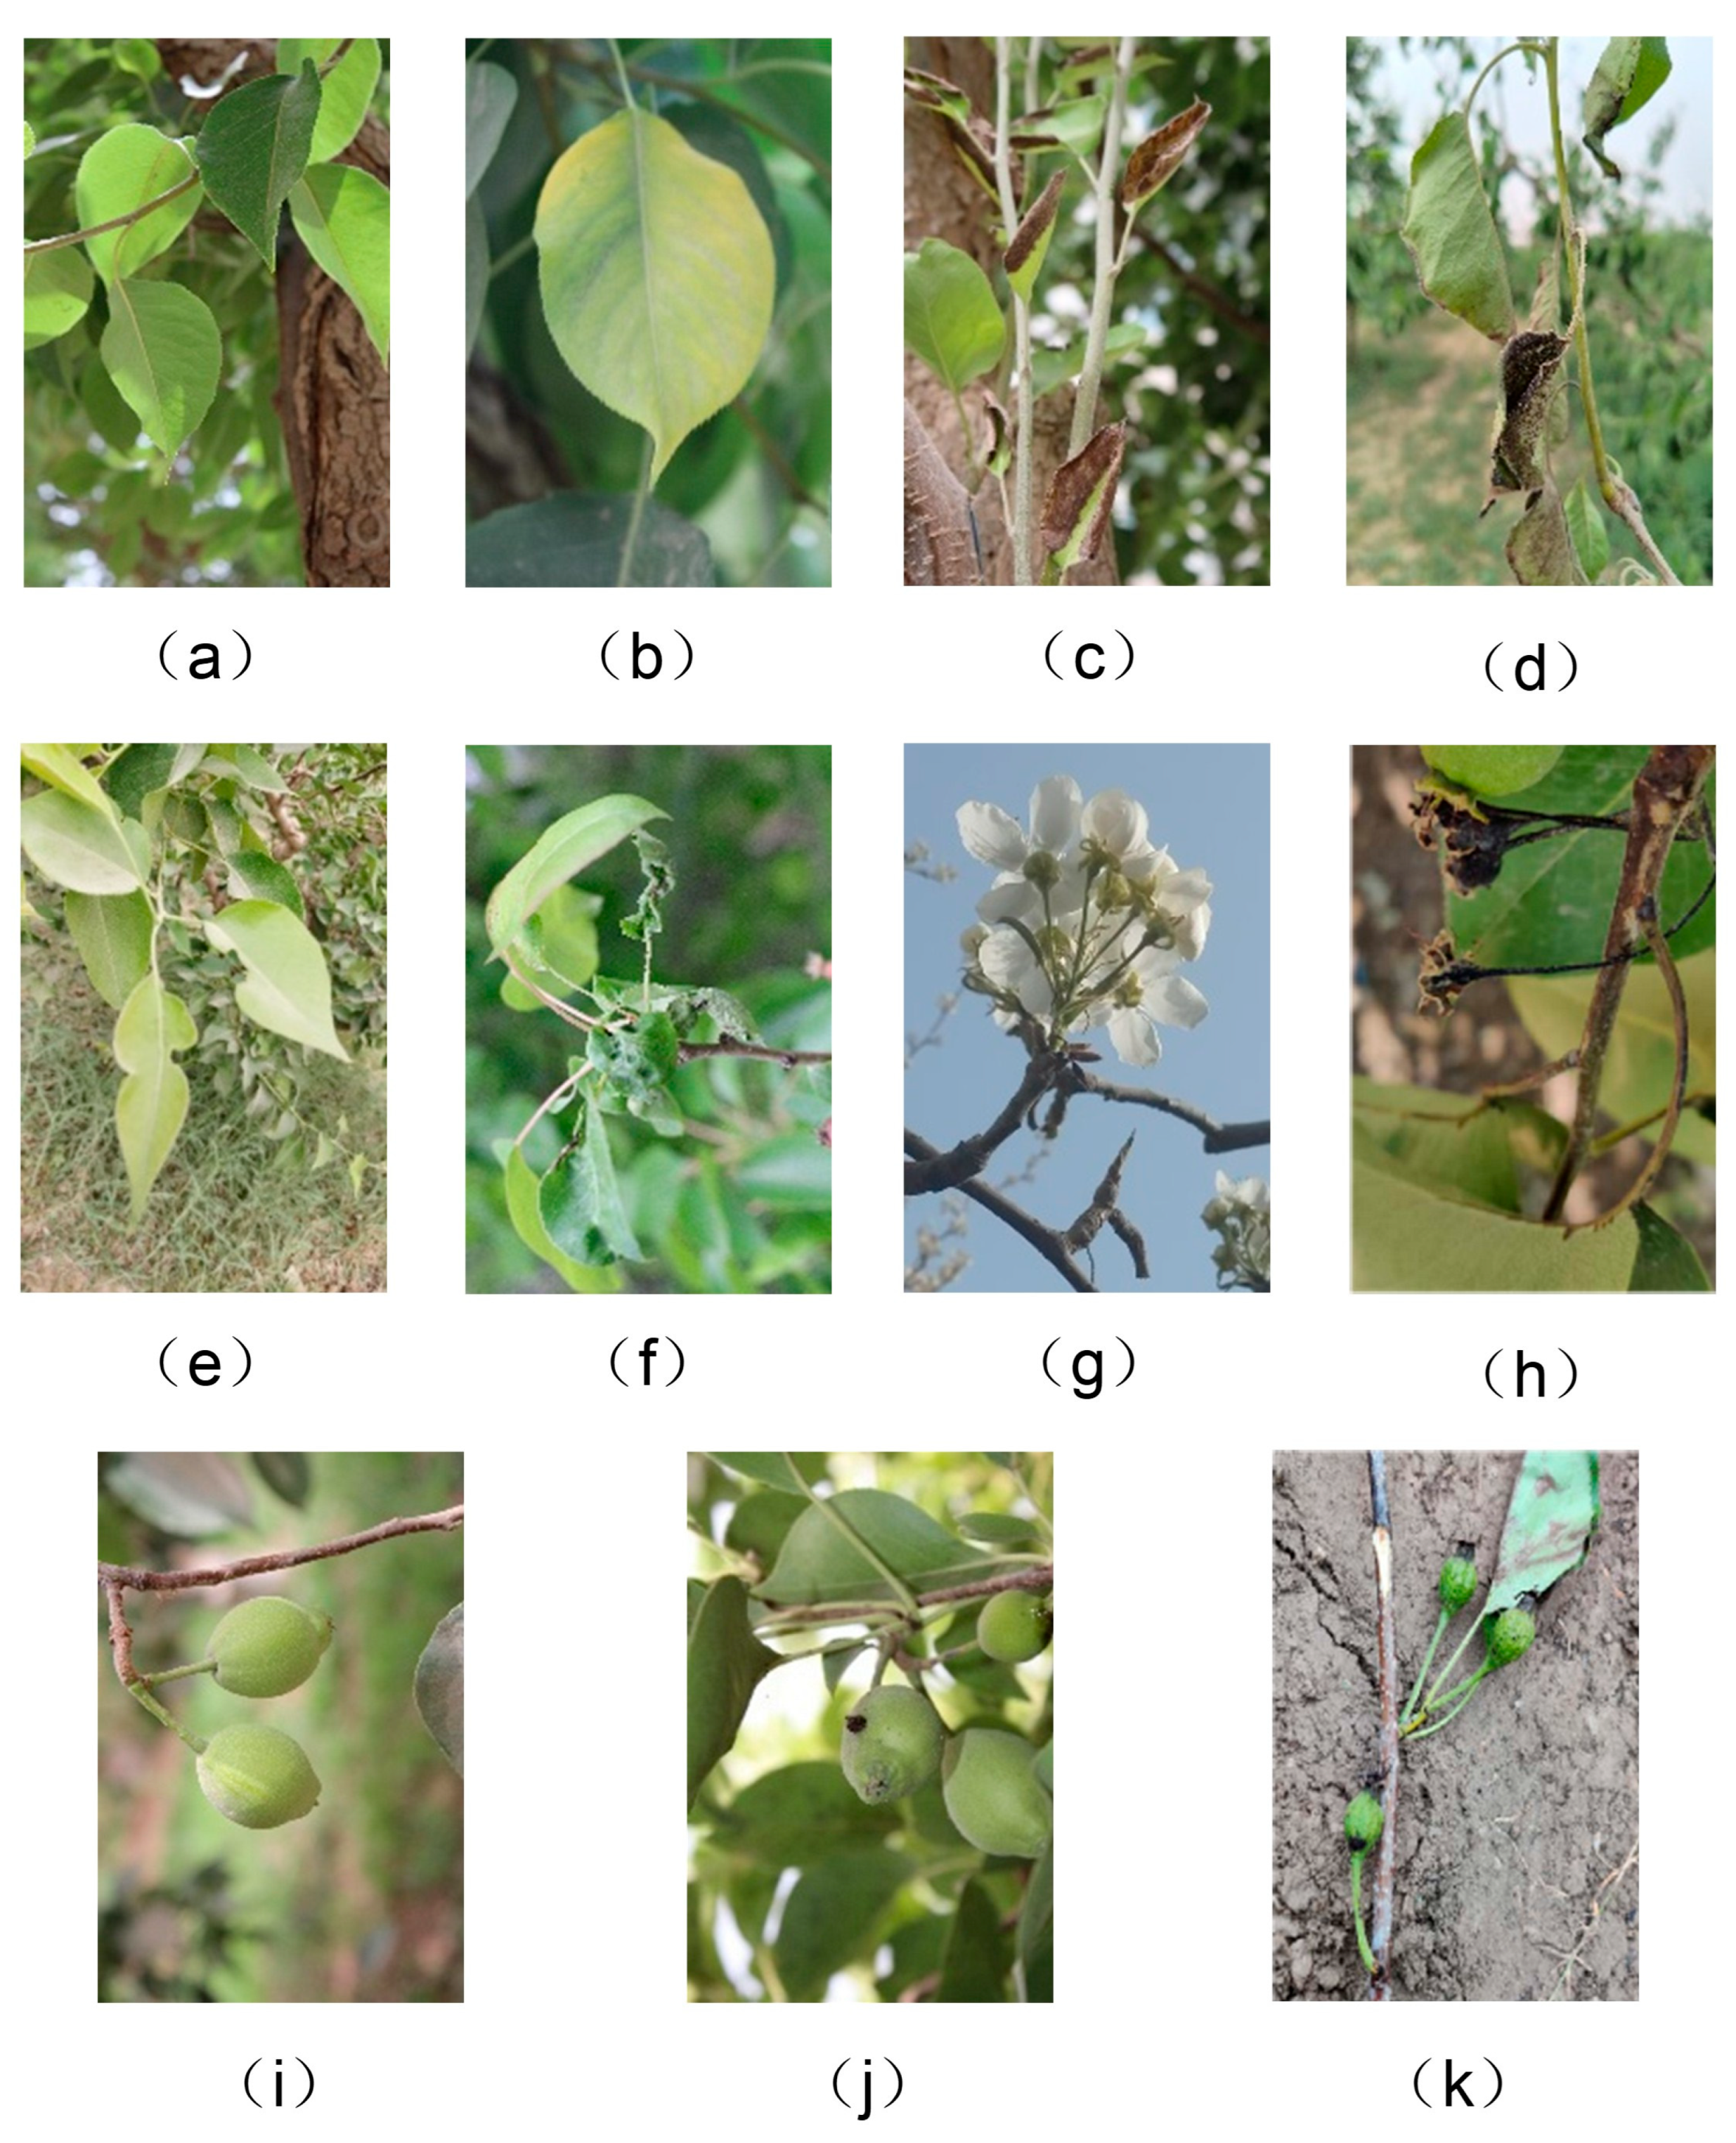
Figure 3.
KFP-YOLO model architecture.
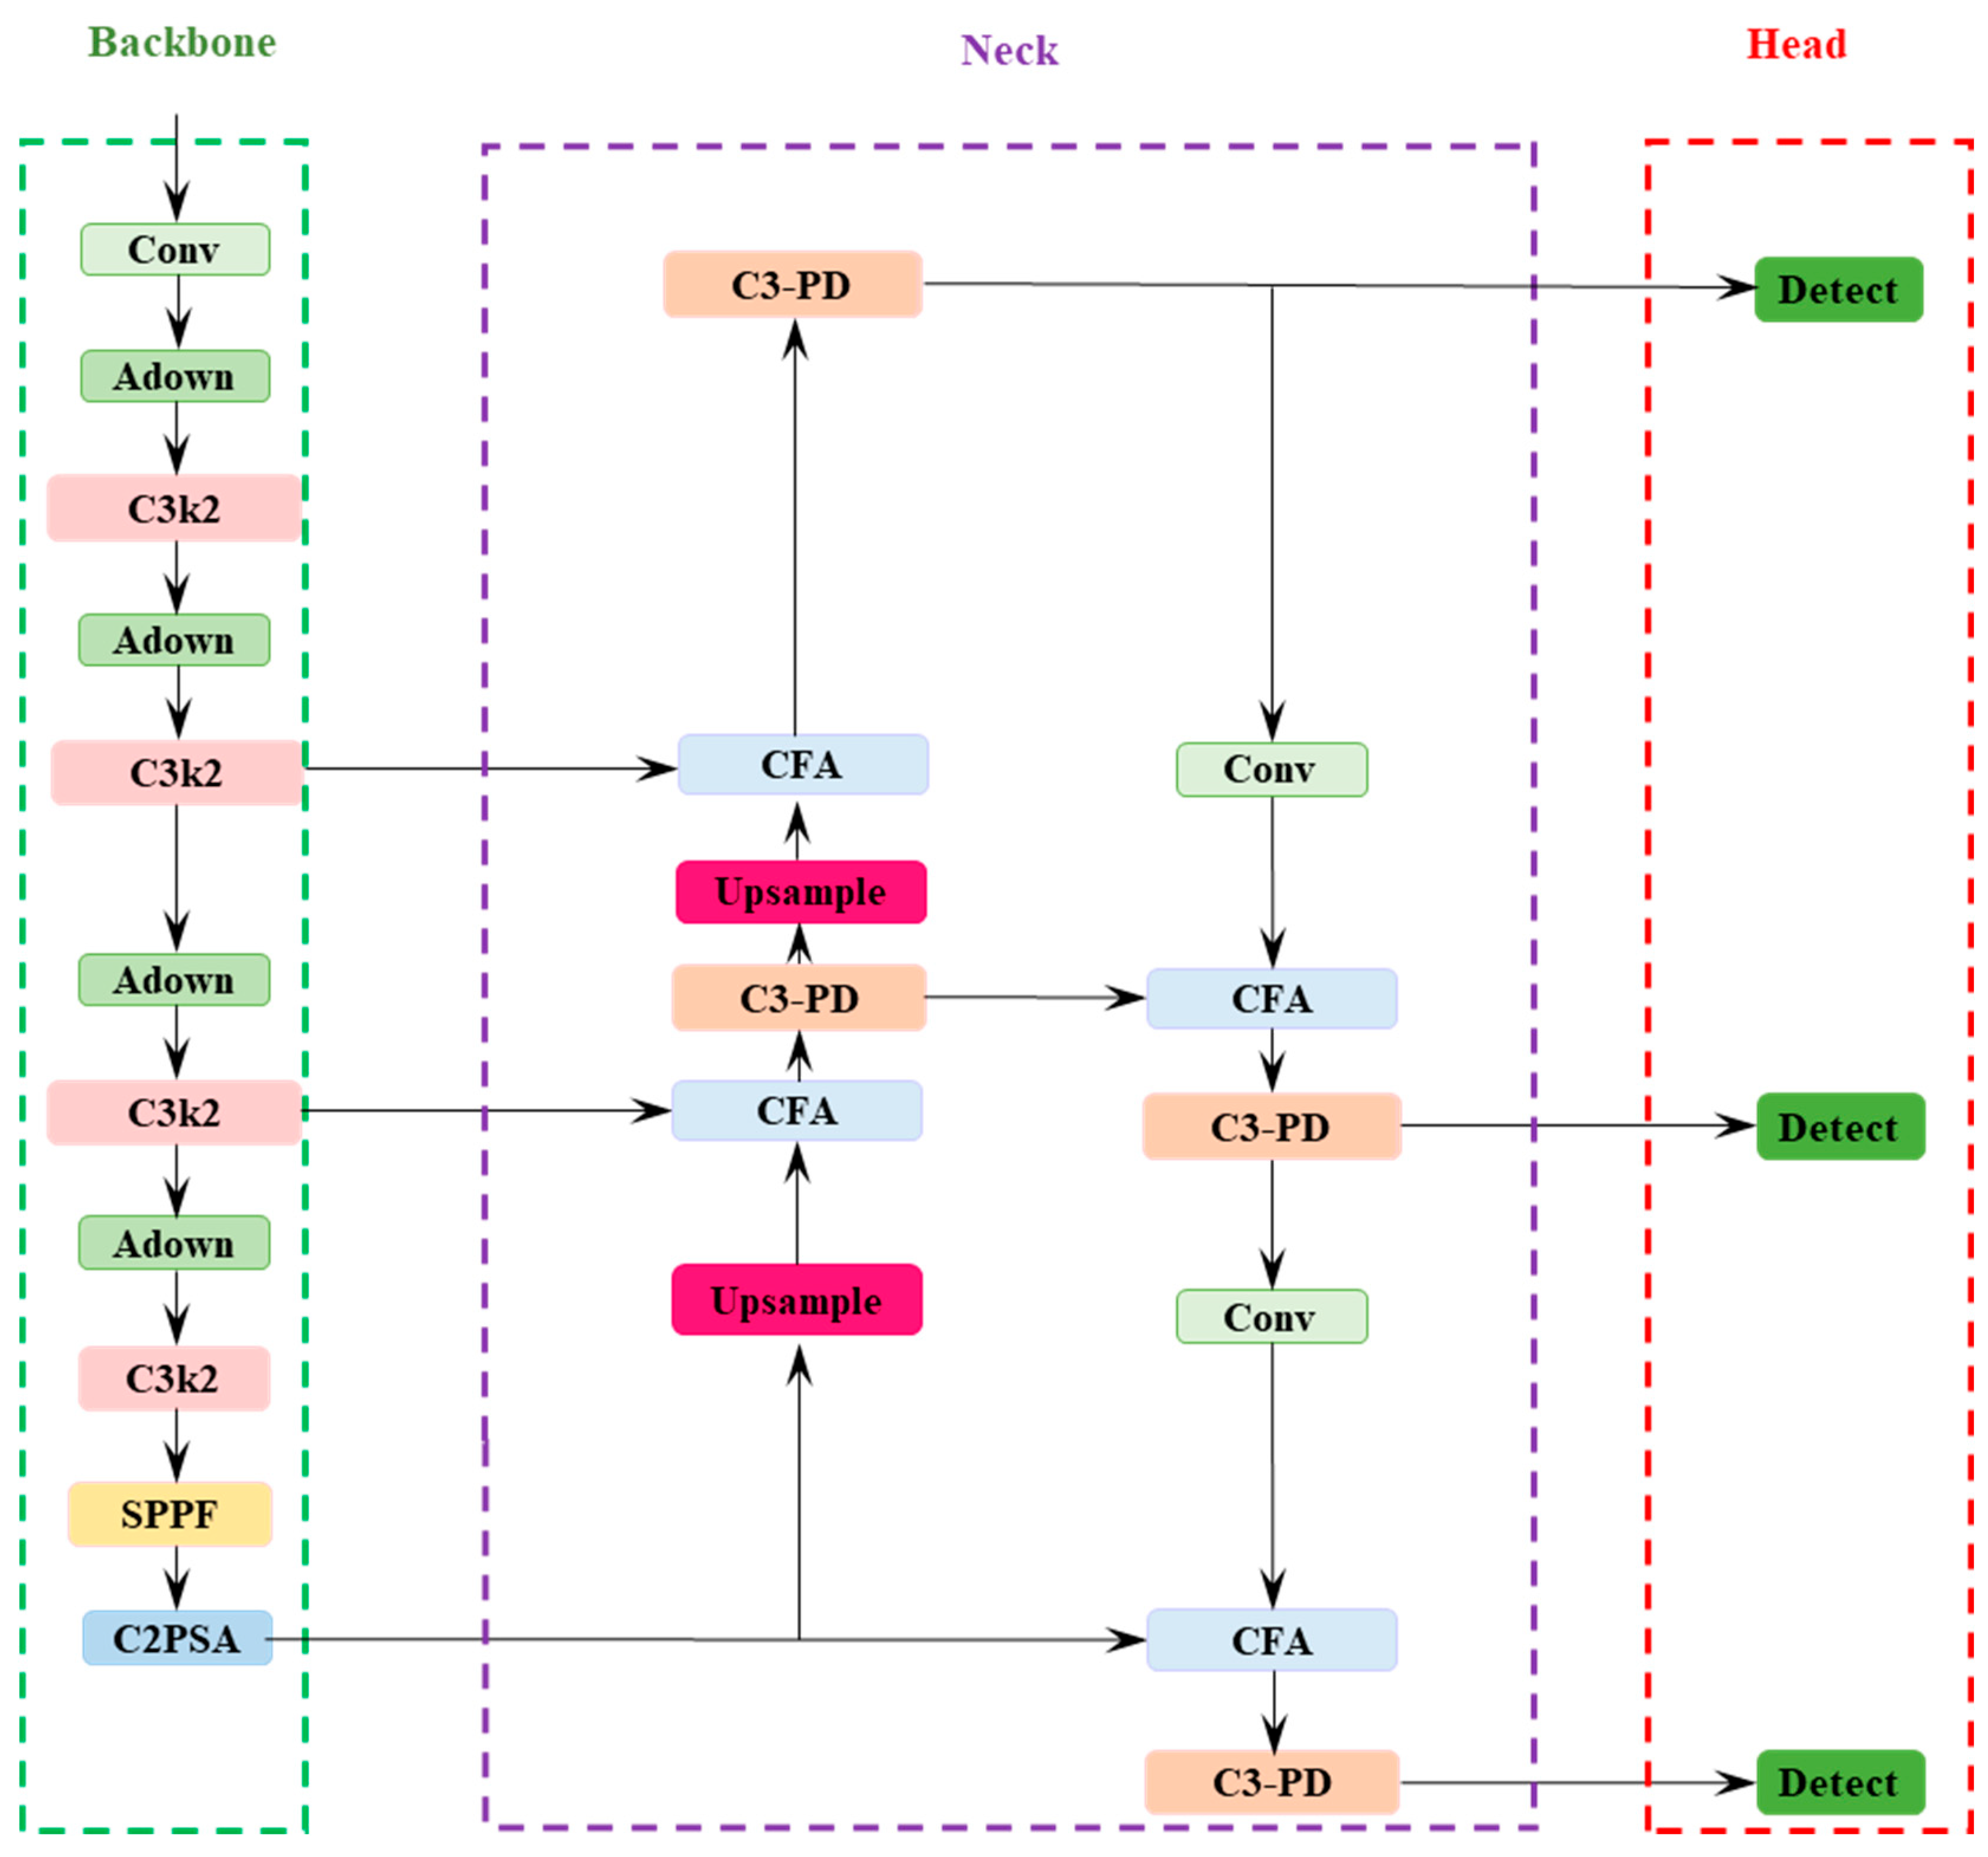
Figure 4.
Structure of the ADown lightweight downsampling module.

Figure 5.
Structure of the C3-PD feature extraction module.

Figure 6.
Structure of the CFA feature fusion module.
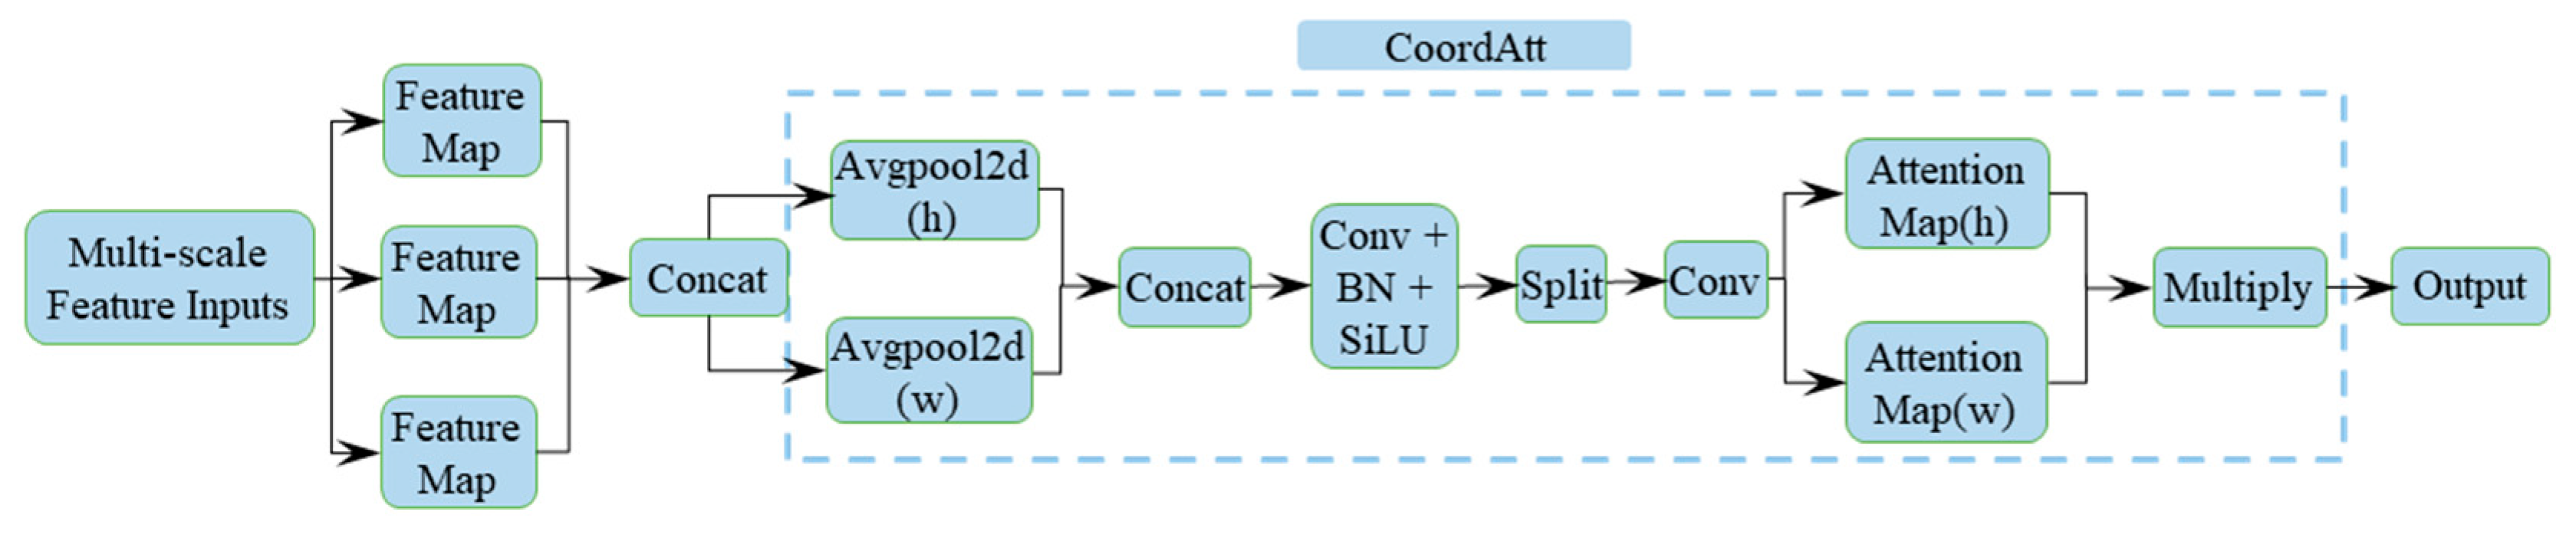
Figure 7.
Comparison of model detection results and feature heatmaps. (a) Detection results of YOLO26n; (b) Detection results of KFP-YOLO; (c) Feature heatmap of YOLO26n; (d) Feature heatmap of KFP-YOLO.
Figure 7.
Comparison of model detection results and feature heatmaps. (a) Detection results of YOLO26n; (b) Detection results of KFP-YOLO; (c) Feature heatmap of YOLO26n; (d) Feature heatmap of KFP-YOLO.
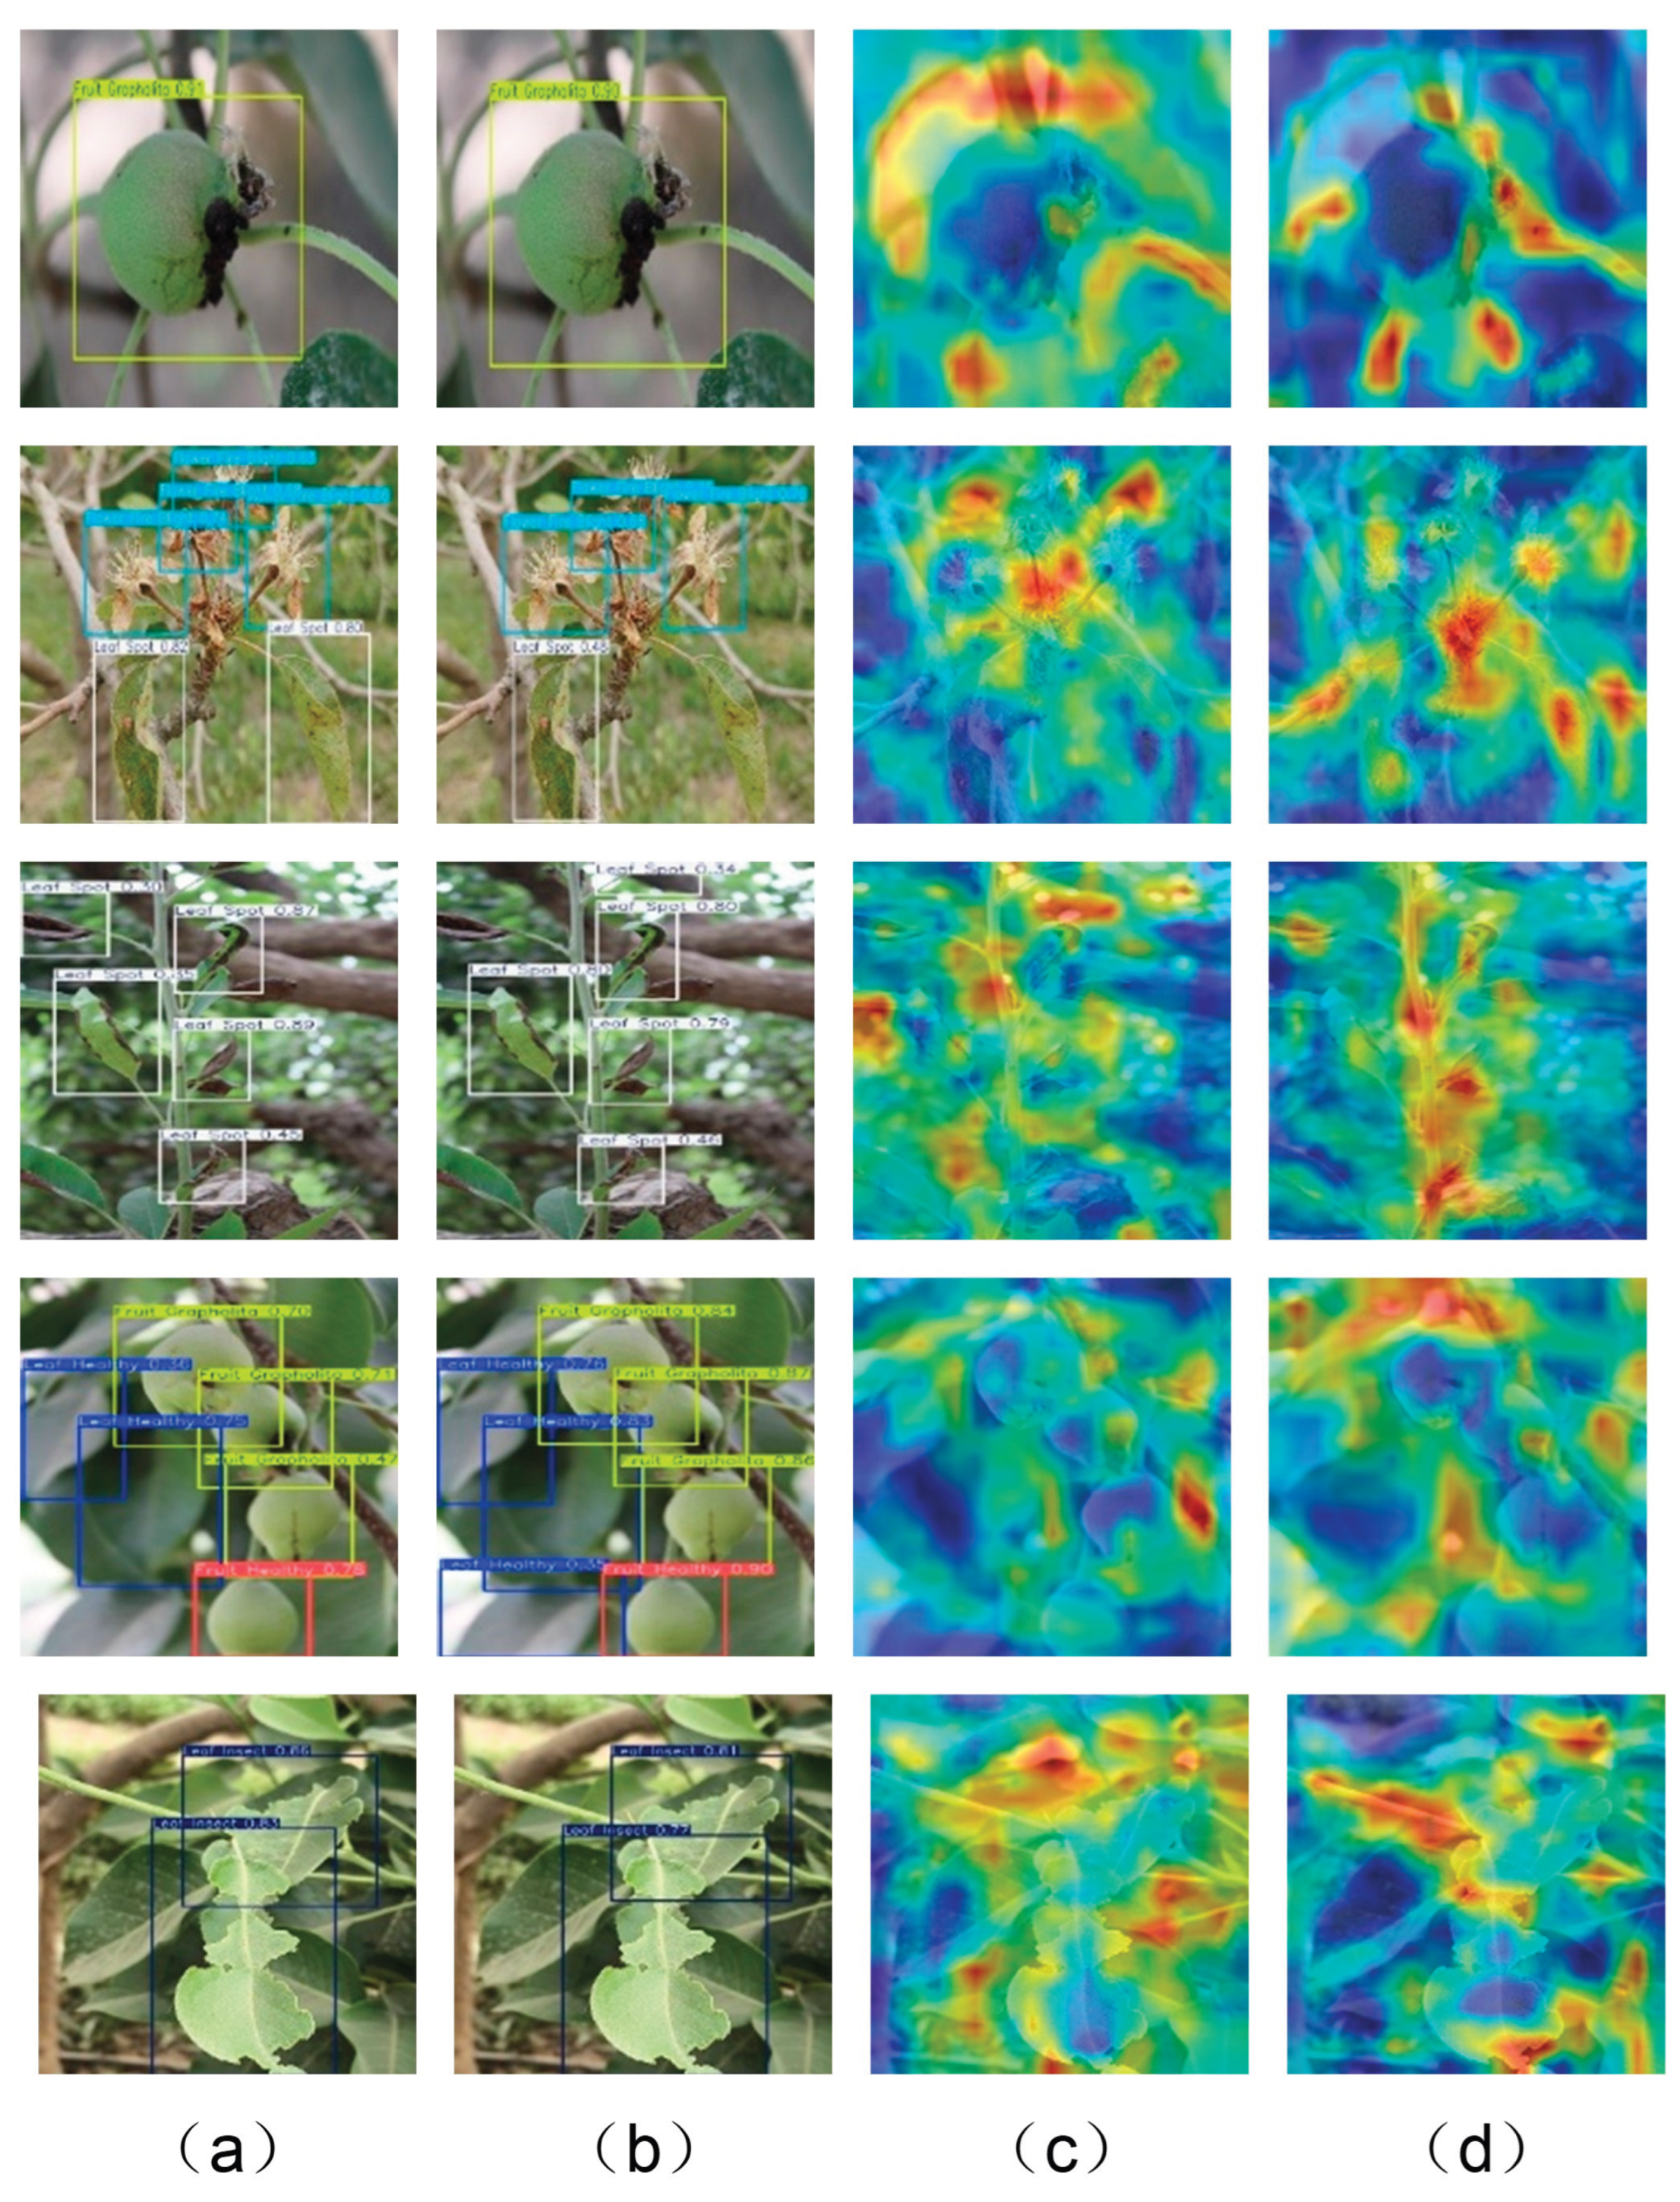

Table 1.
Orchard information of the experimental sites.
| Orchard No. | Location | Coordinates | Altitude (m) | Plot Size (m) | Row Spacing (m) | Plant Spacing (m) | Average Tree Height (m) |
| Orchard 1 | Tarim University Experimental Field 1 | 40°32′24.98″N, 81°17′55.00″E | 951.08 | 93 37 |
4.7 | 4.0 | 4.5 |
| Orchard 2 | Tarim University Experimental Field 2 | 40°32′29.57″N, 81°17′32.27″E | 952.24 | 25 15 |
4.6 | 1.7 | 4.0 |
| Orchard 3 | Tarim University Experimental Field 3 | 40°32′31.11″N, 81°17′30.46″E | 951.98 | 55 22 |
3.7 | 1.8 | 3.7 |
| Orchard 4 | Tarim University Experimental Field 4 | 40°32′42.60″N, 81°17′17.01″E | 950.91 | 202 33 |
5.4 | 2.6 | 3.6 |
| Orchard 5 | First Division 12th Regiment, 7th Company Orchard Base | 40°28′57.15″N, 81°19′04.23″E | 1042.35 | 630 190 |
4.5 | 4.0 | 4.0 |
| Orchard 6 | First Division 9th Regiment Orchard Base | 40°40′12.55″N, 81°00′51.00″E | 995.70 | 780 130 |
4.3 | 3.8 | 4.3 |
Table 2.
Dataset details.
| Category label | original images | original annotations | Annotation proportion (%) | augmented images | augmented annotations | Annotation proportion (%) |
| Pear Leaf Healthy | 2829 | 4384 | 19.28 | 6574 | 16916 | 20.91 |
| Pear Leaf Chlorosis Disease | 1433 | 2180 | 9.59 | 4551 | 8130 | 10.05 |
| Pear Leaf Spot Disease | 6281 | 9247 | 40.67 | 7742 | 17881 | 22.10 |
| Pear Leaf Fire Blight | 525 | 579 | 2.55 | 3581 | 5443 | 6.73 |
| Pear Leaf Insect Damage | 740 | 803 | 3.53 | 3377 | 5145 | 6.36 |
| Pear Leaf Infestation by Pear Gall Midge | 446 | 552 | 2.43 | 1944 | 2632 | 3.25 |
| Pear Fruit Healthy | 1406 | 1711 | 7.53 | 4958 | 7835 | 9.68 |
| Pear Fruit Grapholita molesta Infestation | 1448 | 1547 | 6.80 | 4531 | 6365 | 7.87 |
| Pear Fruit Fire Blight | 542 | 565 | 2.49 | 2283 | 2755 | 3.41 |
| Pear Flower Healthy | 190 | 590 | 2.60 | 1014 | 3497 | 4.32 |
| Pear Flower Fire Blight | 416 | 577 | 2.54 | 1727 | 4301 | 5.32 |
| 14092 | 22735 | 100.00 | 25794 | 80900 | 100.00 |
Table 3.
Configuration of model training and deployment environments.
| Item | Training environment (PC) | Deployment environment (Jetson AGX Orin) |
| Operating system | Windows 11 | Ubuntu 22.04 |
| CPU | Intel i9-13900KF | 12-core Arm Cortex-A78AE |
| GPU | NVIDIA RTX 4080 | Ampere GPU(2048 CUDA cores) |
| Memory | 32 GB | 64 GB LPDDR5 |
| Python | 3.12 | 3.10 |
| PyTorch | PyTorch 2.5.1 | PyTorch 2.1 |
| CUDA | 12.1 | 12.2 |
| TensorRT | - | 10.0.1 |
Table 4.
Performance comparison of different object detection models.
| Model | Size (MB) | Params (M) | GFLOPs | FPS | mAP@0.5 |
mAP@0.5 -0.95 |
Precision | Recall |
| YOLOv5n | 5.04 | 2.51 | 7.19 | 321.85 | 0.9277 | 0.6968 | 0.9080 | 0.8560 |
| YOLOv8n | 5.98 | 3.01 | 8.20 | 311.78 | 0.9333 | 0.7526 | 0.9262 | 0.8863 |
| YOLO11n | 5.23 | 2.59 | 6.45 | 266.95 | 0.9456 | 0.7557 | 0.9287 | 0.8993 |
| YOLO12n | 5.28 | 2.57 | 6.49 | 143.02 | 0.9515 | 0.7879 | 0.9361 | 0.9041 |
| YOLOv13n | 5.17 | 2.46 | 6.30 | 109.32 | 0.9521 | 0.8093 | 0.9392 | 0.9087 |
| YOLOv13s | 18.76 | 9.55 | 22.30 | 73.08 | 0.9628 | 0.8748 | 0.9521 | 0.9250 |
| YOLO26n | 5.16 | 2.51 | 5.79 | 259.79 | 0.9509 | 0.7731 | 0.9387 | 0.9073 |
| YOLO26s | 19.40 | 9.96 | 22.54 | 167.67 | 0.9649 | 0.8369 | 0.9507 | 0.9260 |
Table 5.
Ablation experiment results.
| Model | Size (MB) | Params (M) | GFLOPs | FPS | mAP@0.5 | mAP@0.5:0.95 | Precision | Recall |
| YOLO26n | 5.16 | 2.51 | 5.79 | 259.79 | 0.9509 | 0.7731 | 0.9387 | 0.9073 |
| +ADown | 4.68 | 2.27 | 5.09 | 272.43 | 0.9498 | 0.7668 | 0.9365 | 0.9061 |
| +C3-PD | 4.37 | 2.13 | 5.12 | 304.86 | 0.9443 | 0.7576 | 0.9317 | 0.9018 |
| +CFA | 4.56 | 2.37 | 5.35 | 267.94 | 0.9556 | 0.7812 | 0.9428 | 0.9104 |
| +ADown +C3-PD | 3.92 | 1.89 | 4.41 | 291.62 | 0.9427 | 0.7548 | 0.9296 | 0.9025 |
| +ADown +CFA | 4.61 | 2.22 | 5.03 | 270.73 | 0.9561 | 0.7835 | 0.9446 | 0.9112 |
| +C3-PD +CFA | 4.47 | 2.17 | 5.13 | 286.41 | 0.9485 | 0.7694 | 0.9362 | 0.9053 |
| KFP-YOLO | 4.05 | 1.93 | 4.42 | 278.97 | 0.9465 | 0.7592 | 0.9378 | 0.9063 |
Disclaimer/Publisher’s Note: The statements, opinions and data contained in all publications are solely those of the individual author(s) and contributor(s) and not of MDPI and/or the editor(s). MDPI and/or the editor(s) disclaim responsibility for any injury to people or property resulting from any ideas, methods, instructions or products referred to in the content. |
© 2026 by the authors. Licensee MDPI, Basel, Switzerland. This article is an open access article distributed under the terms and conditions of the Creative Commons Attribution (CC BY) license (http://creativecommons.org/licenses/by/4.0/).
Copyright: This open access article is published under a Creative Commons CC BY 4.0 license, which permit the free download, distribution, and reuse, provided that the author and preprint are cited in any reuse.