

Submitted:
18 June 2026
Posted:
07 July 2026
You are already at the latest version
Abstract
A prior trilogy established that individual outcomes are dominated by the dispersion of the environment rather than of capability, formally Var(ln ρeff) ≫ Var(ln k) at a global dominance ratio $R\in[27,134]$ [1,2], but not where that dispersion comes from. We supply the mechanism: hierarchy as an amplifier, a multiplicative cascade that turns tiny, often capability-irrelevant initial differences into the large positional dispersion the trilogy measured, so that \(R\) becomes an output of structure rather than a fact about people. We microfound the feedback $f(S)$ in Gould's deference model [4] (linear at the bottom, saturating at the top) and identify the Kesten reset [10] that creates the heavy tail with Boehm's reverse-dominance insurance [7], pinning the tail index in closed form, \(\alpha=1+[\delta+\sqrt{\delta^2+2\sigma^2 p}]/\sigma^2\), confirmed by a Clauset MLE [18]. The calibrated amplifier reproduces \(R\) at all four aggregation levels and requires a near-random-walk between-environment process. On the raw ICIJ Offshore Leaks officer network [24] the predicted heavy tail holds (global \(\alpha\approx2.25\)), but no concentration metric tracks recording opacity across jurisdictions: that negative result vindicates the demarcation paper [3], since the quantity that would test the lever is hidden by construction. We then turn to a domain where position is logged, GitHub pull requests. On 113895 closed pull requests, position multiplies the merge odds 3--7\(\times\) at fixed diff size; a within-author design bounds the position premium at 12.6pp (\(p=2\times10^{-18}\)); and the cleanest design, a promotion holding author and project fixed, still finds acceptance rising +4.1pp in the same repository at unchanged proposal size (\(p=2\times10^{-7}\)), though even it cannot fully separate the badge from the competence that travels with it. The amplifier's gains are continuous and visible while its costs are rare, delayed and hidden, so hierarchy always appears beneficial and its net cost cannot be honestly settled.
Keywords:
hierarchy
; status
; positional power
; multiplicative cascade
; preferential attachment
; power laws
; reproducibility
1. Introduction: The Gap the Trilogy Leaves
A trilogy [1,2,3] argued that individual success is governed less by an entity’s capacity to explore possibilities, k, than by the density of favourable possibilities the environment makes accessible, via . Its central inequality is ; the second paper measured a global dominance ratio , and the third showed the strong (causal) reading is structurally unmeasurable because the principal is, by construction, hidden (“the powerful hide”).
The trilogy thus postulates the inequality and measures it, but never explains why the environmental dispersion is so large when entities start out similar. This paper answers that question with a generative mechanism: hierarchy as an amplifier of position. We assume entities are nearly equal (small ), consistent with Sah–Stiglitz’s equal-evaluator assumption and with Gould’s finding that status ranks form even among near-equals [4,5], and ask where the large outcome dispersion comes from. The answer is structural: not nature, but a self-reinforcing cascade.
- Relation to the random-growth literature.
That outcomes determined by multiplicative growth become log-normal or, with a reset, power-law, is a classical result: Champernowne’s random-growth model of income [19], Simon’s skew distributions and the Yule process [20], Kesten’s products of random matrices [10], and the modern syntheses of power laws in economics [21], wealth distribution with random returns [22], and the dynamics of inequality [23]. We borrow that engine but make three contributions it does not contain. First, the literature grows wealth, firm size or city size, quantities whose relation to merit it leaves open; we grow positional status and use the cascade precisely to argue that the grown quantity becomes decoupled from capability (), which is the trilogy’s unmeasurability generated rather than assumed. Second, we do not posit Gibrat-proportional growth: we microfound the multiplicative feedback in Gould’s social model of deference (Section 4). Third, we give the reset a substantive social identity, namely Boehm’s reverse-dominance insurance with a Kuran/Granovetter threshold and an opacity-suppressed hazard (Section 6), rather than a generic death process, which is what ties the mechanism back to the trilogy’s “the powerful hide.”
- Relation to the status and cumulative-advantage literature.
That position is rewarded over competence, and that small advantages compound, is among the most established themes in the social sciences, and we claim neither as new. Cumulative advantage and the Matthew effect describe the self-reinforcement of early leads [12,13]; social psychology documents that status tracks perceived rather than actual value and is self-reinforcing [14]; recent work models skill, status and the Matthew effect jointly [15]; the Peter Principle and its empirical confirmation show promotion decoupled from on-the-job competence [16]; and that insiders’ contributions are accepted more is already documented on GitHub [17]. Our contribution is not that qualitative claim but five specific moves. First, we make the amplifier the generative source of the trilogy’s measured , turning R from a measurement into an output. Second, we microfound the feedback in Gould’s deference model rather than positing proportional growth, and third give the reset a social identity (Boehm/Kuran/Granovetter) tied to opacity. Fourth, we anchor the depth d and the per-step independently, from GDP divergence and income mobility, so R is predicted, not fitted. Fifth, we identify the position effect with a within-author, competence-fixed design (the same person an insider in some repositories and an outsider in others), where prior GitHub work reports only cross-sectional association. The synthesis and these identifications, not the theme, are the contribution.
2. The Amplifier Model
Let denote the position (status) of entity i; is a monotone function of S. The amplifier dynamics is
with gain g and feedback shape f. Capability enters once, at the input: the initial log-status carries the small capability term k (so ), while the per-step noise is the environmental amplification the hierarchy adds at each level. We keep these distinct deliberately: k is a fixed endowment, not a shock reinjected every step, so it does not accumulate with depth; only the amplification increments do. Writing , a multiplicative cascade becomes additive, , so by the central limit theorem is asymptotically normal and S log-normal. Because the endowment and the increments are independent, their variances add:
where d is the effective depth and the per-step amplification variance. Hence the dominance ratio is an output:
follows from depth and gain, not from people; a flatter structure yields smaller R, which is why R varies across the aggregation levels of [2] (Section 7). The capability input is small and, crucially, the same at every level: inverting Eq. (3) as on each row of Table 1 returns a consistent across all four aggregation levels, so a single small endowment variance reproduces every measured band once the depth d is allowed to grow with between-environment content. It is the depth, not the endowment, that moves across levels. Equation (2) also links the trilogy’s two multiplicative cascades, the success law and the Sah–Stiglitz filter [5], as two faces of one process.
3. Reach: Influence Decays Geometrically with Depth, and Collapses at the Boundary
Position is not merely a coordinate; it sets how far an entity can reach. To move a decision d levels above it, a proposal must clear every intervening level, a conjunction of approvals, so if each passes with probability ,
The decay is exponential in depth, and directional: downward, a superior imposes through any one path (a disjunction), so ; upward, any single veto blocks, so . Real authority therefore concentrates above even where formal authority is delegated [6]. This is the microstructure that turns the amplifier’s scalar position S into power: S fixes the depth d, and reach falls as , a second multiplicative channel alongside Eq. (2). Its sharp empirical signature is the familiar fact that the lower one sits, the harder it is to influence anything above: fast, so in the raw rates the proposal of an entity with no position at all appears to face a near-unit barrier. We stress “appears”: the steepness of the boundary is a statement about uncontrolled rates, and the GitHub data (Section 9) show that once proposal quality is held fixed much of this cliff is a quality confound. The two-regime shape (gentle decay within the hierarchy, a steep cliff at the boundary) survives in the raw rates, but the identified, quality-controlled effect is a moderate, robust residual position penalty rather than an impassable wall.
4. Microfoundation: from Gould’s Deference Model
We derive f rather than assume it. In Gould’s model [4] actor i allocates deference to j, whose status is , balancing attraction to the valuable (, with q quality and social influence) against an aversion to non-reciprocation. With quadratic cost and asymmetry penalty ,
the first-order condition and reciprocal substitution give , and a mean-field sum yields
so the status–quality sensitivity is . As the amplification diverges (status crystallises from negligible quality differences); reciprocity raises and lowers M, i.e. it stabilises the amplifier. In this linear regime f is proportional to S (the sensitivity is absorbed into the gain g of Eq. (1), so we write ). When the top reciprocates less, , the status boost shrinks with S and the reduced-form feedback becomes saturating (Figure 1),
linear at small S (heavy-tail engine) and approaching at large S (a soft ceiling). The saturation is the micro-image of the insurance of Section 6.
5. The Tail Index, Pinned
Amplification with a reset (death/renewal) is a Kesten process and produces a power-law tail [10]; preferential attachment gives the same via Gould’s dynamics [11,12]. In the saturated tail the drift is and, with reset (killing) rate p, the killed Fokker–Planck stationary tail of solves , giving the CCDF exponent c and pdf exponent1
Inverting (7) for (with and an illustrative reset , of the same order as the state-dependent hazard of Section 6, whose realised rate is 0.003–0.012) pins in closed form; the pinned is insensitive to p within this range. A Clauset MLE [18], with by KS minimisation and , on a simulation at recovers (within-sample 95 CI ). A pure power law is rejected (GOF ): the law is a log-normal bulk with a heavy, cut-off tail, exactly the demarcation paper’s verdict (“power law indistinguishable from log-normal but decisively non-exponential”). We pin the exponent, not a clean Pareto.
6. The Insurance, Merged via the Kesten Reset
The amplifier alone would grow without bound; the reset of Section 5 is, substantively, Boehm’s reverse-dominance hierarchy [7]: a coalition of subordinates toppling the over-dominant. Taken seriously the reset is not a constant rate but a hazard that is (i) state-dependent (rising with dominance), (ii) a threshold/phase transition (under preference falsification subordinates stay silent until a critical mass, then cascade [8,9]), and (iii) suppressed by opacity, the top raising the trigger by denying subordinates the information to coordinate (“divide and rule”; the opacity of [3]). We model
Simulation (mean of four seeds) shows the insurance fires rarely, late and large: versus a constant reset it cuts the 99.9th percentile from 2868 to 126 while toppling entities of median size 58.8 (far above the typical ), giving a sharper, non-exponential cutoff. Raising opacity () lowers the reset rate monotonely () and raises extreme concentration (): in the model, opacity is a quantitative concentration lever. Analytically, a state-dependent hazard adds an killing term to the tail equation, forcing faster-than-power-law decay for and recovering (7) at : the insurance’s state-dependence is the dial between a clean Pareto and a truncated heavy tail. The amplifier and the insurance are one model.
7. Calibration and Robustness Across the Measured Band
A Level-1 calibration plugs the measured constants of [2] into Eq. (2). The single-career version is ruled out: measured permanent income shocks (/yr) over a 40-year career give only , below the target; of the dispersion is intergenerational. A stationary intergenerational transmission (IGE ) is also ruled out (it would need an implausible per-generation shock); only a near-random-walk () between-environment process reproduces the magnitude, independently matching the finding of [2].
The calibration is robust across all four aggregation levels (Table 1 and Figure 2). The reproduced R bands match the measured ones; the required effective depth grows monotonely with between-environment content and vanishes at the within-tract level, where , the model’s own prediction. (Equation (3) has a hard floor at , since cannot be negative; the model therefore predicts exactly with , i.e. no amplification once one conditions on a homogeneous place. The measured within-tract band straddles that floor only because of sampling noise around ; the entries below the floor are not a model output.) The global amplifier splits into a within-country channel ( 76 , the status ladder) and a between-country channel ( 24 , geography). Under partial-identification reattribution of within-country dispersion to capability, R stays above 8 for shares and only collapses to at an aggressive , reproducing the stress test of [2].
- Anchoring the depth: R is predicted, not fitted.
A fair objection to the calibration is that is recovered from the very variance it explains, so Eq. (3) risks being an accounting identity. We break the circularity for the between-country channel by anchoring both factors independently of the trilogy, from the long Maddison GDP-per-capita panel. The per-step amplification is a flow, the cross-country variance of 30-year log-growth, averaged over non-overlapping generations, per generation, and the depth is a count, the number of generations of divergence since 1820, . Neither uses . A word on units is needed to avoid confusion with Table 1: “depth” is only defined up to the size of one step, so d and are not separately meaningful, only their product is. The anchor here measures the step as one 30-year generation (, ), whereas the effective depth tabulated for the calibration uses a finer per-level step (), so the between-country of Table 1 and the generations here are the same elapsed divergence expressed in two step sizes, not two conflicting counts. The comparison that carries content is between the products, (anchored) and (calibrated), discussed below. The cross-country variance of log GDP per capita grows approximately linearly over the period (Figure 3; linearity ), broadly consistent with the random-walk signature, though the growth is not monotone (the balanced panel dips mid-century), so we read this as supporting rather than cleanly confirming the near-non-mean-reverting mechanism the Level-1 calibration required. Their product is the predicted increment in between-country log-dispersion accumulated since 1820, and matches the balanced-panel accumulation actually observed over that window to within a factor of about 1.6 (the random walk overstates it, as noted below). This predicted increment should not be confused with the full stock of dispersion: the present full-coverage stock, , sits beside the trilogy’s independently measured between-country (a factor of 1.4), and the calibration’s own between-country increment is (a factor of 1.8 above the anchored 0.48); the three comparisons agree in order of magnitude. The stock yields a predicted that overlaps the measured band . The depth therefore has an observable referent, generations of economic divergence, whose independently measured magnitude reproduces R, so the dominance ratio is predicted, not reverse-engineered. (The balanced panel needed to reach 1820 is small and tilts toward early industrialisers that later converged, which is why the random walk slightly overstates the accumulation.)
- The within-country channel: mobility is too shallow.
The within-country component, 76 of the global amplifier, admits its own independent anchor through income mobility. A Galton–Solon process with intergenerational elasticity is mean-reverting, so its effective amplifier depth is only ; at the measured labour-income that is just 1.2–1.6 generations. With a per-generation innovation fixed by ordinary within-country income dispersion (), mobility reproduces ordinary income inequality exactly, but falls about 8-fold short of the within-country positional dispersion . To generate that as a stationary process would require an effective persistence , near the random-walk limit and far above the of measured earnings mobility. The within-country amplifier therefore behaves not like mean-reverting labour income but like the near-permanent accumulation of capital, Piketty’s , independently corroborating the calibration (Section 7) and the measured rise of the within-country component over 1990–2022. Both channels of the amplifier are thus anchored, and both demand the same non-mean-reverting mechanism, from two unrelated data sources.
8. Empirical Confrontation: The ICIJ Officer Network
We test the model’s predictions on the raw ICIJ Offshore Leaks database [24] (SHA-256 manifest accompanying the code). The officer network has 1720357 officer_of relationships over 770370 officers;2 the degree (entities controlled) is heavy-tailed with a global Clauset exponent (Figure 4), reproducing the hidden-layer value of [3] independently from raw data. Splitting by recording regime (the demarcation paper measured that the data source accounts for of the between-record variance in how a relationship is recorded [3]), the aggregate provider-leak layer shows a heavier extreme than the public-registry layer: maximum degree 36335 versus 1634, and a lighter Clauset exponent ( versus ; Table 2). The two layers swap order at the 99.9th percentile (70 for provider-leak versus 149 for registry): the provider-leak layer carries far more low-degree nominee officers, which pulls its high percentiles down even as its far tail (captured by and the maximum) is heavier. Percentile and tail-index thus measure different parts of the distribution and need not move together. At first this looks like the predicted opacity effect.
It does not survive calibration (Figure 5). Operationalising opacity as recording incompleteness (the mean fraction of structural fields left blank, a distinct variable from the recording-regime split above; 89 of its variance lies between sources, reproducing the ordering of [3]) and regressing, across the 23 jurisdictions with edges, a concentration metric on opacity (weighted by edges), no metric is significant: the Gini slope is weakly positive (, permutation ), the top- 1 share is null, and the extreme-tail metric (log maximum hub) trends the wrong way (, ). The 36335-hub sits in a high-volume but relatively recorded, low-opacity centre, not in the most opaque jurisdictions (Seychelles, opacity 0.996, has a tiny maximum hub). The per-layer gap was a composition artifact of which sources populate each layer, not a continuous opacity gradient.
This is more than a null: the sign is reversed. The simulation of Section 6 predicts that greater opacity raises extreme concentration, whereas the empirical extreme-tail metric, if anything, falls with opacity. We do not read this as refuting the mechanism, because the two “opacities” are not the same quantity (see below); but we flag plainly that the measured proxy moves opposite to the model’s prediction, and that the reconciliation rests on the demarcation argument rather than on the data.
The negative result is itself the finding, and it vindicates [3]. What is measurable here, officer-of degree, is mass-incorporation and nominee structure, not the beneficial-ownership concentration the model concerns; the quantity that would test the lever (who really owns) is precisely the one the powerful hide and ICIJ records in only a few percent of relationships. The calibration hits the demarcation paper’s unmeasurability wall head-on: the opacity lever cannot be cleanly identified because of the opacity it would quantify. A genuine test requires a beneficial-ownership concentration measure that is unavailable by construction.
9. An Identifiable Test: Position and Pull-Request Acceptance
The offshore test failed because the quantity it needed, who really controls, is hidden by construction. The constructive move is to a domain where position is logged. On GitHub, a contributor’s position relative to a repository is recorded as author_association (none/contributor < member/collaborator, plus a small, heterogeneous owner category we keep separate), and the outcome (whether a pull request is merged) is binary and observed. The amplifier predicts that position, not merit, moves the acceptance probability: at fixed proposal quality, an insider’s change should pass where an outsider’s does not, the Sah–Stiglitz filter read off a real hierarchy.
- Raw gradient.
A pilot on 4800 closed pull requests across six large repositories shows a strong raw gradient along the position ladder: the merge rate rises from 0.014 for unaffiliated authors (none) through 0.766 (contributor) and 0.887 (member) to 0.923 (collaborator); the within-repository insider-minus-outsider gap averages . The raw shape is exactly the two regimes of Eq. (4): a gentle geometric decay within the hierarchy and a ∼50-fold collapse at the boundary (no position at all). But the pilot does not control for quality, so the cliff may be that outsiders submit worse changes.
- Full study with quality control.
We therefore take one full day of the GH Archive event stream, 113895 closed pull requests (bots removed), whose payload carries the diff size (additions, deletions, files) the live endpoint omits. A logistic regression of merge on position with size controls (Figure 6) leaves the position effect large and significant at fixed PR size: relative to none, the merge odds multiply by 3.2 (contributor), 7.0 (member) and 3.8 (collaborator), all . The point estimate for collaborator is not above that for member, even though the pilot’s raw merge rate is monotone in position (0.766/0.887/0.923 above; in the full study itself the raw rates are already non-monotone at the top): once size is controlled, the two top categories are statistically indistinguishable, and the ordering between them is not identified by these data (collaborators also review and merge others’ work, so they open comparatively fewer marginal pull requests of their own). What is robust, and all we rely on, is the large gap from none to any in-hierarchy position. Position raises acceptance independently of how big the change is. Honesty requires the converse too: the dramatic boundary cliff of the pilot shrinks in the full study, where the size-controlled outsider merge rate is 0.64 against insider rates of 0.85–0.92 (a penalty of roughly 21–28 percentage points) rather than an impossibility. Two distinct factors drive this shrinkage and we separate them explicitly. First, sample composition: the pilot is six large, heavily gatekept repositories where an outsider’s pull request almost never merges, whereas the full study is the entire one-day event stream, dominated by smaller repositories with far more permissive merging; most of the gap between the pilot’s 0.014 and the full study’s 0.64 is this population change, not a control effect, and we do not attribute it to size control. Second, within the full study, adding diff-size controls further trims the outsider–insider gap but leaves a moderate, robust residual position penalty (∼28 pp). The two-regime shape of Eq. (4) is thus a property of selective, large repositories; pooled across all repositories the boundary is a penalty, not a wall.
- The clean test: same author, different position.
The next design holds the author, and hence the person’s general competence, fixed. We take the 1326 authors who appear as an insider in some repositories and an outsider in others, and estimate a within-author (fixed-effect) linear-probability model of merge on an insider indicator with size controls and author-clustered standard errors. The same author’s pull request is pp more likely to be merged when they hold a position than when they do not (SE 0.014, ; an unadjusted paired gap of pp). One caveat keeps this from being a fully clean position effect: insider status is not assigned at random across repositories: an author tends to become a member or collaborator precisely in the projects whose codebase and conventions they know best, so part of the within-author gap may be domain-specific familiarity rather than the badge as such. The estimate therefore holds the person fixed but not project-specific competence, and is best read as an upper bound that motivates the tighter promotion design below, which absorbs the project as well. With the person held fixed, position is strongly associated with acceptance; whether the association is purely positional is settled only once the same project is also held fixed.
- The cleanest test: a promotion holds author and project fixed.
The across-repository contrast still varies the project. The tightest design is longitudinal: the same author, in the same repository, promoted over time. We sample eleven days of GH Archive spread over twenty months and find 1596 (author, repository) cells in which an author submits pull requests first as an outsider and later, after a position change, as an insider, with every outsider pull request preceding every insider one, a clean promotion. A within-cell fixed-effect model, which absorbs both the author (competence) and the repository (project norms), leaves a position effect of on the merge probability (SE 0.008, ; paired rates 0.864→0.904), at an essentially unchanged mean pull-request size. The effect is smaller than the across-repository estimate (these are already-active contributors near the acceptance ceiling), but it is the cleanest: the same person, the same project, only the badge changed, and the proposal is accepted more.
One alternative remains even here, and we state it rather than dismiss it. Because the design is longitudinal, the post-promotion period is also a period in which the author has accumulated more experience with the project, so the could in principle reflect learning-by-doing (better fit to the project’s norms) rather than the badge itself. Three features bound, but do not eliminate, this concern. The mean pull-request size is essentially unchanged across the threshold, so the shift is not explained by the author submitting visibly different work; the contributors are already active and near the acceptance ceiling, where the marginal return to further familiarity is small; and the jump is concentrated at the promotion event rather than accruing smoothly with tenure. These make the badge the more parsimonious reading, but unchanged diff size is not the same as unchanged quality, and we cannot fully separate the badge from continued skill growth. The honest claim is that promotion moved the outcome with no detectable change in the work; whether the channel is the badge or the competence that tends to travel with it is the one thing this design still cannot adjudicate.
- Two model-sharpening checks: multiplicative structure and a placebo.
Beyond identifying the effect, the same data test two structural predictions the amplifier makes but a generic “insiders win” story does not. First, the success law has competence and position enter multiplicatively, so their effects on acceptance should not be additively separable, and the return to proposal quality should fade as position nears the acceptance ceiling (the soft ceiling of the saturating feedback , Eq. (6)). Both hold in the expected direction. A logistic merge model with a position×size interaction beats the additive model decisively (likelihood-ratio , , ): position and proposal size are not separable, as a multiplicative law requires. And along the genuine reviewer ladder the marginal effect of proposal size on rises then collapses— (none), (contributor), (member/collaborator)—smallest at the top, where position already secures the outcome, exactly the saturation the model predicts. We do not over-read this: diff size is a coarse proxy for competence and the owner category behaves anomalously, so a clean two-sided hump is not identified. In particular the empirical return does not vanish at the bottom (none sits just below the contributor peak, not near zero), so only the upper arm—the collapse of the quality return at the ceiling predicted by the saturating —is confirmed here, alongside the significant non-separability; the small- vanishing of Section 10 remains a property of the theoretical limit, not something these data establish.
Second, a placebo hardens the within-author estimate against the worry that the fixed-effect machinery manufactures a gap. Shuffling the insider label within each author—which preserves every author’s marginal mix of insider and outsider pull requests but severs the link between position and the specific pull request—drives the estimated within-author effect from () to a non-significant (). The estimator returns nothing when the signal is destroyed, as a valid one must. A complementary negative control is less tidy and we report it as found: restricting to near-trivial pull requests ( file, lines) does not abolish the within-author premium (, , against for substantive ones). The position premium is therefore pervasive rather than confined to substantive, contested changes; the raw cross-sectional impression that trivial pull requests behave differently is a composition artifact that does not survive holding the author fixed.
10. Discussion
The amplifier decouples power from competence: it operates on whatever it finds at the input, indifferent to whether real quality lay under the initial lead, so k is in principle unrecoverable from the output, which is precisely the unmeasurability of [3], here generated rather than noted. The unifying theme is the asymmetry of visibility: the amplifier’s coordination gains are continuous and measured, while its costs (a bad leader; accumulated grievance) are rare, delayed and hidden until they burst, so hierarchy always appears beneficial. We therefore resist the functionalist tautology “it exists, therefore it is useful”: the defensible claim is selection at the level of forms (uncoordinated groups lost to coordinated ones), not that any particular hierarchy is benign. The honest thesis is not “the cost is always smaller” but that hierarchy buys an average advantage at the price of rare, high-variance catastrophes whose net cost cannot be settled, because the measurable denominator, the true cost of bad leadership against unobservable k, is missing by construction.
- The marginal value of competence is hump-shaped in position.
A direct corollary of the success law sharpens the model’s practical content. Writing in the small- regime as , the marginal return to competence is
which, as a function of position at fixed k, is hump-shaped: it vanishes as , peaks at , and decays back to zero as grows. Competence and position enter multiplicatively, not additively, so improving k is nearly worthless at the bottom (there is no access through which capability can act) and nearly worthless again at the top (position already secures the outcome, a probability ceiling that echoes the soft ceiling the saturating feedback of Eq. (6) produces in the status dynamics); only in the middle band, , does self-improvement materially move the outcome. This reconciles two facts that look opposed. Globally, where positions are widely dispersed, dominates and improvement is swamped (); within a homogeneous environment, where is held fixed at a middling value, capability is exactly what separates outcomes (, Section 7). The model therefore does not say competence never pays, but that it pays inside a narrow positional window and is wasted on either side of it. This also answers why average capability so often suffices: at the bottom no amount of competence substitutes for missing access, and at the top none is required, so the pressure to improve is real only for those in the convertible middle, or for those buying a ticket into the heavy tail (Section 5), where a rare alignment of high k and an open position produces an outlier the amplifier then renders indistinguishable from luck. A testable implication is that the measured return to skill or schooling should itself be hump-shaped in hierarchical position, not monotone.
- A cross-domain measure: the position premium at fixed competence.
The framework yields a single transferable quantity, the gap between an outcome’s competence-based persistence and its position-based persistence, that is estimable wherever the two can be separated, and that the cumulative-advantage tradition, which measures self-reinforcement rather than this decoupling, does not isolate. We estimate it in two unrelated domains. In income, measured labour mobility transmits with an intergenerational elasticity , whereas the positional channel behaves as if (Section 7); the gap is the share of persistence that competence does not carry. On GitHub, holding the same author fixed, position adds at most pp to the merge probability at fixed proposal size—an upper bound, since the across-repository contrast does not difference out project-specific familiarity—which the promotion design (author and project fixed) tightens to a clean (Section 9); that premium is the same gap in a domain where “competence” is the author and “position” is the badge. One measure, how much of an outcome is position rather than competence, read off two systems that share no data, no scale and no method, is the empirical face of the title.
- Unmeasurability as a structural consequence, not a data limitation.
The sharper, and we think novel, claim is not that position decouples from competence (that is old) but that the act of amplification is itself the reason competence becomes unrecoverable. Because the cascade operates identically on a real capability advantage and on pure noise, the output retains no signature of which it amplified; k is not merely unobserved but erased by the mechanism. The opacity-lever null of Section 8 is the empirical instance: the test fails not for want of data but because the very quantity that would identify the lever, beneficial ownership, is the one the mechanism hides. We are careful not to let this become a licence for unfalsifiability. A theory whose central quantity is hidden by its own subject matter risks explaining every outcome after the fact, including the opacity proxy moving the “wrong” way in Section 8; if every result, null or reversed, can be absorbed as “the powerful hide,” the model says nothing. We avoid that trap in two ways. First, the unobservability is itself a sharp, pre-registered prediction (no jurisdiction-level concentration metric should track recording opacity on the measurable layer), and it is borne out, not invoked post hoc. Second, the model is made to stand or fall on a domain where the hidden quantity is not hidden: on GitHub position is logged, the decoupling is directly estimable, and the prediction is exposed to refutation in the ordinary way. The honest stance is therefore not to claim the hidden ratio on offshore data but to measure the hiding there, and to test the decoupling where position happens to be logged—so that the parts of the theory that cannot be falsified are quarantined from the parts that can.
11. Conclusion
Hierarchy is an amplifier: it takes tiny, often capability-irrelevant initial differences, multiplies them across its levels, and manufactures the dispersion the trilogy measured but did not explain; its feedback is fixed by Gould’s two forces, its tail by a reset that is Boehm’s insurance, and its concentration by the opacity that also makes its cost unaccountable. The act of amplification is itself the reason one can no longer recover, from the outcome, how much was real competence.
12. Reproducibility
All code and data to reproduce this paper are available at https://github.com/dkrse/position-amplifier. All constants live in data/trilogy_inputs.json with provenance, and all inputs (including the 700 MB ICIJ corpus) are SHA-256 hashed in data/MANIFEST.md (verify with python scripts/hash_data.py --check). The amplifier calibration and robustness (Section 7), the Gould feedback (Section 4), the tail-index pinning (Section 5), the insurance–Kesten merge (Section 6), the depth anchoring (anchor_d_sigma.py, anchor_within.py), the ICIJ analysis (Section 8), and the GitHub study and the promotion experiment (Section 9; pilot_github.py, fetch_gharchive.py, study_github.py, study_github_robust.py, study_promotion.py; raw pages cached and hashed) recompute from cached data; figures are regenerated by scripts/make_figures.py.
Data Availability Statement
The trilogy constants derive from [1,2,3]. The empirical analysis uses the ICIJ Offshore Leaks Database (version generated 2025-03-31) under ICIJ’s terms, the GH Archive event stream (https://www.gharchive.org/), and the Maddison Project Database (via Our World in Data). No proprietary or restricted data were used.
Acknowledgments
The author received no specific funding for this work and declares no competing interests.
References
- Sestak, K. The Dominance of Environment over Entity’s Capabilities. Preprint 2026, arXiv:2605.02985. [Google Scholar]
- Sestak, K. Empirical Confirmation of the Environmental-Dominance Inequality. Preprint 2026, arXiv:2605.12037. [Google Scholar] [CrossRef]
- Sestak, K. The Measurement Limit of Environmental Dominance: Why the Strong Thesis Can Be Neither Confirmed nor Refuted, and What Holds Instead. Preprint 2026. [Google Scholar] [CrossRef]
- Gould, R. V. The Origins of Status Hierarchies: A Formal Theory and Empirical Test. Am. J. Sociol. 2002, 107(5), 1143–1178. [Google Scholar] [CrossRef]
- Sah, R. K.; Stiglitz, J. E. The Architecture of Economic Systems: Hierarchies and Polyarchies. Am. Econ. Rev. 1986, 76(4), 716–727. Available online: https://www.jstor.org/stable/1806069.
- Aghion, P.; Tirole, J. Formal and Real Authority in Organizations. J. Political Econ. 1997, 105(1), 1–29. [Google Scholar] [CrossRef]
- Boehm, C. Hierarchy in the Forest: The Evolution of Egalitarian Behavior; Harvard University Press, 1999. [Google Scholar] [CrossRef]
- Kuran, T. Private Truths, Public Lies: The Social Consequences of Preference Falsification; Harvard University Press, 1995. [Google Scholar] [CrossRef]
- Granovetter, M. Threshold Models of Collective Behavior. Am. J. Sociol. 1978, 83(6), 1420–1443. [Google Scholar] [CrossRef] [PubMed]
- Kesten, H. Random Difference Equations and Renewal Theory for Products of Random Matrices. Acta Math. 1973, 131, 207–248. [Google Scholar] [CrossRef]
- Barabási, A.-L.; Albert, R. Emergence of Scaling in Random Networks. Science 1999, 286(5439), 509–512. [Google Scholar] [CrossRef] [PubMed]
- Merton, R. K. The Matthew Effect in Science. Science 1968, 159(3810), 56–63. [Google Scholar] [CrossRef]
- DiPrete, T. A.; Eirich, G. M. Cumulative Advantage as a Mechanism for Inequality: A Review of Theoretical and Empirical Developments. Annu. Rev. Sociol. 2006, 32, 271–297. [Google Scholar] [CrossRef]
- Magee, J. C.; Galinsky, A. D. Social Hierarchy: The Self-Reinforcing Nature of Power and Status. Acad. Manag. Ann. 2008, 2(1), 351–398. [Google Scholar] [CrossRef]
- Bask, M. Skill, Status and the Matthew Effect: A Theoretical Framework. J. Comput. Soc. Sci. 2024, 7(3), 2221–2253. [Google Scholar] [CrossRef]
- Benson, A.; Li, D.; Shue, K. Promotions and the Peter Principle. Q. J. Econ. 2019, 134(4), 2085–2134. [Google Scholar] [CrossRef]
- Tsay, J.; Dabbish, L.; Herbsleb, J. Influence of Social and Technical Factors for Evaluating Contribution in GitHub. In ICSE 2014; 2014; pp. 356–366. [Google Scholar] [CrossRef]
- Clauset, A.; Shalizi, C. R.; Newman, M. E. J. Power-Law Distributions in Empirical Data. SIAM Rev. 2009, 51(4), 661–703. [Google Scholar] [CrossRef]
- Champernowne, D. G. A Model of Income Distribution. Econ. J. 1953, 63(250), 318–351. [Google Scholar] [CrossRef]
- Simon, H. A. On a Class of Skew Distribution Functions. Biometrika 1955, 42(3/4), 425–440. [Google Scholar] [CrossRef]
- Gabaix, X. Power Laws in Economics and Finance. Annu. Rev. Econ. 2009, 1, 255–294. [Google Scholar] [CrossRef]
- Benhabib, J.; Bisin, A.; Zhu, S. The Distribution of Wealth and Fiscal Policy in Economies with Finitely Lived Agents. Econometrica 2011, 79(1), 123–157. [Google Scholar] [CrossRef]
- Gabaix, X.; Lasry, J.-M.; Lions, P.-L.; Moll, B. The Dynamics of Inequality. Econometrica 2016, 84(6), 2071–2111. [Google Scholar] [CrossRef]
- International Consortium of Investigative Journalists. ICIJ Offshore Leaks Database. 2025. Available online: https://offshoreleaks.icij.org/.
| 1 | We take as the magnitude of the downward restoring drift and orient the characteristic equation so that a stronger drift (a larger ) gives a larger c, hence a lighter tail; this is the sign convention implicit in Eq. (7). Readers adopting the opposite orientation of the drift term should flip the sign of throughout, which leaves the calibrated and unchanged. |
| 2 | The two opacity layers of Table 2 (273068 registry and 497231 provider-leak officers) sum to 770299, 71 short of this total: a handful of officers cannot be assigned a single recording regime (edges spanning both source types) and are dropped from the per-layer split but retained in the global count. |
Figure 1.
The amplifier feedback derived from Gould’s two forces (Eq. (6)). Attraction to the valuable makes f linear at the bottom (the engine of the chasm); aversion to non-reciprocation, once the top reciprocates less, bends it into a saturating ceiling at the top. f is a consequence, not a free parameter.
Figure 1.
The amplifier feedback derived from Gould’s two forces (Eq. (6)). Attraction to the valuable makes f linear at the bottom (the engine of the chasm); aversion to non-reciprocation, once the top reciprocates less, bends it into a saturating ceiling at the top. f is a consequence, not a free parameter.
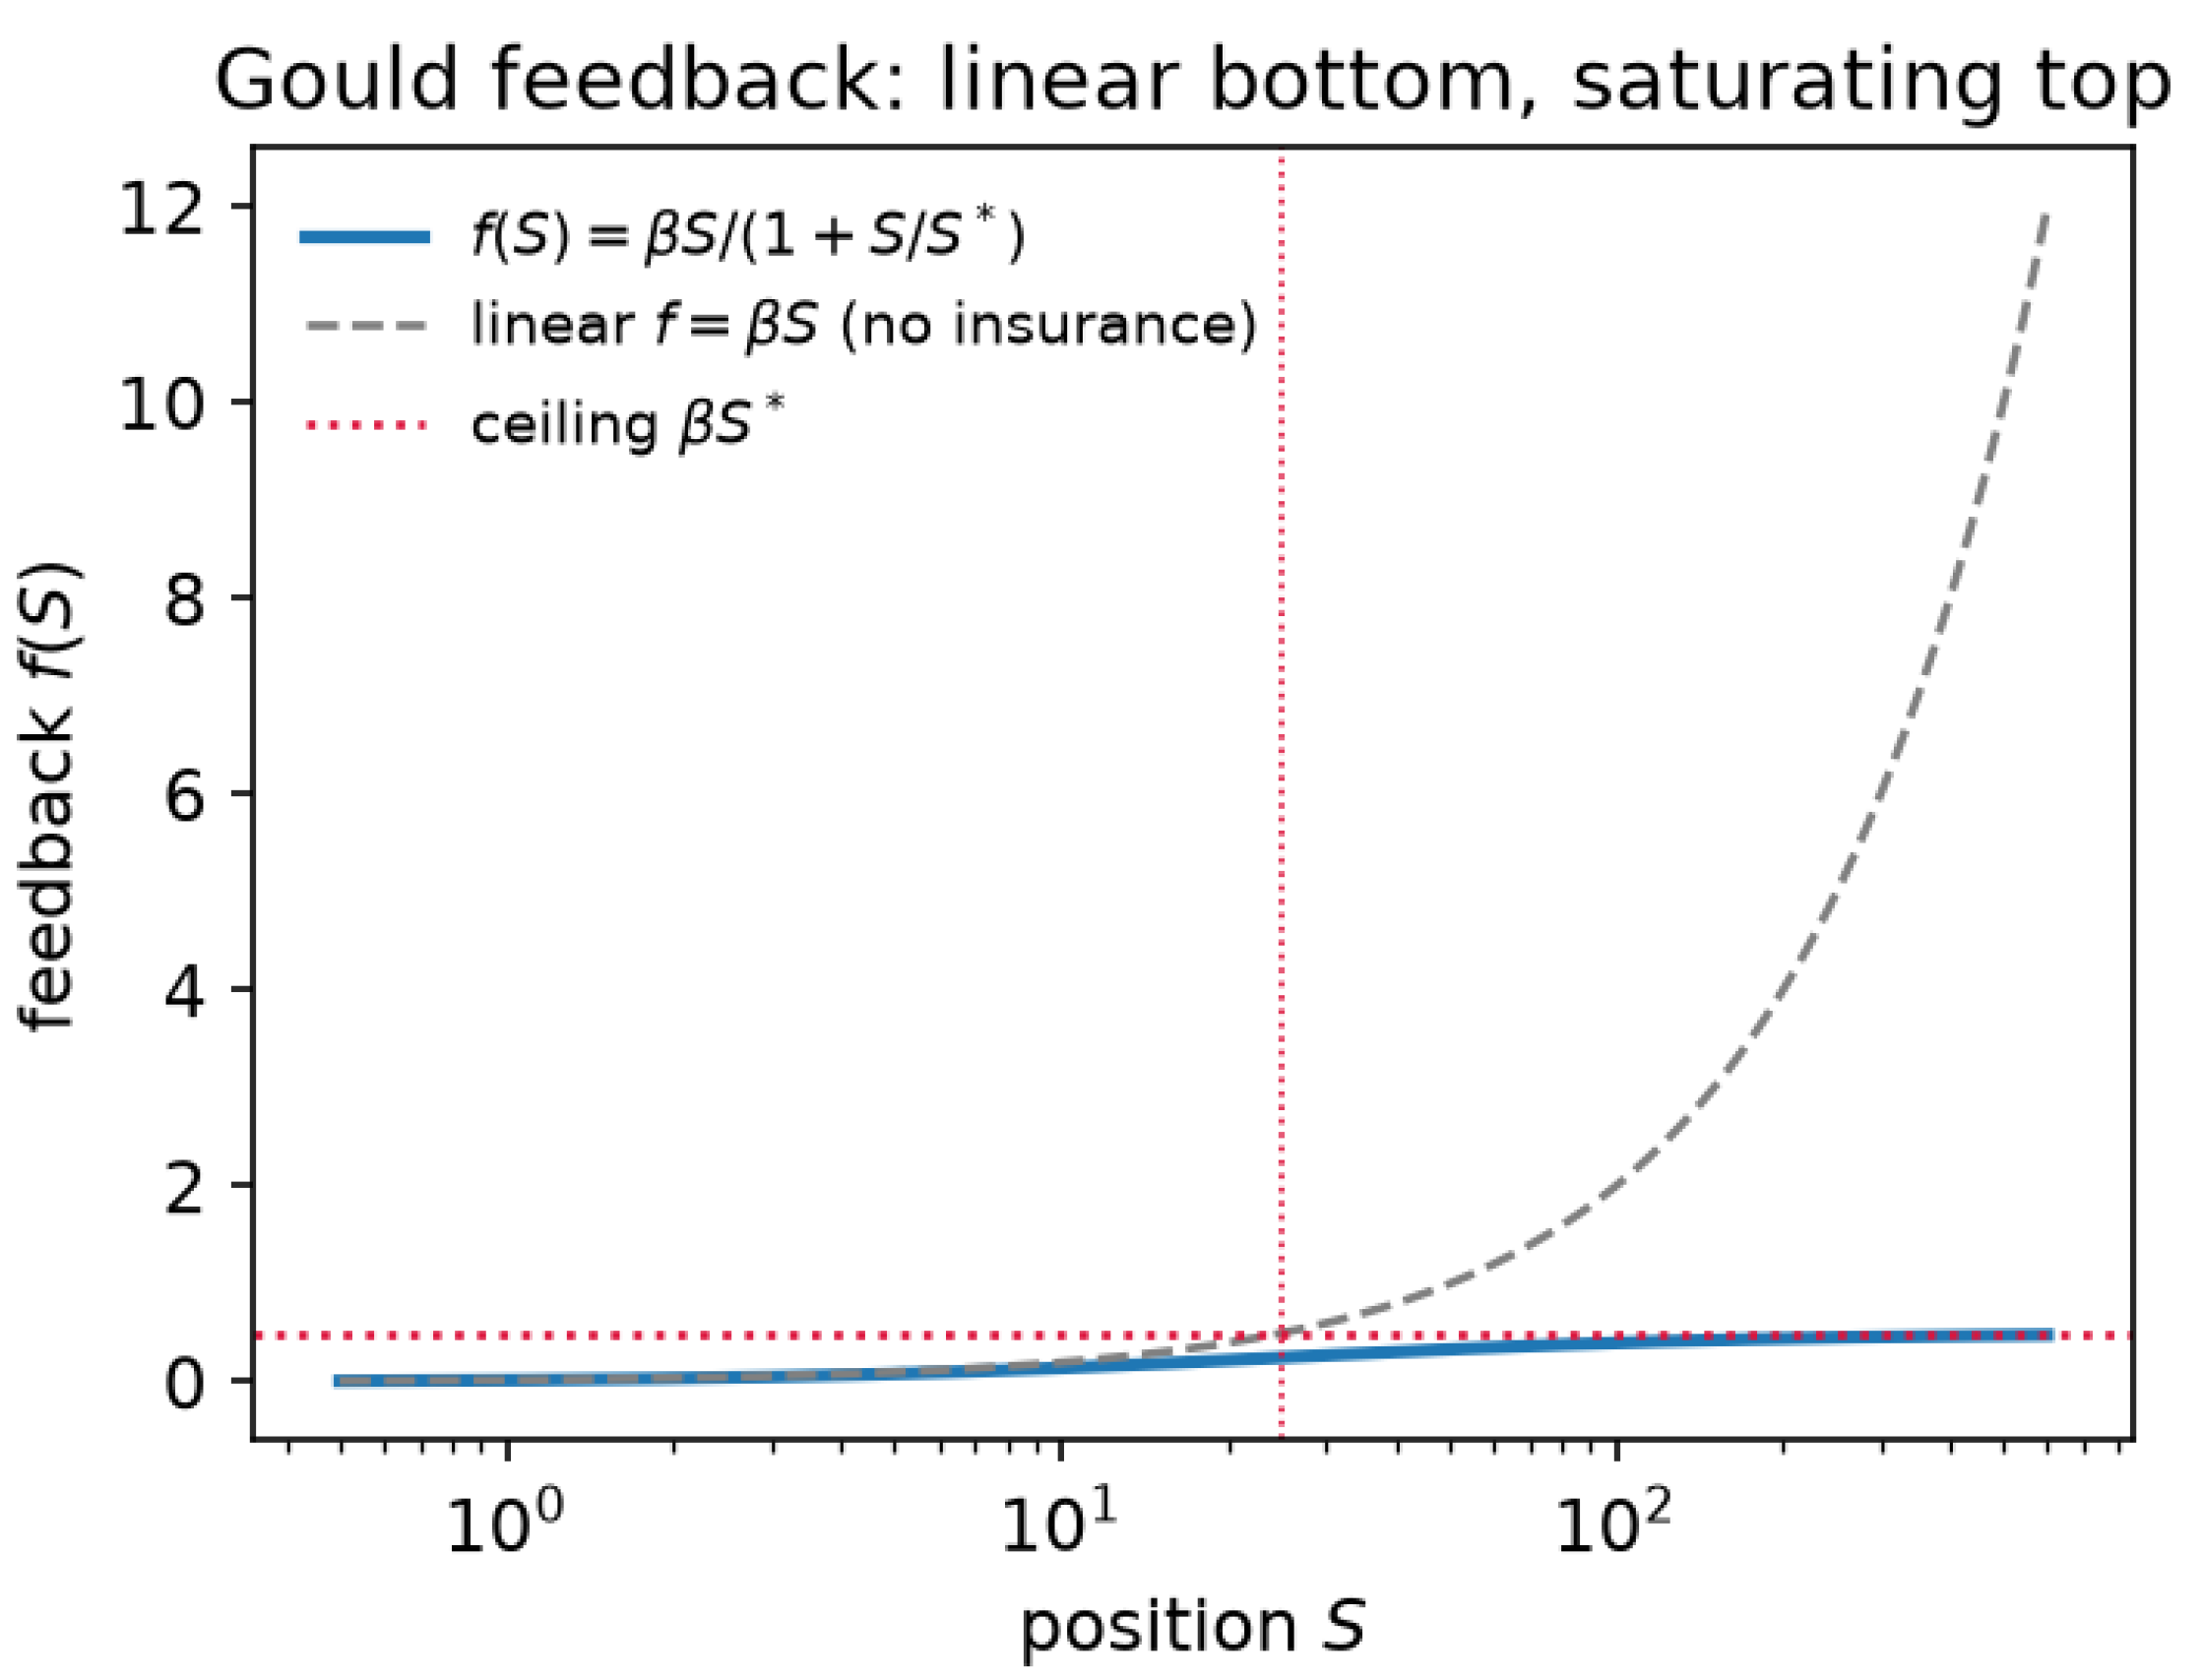
Figure 2.
Effective amplification depth required at each aggregation level. It is zero once one conditions on a homogeneous place (within-tract, ) and grows with the between-environment variation the level retains, the amplifier’s own prediction, not a fitted feature.
Figure 2.
Effective amplification depth required at each aggregation level. It is zero once one conditions on a homogeneous place (within-tract, ) and grows with the between-environment variation the level retains, the amplifier’s own prediction, not a fitted feature.
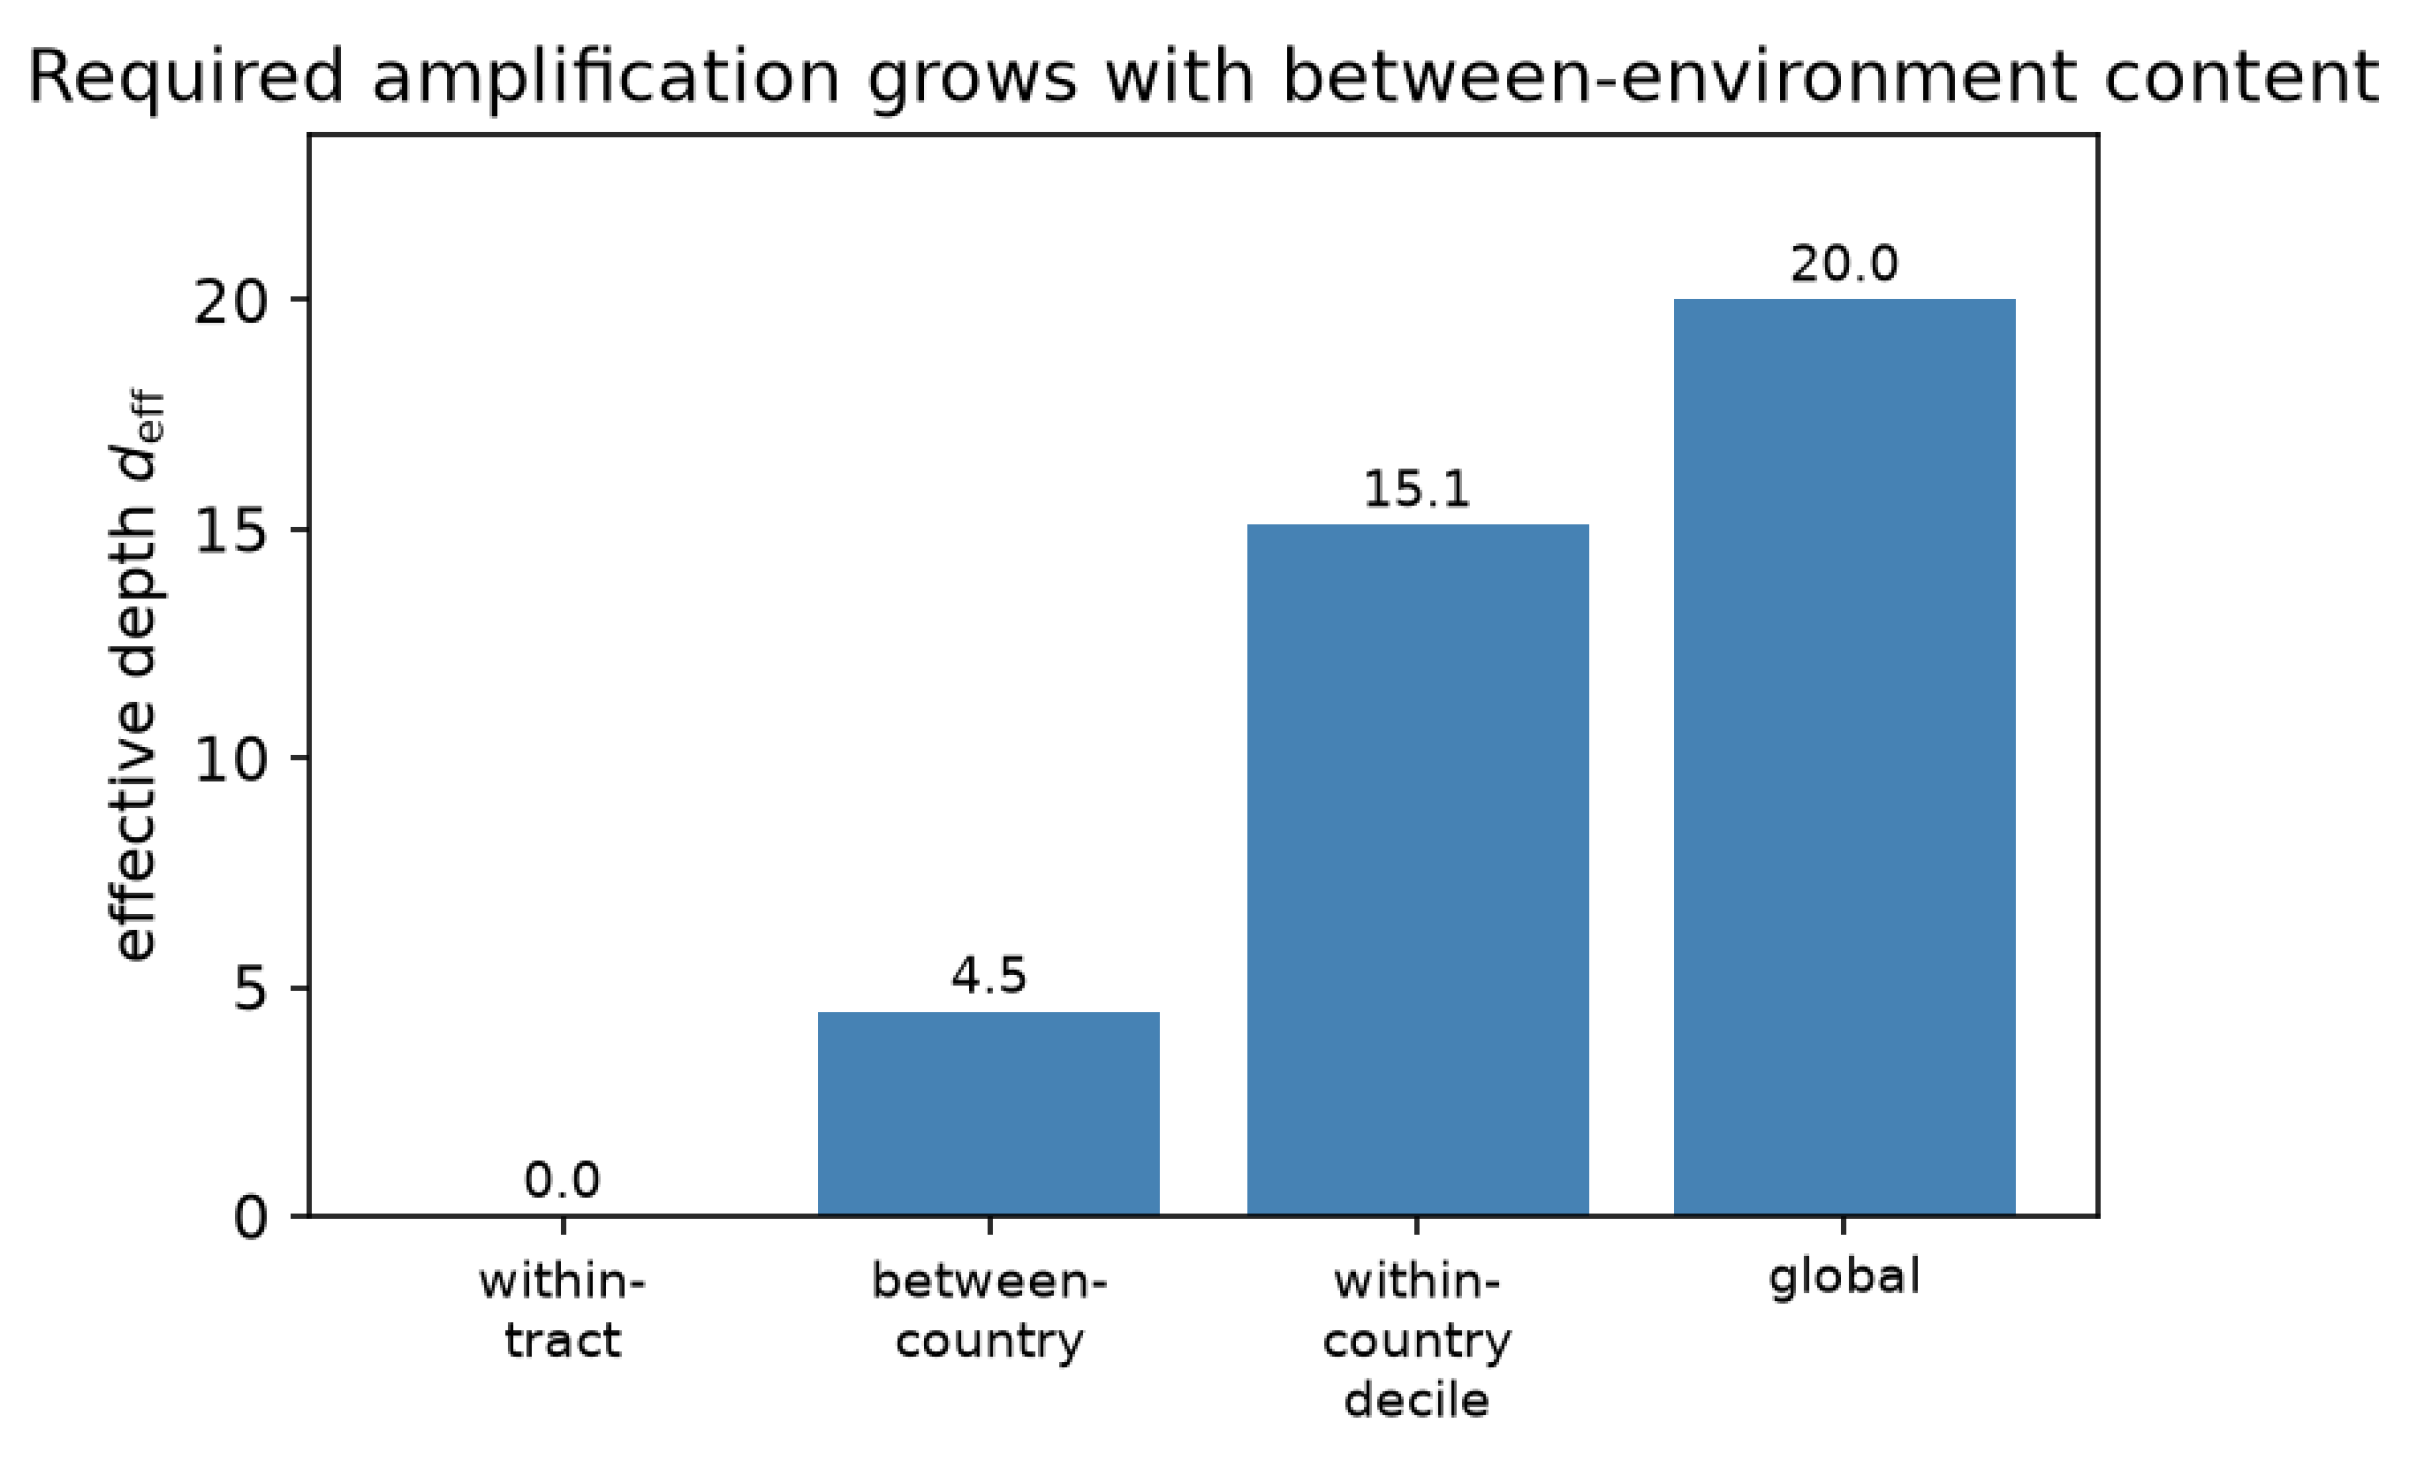
Figure 3.
The cross-country variance of log GDP per capita (balanced panel, 1820–2000, Maddison) grows essentially linearly in time—the random-walk signature the amplifier requires. Its slope anchors and the elapsed span anchors the depth d, independently of the trilogy, so the predicted dominance ratio is not fitted.
Figure 3.
The cross-country variance of log GDP per capita (balanced panel, 1820–2000, Maddison) grows essentially linearly in time—the random-walk signature the amplifier requires. Its slope anchors and the elapsed span anchors the depth d, independently of the trilogy, so the predicted dominance ratio is not fitted.
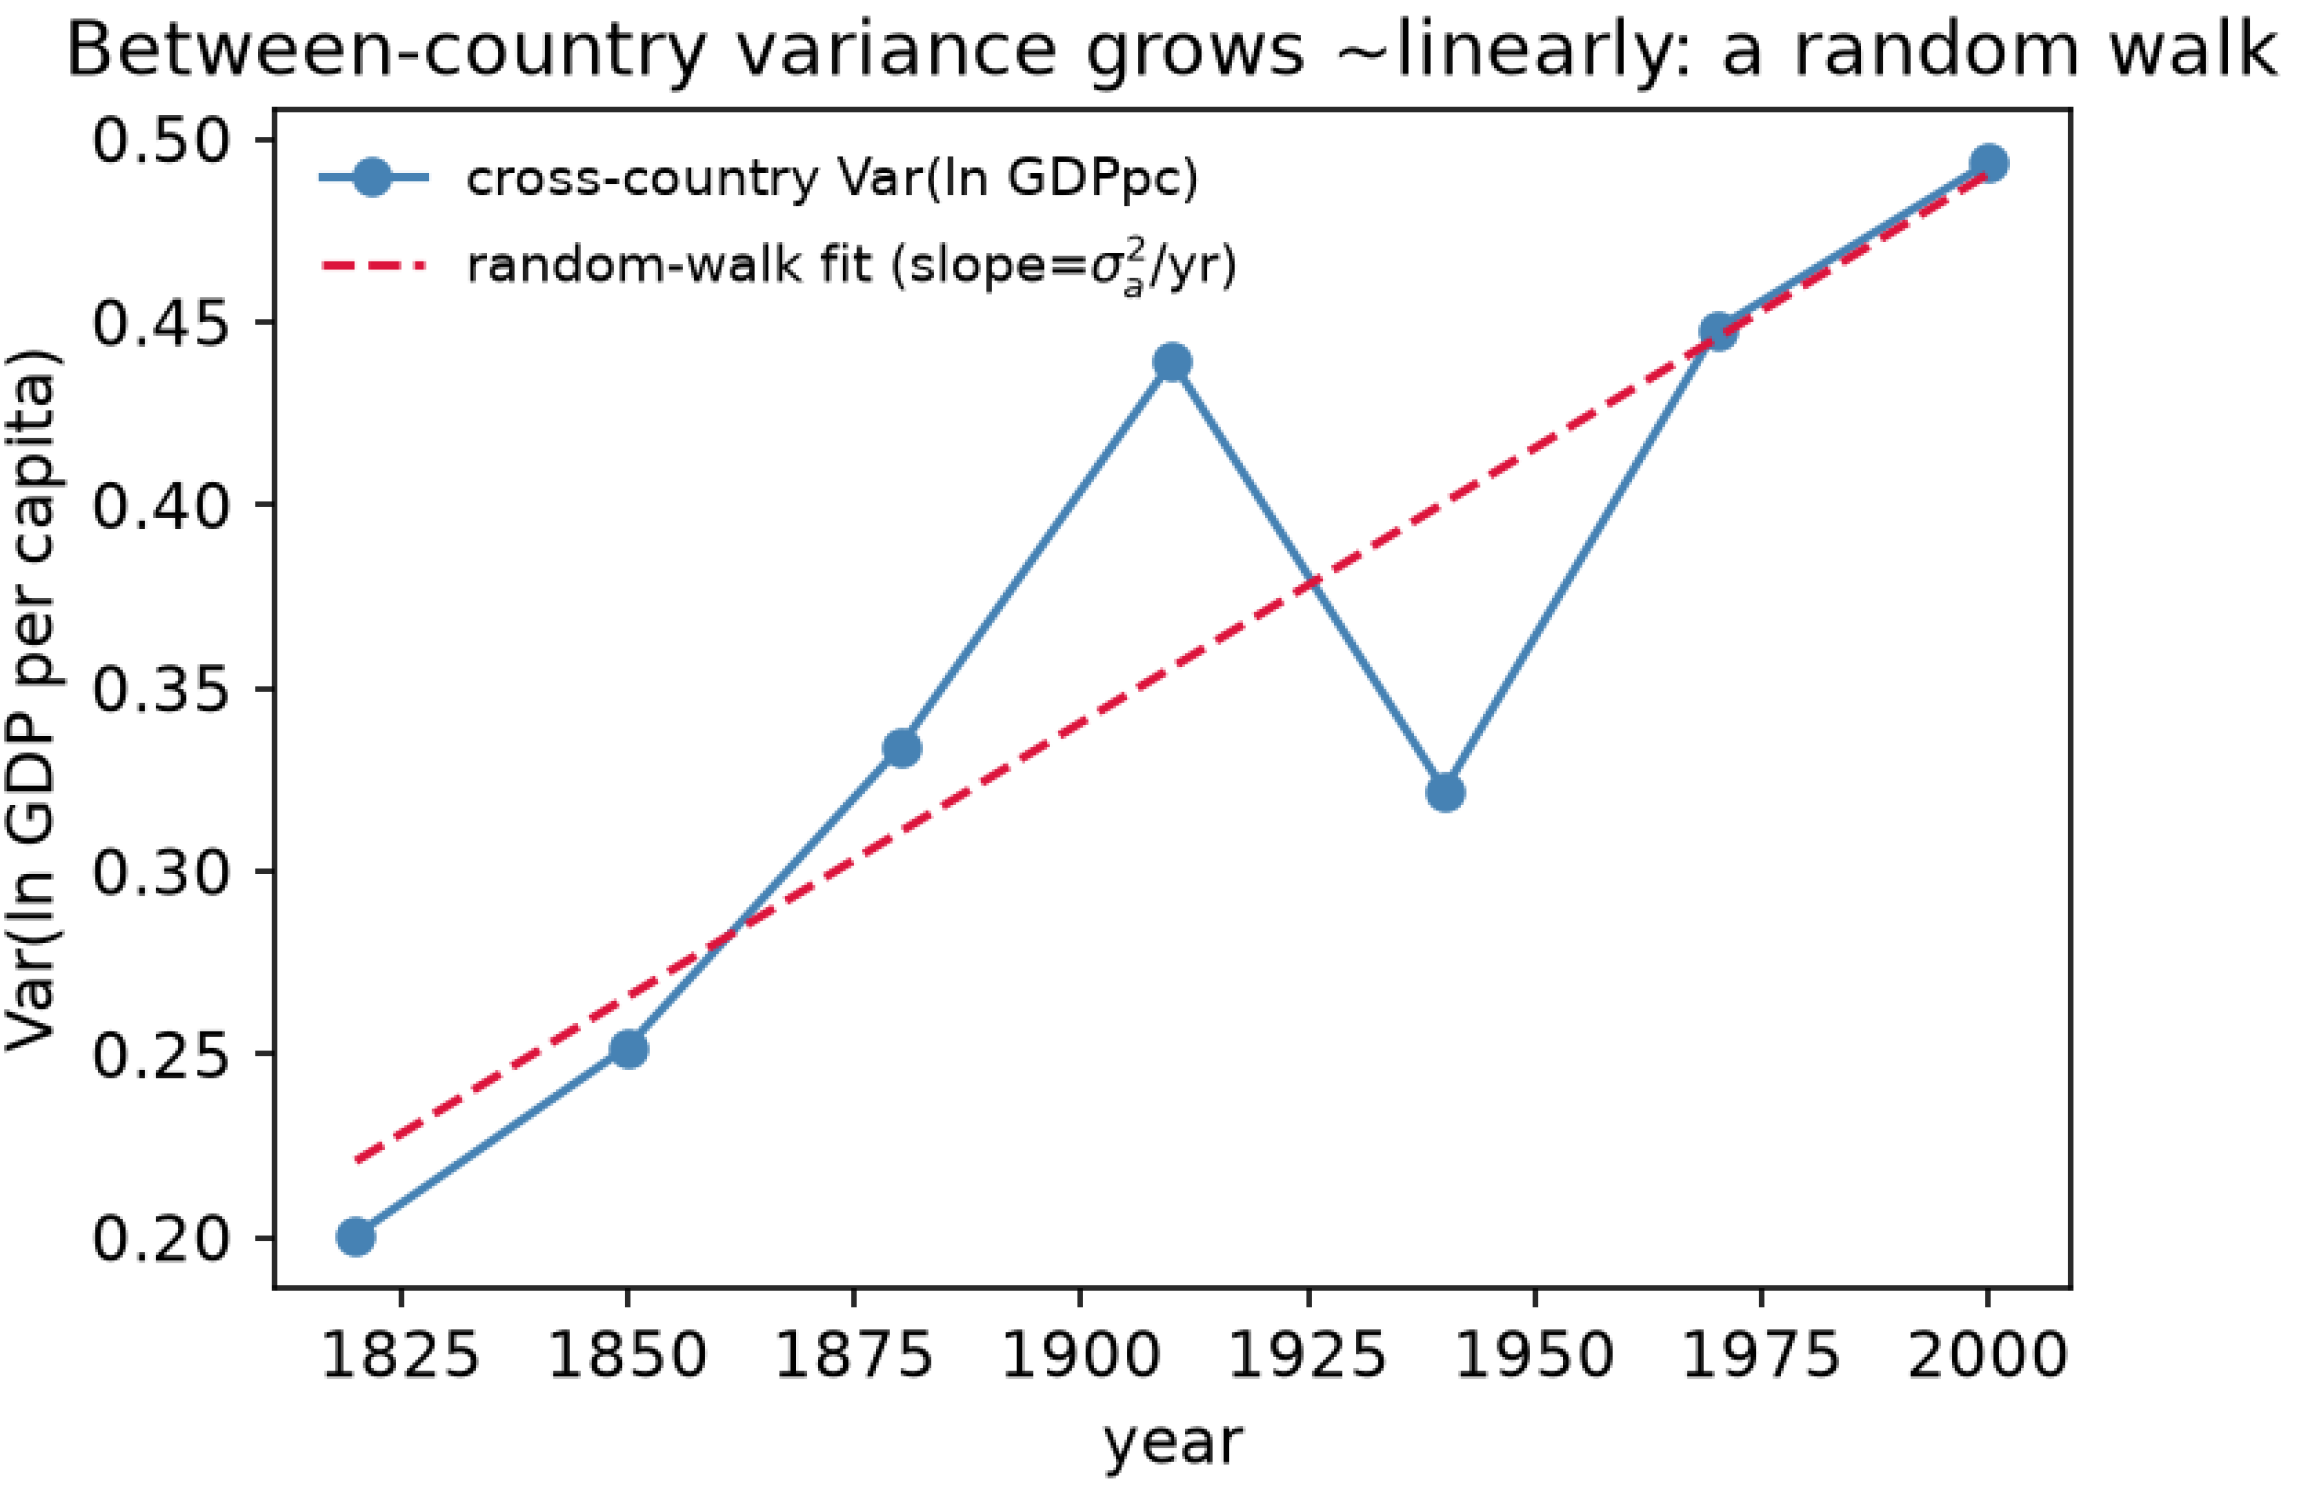
Figure 4.
Complementary cumulative distribution of ICIJ officer degree (log–log). The tail is heavy and consistent with a power law of exponent (Clauset MLE), independently reproducing the hidden-layer value of [3].
Figure 4.
Complementary cumulative distribution of ICIJ officer degree (log–log). The tail is heavy and consistent with a power law of exponent (Clauset MLE), independently reproducing the hidden-layer value of [3].
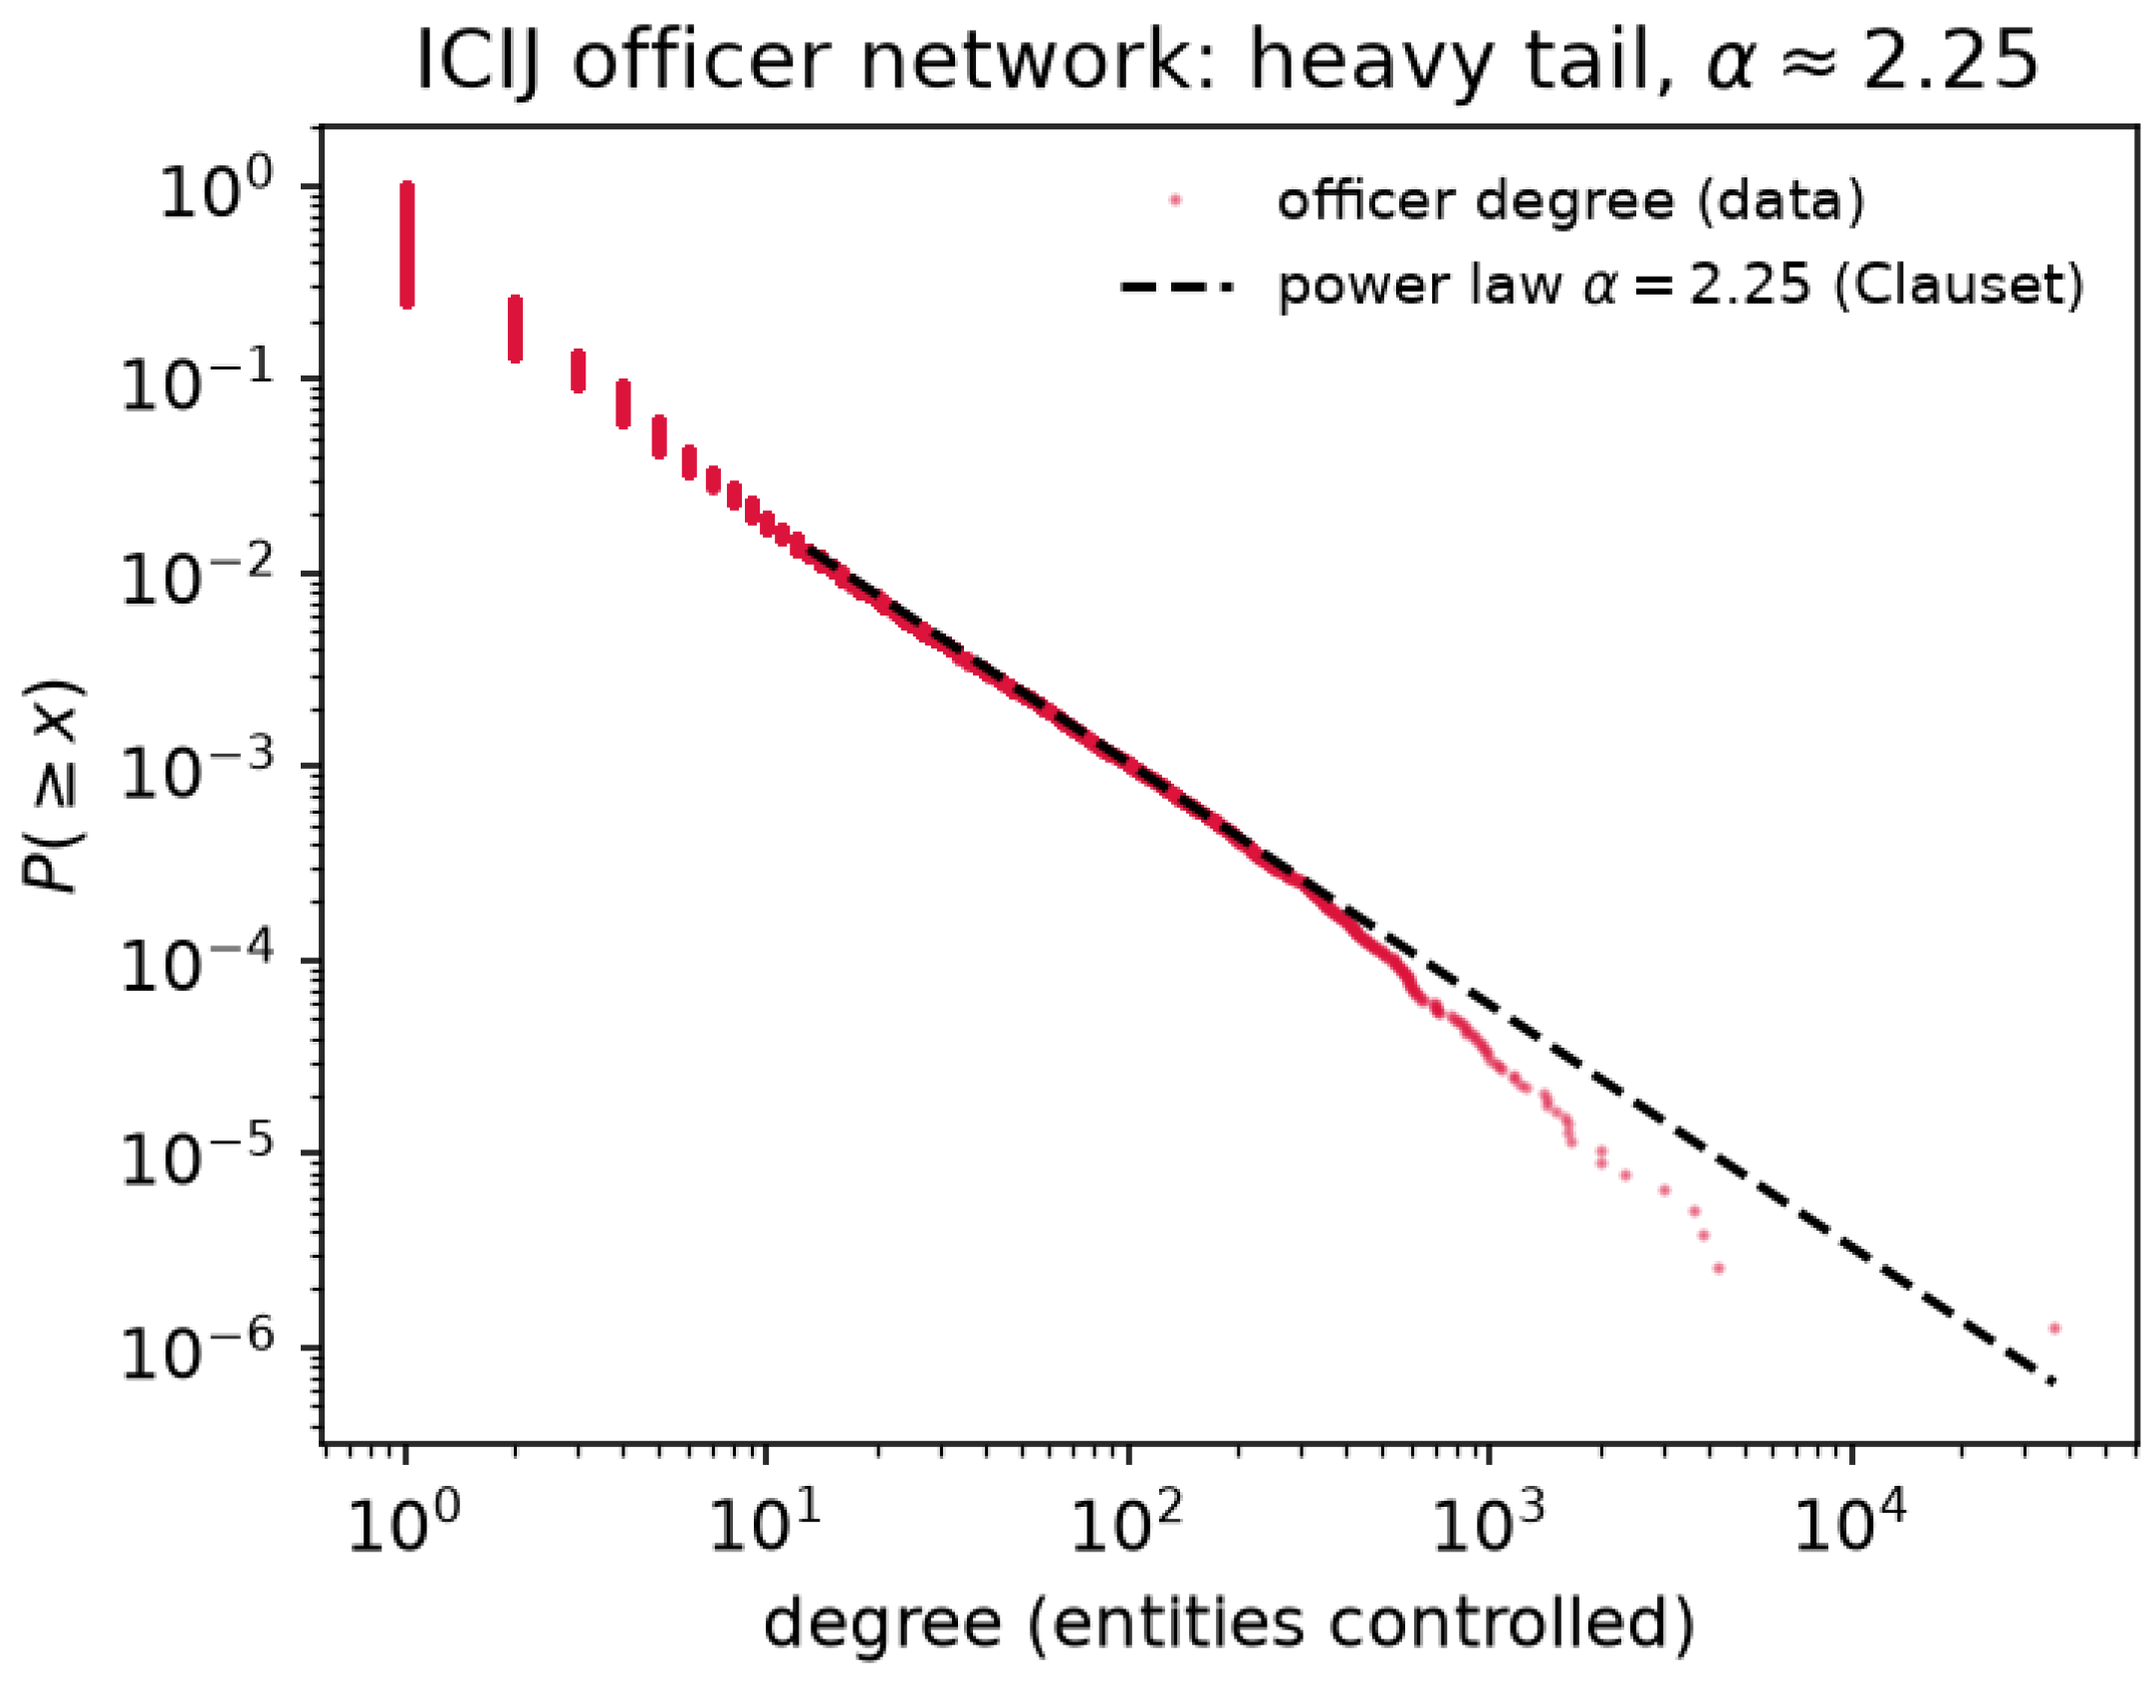
Figure 5.
The opacity lever is not identified across jurisdictions: a weighted regression of concentration (Gini of officer degree) on recording opacity has a weakly positive, non-significant slope (permutation ), and the extreme-tail metric trends the wrong way. The measurable quantity is mass-incorporation structure, not the hidden beneficial ownership the model concerns. Marker area is proportional to the number of edges.
Figure 5.
The opacity lever is not identified across jurisdictions: a weighted regression of concentration (Gini of officer degree) on recording opacity has a weakly positive, non-significant slope (permutation ), and the extreme-tail metric trends the wrong way. The measurable quantity is mass-incorporation structure, not the hidden beneficial ownership the model concerns. Marker area is proportional to the number of edges.
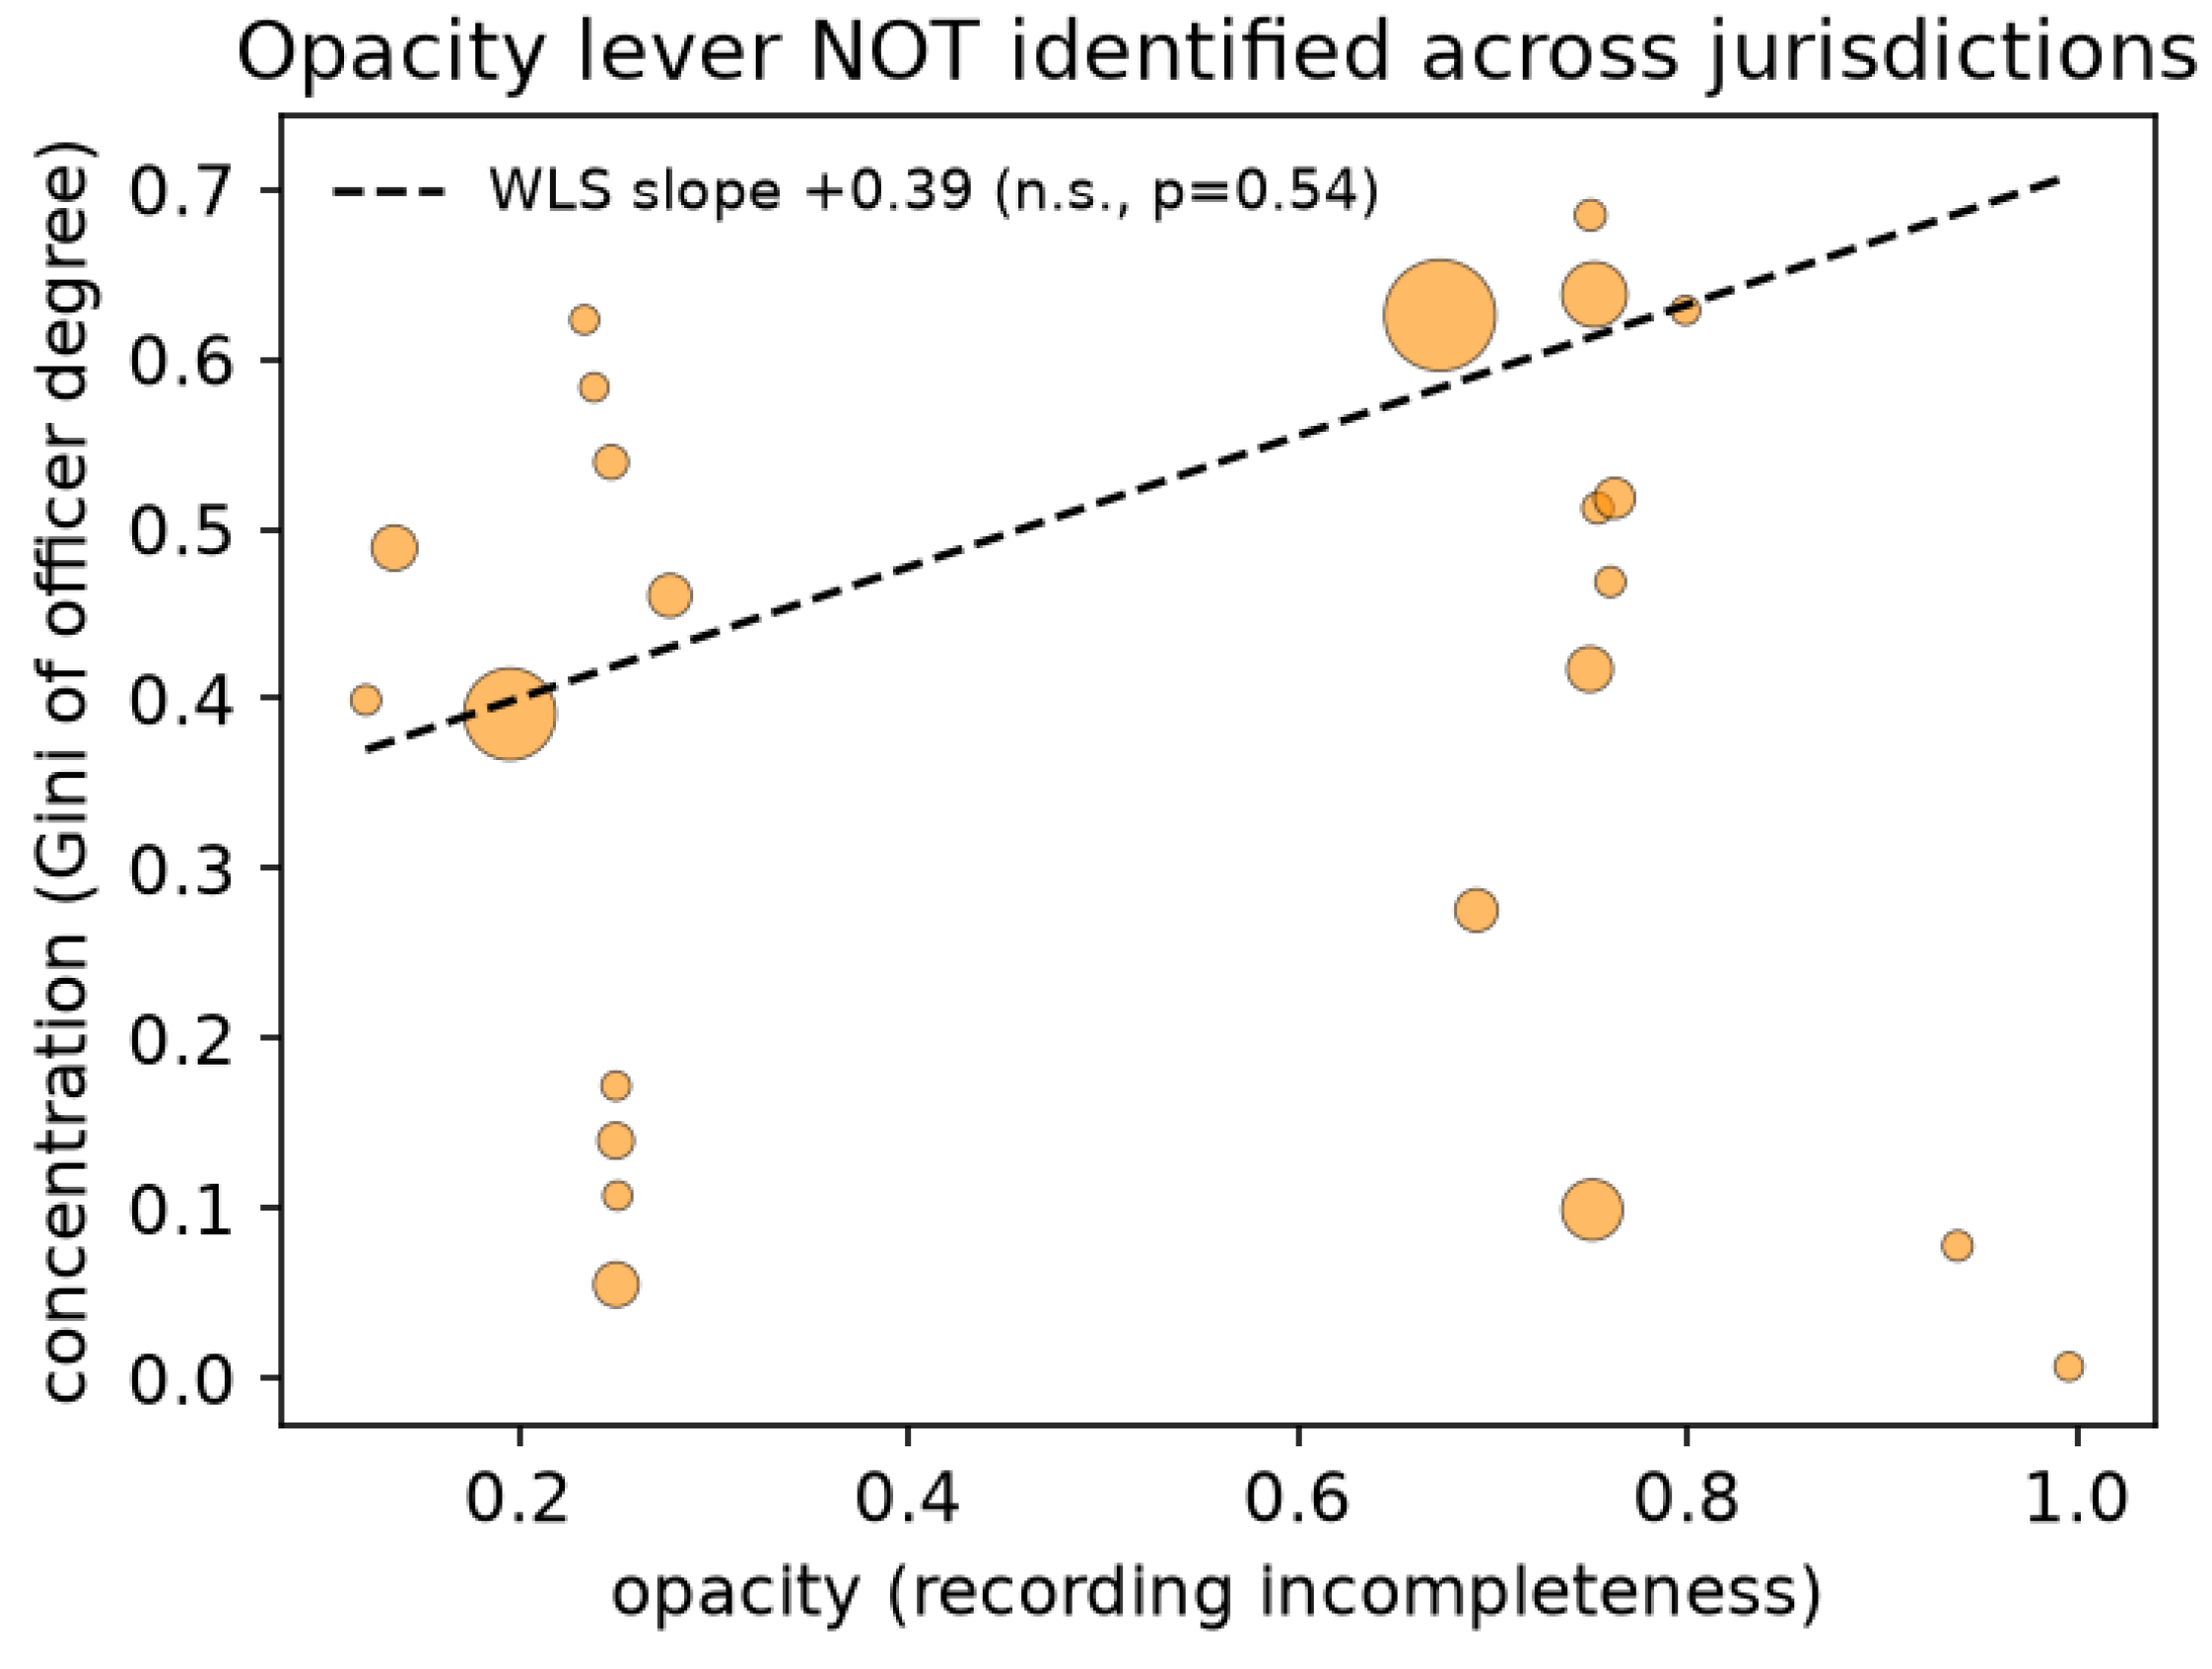
Figure 6.
Pull-request acceptance by author position. Raw rates (pilot, red) on six large, heavily gatekept repositories show a steep boundary cliff; the full study (blue) on the entire one-day stream shows a much shallower cliff (outsider ∼0.64 vs insider 0.85–0.92). Most of the difference between the two curves is sample composition (selective large repositories vs all repositories), not diff-size control; within the full study, size controls trim the gap further to a moderate, robust residual penalty. Holding the same author fixed at fixed PR size, position adds up to to the merge rate (an upper bound); the cleaner promotion design, which also fixes the project, still finds after a badge change with no change in the work.
Figure 6.
Pull-request acceptance by author position. Raw rates (pilot, red) on six large, heavily gatekept repositories show a steep boundary cliff; the full study (blue) on the entire one-day stream shows a much shallower cliff (outsider ∼0.64 vs insider 0.85–0.92). Most of the difference between the two curves is sample composition (selective large repositories vs all repositories), not diff-size control; within the full study, size controls trim the gap further to a moderate, robust residual penalty. Holding the same author fixed at fixed PR size, position adds up to to the merge rate (an upper bound); the cleaner promotion design, which also fixes the project, still finds after a badge change with no change in the work.
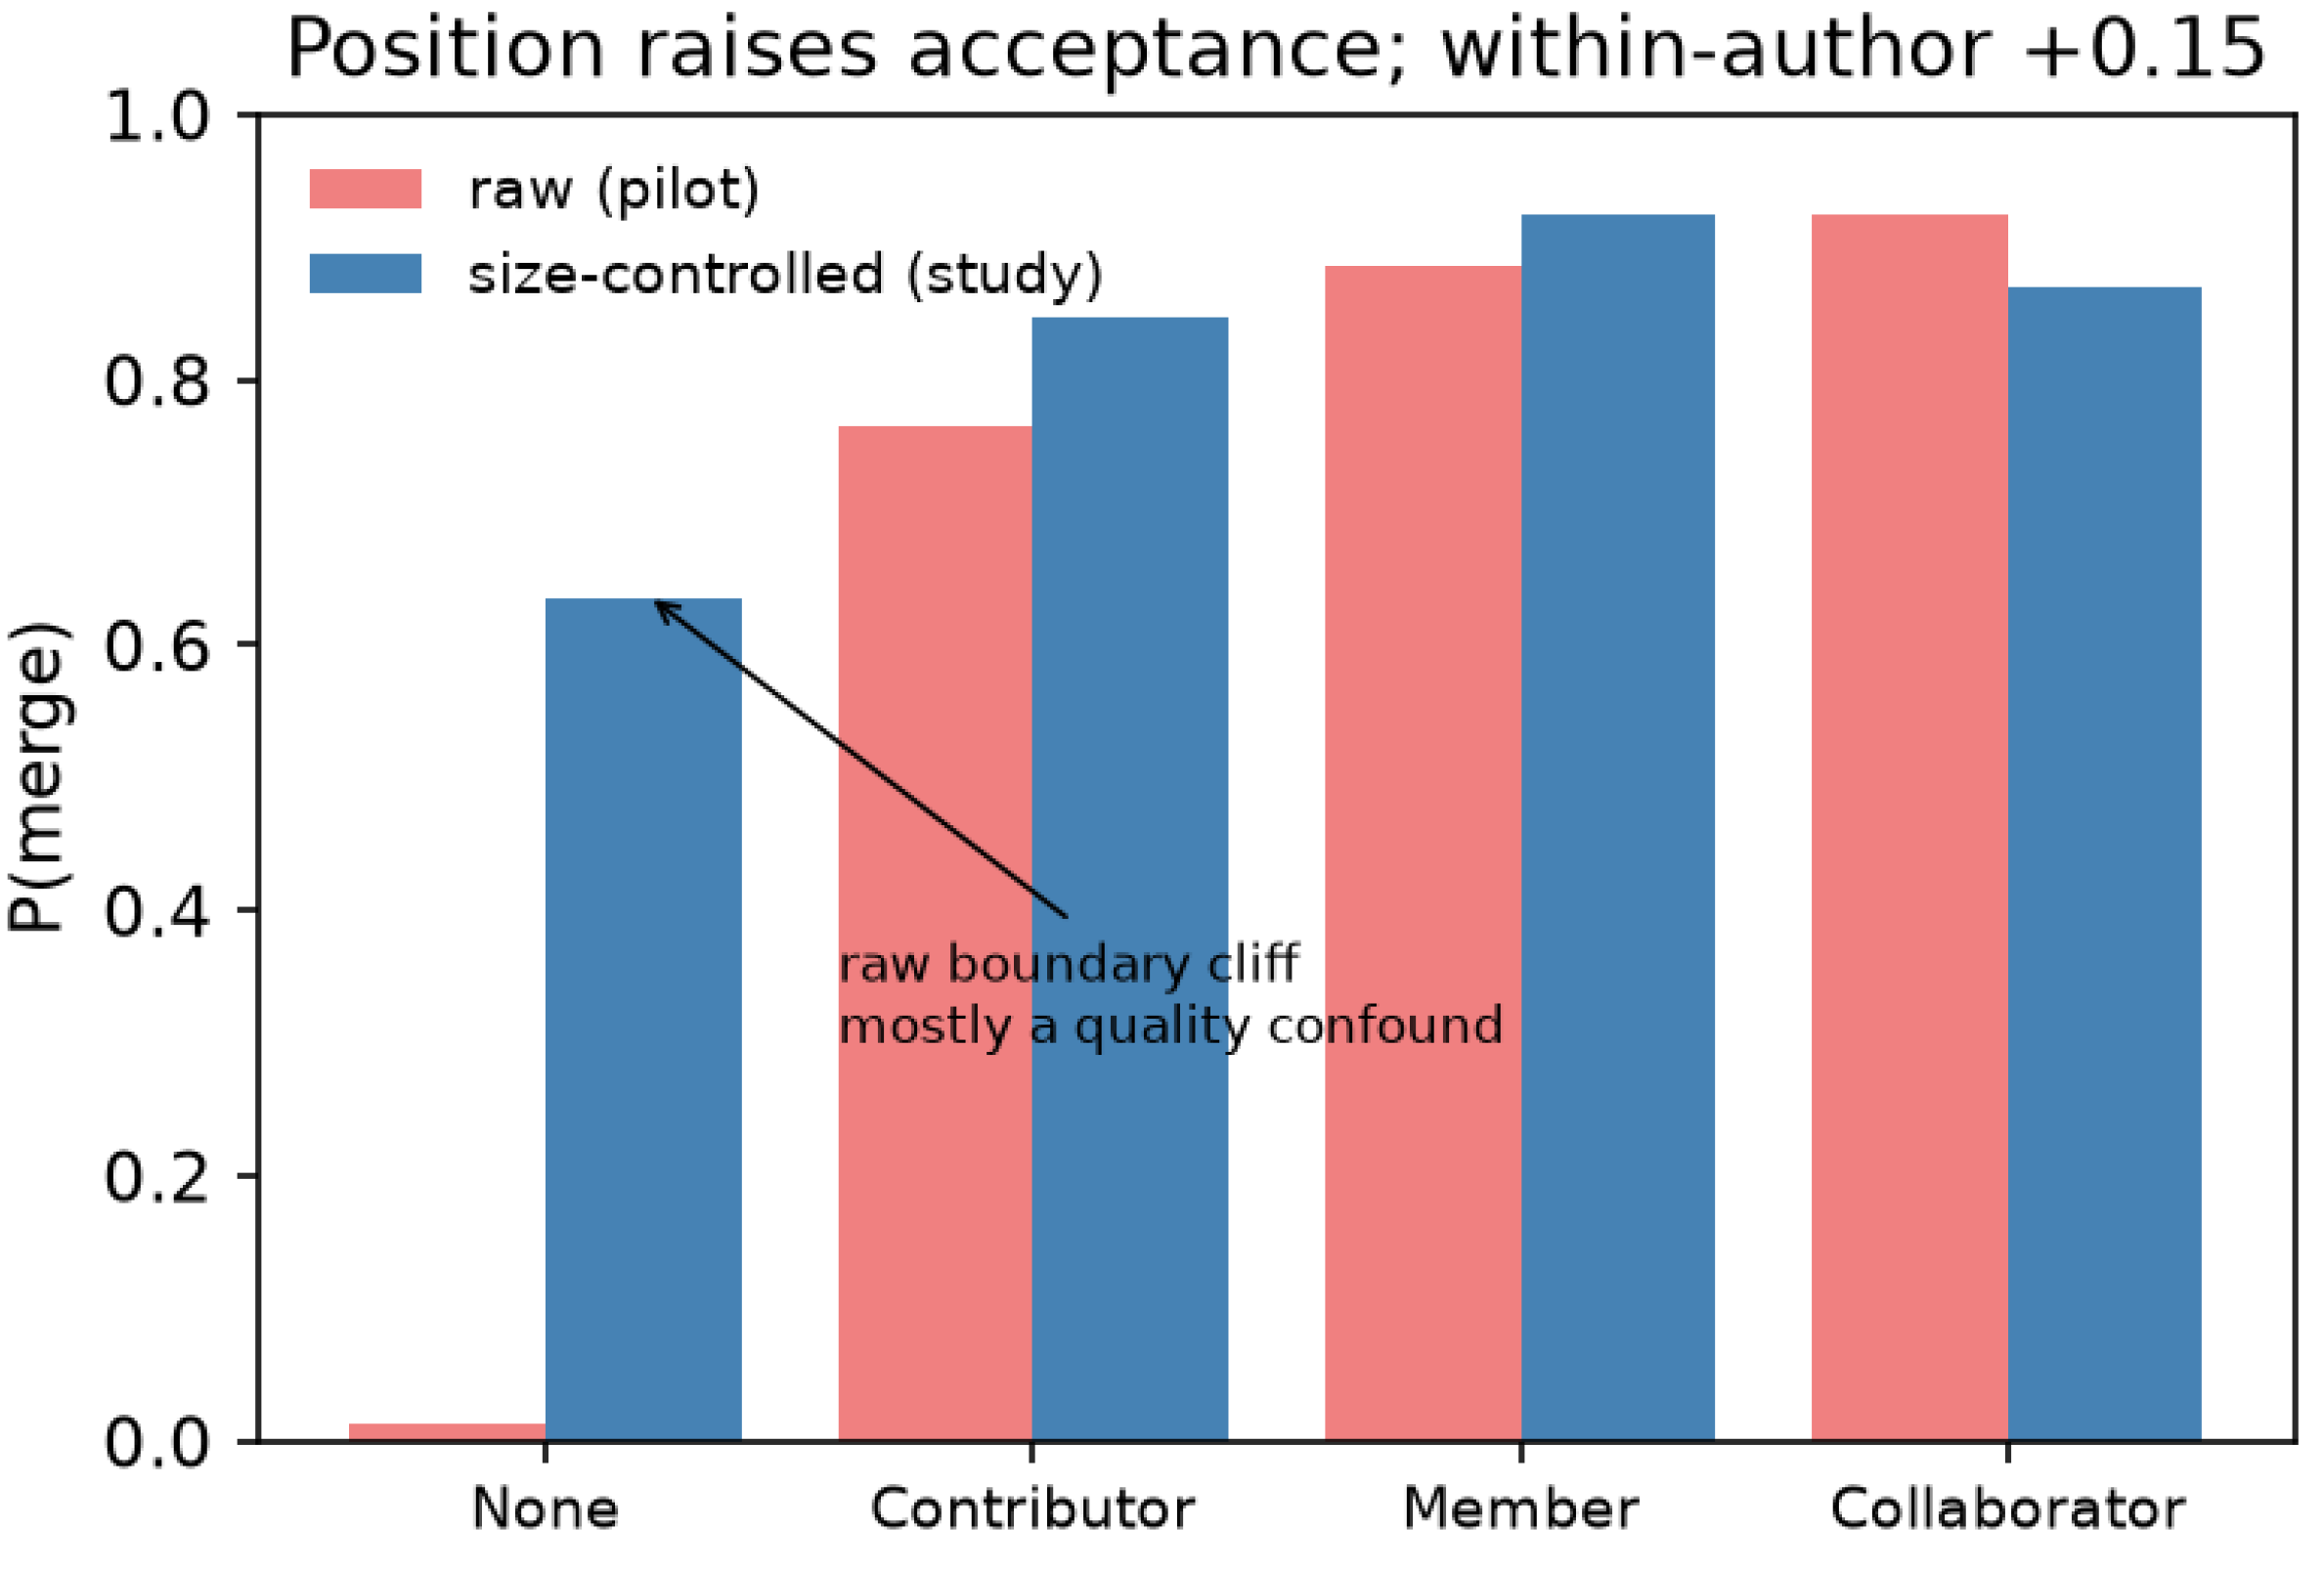

Table 1.
Robustness across the four aggregation levels of [2]. The amplifier reproduces the measured R at every level; scales with between-environment content and vanishes once the environment is held fixed.
Table 1.
Robustness across the four aggregation levels of [2]. The amplifier reproduces the measured R at every level; scales with between-environment content and vanishes once the environment is held fixed.
| level | R (this calc) | R (measured) | ||
|---|---|---|---|---|
| within-tract (US) | 0.052 | 0.0 | ||
| between-country | 1.042 | 4.5 | ||
| within-country-decile | 3.289 | 15.1 | ||
| global pooled | 4.331 | 20.0 |
Table 2.
ICIJ officer-degree tails by opacity layer. The extreme concentration (max degree) is in the opaque provider-leak layer; but, as Figure 5 shows, this is composition, not a continuous opacity gradient.
Table 2.
ICIJ officer-degree tails by opacity layer. The extreme concentration (max degree) is in the opaque provider-leak layer; but, as Figure 5 shows, this is composition, not a continuous opacity gradient.
| layer | officers | max degree | ||
|---|---|---|---|---|
| registry (public, low-opacity) | 273 068 | 2.32 | 149 | 1 634 |
| provider leak (hidden, high-opacity) | 497 231 | 2.24 | 70 | 36 335 |
Disclaimer/Publisher’s Note: The statements, opinions and data contained in all publications are solely those of the individual author(s) and contributor(s) and not of MDPI and/or the editor(s). MDPI and/or the editor(s) disclaim responsibility for any injury to people or property resulting from any ideas, methods, instructions or products referred to in the content. |
© 2026 by the authors. Licensee MDPI, Basel, Switzerland. This article is an open access article distributed under the terms and conditions of the Creative Commons Attribution (CC BY) license (http://creativecommons.org/licenses/by/4.0/).
Copyright: This open access article is published under a Creative Commons CC BY 4.0 license, which permit the free download, distribution, and reuse, provided that the author and preprint are cited in any reuse.


