

Submitted:
06 July 2026
Posted:
07 July 2026
You are already at the latest version
Abstract
Background: Accurate thyroid volume measurement is essential for diagnosing and monitoring thyroid disorders and for determining radioiodine therapy dosage. The ellipsoid method applied to two-dimensional B-mode ultrasound (Bmode-2D-US) is the most prevalent clinical approach, yet it is known to suffer from high observer dependence and limited accuracy. Tracked three-dimensional ultrasound (3D-US) is a promising radiation-free alternative, but direct comparisons across modalities under controlled conditions remain scarce. Methods: A custom-built anthropomorphic multi-modality phantom was constructed containing six anatomically realistic thyroid lobe samples molded from segmented MRI data, with ground truth volumes verified by the suspension method and 3D surface scanning. Volume measurements were performed by six observers of varying experience using Bmode-2D-US, electromagnetically tracked 3D-US (EM-3D-US), inertial-measurement-unit tracked 3D-US (IMU-3D-US), and optically tracked 3D-US (Opt-3D-US), as well as computed tomography (CT) and magnetic resonance imaging (MRI). Inter- and intraobserver variability were assessed using modified Bland-Altman analysis. Results: All three 3D-US methods reduced inter- and intraobserver variability compared to Bmode-2D-US, achieving variability comparable to CT and lower than MRI. Mean accuracy was similar across 3D-US, CT, and MRI. Bmode-2D-US showed strong observer dependence, with operator experience having the most pronounced effect on this method. Among tracked methods, EM-3D-US and Opt-3D-US were least sensitive to operator movement quality, while IMU-3D-US showed somewhat higher sensitivity. Conclusion: Tracked 3D-US is a promising radiation-free alternative to conventional Bmode-2D-US for thyroid volumetry, offering improved reproducibility and accuracy across operators of varying experience.
Keywords:
thyroid volumetry
; tracked 3D ultrasound
; interobserver variability
; reproducibility
; multi-modality phantom
; ellipsoid method
; tissue-mimicking material
1. Introduction
The volume of thyroid lobes and thyroid nodules are both common clinical indicators for thyroid pathologies, relied upon in diagnosis and treatment. Precise volumetry can allow the identification and tracking of volume changes over time, and can be used at several stages in the interventional therapy of thyroid pathologies such as thermal ablation or high-intensity focused ultrasound. Beyond precision for the evaluation of volume changes, achieving absolute accuracy in the volume measurements can be useful to determine the correct dosage in radioactive iodine therapy, since the dosage is directly dependent on the thyroid volume [23]. For these means, the ellipsoid method on ultrasound has become the most prevalent approach. Therein, two-dimensional measurements from B-mode ultrasound (Bmode-2D-US) in two perpendicular planes (axial and sagittal) are used to extrapolate a volume approximation for thyroid lobes or thyroid nodules. It is reported to have both high variation and high dependence on the measuring clinician [4,13].
When determining thyroid nodule growth with the ellipsoid method, only a measured increase of 50% is recommended to be read as significant in clinical decision making [2]. Critically, it has been noted that any measured increase smaller than this threshold cannot reliably be interpreted as actual growth, since differences between follow-ups may result from measurement variability alone [12]. Higher precision and accuracy could improve decision-making, but remain limited by the low quality of standard volume estimation, so the accuracy and reproducibility of these techniques must be improved. Several technologies are promising to fulfil this requirement. While computed tomography (CT) is a highly established technology in medical imaging, radiation exposure and costs make it a bad match for regular usage. Magnetic resonance imaging (MRI) does not require ionizing radiation, but is even more costly and has additional exclusion criteria. Three-dimensional tracked ultrasound imaging (3D-US) shows potential to be a better fit for the volumetry in thyroid imaging.
The goal of the present study is to compare the quality of thyroid lobe volume measurements across several medical imaging technologies.
1.1. State of the Art: Thyroid Volume Measurement
A number of research groups have previously compared the quality of volume measurement methods in particular in comparison to ultrasound.
Lyshchik et al. [4] determined accuracy and intraobserver variability of thyroid volume measurements for both the ellipsoid method in Bmode-2D-US and electromagnetically tracked 3D ultrasound (EM-3D-US). Pre-surgery measurements were conducted three times for each of 47 children with planned thyroidectomy to determine thyroid volume. After surgery, a reference volume was measured by weighing the resected thyroids, assuming a density of . EM-3D-US was found to have superior accuracy and more consistent measurements than Bmode-2D-US.
Freesmeyer et al. [18] compared Bmode-2D-US, EM-3D-US, CT and magnetic resonance imaging (MRI). A thyroid phantom was constructed with the goal of achieving a high accuracy reference volume. The thyroid was imitated with a balloon filled with different volumes of water and contrast medium, submerged in a water bath. The phantom was intentionally deformed into three shape variants using cable ties on the balloon. EM-3D-US, CT and MRI achieved similarly good results, while Bmode-2D-US was less accurate.
Krönke et al. [24] measured the volume of thyroid lobes using 2D and EM-3D-US combined with a convolutional neural network. The interobserver variability between medical doctors using EM-3D-US was lower than when using Bmode-2D-US. The accuracy of both methods was also evaluated by comparing them to MRI manual segmentation as the reference. Results showed that EM-3D-US is more consistent with MRI.
1.2. Limitations of the State of the Art
A common limitation found in the state of the art is the limited number of different volumetry technologies that are compared within the same study. In phantom studies, this can be partially attributed to the added complexity in building multi-modality phantoms. In patient studies, ethical issues prevent performing a high number of medically unnecessary imaging procedures on the same patient. Further reasons include setup complexity, simultaneous availability of technologies, and prolonged completion time for observers.
A direct reference value for the true thyroid volume is not achievable for patient studies unless the thyroid is removed for direct volume measurement. However, such an approach poses some difficulties to get highly accurate results, as complete thyroid resection might not be always achievable and the borders for measurement in-vivo might not exactly match the borders of resection of individual lobes.
To get a high-quality volume reference, phantom building is useful as it also permits direct measurement of the true volume. Nevertheless, care must be taken to realistically represent anatomical shapes. The use of fluid-filled balloons in phantom building, as applied by Freesmeyer et al. [18], allows accurately filling specified reference volumes, but also gives a very smooth surface resembling ellipsoids. This shape likely contributes to biasing results where the ellipsoid method might perform better than should be expected for realistic anatomical thyroid shapes. Despite this possible shape bias, it is notable that the study by Freesmeyer et al. [18] still found Bmode-2D-US to be less accurate than 3D methods.
1.3. Novel Approach
In the comparison of different modalities for measuring thyroid volume, namely Bmode-2D-US, tracked 3D-US with different tracking methods, MRI and CT, the present study aims to (a) provide volume accuracy versus ground truth for all four modalities and all used 3D-US tracking technologies, and (b) report intraobserver and interobserver variability for Bmode-2D-US and 3D-US (all variants).
To address limitations in the state of the art, a multi-modality thyroid phantom with multiple anatomical samples is created for this study. This allows accurate measurement of ground truth volumes and surfaces, maintains a stable volume over time, and avoids unnecessary imaging and radiation exposure of patients.
2. Materials and Methods
2.1. Thyroid Phantom Creation
2.1.1. Molding of the Samples
The shape of the thyroid can directly influence the quality of estimation. Most clearly, in the ellipsoid method, different thyroid shapes with quite different volumes could still produce the same line measurements, erroneously giving the same volume estimate. It is therefore critical to use a realistic thyroid shape in the phantom (Figure 1) for meaningful results.
The thyroid lobe samples in the phantom were each separately molded from three-part 3D printed polylactic acid molds (Figure 2) to preserve the thyroid shape. The shape of the molds was constructed using segmented MRI Data from the open source SegThy dataset [24]. The six samples in the created phantom correspond to the left and right thyroid lobe of individuals 1, 2, and 14 in the SegThy MRI dataset.
2.1.2. Suspension Method & 3D-Scanning
In the present study, two different methods are applied to all sample volumes. One establishes the ground truth volume before insertion into the phantom; the other verifies it rigorously using a different methodology.
The suspension method described by Hughes et al. [6] makes use of digital scales to accurately measure displaced water volume. It is well established for the measurement of volume of anatomical structures [5]. This measurement technique was used as the ground truth for the volume of the samples (Figure 2). Calibrated digital scales (EMS 300-3, KERN & SOHN GmbH, Balingen, Germany) were used. This technique is not ideal for repeat measurements, as the surface is wetted each time.
3D-scanning was used to verify the ground truth volume and was performed before the suspension measurement and insertion into the phantom. Additionally, this method generates an accurate mesh of the samples’ surface. 3D-scanning is performed with an EinScan-SP (SHINING 3D, Hangzhou, China).
To furthermore verify the ground truth volume is indeed stable within the phantom over time, the suspension and 3D-scanning measurements are repeated 31 days after phantom creation. Herein, the samples are carefully retrieved from the phantom.
2.1.3. Phantom Assembly
The container in which the phantom is embedded should ideally cause little artifacts in the required imaging modalities while keeping the phantom stable from deformation and mechanical damage. A standardized euro container ( mm, PP-C) was chosen to house the phantom. The inside was lined with rough black fabric tape to help reduce ultrasound imaging artifacts. To fix samples in the phantom, trachea-shaped pedestals were used as a footing for the samples to increase the familiarity of the ultrasound image and to provide orientation (Figure 2). The shaped pedestals were manufactured of the same agar mixture as the background material (Table 1) by molding in paper cups and subsequent cutting with a 3D-printed profile, creating a surface with a protruding 22 mm diameter half-circle. Fixing the samples with a small amount of cyanoacrylate adhesive was found to be a practical means of stabilization. As shown in Figure 1, the hardened adhesive on the trachea-shaped pedestals imitates the appearance of tracheal cartilage in ultrasound.
2.1.4. Tissue-Mimicking-Material
Phantoms are commonly made using tissue-mimicking-material (TMM). TMM composition is often chosen for a specific modality and imitated tissue type, while compatibility to other modalities is disregarded. Multi-modality phantoms are more complicated as additives can simultaneously change the imaging properties in different imaging modalities.
Various synthetic materials can be used for multi-modality phantoms [3]. Despite its perishability, agar gel is also a common choice. To prepare a basic agar phantom, agar powder is mixed in heated water and cooled down to form a set agar gel. Specific additives can adjust TMM properties such as scattering, density and relaxation times for Ultrasound, CT, and MRI respectively.
King et al. [8] constructed an agar phantom with a TMM composition that is standardized by the International Electrotechnical Commission for ultrasound phantoms [21] and applied it across US, MRI and CT. The additives are glycerol, silicon carbide, aluminium oxide and benzalkonium chloride.
While using ex-vivo anatomy within phantoms can be a good choice in certain circumstances [5], this approach was not chosen here. Initially, a preliminary phantom was created to investigate the option of using the approach of embedded ex-vivo anatomy, using thyroid-shaped turkey breast pieces. It was observed in ultrasound, CT, and MRI. Critically, the volume of the samples was observed to change considerably over time within the agar. Pouring warm agar onto the samples also was suspected to already cause volume changes. This approach was therefore deemed unsuitable for this study.
A research group investigated the influence of different concentrations of agar and -powder for MRI and Ultrasound, showing that agar concentration influences T1 and T2 relaxation times in MRI [16] as well as attenuation in Ultrasound [26]. Using 6% w/v agar for the background and 6% w/v agar with 4% w/v for a tumor model, Ultrasound, CT and MRI showed good contrast and imaging properties close to soft tissues [25]. From the same research group, a molded thyroid phantom for MRI-guided ablation [20] likewise used 6% w/v agar for the background, 6% w/v agar with 4% w/v for the thyroid and a hollow ABS tube as trachea. The simplicity of approach of the research group to use a relatively small number of ingredients seems favourable.
Huber et al. [17] investigated an agar mixture in ultrasound, CT and MRI. To adjust appearance in ultrasound and MRI, 1.17% w/v agar used for background and 3.64% w/v agar for the sample. 0.8% w/v NaCl was used for realistic coil loading in MRI. The chosen composition of the TMM for the phantom in the present study is shown in Table 1. Agar was used both for background and thyroid. Based on initial experiments with different agar concentrations, using 3% w/v agar in background and 6% w/v agar in thyroid samples was promising.
For the thyroid phantom in this study powder was used in the samples. It is chosen to adjust the optical properties of agar, normally translucent, to be matte-white opaque at a relatively low concentration, which enabled accurate 3D-scanning of the sample surface. The appearance of agar in ultrasound not only depends on concentration but is severely affected by the temperature during preparation. Keeping the agar mixture at a temperature below 70 °C during preparation results in increased scattering [17].
By carefully adjusting the concentration of agar, NaCl and gadolinium contrast agent, phantom composition can be adjusted to closely mimic properties of specific tissues in MRI [10]. No recommendation was given for thyroid tissue. Gadoteridol was used in the phantom to enhance T1 contrast. The gadoteridol concentration in the current phantom was approximated from the T1 relaxation time of thyroid tissue [15] and its relation to concentration [9,11].
2.2. Data Acquisition
2.2.1. B-Mode 2D Ultrasound
In 2D Ultrasound, the ellipsoid method can be used to estimate volumes. In clinical volume estimation of the human thyroid lobes, it is the predominantly applied method. In its usage, the imaging plane of the ultrasound probe is aligned in the transversal plane to measure maximum width and depth of the thyroid lobe. For the third measurement, the probe is then rotated 90° to measure maximum length of the lobe (cranial to caudal). The volume estimate is then given by , where the ideal factor f is reported in literature to be 0.479 [27] or 0.529 [14]. In clinical practice the factor 0.5 is commonly used for simplicity. This method is convenient in its application, however its use in thyroid lobe volumetry reportedly leads to high inaccuracy [4,18,24]. In the present study, the ultrasound system Mindray M9 (Mindray, Shenzhen, China) is used with the linear ultrasound transducer L12-4S (3–13 MHz). The image settings (D 6.0; G 36; FR 47; DR 125; GrayMap 2; ExFOV 2) of the system were fixed for all observers and technologies in order to mimic the contrast and grey value of a human thyroid in the ultrasound image. With the used frame rate of 47 fps and an approximate normal free-hand scanning speed of 16 mm/s (estimate from prior clinician scan data) of the ultrasound probe, 2.9 frames are available for every 1 mm. The extended field of view setting (ExFOV) was chosen to increase the width of the image. It causes a curved lower border of US-image.
2.2.2. EM-Tracking
For electromagnetic tracking of the ultrasound probe a field generator (Figure 4) is aligned towards the working area. Two six-degrees-of-freedom sensors are fixed relatively to the ultrasound probe to track changes in the field (Figure 3). Each sensor has its own cable that leads into an interface unit. The 3D Guidance trakSTAR (Northern Digital, Waterloo, Ontario, Canada) is used for EM-tracking.
2.2.3. Inertial Tracking
Tracking without an external setup is an advantage of inertial tracking compared to EM and optical tracking. The PIUR G3 sensor (PIUR Imaging, Vienna, Austria) is one example of an inertial tracking system. The technology uses a wireless sensor, that is fixed to the ultrasound probe (Figure 3), and a frame-grabber, that captures the US-image over HDMI port. Gyroscopic data is recorded. For the PIUR G3 sensor, tracking is a combination of gyroscopic data and x-y movement from optical flow data. The optical flow sensor measures the relative movement of the ultrasound probe over the patient’s skin.
2.2.4. Optical Tracking
In ultrasound with optical tracking a camera setup is used to track movements of the ultrasound probe by tracking an attached optical target (Figure 3). Advantageously, no cable connection is required for the add-on. Line-of-sight between the camera and the optical target fixed to the ultrasound probe must be maintained. In the present study, the Polaris Vicra Position Sensor (Northern Digital, Waterloo, Ontario, Canada) is used for optical tracking.
2.2.5. Computed Tomography
The phantom was scanned with CT using the neck protocol on NAEOTOM Alpha (Siemens Healthineers, Forchheim, Germany) with 1.5 mm slice thickness and a soft-tissue convolution kernel (Br40). Segmentation was performed in 3D Slicer [1] using a threshold value. Subsequently, median smoothing was applied with a 2 mm kernel size to fill small holes in the segmentation.
2.2.6. Magnetic Resonance Imaging
MRI imaging of the phantom was performed with MAGNETOM Aera (Siemens Healthineers, Erlangen, Germany) at 1.5 T with 1.2 mm slice thickness. The chosen MRI sequence was a volumetric interpolated breath-hold examination sequence.
2.2.7. Acquisition Procedure
The measurement setup for the four ultrasound-based methods is shown in Figure 4. Six observers acquired scans for each of the six samples using Bmode-2D-US and all the three tracked 3D-US technologies. None of the observers had previous experience with the tracked ultrasound methods. Each received a short 1–2 minute training of the usage of the different technologies. Four of the observers were radiologists and two observers were nuclear medicine physicians. The nuclear medicine physicians had experience with thyroid ultrasound (Thyroid ultrasound experts; TE1 and TE2) while the radiologists had general ultrasound experience (ultrasound users; UU1, UU2, UU3 and UU4). Two observers (TE2, UU2) repeated the entire measurement set a second time. For the ultrasound-based methods, the ordering of technologies was randomized.
Figure 4.
Experimental Setup for tracked Ultrasound methods. (a) EM field generator (EM) and Camera for optical tracking (Opt); (b) ultrasound-gel-soaked fabric wipe as a structured phantom.
Figure 4.
Experimental Setup for tracked Ultrasound methods. (a) EM field generator (EM) and Camera for optical tracking (Opt); (b) ultrasound-gel-soaked fabric wipe as a structured phantom.
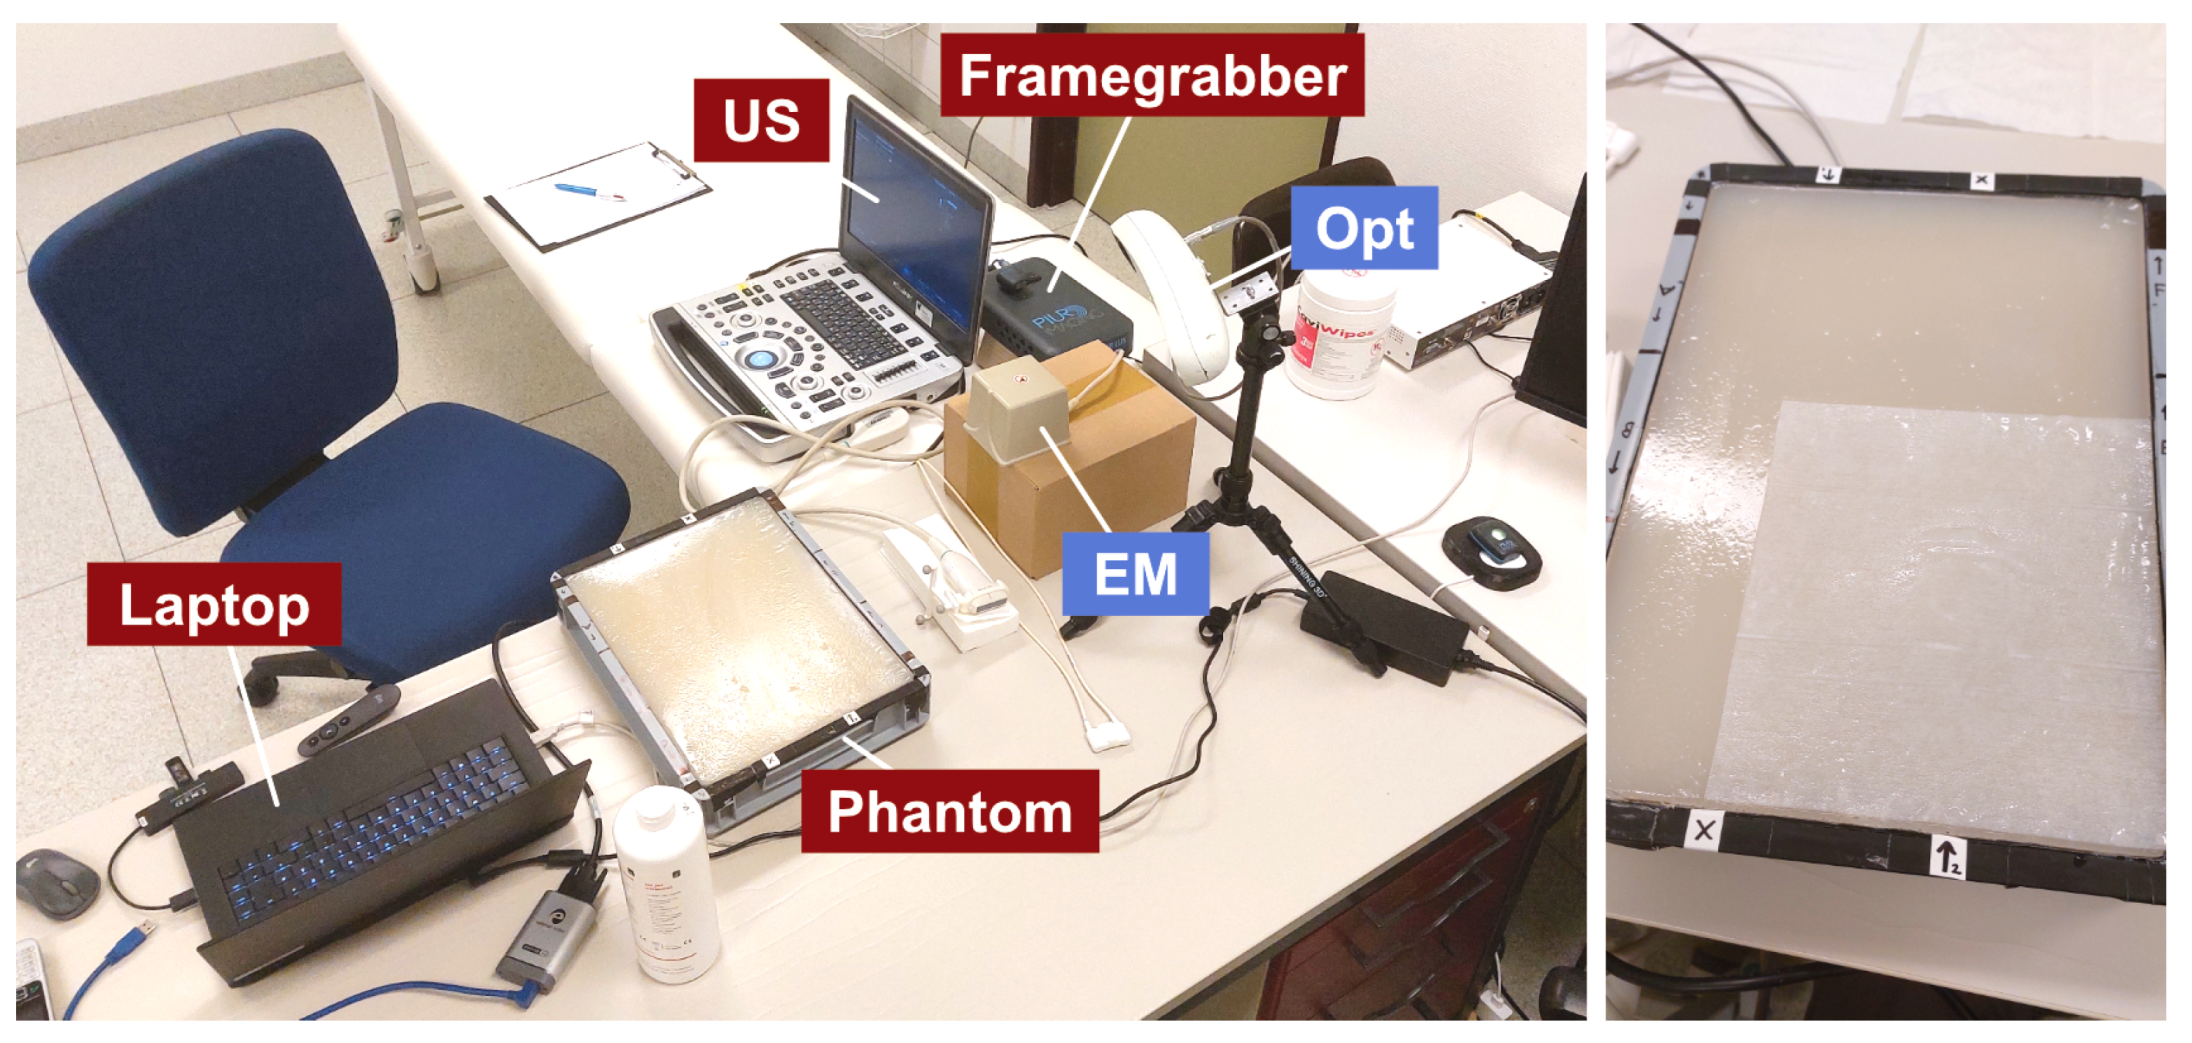
For CT and MRI, only one scan was acquired for the entire phantom. CT was performed the first day after the phantom creation. The data for the ultrasound-based methods was acquired on the second and third day. MRI was performed on day 11 due to logistic issues, while the repeated ground truth measurement was performed 31 days after the phantom creation.
2.3. Segmentation
The acquired imaging data must be segmented to determine volume. The software application PIUR tUS 3.2.1 (PIUR Imaging, Vienna, Austria) was used for semi-automatic segmentation of the scans from the EM-3D-US and IMU-3D-US technologies (Figure 5a). The software application 3D Slicer (https://www.slicer.org) was used to manually segment Opt-3D-US, CT and MRI acquisitions assisted by initial thresholding.
2.4. Statistical Methods
For statistical analysis modified Bland-Altman plots [22] are used, where the x-axis is the ground truth instead of the mean, as is recommended when available [28]. This rests on the assumption that the ground truth estimates the true sample volume far more accurately than an average that incorporates less precise data, which could obscure interpretation. The differences must be reported both in absolute () volume differences and in standardized (%) volume differences, because it is possible that for some of the measurement methods the measurement error correlates with the true volume value [7].
The following formulas are used for calculation.
- Difference to ground truth:
- Intraobserver variability:
- Interobserver variability:
The 95%-limits of Agreement of for multiple observers i with multiple measured samples j is calculated using the estimate for standard deviation (SD) [19]
where the ground truth volume replaces its approximation from the sample-specific average.
This assumes the chosen observers are representative of randomly chosen observers at the same experience level and can be summarized by a single distribution with a shared mean and standard deviation—the same assumption underlying the generalization of interobserver variability. For all observers, only their first measurement set was included in this estimate, so the number of measurements is the same for all observers to avoid bias towards one observer. To also present a statistic with weaker assumptions, the range between minimum and maximum measured values of the expert measurements are presented together with the limits of agreement.
3. Results
The ground truth volume for the six samples (A-F) was evaluated using the suspension method, giving the following results.

Table 2.
Ground truth volume values for used samples.
| A | B | C | D | E | F |
|---|---|---|---|---|---|
Figure 6, Figure A1,Figure A2 and Figure A3 show the different phantoms used in this study as points across the x-axis, where ground truth volume is measured. Data point shape represents the group affiliation (UU or TE), and colour represents different observers in the given plot. For Figure 6,Figure A2 and Figure A3 means and 95% limits of agreement (±1.96 SD) are given for the ground truth volume and observer groups used in the plot.
Difference Plot
Figure 6 shows the absolute difference and standardized difference between the observers first set of measurements and the respective ground truth values of the samples. Values for means and 95% limits of agreement (±1.96 SD) are given in the boxes inside the plots. Measurements acquired for all modalities, including the 3D-scan, are used in the comparison. The results show a clear difference for the different modalities. Bmode-2D-US showed the highest variation across observers, with a trend towards overestimation for the UU group, and underestimation for the TE group. For both EM-3D-US and Opt-3D-US there was a slight overestimation for both groups. For Bmode-2D-US the absolute volume difference mean was closest to ground truth for the TE group (- with SD resulting in - and ), but furthest for the UU group ( with SD resulting in - and ). IMU-3D-US was the modality where the UU group was closest to ground truth in the mean (- with SD resulting in - and ). Both CT and MRI showed high agreement with the ground truth (mean of - and ), with MRI displaying a slightly higher deviation. Ground truth measurement after 31 days shows strong agreement to the original measured volume with a mean difference of - and little deviation.
X-Y plot
Figure A1 in the appendix shows measurements from the segmentations of the modalities used here plotted against the ground truth volume. The x-axis represents the ground truth value of samples, while the y-axis shows the measured volumes using the respective measurement technologies. While from the X-Y plot one can observe how measured values relate to certain ranges of likely true values, the difference plot (Figure 6) allows the best overview of the results over all the given plots.
Intraobserver plot
Figure A2 in the appendix shows the absolute difference and standardized difference of measurements taken by observers (TE2, UU2) to their own respective repeat measurement. Two repeated measurements for each ultrasound-based modality were compared for each phantom. For the expert observer the modality with the mean value closest to ground truth was found to be Opt-3D-US and EM-3D-US displayed the smallest standard deviation over all the measurements. For the observer from the UU group, EM-3D-US was the modality with the closest mean to ground truth, and Opt-3D-US displayed the smallest standard deviation range. Repeat measurement differences were mostly within a range of ± 30%, with some outliers extending to nearly +80% for the UU group. Overall EM-3D-US and Opt-3D-US showed the closest match between repeated scans, while the other modalities varied depending on user group and the phantom used.
Interobserver plot
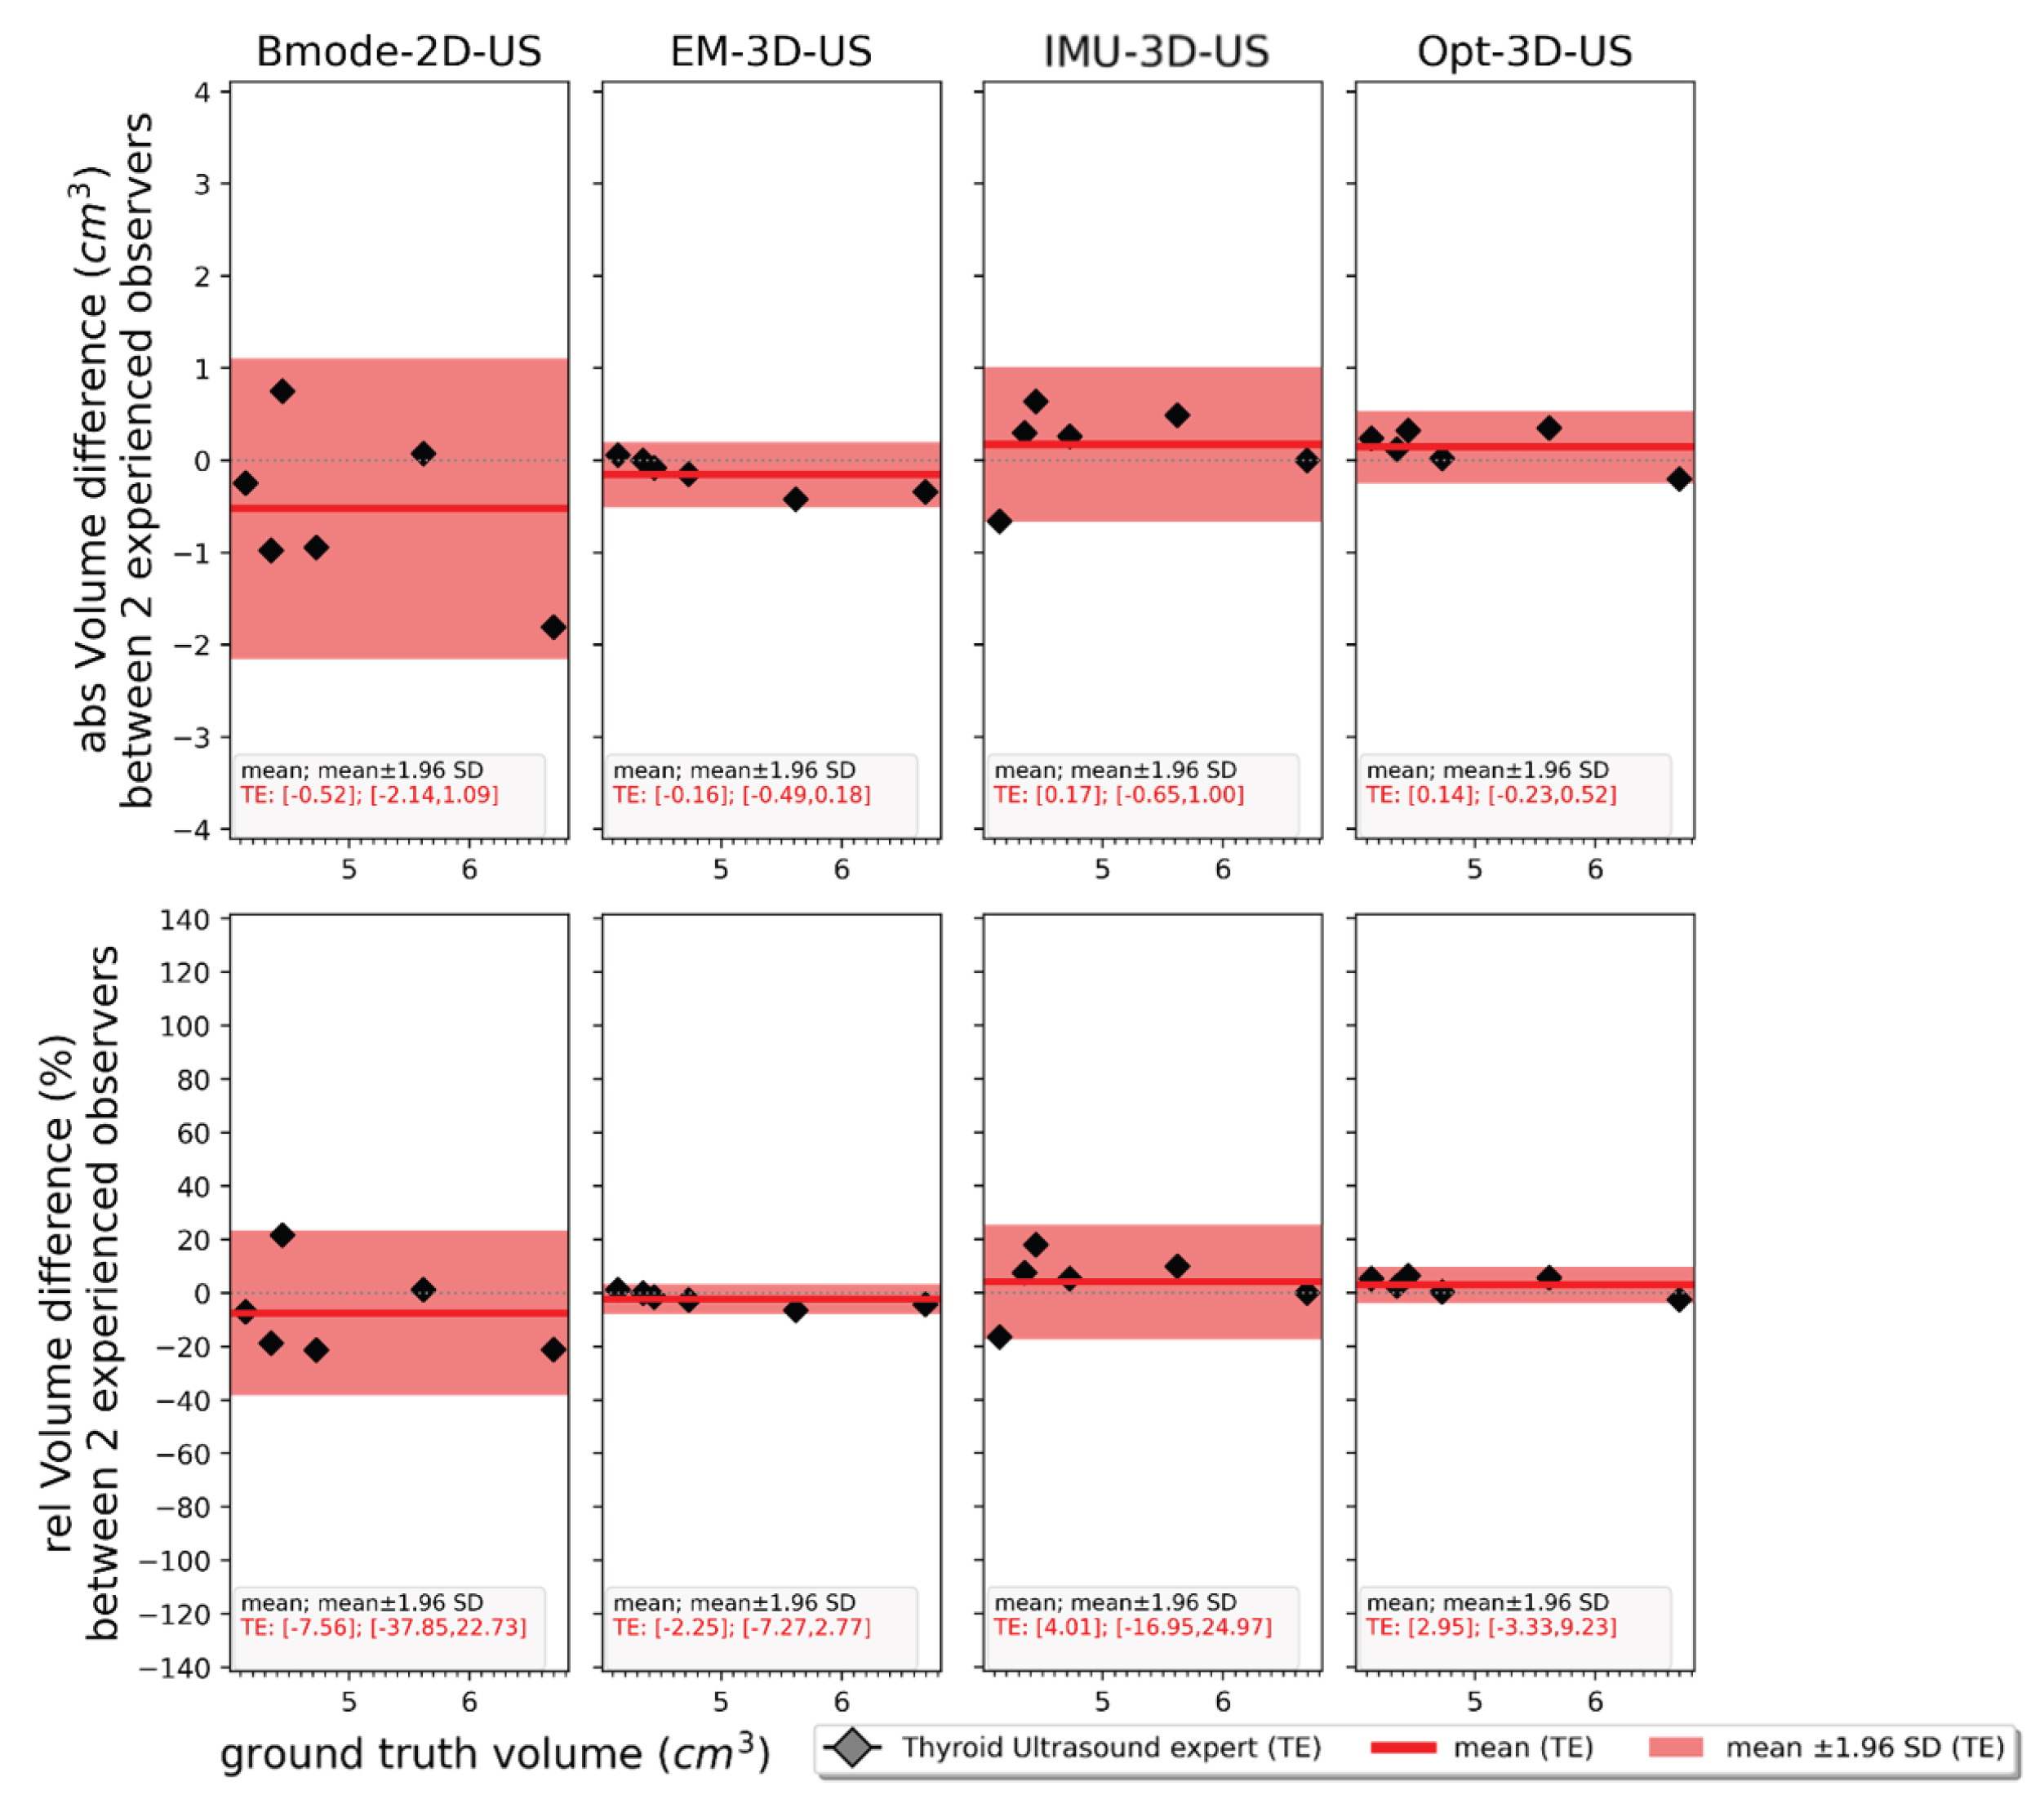
Figure A3 in the appendix shows the absolute difference and standardized difference of measurements between the first set of measurements of the two expert observers (TE1, TE2). Opt-3D-US showed the closest measurements for the mean value, with EM-3D-US and IMU-3D-US being very close. Bmode-2D-US showed clear differences between user measurements, leading to higher interobserver variability than the 3D-based variants.
4. Discussion
4.1. Quality of Ground Truth
The volume data from the 3D scan of the samples was shown to be consistent with the ground truth (suspension method), giving a difference close to zero (mean , SD ). Therefore, the ground truth was accurate at the beginning. The CT measurement showed that the ground truth is likely also accurate during the time the samples were embedded within the phantom (mean -, SD ). The repeat measurement of the ground truth 31 days after the phantom creation showed that the ground truth was very consistent over time (mean -, SD ).
4.2. Influence of Experience Level in Ultrasound
Although the ellipsoid method for volume estimation in 2D ultrasound (Bmode-2D-US) is the most commonly used method in the clinical setting, the differences between measurements and the ground truth observed in this study were quite high, leading to a wide spread of results and inconsistent repeated measurements from the same observer (Figure A2). The difference of the accuracy between experience levels TE and UU (Figure 6) is the most pronounced in the ellipsoid method (Bmode-2D-US), as the UU placed measurements based on the longest diameters as is done in the general case of the ellipsoid method, while the TE placed measurements in higher alignment with the body planes to estimate thyroid volumes and neglected the thyroid isthmus. Hereby, the UU had a consistent bias to severe overestimation of volumes in the ellipsoid method, while the TE had a small underestimation bias. Looking at the overall influence of experience level in the tracked ultrasound methods, the TE also consistently had smaller limits of agreement in than the UU. This most likely reflects the more controlled free-hand movements (steadiness and speed) of the TE. Consequently, the extent of the influence of experience level could be indicative for the robustness of the tracking method to free-hand movements. From the results, it is reasonable to assume that Opt-3D-US and EM-3D-US are the least sensitive to user movement quality. IMU-3D-US is more sensitive in comparison. Good training could therefore be beneficial to improve results.
Intraobserver variability was lower for the 3D-tracked methods than for Bmode-2D-US. EM-3D-US and Opt-3D-US showed the tightest limits of agreement, while IMU-3D-US showed slightly higher variability but remained more consistent than the ellipsoid method. This suggests that 3D-tracked methods yield repeatable results once observers are familiar with the acquisition technique.
Due to their busy clinical schedule both repeated observers were in more haste than for their first set of measurements and recorded faster scans. While the speed was measurably higher, their mean in the intraobserver plot seems little affected. It therefore seems likely that the methods have low dependence on scan speed.
Bmode-2D-US showed the highest interobserver variability, reflecting the subjective nature of plane and endpoint selection in the ellipsoid method. The 3D-tracked methods demonstrated substantially lower interobserver variability, with Opt-3D-US showing the smallest mean difference and EM-3D-US and IMU-3D-US performing similarly. This indicates that segmentation-based 3D approaches provide more reproducible volume estimates across observers.
4.3. Comparison with Literature
Table 3.
Standard deviation of in %, comparison between present study and literature
| Bmode-2D-US | EM-3D-US | CT | MRI | |
|---|---|---|---|---|
| Present study (TE1, TE2) | 15.4 | 3.3 | 4.2 | 8.5 |
| Lyshchik et al. (2004) | 15.3 | 5.2 | - | - |
| Freesmeyer et al. (2014) | 6.5–9.2 | 3.2–5.2 | 3.5–4.3 | 2.1–3.0 |
4.4. Discussion of Sample-Specific Bias
Notably, a sample-specific bias appears in the difference plot (Figure 6) for EM-3D-US, IMU-3D-US, Opt-3D-US, and MRI. It can be most clearly seen when looking at the shape of the grey Min-to-Max range (Figure A1 for the measurements of the experts). It does not seem to correlate with the ground truth volume. Furthermore, it is considered unlikely to be an effect of incorrect ground truth, where the real volume has changed after phantom creation and samples are affected to different extents based on their shape. Counterarguments would be the consistent repeat measurement of the ground truth after 31 days and the CT volume measurement. A possible reason might also be that tracked ultrasound tracking errors are anisotropic and over-/underestimate differently on the specific shape and length in scan direction of the samples. However, looking at data comparing relative length in scan direction, volume and surface area appears to allow no trivial relation that captures the observed sample-specific bias. In that case, the MRI measurement is unlucky in that it reproduces a similar bias by accident. Another possible source for sample-specific bias might be the effect of the specific shape on volume loss during smoothing operations of the segmentation. Performing different levels of smoothing on the 3D-scan of the samples, the observed sample-specific bias appears to be unrelated.
4.5. Limitations
In the current evaluation of the results, a semi-automatic approach was chosen for the segmentation of recorded data. The more laborious manual planimetry approach might add accuracy but might be too time-consuming for some clinical scenarios. A fully manual segmentation approach might allow better investigation of the theoretical limits for the shown methods.
Due to the use of a phantom, different measurement methods experienced uneven difficulty based on how strongly they rely on the phantom’s realism. The tested inertial tracking system (IMU-3D-US) relies on the realism of the phantom on a tracking level, while EM-3D-US and Opt-3D-US do not. The IMU-3D-US system uses tracking from relative movements of the patient’s skin. Here, the realism of the tracking result depends on the similarity of the phantom skin (Figure 4) to real patient skin. Specifically, potential differences of the optical properties (texture, reflectance, etc.) of the phantom skin and actual human skin are limitations to this study. The generalizability of the study result is furthermore limited by the small number of measurements and the limited number of observers. Since scan sessions for the ultrasound-based measurements were spread over only one day, any variability over time is not captured. Scan behaviour of observers might, for example, be more similar when repeated on the same day than when repeated a longer time. The flat phantom geometry somewhat limits the realism that is achieved in the scanning trajectories, as they were limited to movements over a flat surface, while a more realistic 3D neck geometry might add further variability.
The MRI acquisition was only possible 11 days after phantom creation due to an unexpected failure of our hospital’s scanner. Part of the error of the MRI volume may be caused by the resulting change on the phantom.
Additionally, different imaging modalities experienced different reliance on phantom realism grounded on different contrast between thyroid sample and back-ground material. This is expected to unevenly affect the realism of volume segmentation, potentially giving biases linked to the surface area of samples. Also, the extent of regions that are erroneously included in the thyroid volume due to similar contrast is likely picked up at different extents.
4.6. Future Work
With the 3D-scanning method of samples the relation of measurement error with directionality or position on the sample could be closely investigated between methods. Herein, co-registration and the comparison with the 3D-scanned mesh, could be performed for segmented data using the software CloudCompare (i.e., directional distance comparisons and distance comparison in direction of surface normals). Identifying the causes of error and their relative proportions will be key to improving these methods. A Pareto chart would likely be useful in the reporting of the magnitudes of individual causes of error.
After initial experiments, it was decided to not include thyroid nodules in the current version of the phantom to not risk obscuring results of the main study. In an expanded study, molded thyroid nodules of several compositions could be embedded into the thyroid samples during creation, which would allow prior determination of ground truth for the nodules and clear nodule borders. To create nodules with unclear margins, a specific volume of unset agar could be injected during thyroid molding process.
In future work, repeat segmentation with several software operators could show how the results depend on the segmentation process between operators. It is expected, some parts of the segmentation error might average out over different operators, while to a certain extent, segmentation errors will be consistent throughout different segmentation software operators and show systematic biases related to the surface area of samples, as well as revealing other sample-dependent biases.
A similar or reproduction study would benefit from an increased number of observers with more repeat measurements over a longer period. This would increase statistical power for meaningful investigation of significant differences. The good stability of the phantoms ground truth in a 31-day timeframe that was observed in the present study, enables future studies to prolong the measurement window beyond the more careful approach that was applied here. To overcome the limitations from the use of a phantom, a human subject study, using all the presented ultrasound-based methods, would be helpful.
5. Conclusions
This study compared thyroid lobe volumetry across six acquisition protocols using an anthropomorphic multi-modality phantom with anatomically realistic samples and a rigorously verified ground truth. Tracked 3D-US reduced both inter- and intraobserver variability relative to the conventional ellipsoid method in Bmode-2D-US, achieving variability comparable to CT and lower than MRI, while mean accuracy was similar across 3D-US, CT, and MRI. Bmode-2D-US remained strongly observer-dependent, with the influence of operator experience most pronounced for this method. Among the tracked methods, EM-3D-US and Opt-3D-US were the least sensitive to operator movement quality, whereas the inertial IMU-3D-US system showed somewhat higher sensitivity, indicating that adequate training is beneficial. These findings suggest that tracked 3D-US is a promising, radiation-free alternative for accurate and reproducible thyroid volumetry in routine practice, where the limited reliability of the ellipsoid method currently constrains clinical decision-making. Confirmation in a human subject study with a larger number of observers and repeated measurements over a longer period remains an important next step.
Author Contributions
Conceptualization, methodology, R.R., R.B. and T.W.; validation, Z.R., M.S., J.L., M.H., J.E., Ch.L. and L.-M. F.; resources, C.L., T.K. and T.W.; writing—original draft preparation, R.R.; writing—review and editing, R.R., Z.R., T.W.; visualization, R.R.; data acquisition, M.S., J.L., M.H., J.E., Ch.L., L.-M. F. All authors have read and agreed to the published version of the manuscript.
Funding
This research was partially funded by the Bavarian State Ministry of Economics, Regional Development and Energy (StMWi) grant number LSM-2403-0017.
Institutional Review Board Statement
Not applicable.
Informed Consent Statement
Not applicable.
Data Availability Statement
The raw data require proprietary software for processing and are therefore available on request from the corresponding authors, who will provide access to both the data and the necessary tooling.
Conflicts of Interest
Robert Roth and Robert Bauer are currently employees at PIUR Imaging. At the time of the study, Robert Roth was a student at the Technical University of Munich. The project was assisted technologically by PIUR Imaging by providing devices and software to the University Hospital Augsburg during the data acquisition and analysis.
Abbreviations
The following abbreviations are used in this manuscript:
| abs | Absolute |
| Bmode-2D-US | B-mode two-dimensional ultrasound |
| CT | Computed tomography |
| EM | Electromagnetic |
| EM-3D-US | Electromagnetically tracked three-dimensional ultrasound |
| ExFOV | Extended field of view |
| GT | Ground truth |
| IMU-3D-US | Inertial-measurement-unit tracked three-dimensional ultrasound |
| MRI | Magnetic resonance imaging |
| Opt-3D-US | Optically tracked three-dimensional ultrasound |
| rel | Relative |
| SD | Standard deviation |
| TE | Thyroid ultrasound expert |
| TMM | Tissue-mimicking material |
| 3D-US | Three-dimensional ultrasound |
| US | Ultrasound |
| UU | Ultrasound user |
Appendix A. [
Appendix]Additional Comparisons of Measurement Results
Figure A1.
Measurements on the y axis plotted against the respective ground truth volume on the x axis. The first scan is shown when repeated measurements were taken. Marker colour denotes observer. Different markers are used depending on their experience level. The dotted line y=x shows theoretical ideal.
Figure A1.
Measurements on the y axis plotted against the respective ground truth volume on the x axis. The first scan is shown when repeated measurements were taken. Marker colour denotes observer. Different markers are used depending on their experience level. The dotted line y=x shows theoretical ideal.
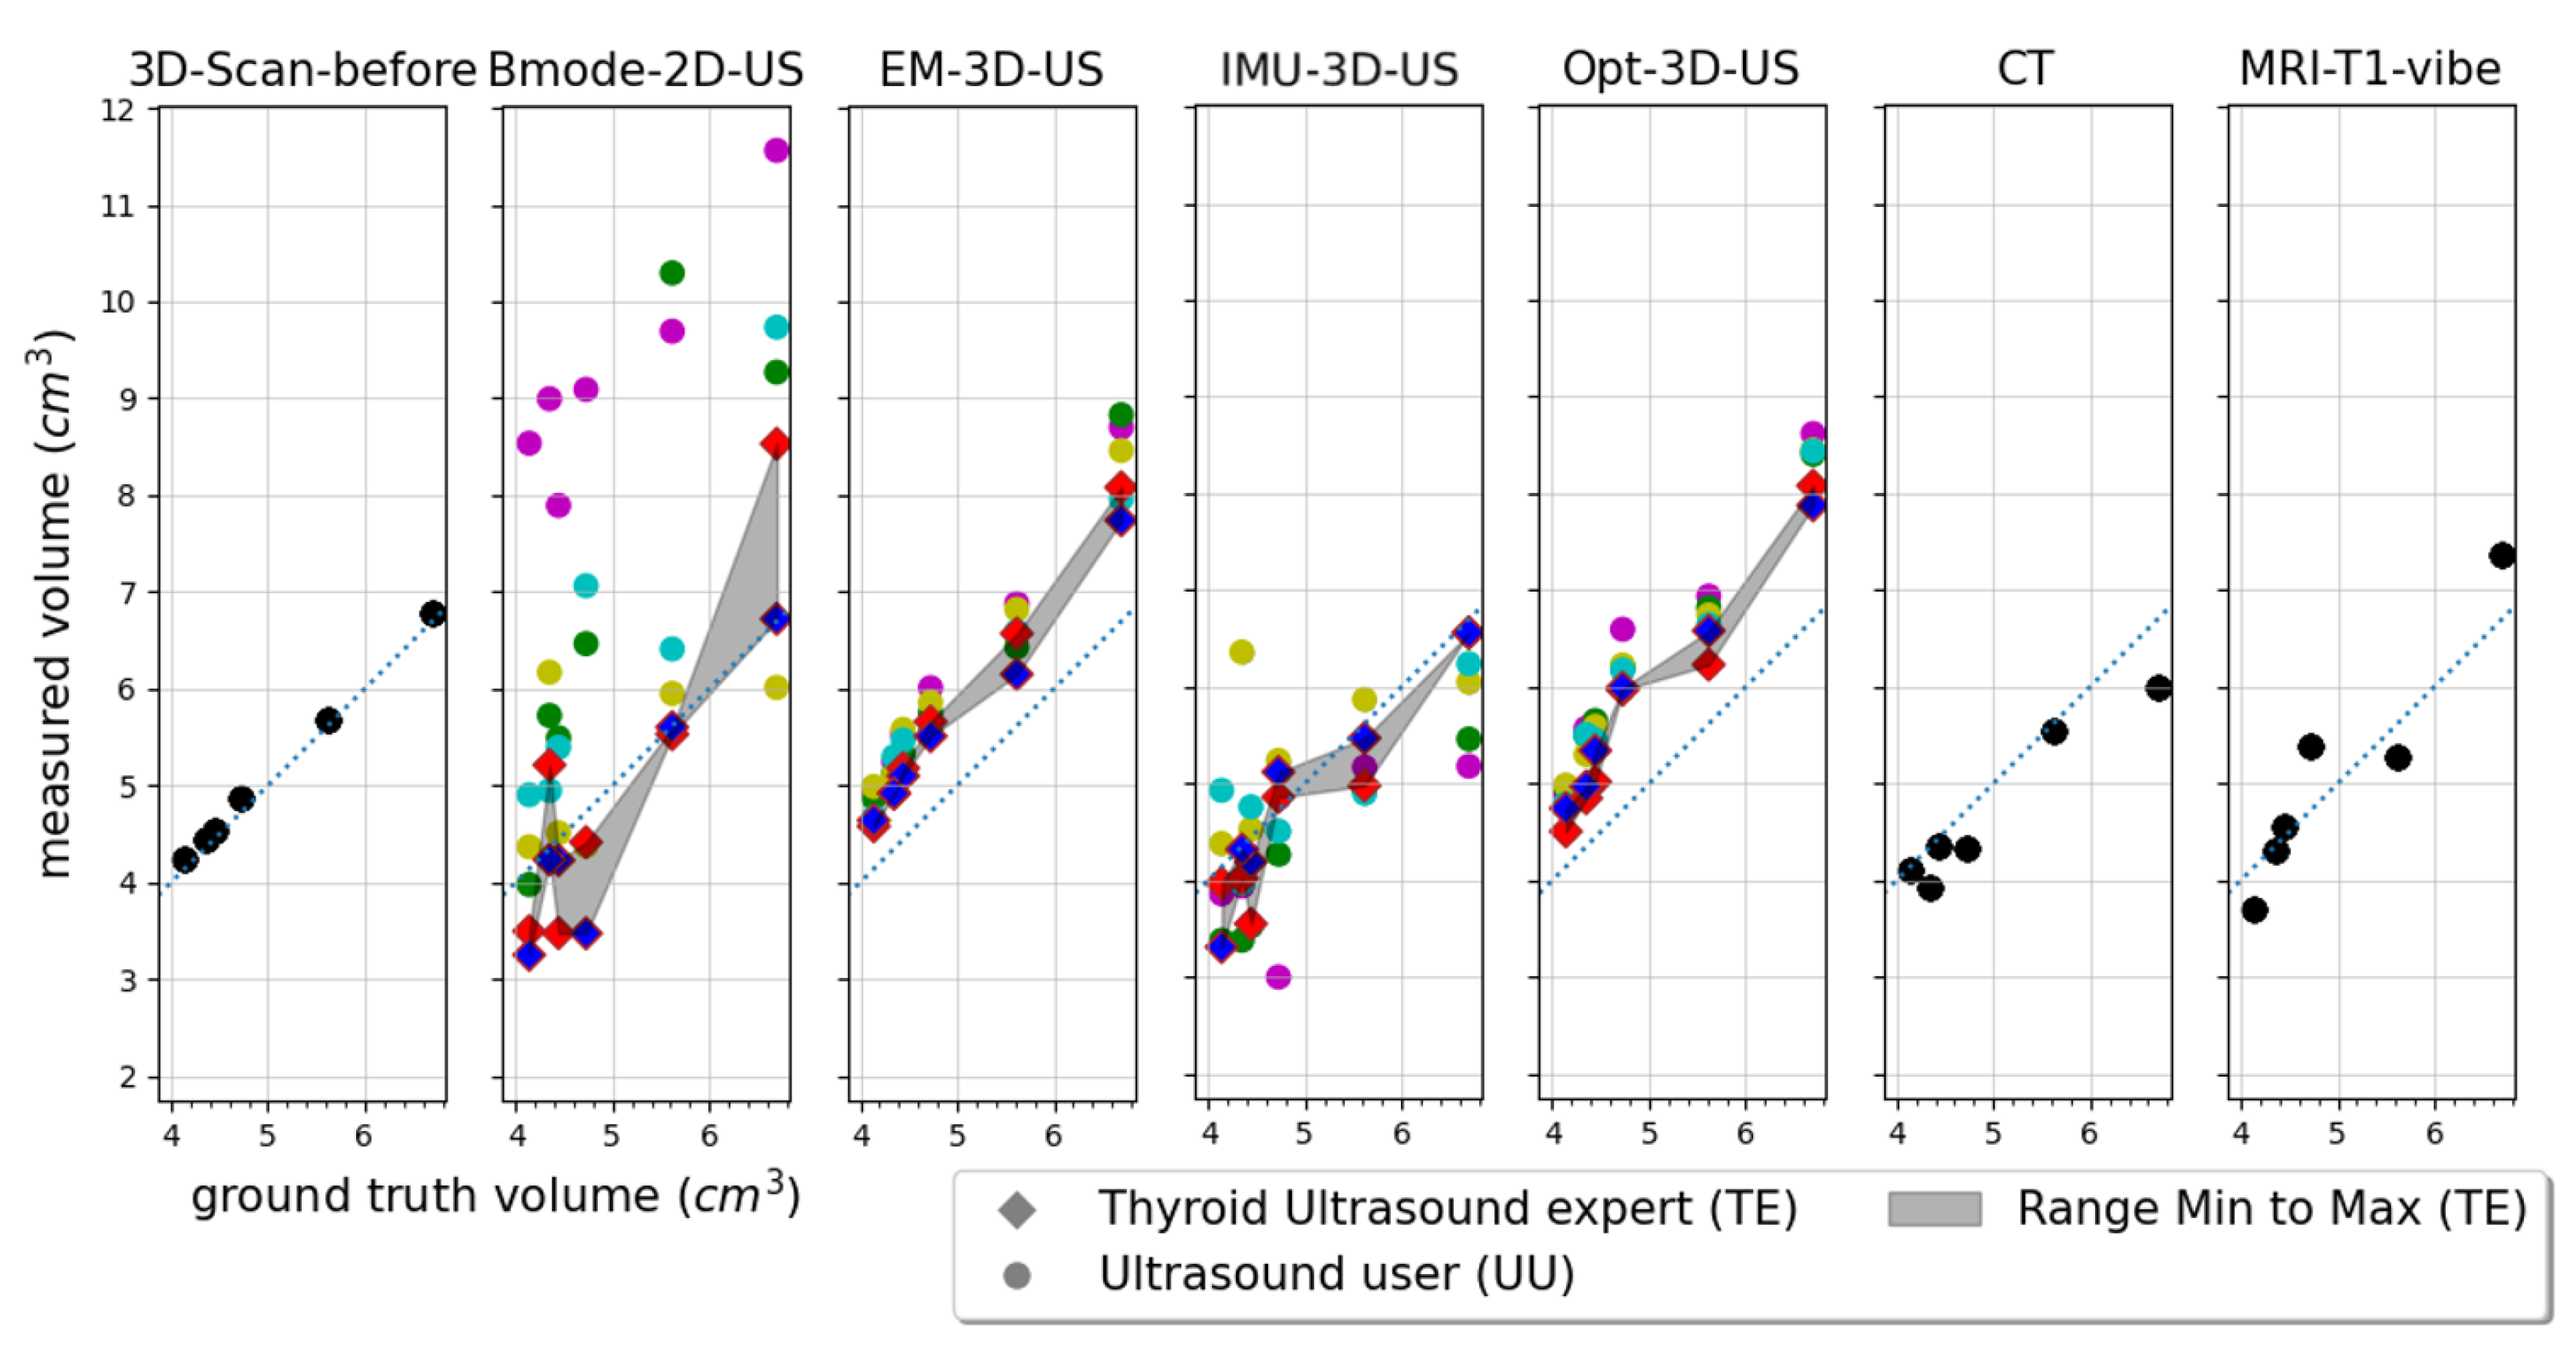
Figure A2.
Intraobserver variability: Difference of measured volume of observers to their own respective repeat measurement on y-axis and corresponding ground truth volume on x-axis. Estimated limits of agreement (±1.96 SD) with the respective repeat measurement are shown.
Figure A2.
Intraobserver variability: Difference of measured volume of observers to their own respective repeat measurement on y-axis and corresponding ground truth volume on x-axis. Estimated limits of agreement (±1.96 SD) with the respective repeat measurement are shown.
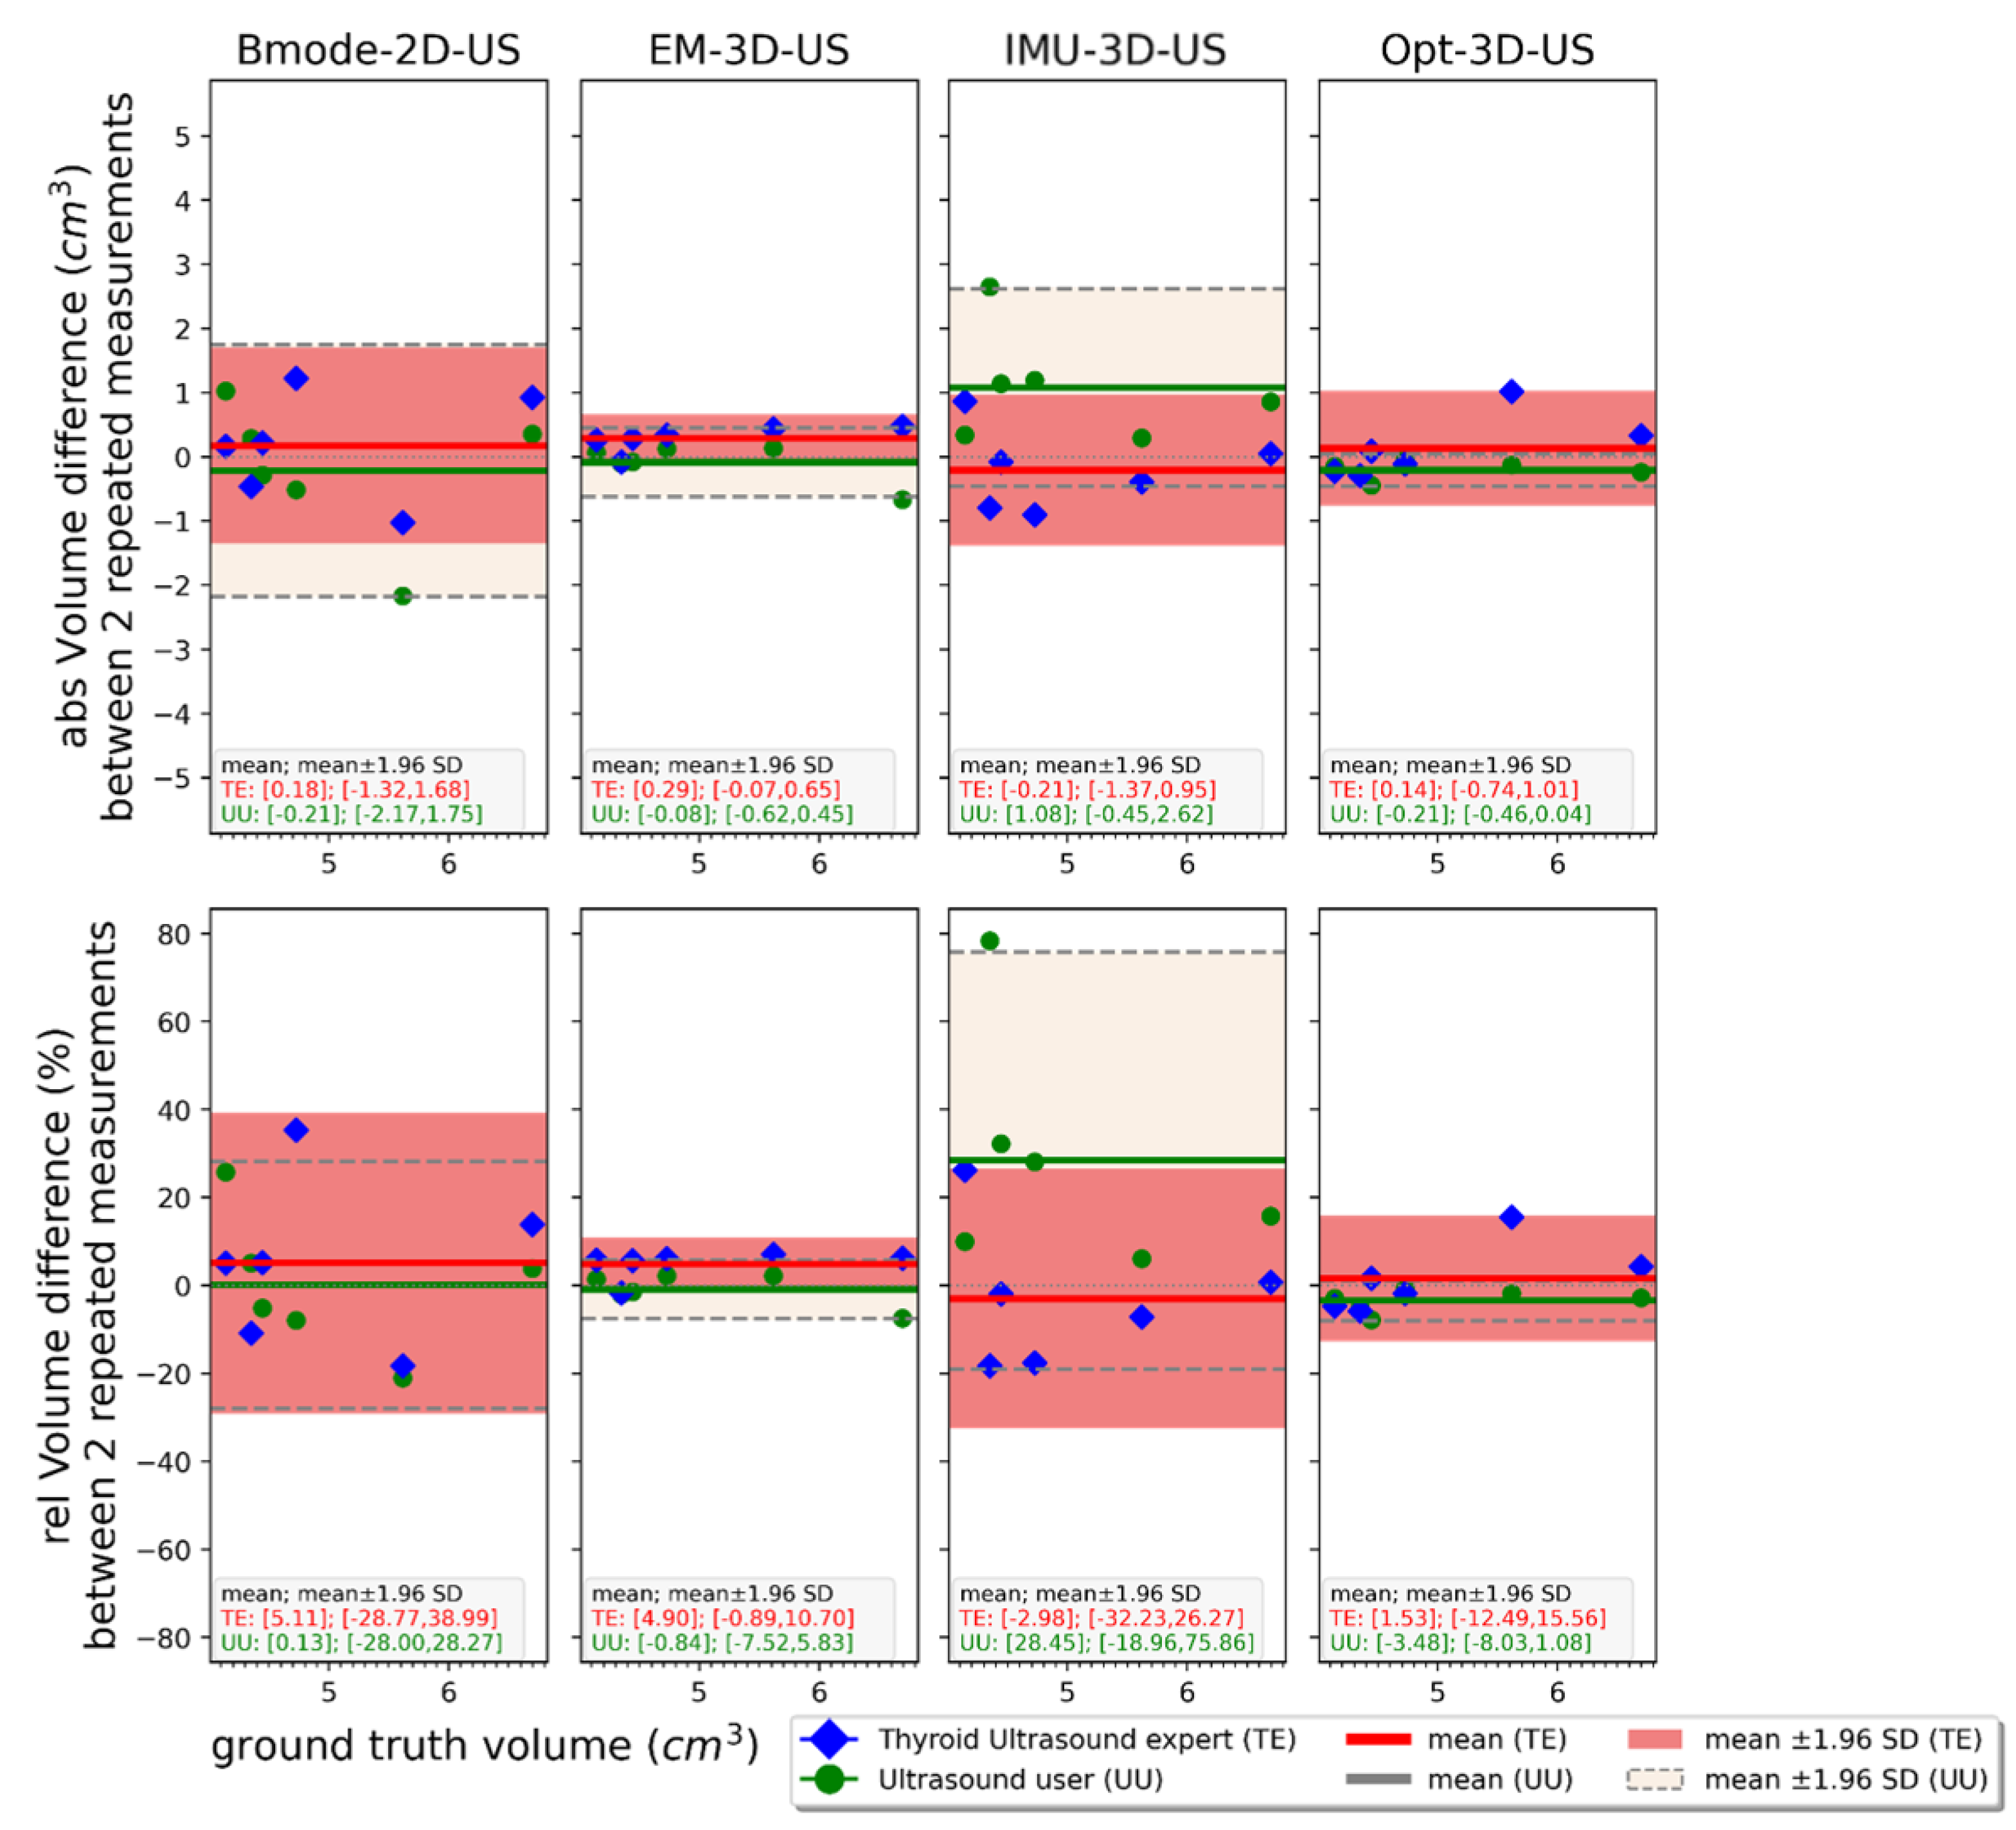
Figure A3.
Interobserver variability: Difference of measured volume between the two thyroid ultrasound experts on y-axis and corresponding ground truth volume on x-axis. Estimated limits of agreement (±1.96 SD) between the two experts are shown.
Figure A3.
Interobserver variability: Difference of measured volume between the two thyroid ultrasound experts on y-axis and corresponding ground truth volume on x-axis. Estimated limits of agreement (±1.96 SD) between the two experts are shown.
References
- Fedorov, A.; Beichel, R.; Kalpathy-Cramer, J.; Finet, J.; Fillion-Robin, J.-C.; Pujol, S.; Bauer, C.; Jennings, D.; Fennessy, F.; Sonka, M.; et al. 3D Slicer as an Image Computing Platform for the Quantitative Imaging Network. Magn. Reson Imaging 2012, 30, 1323–1341. [Google Scholar] [CrossRef] [PubMed]
- Haugen, B.R.; Alexander, E.K.; Bible, K.C.; Doherty, G.M.; Mandel, S.J.; Nikiforov, Y.E.; Pacini, F.; Randolph, G.W.; Sawka, A.M.; Schlumberger, M.; et al. 2015 American Thyroid Association Management Guidelines for Adult Patients with Thyroid Nodules and Differentiated Thyroid Cancer: The American Thyroid Association Guidelines Task Force on Thyroid Nodules and Differentiated Thyroid Cancer. Thyroid 2016, 26, 1–133. [Google Scholar] [CrossRef] [PubMed]
- Deene, Y.D.; Wheatley, M.; Greig, T.; Hayes, D.; Ryder, W.; Loh, H. A Multi-Modality Medical Imaging Head and Neck Phantom: Part 1. Design and Fabrication. Phys. Med. 2022, 96, 166–178. [Google Scholar] [CrossRef] [PubMed]
- Lyshchik, A.; Drozd, V.; Reiners, C. Accuracy of Three-Dimensional Ultrasound for Thyroid Volume Measurement in Children and Adolescents. Thyroid 2004, 14, 113–120. [Google Scholar] [CrossRef] [PubMed]
- Rogers, S.; Carreira, J.; Thompson, R.; Morais, A.; Miller, C.; Wein, W.; Ghosh, J.; McCollum, C. An Ex Vivo Evaluation of Tomographic 3-D Ultrasound, B-Mode Ultrasound, CT And MR Imaging to Measure Artery Diameter, Length and Wall Volume. Ultrasound Med. Biol. 2019, 45, 2819–2829. [Google Scholar] [CrossRef] [PubMed]
- Hughes, S.W. Archimedes Revisited: A Faster, Better, Cheaper Method of Accurately Measuring the Volume of Small Objects. Phys. Educ. 2005, 40, 468. [Google Scholar] [CrossRef]
- Popović, Z.B.; Thomas, J.D. Assessing Observer Variability: A User’s Guide. Cardiovasc Diagn. Ther. 2017, 7, 317–324. [Google Scholar] [CrossRef] [PubMed]
- King, D.M.; Fagan, A.J.; Moran, C.M.; Browne, J.E. Comparative Imaging Study in Ultrasound, MRI, CT, and DSA Using a Multimodality Renal Artery Phantom. Med. Phys. 2011, 38, 565–573. [Google Scholar] [CrossRef] [PubMed]
- Szomolanyi, P.; Rohrer, M.; Frenzel, T.; Noebauer-Huhmann, I.M.; Jost, G.; Endrikat, J.; Trattnig, S.; Pietsch, H. Comparison of the Relaxivities of Macrocyclic Gadolinium-Based Contrast Agents in Human Plasma at 1.5, 3, and 7 T, and Blood at 3 T. Invest Radiol. 2019, 54, 559–564. [Google Scholar] [CrossRef] [PubMed]
- Kato, H.; Kuroda, M.; Yoshimura, K.; Yoshida, A.; Hanamoto, K.; Kawasaki, S.; Shibuya, K.; Kanazawa, S. Composition of MRI Phantom Equivalent to Human Tissues. Med. Phys. 2005, 32, 3199–3208. [Google Scholar] [CrossRef] [PubMed]
- Yoshimura, K.; Kato, H.; Kuroda, M.; Yoshida, A.; Hanamoto, K.; Tanaka, A.; Tsunoda, M.; Kanazawa, S.; Shibuya, K.; Kawasaki, S.; et al. Development of a Tissue-Equivalent MRI Phantom Using Carrageenan Gel. Magn. Reson Med. 2003, 50, 1011–1017. [Google Scholar] [CrossRef] [PubMed]
- Brauer, V.F.H.; Eder, P.; Miehle, K.; Wiesner, T.D.; Hasenclever, H.; Paschke, R. Interobserver Variation for Ultrasound Determination of Thyroid Nodule Volumes. Thyroid 2005, 15, 1169–1175. [Google Scholar] [CrossRef] [PubMed]
- Andermann, P.; Schlögl, S.; Mäder, U.; Luster, M.; Lassmann, M.; Reiners, C. Intra- and Interobserver Variability of Thyroid Volume Measurements in Healthy Adults by 2D versus 3D Ultrasound. Nuklearmedizin 2007, 46, 1–7. [Google Scholar] [CrossRef]
- Shabana, W.; Peeters, E.; De Maeseneer, M. Measuring Thyroid Gland Volume: Should We Change the Correction Factor? AJR Am. J. Roentgenol. 2006, 186, 234–236. [Google Scholar] [CrossRef] [PubMed]
- Higgins, C.B.; McNamara, M.T.; Fisher, M.R.; Clark, O.H. MR Imaging of the Thyroid. AJR Am. J. Roentgenol. 1986, 147, 1255–1261. [Google Scholar] [CrossRef] [PubMed]
- Antoniou, A.; Georgiou, L.; Christodoulou, T.; Panayiotou, N.; Ioannides, C.; Zamboglou, N.; Damianou, C. MR Relaxation Times of Agar-Based Tissue-Mimicking Phantoms. J. Appl. Clin. Med. Phys. 2022, 23, e13533. [Google Scholar] [CrossRef] [PubMed]
- Huber, J.S.; Peng, Q.; Moses, W.W. Multi-Modality Phantom Development. Proc. 2007 IEEE Nucl. Sci. Symp. Conf. Rec. 2007, Vol. 4, 2944–2948. [Google Scholar] [CrossRef]
- Freesmeyer, M.; Wiegand, S.; Schierz, J.-H.; Winkens, T.; Licht, K. Multimodal Evaluation of 2-D and 3-D Ultrasound, Computed Tomography and Magnetic Resonance Imaging in Measurements of the Thyroid Volume Using Universally Applicable Cross-Sectional Imaging Software: A Phantom Study. Ultrasound Med. Biol. 2014, 40, 1453–1462. [Google Scholar] [CrossRef] [PubMed]
- Christensen, H.S.; Borgbjerg, J.; Børty, L.; Bøgsted, M. On Jones et al.’s Method for Extending Bland–Altman Plots to Limits of Agreement with the Mean for Multiple Observers. BMC Med. Res. Methodol. 2020, 20, 304. [Google Scholar] [CrossRef] [PubMed]
- Filippou, A.; Evripidou, N.; Damianou, C. Robotic System for Magnetic Resonance Imaging-Guided Focused Ultrasound Treatment of Thyroid Nodules. Int. J. Med. Robot 2023, 19, e2525. [Google Scholar] [CrossRef] [PubMed]
- Souza, R.M.; Santos, T.Q.; Oliveira, D.P.; Souza, R.M.; Alvarenga, A.V.; Costa-Felix, R.P.B. Standard Operating Procedure to Prepare Agar Phantoms. J. Phys. Conf. Ser. 2016, 733, 012044. [Google Scholar] [CrossRef]
- Bland, J.M.; Altman, D.G. Statistical Methods for Assessing Agreement between Two Methods of Clinical Measurement. Lancet 1986, 1, 307–310. [Google Scholar] [CrossRef] [PubMed]
- Campennì, A.; Avram, A.M.; Verburg, F.A.; Iakovou, I.; Hänscheid, H.; de Keizer, B.; Petranović Ovčariček, P.; Giovanella, L. The EANM Guideline on Radioiodine Therapy of Benign Thyroid Disease. Eur. J. Nucl. Med. Mol. Imaging 2023, 50, 3324–3348. [Google Scholar] [CrossRef] [PubMed]
- Krönke, M.; Eilers, C.; Dimova, D.; Köhler, M.; Buschner, G.; Schweiger, L.; Konstantinidou, L.; Makowski, M.; Nagarajah, J.; Navab, N.; et al. Tracked 3D Ultrasound and Deep Neural Network-Based Thyroid Segmentation Reduce Interobserver Variability in Thyroid Volumetry. PLoS ONE 2022, 17, e0268550. [Google Scholar] [CrossRef] [PubMed]
- Antoniou, A.; Evripidou, N.; Georgiou, L.; Chrysanthou, A.; Ioannides, C.; Damianou, C. Tumor Phantom Model for MRI-Guided Focused Ultrasound Ablation Studies. Med. Phys. 2023, 50, 5956–5968. [Google Scholar] [CrossRef] [PubMed]
- Drakos, T.; Antoniou, A.; Evripidou, N.; Alecou, T.; Giannakou, M.; Menikou, G.; Constantinides, G.; Damianou, C. Ultrasonic Attenuation of an Agar, Silicon Dioxide, and Evaporated Milk Gel Phantom. J. Med. Ultrasound 2021, 29, 239–249. [Google Scholar] [CrossRef] [PubMed]
- Brunn, J.; Block, U.; Ruf, G.; Bos, I.; Kunze, W.P.; Scriba, P.C. Volumetrie der Schilddrüsenlappen mittels Real-time-Sonographie*1. Dtsch. Med. Wochenschr. 1981, 106, 1338–1340. [Google Scholar] [CrossRef] [PubMed]
- Krouwer, J.S. Why Bland–Altman Plots Should Use X, Not (Y+X)/2 When X Is a Reference Method. Stat. Med. 2008, 27, 778–780. [Google Scholar] [CrossRef] [PubMed]
Figure 1.
Combination image: left – human thyroid lobe as seen in ultrasound, right – thyroid phantom as seen in ultrasound with overlaid line measurements.
Figure 1.
Combination image: left – human thyroid lobe as seen in ultrasound, right – thyroid phantom as seen in ultrasound with overlaid line measurements.
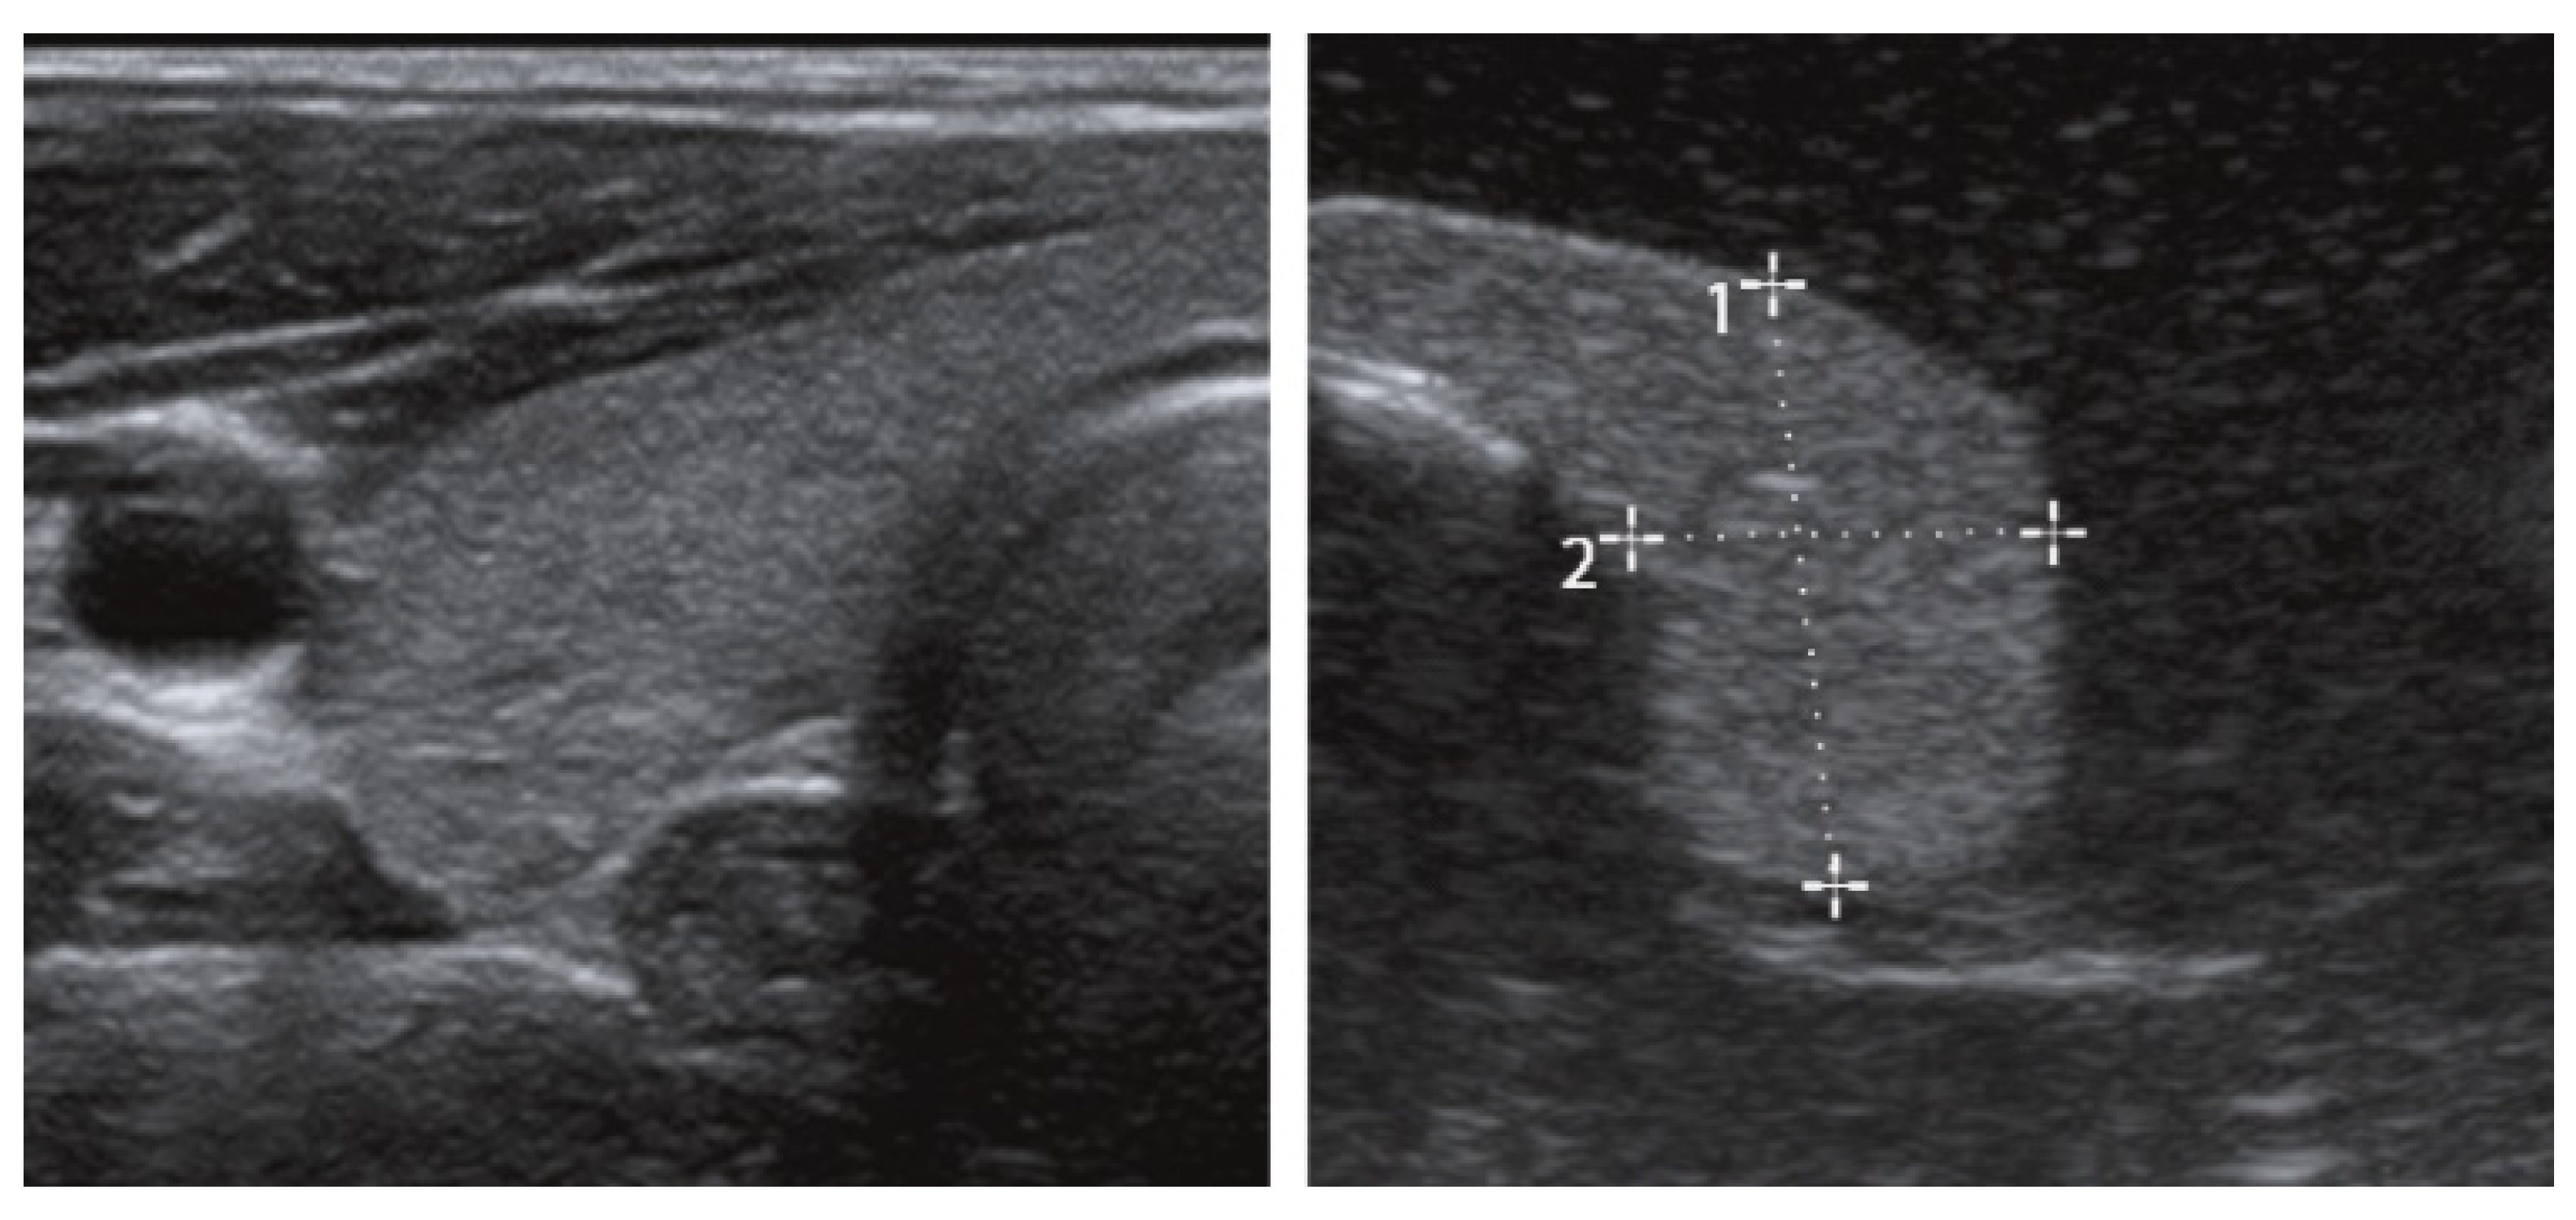
Figure 2.
Creation of the anatomical thyroid phantom samples.
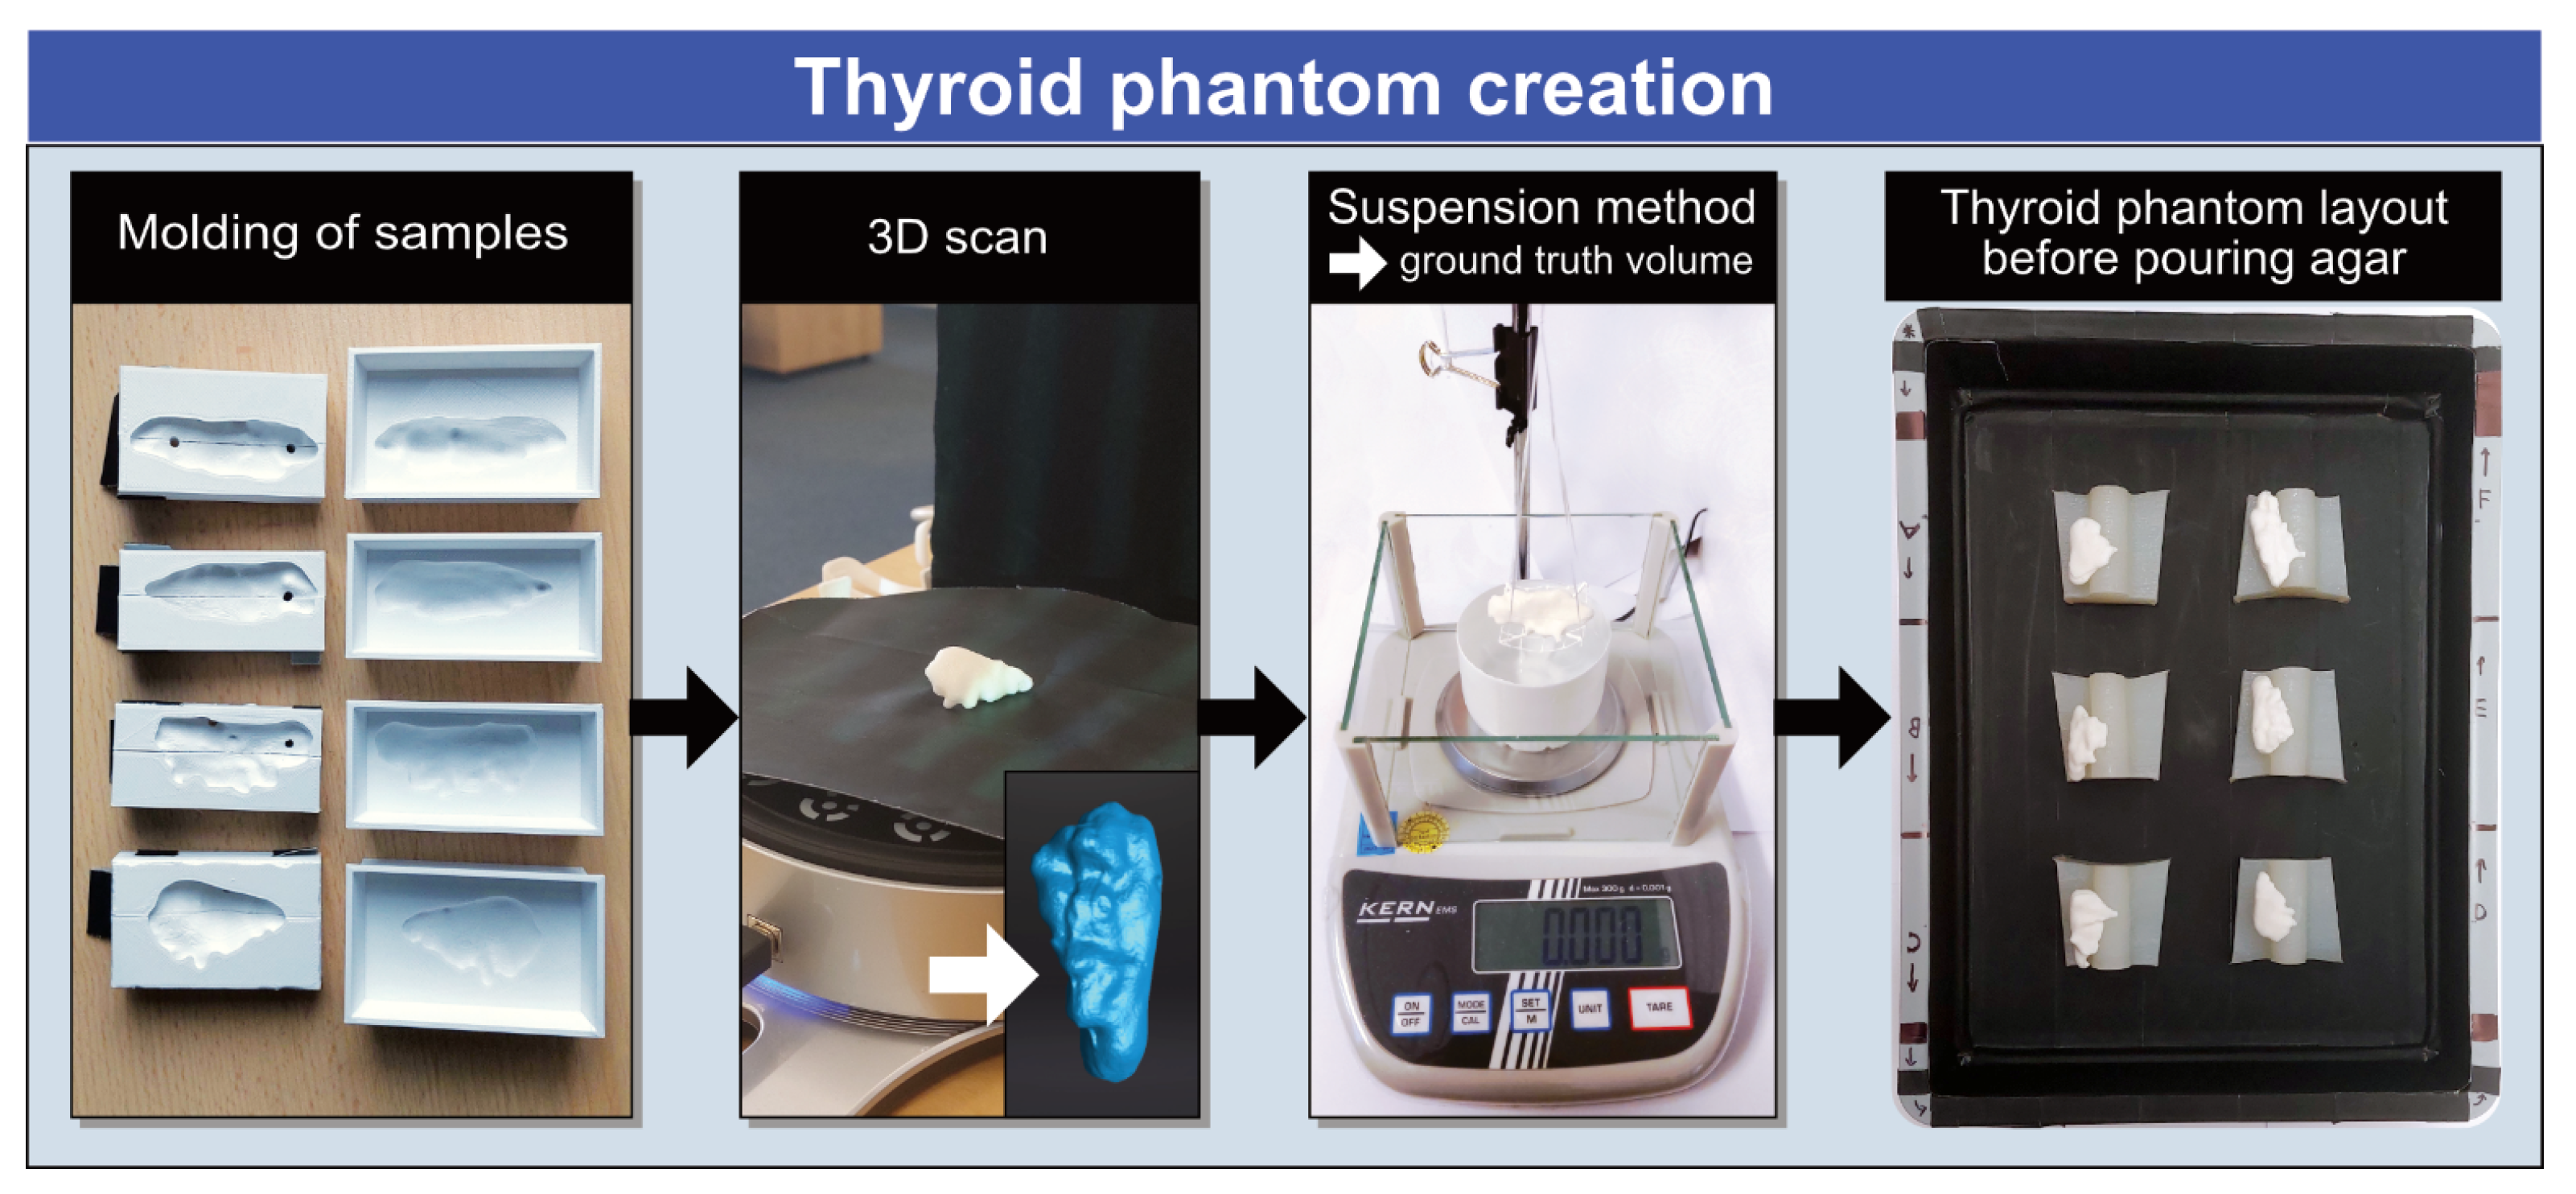
Figure 3.
Add-ons for ultrasound probe in free-hand tracked ultrasound technologies
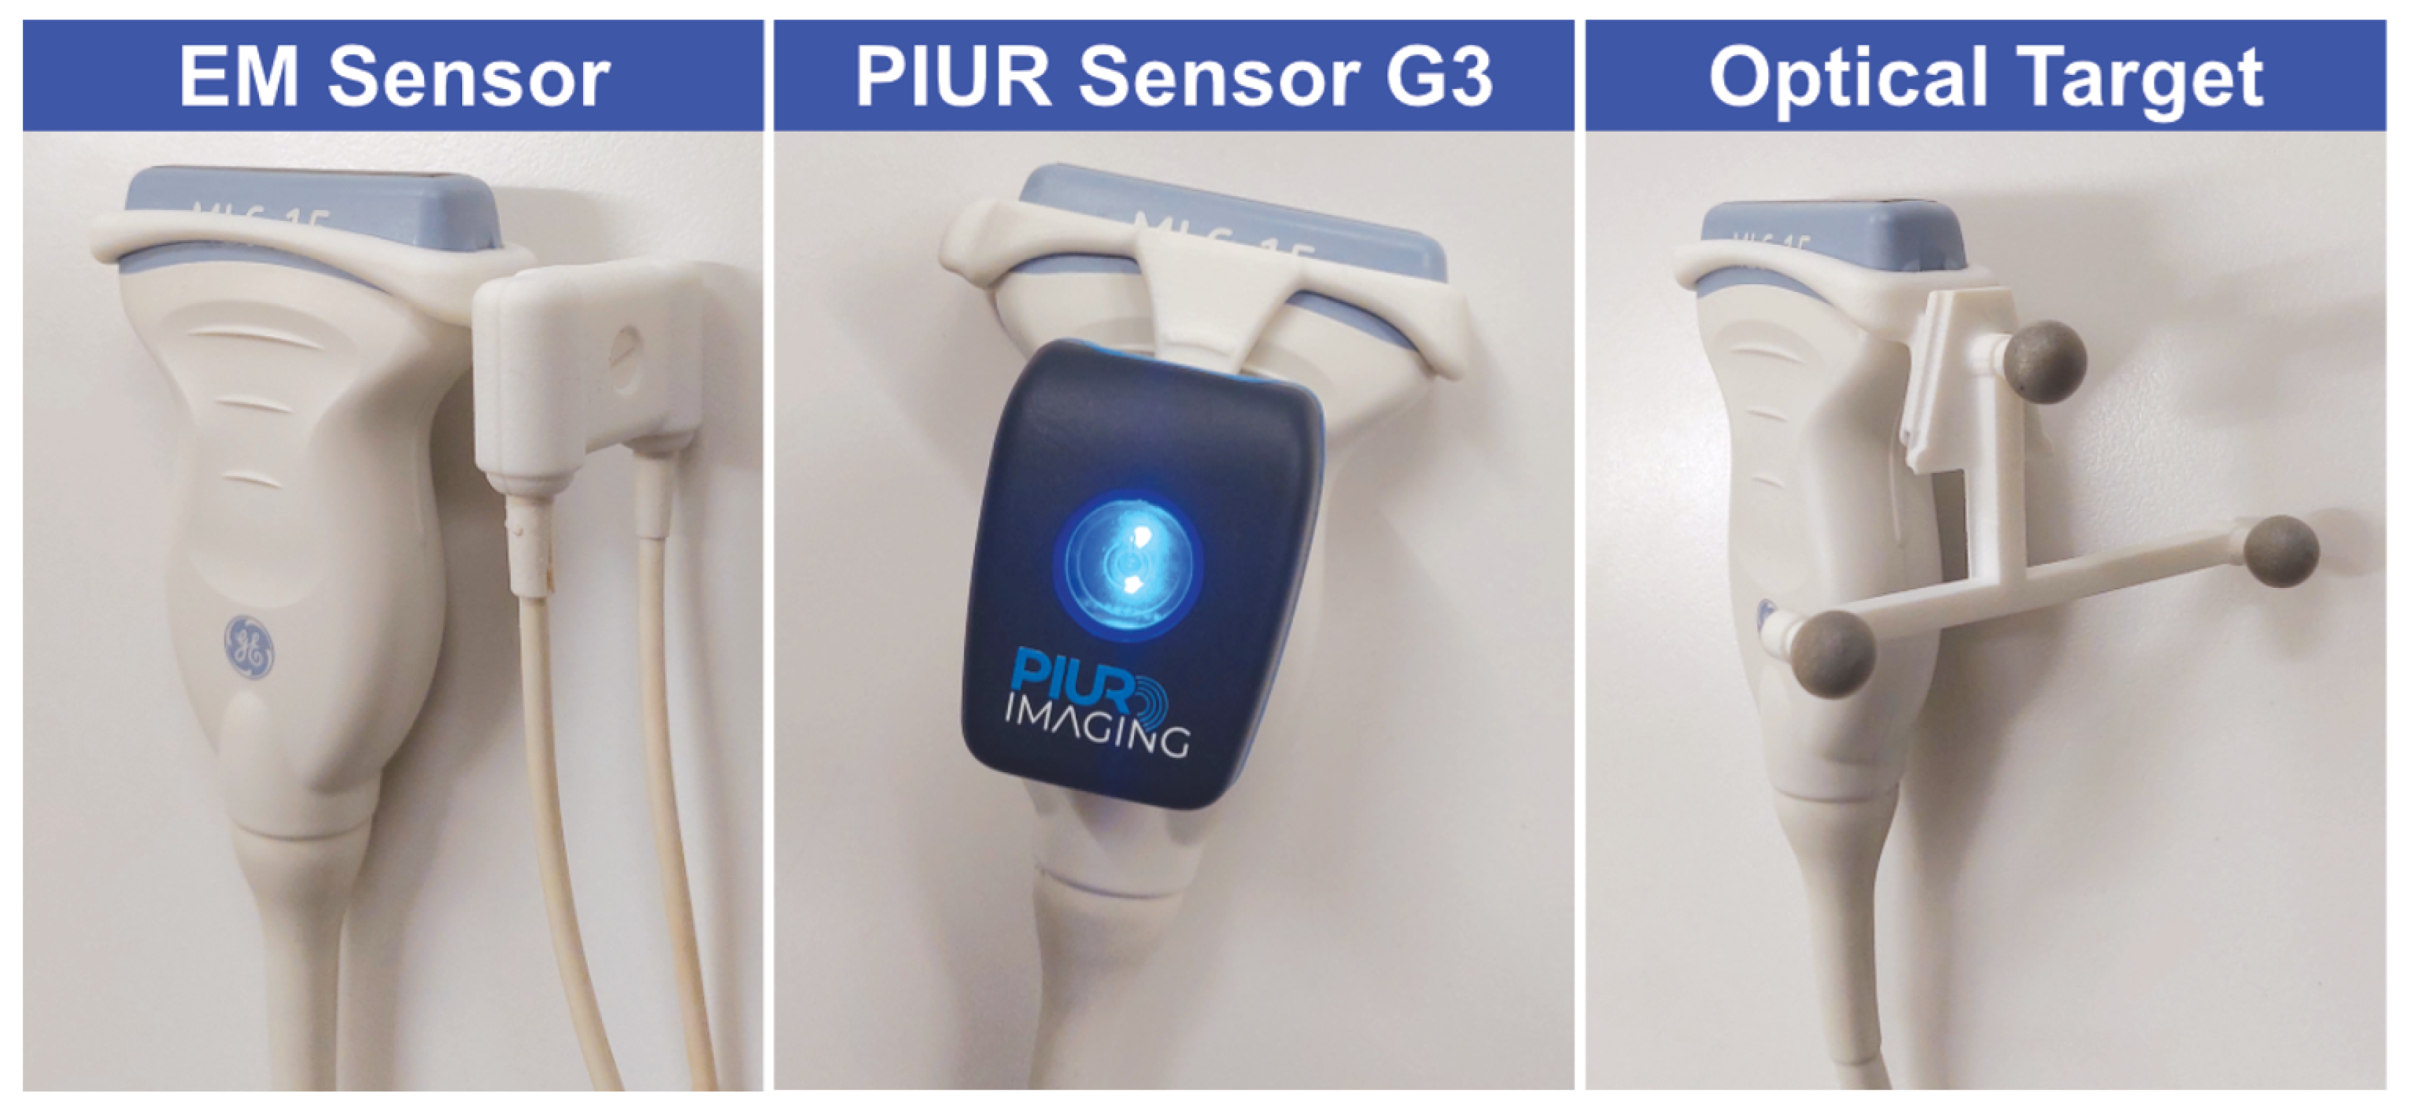
Figure 5.
Volume measurement and segmentation process. White arrows correspond to data output. (a) Tracked 3D-US: Semi-automatic segmentation of volume with binary colouring of tomographic ultrasound data within the PIUR tUS software; (b) Bmode-2D-US: Measurement for volume estimation of a sample in Bmode-2D-US; (c) CT: Segmentation of all samples from CT scan; (d) MRI: Segmentation of all samples from MRI scan.
Figure 5.
Volume measurement and segmentation process. White arrows correspond to data output. (a) Tracked 3D-US: Semi-automatic segmentation of volume with binary colouring of tomographic ultrasound data within the PIUR tUS software; (b) Bmode-2D-US: Measurement for volume estimation of a sample in Bmode-2D-US; (c) CT: Segmentation of all samples from CT scan; (d) MRI: Segmentation of all samples from MRI scan.
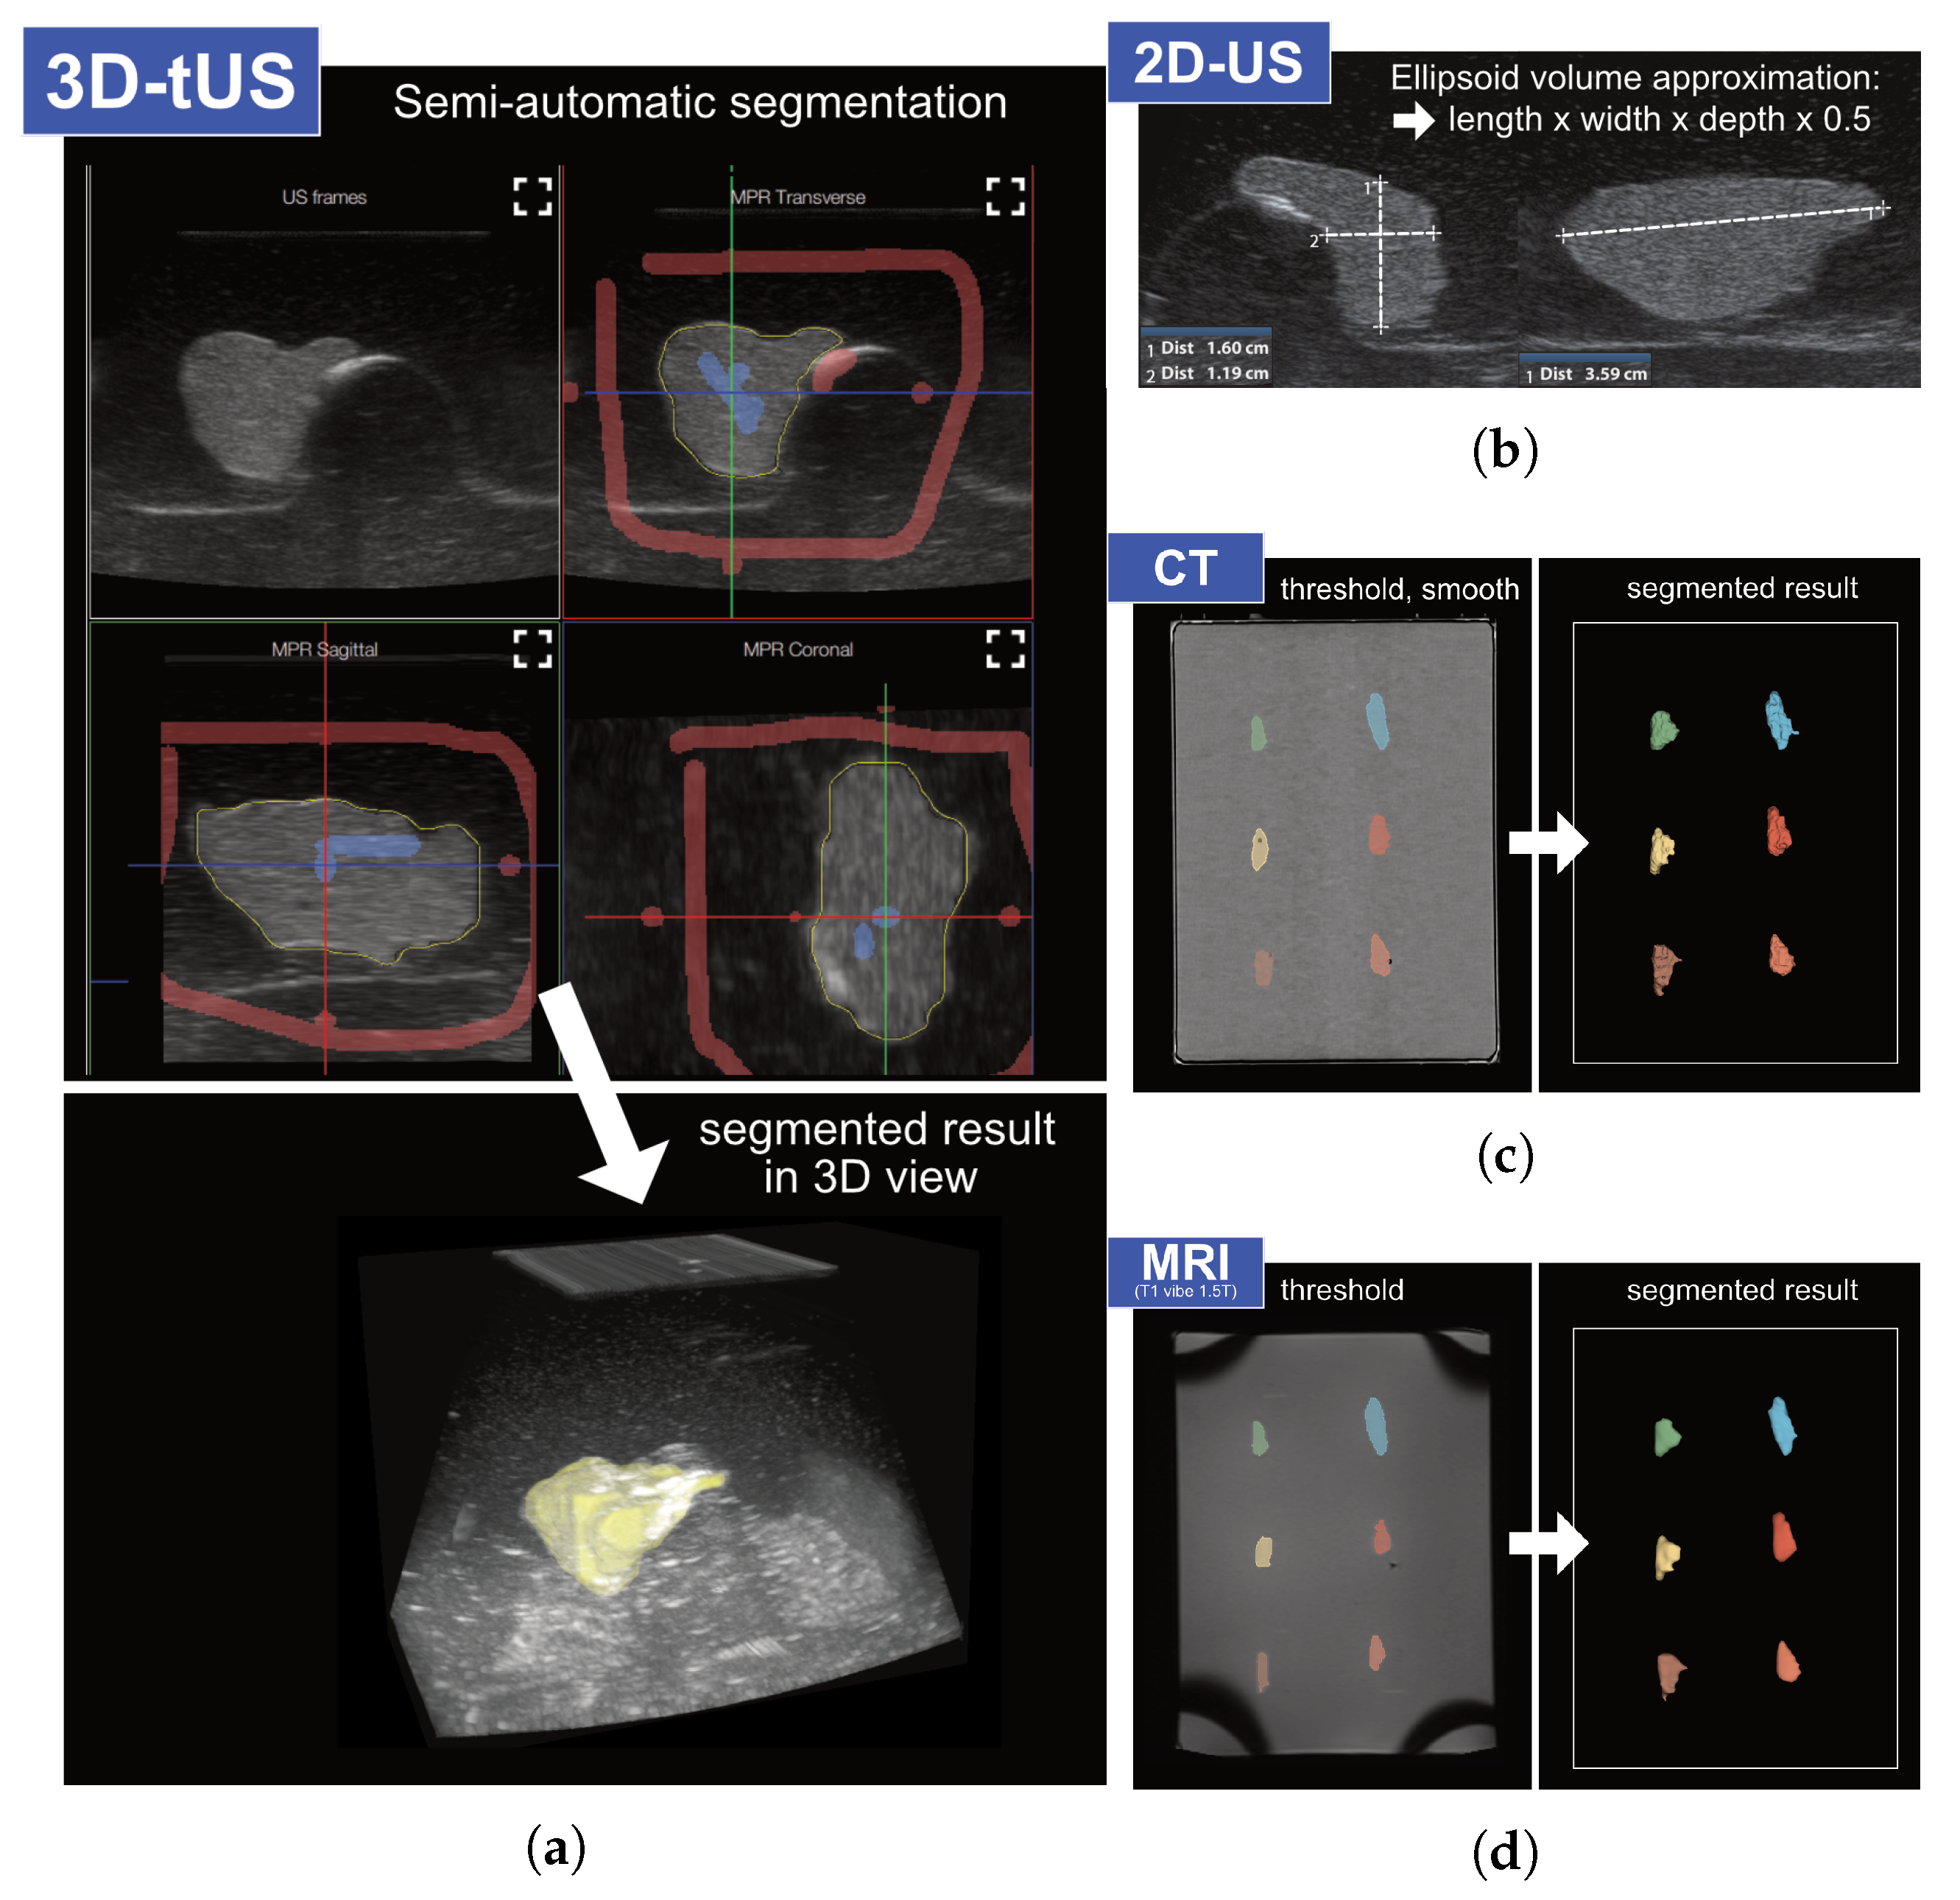
Figure 6.
Difference to ground truth (GT): Difference of measured volume by six observers to GT volume on y-axis and corresponding ground truth volume on x-axis. First scan used for value when repeated measurements were taken. Estimated limits of agreement (±1.96 SD) with the GT are shown.
Figure 6.
Difference to ground truth (GT): Difference of measured volume by six observers to GT volume on y-axis and corresponding ground truth volume on x-axis. First scan used for value when repeated measurements were taken. Estimated limits of agreement (±1.96 SD) with the GT are shown.
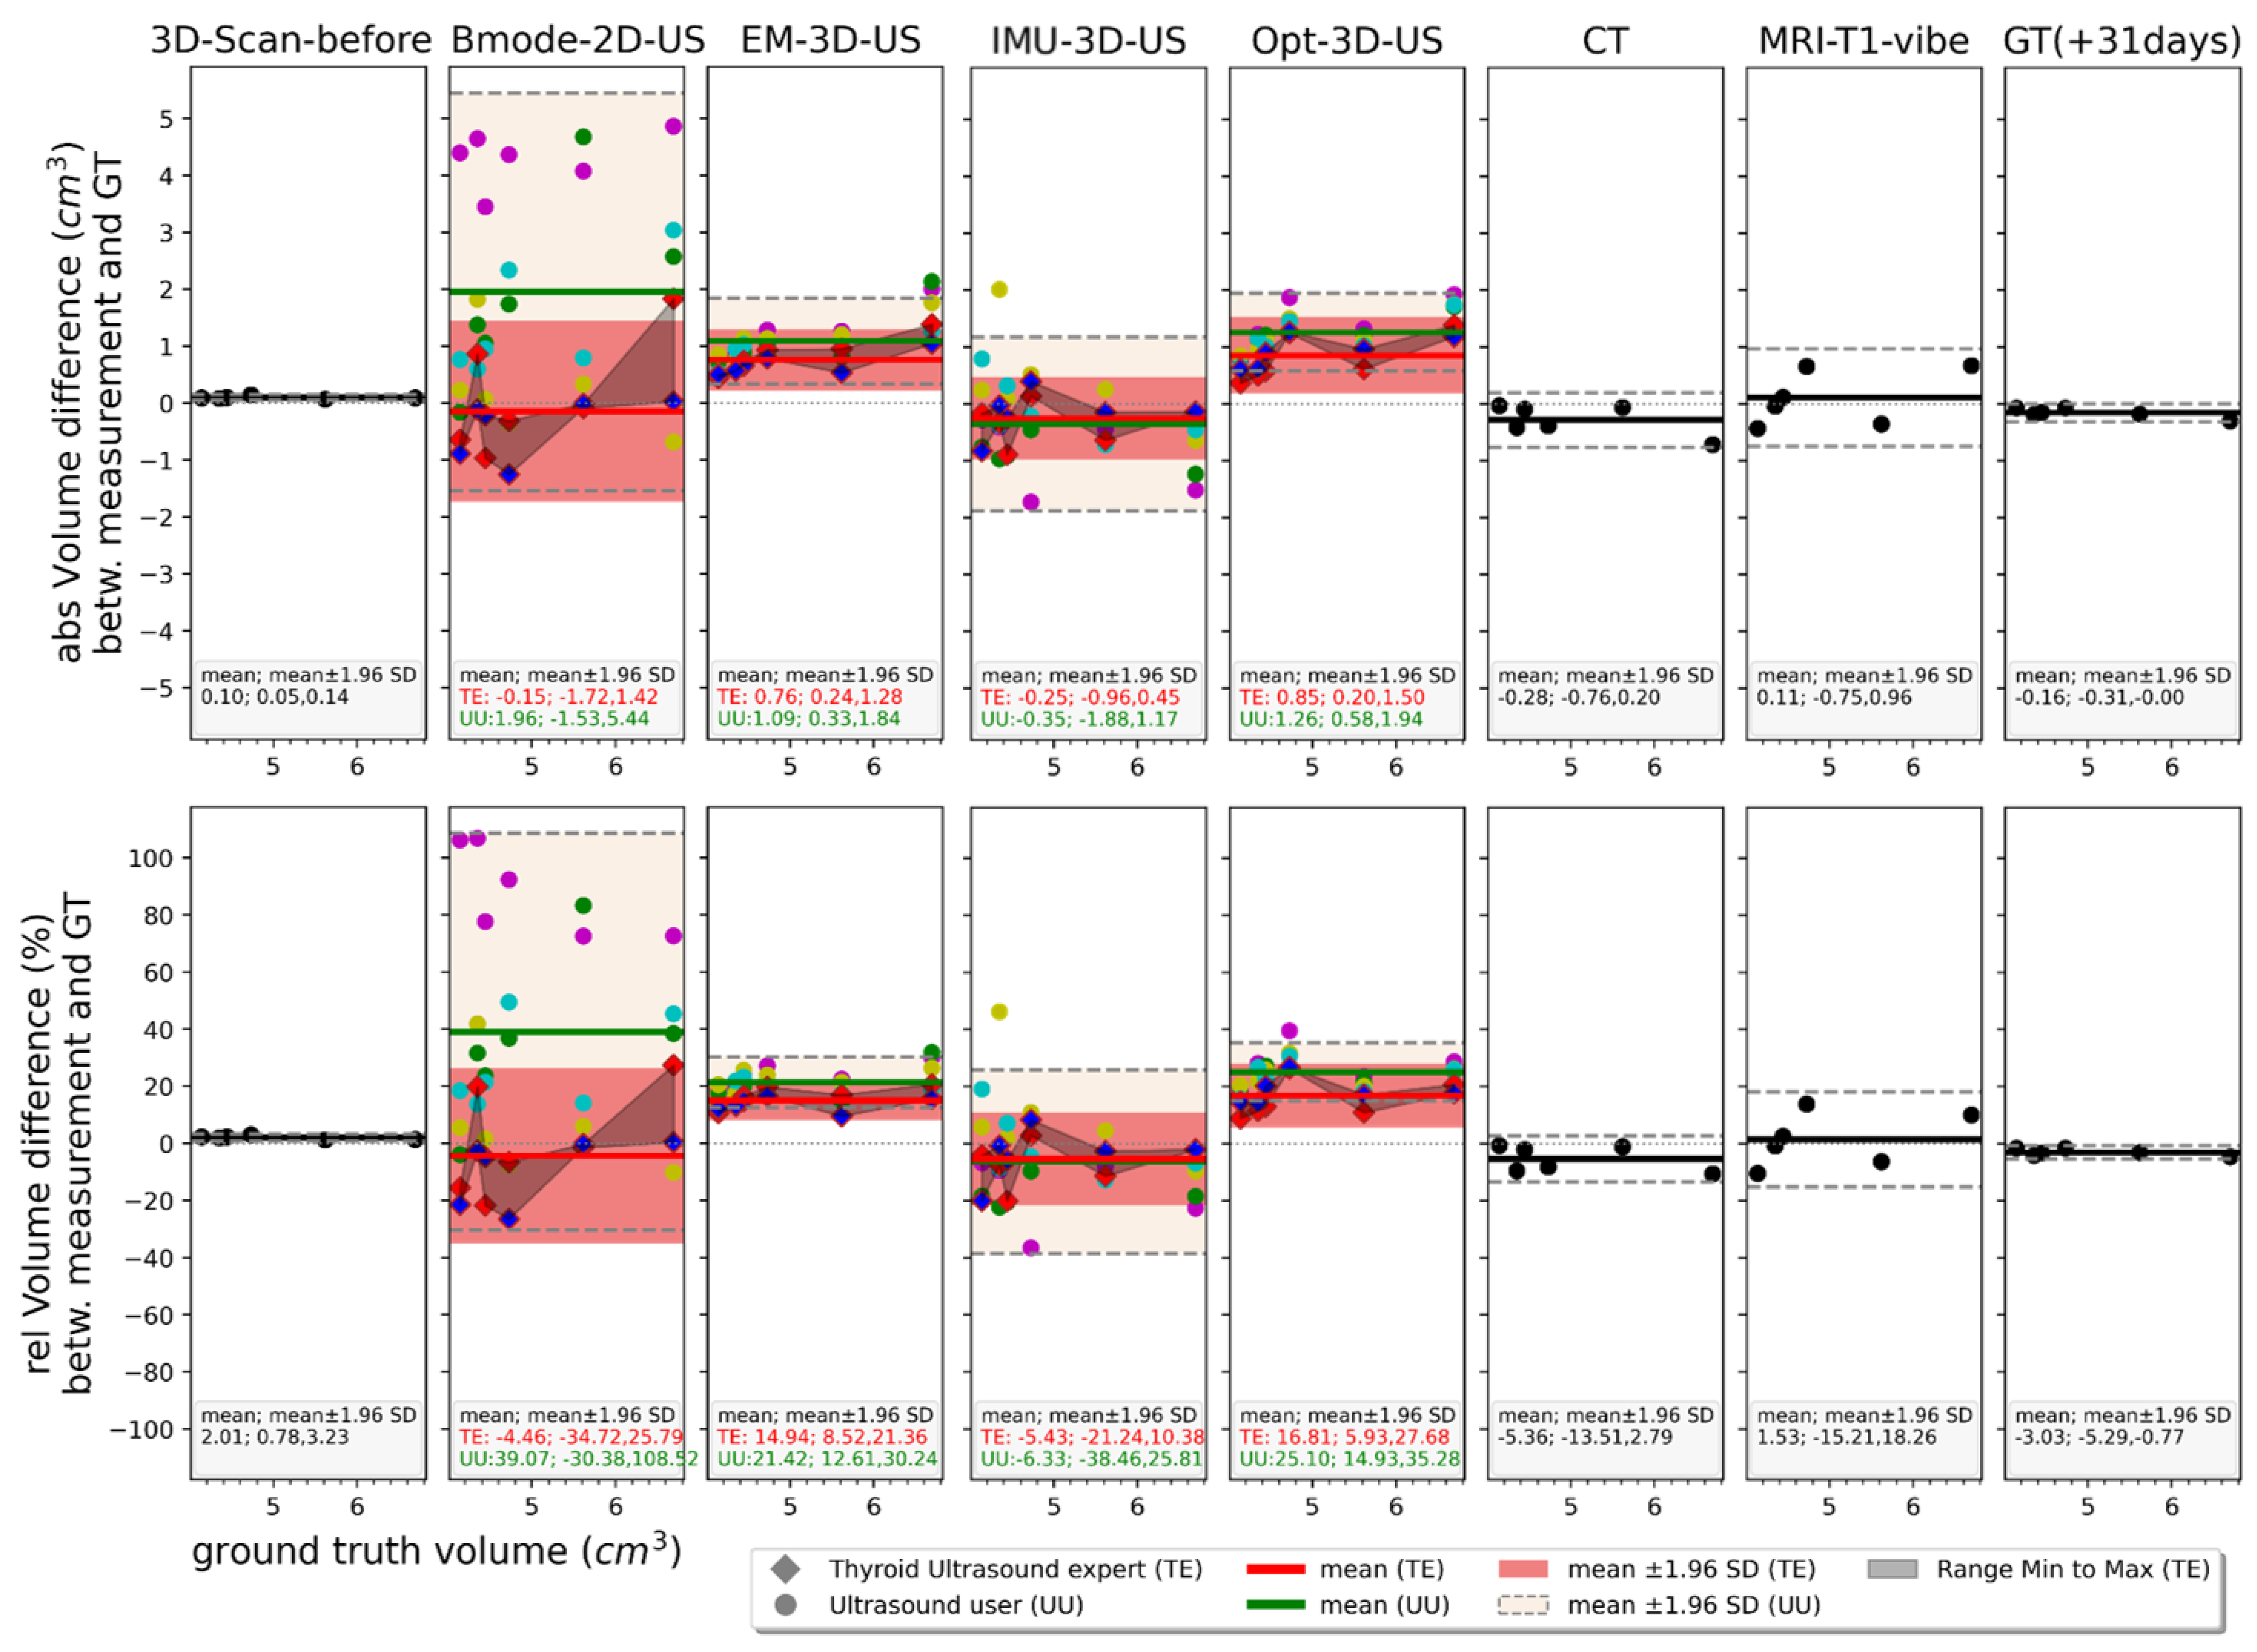
Table 1.
Components used for phantom creation.
| Component | Sample | Background |
|---|---|---|
| Water | 1000 g | 1000 g |
| Agar | 60.0 g | 30.0 g |
| NaCl | 9.0 g | 9.0 g |
| 5.0 g | - | |
| Gadoteridol 0.5 M | 1.0 g | - |
Disclaimer/Publisher’s Note: The statements, opinions and data contained in all publications are solely those of the individual author(s) and contributor(s) and not of MDPI and/or the editor(s). MDPI and/or the editor(s) disclaim responsibility for any injury to people or property resulting from any ideas, methods, instructions or products referred to in the content. |
© 2026 by the authors. Licensee MDPI, Basel, Switzerland. This article is an open access article distributed under the terms and conditions of the Creative Commons Attribution (CC BY) license (http://creativecommons.org/licenses/by/4.0/).
Copyright: This open access article is published under a Creative Commons CC BY 4.0 license, which permit the free download, distribution, and reuse, provided that the author and preprint are cited in any reuse.