

Submitted:
03 July 2026
Posted:
07 July 2026
You are already at the latest version
Abstract
Purpose: To investigate the structural and operational factors responsible for Ghana’s persistent electricity supply unreliability despite substantial growth in installed generation capacity between 2016 and 2025, and to assess the potential of energy efficiency interventions to address emerging supply-demand imbalances. Design/methodology/approach: A mixed-methods approach combining descriptive trend analysis, multiple regression modelling and Energy Performance Certification (EPC)-based demand reduction scenarios was employed to examine electricity supply reliability, demand dynamics and system performance from 2016 to 2025. Findings: Installed capacity increased from about 4,100 MW in 2016 to over 5,200 MW in 2025; however, available capacity often remained below peak demand. Regression results indicate that generation outages, gas supply variability and transmission losses significantly explain electricity deficits (R² ≈ 0.78). EPC-based modelling shows that an 18% improvement in energy efficiency could eliminate peak deficits, highlighting reliability and governance challenges rather than capacity shortages. Research limitations/implications: The analysis is based on national-level sector data and assumes projected efficiency gains under EPC implementation scenarios. Practical implications: Policy efforts should prioritise fuel security, grid modernisation, institutional reforms and demand-side energy efficiency programmes. Originality/value: The study introduces EPC-based deficit modelling, demonstrating how energy efficiency can complement supply-side investments to improve electricity reliability.
Keywords:
electricity supply reliability deficit
; electricity demand dynamics
; EPC modelling
; energy sector performance (2016-2025)
; load shedding
; energy transition
1. Introduction
Ghana’s electricity sector presents a paradox that challenges conventional energy planning theory (EC, 2025a; ACEP, 2024; Achampong et al., 2021). Historically, characterized by generation deficits and the well-documented power outage crisis (Dumsor) prior to 2016, the country has since transitioned into an era of installed capacity surplus (EC, 2025a; Anderson & Dalgaard, 2023). Notwithstanding this expansion, intermittent power outages and load shedding have re-emerged between 2023 and 2025, raising critical questions about the structural integrity of the power system (ACEP, 2024). This contradiction signals a shift from a classical supply deficit to a more complex reliability deficit rooted in operational, financial, and infrastructural inefficiencies (GRIDCo, 2025; Anderson & Dalgaard, 2023). The motivation for this study is anchored in the growing disconnect between installed generation capacity and actual system reliability in Ghana. While investments in Independent Power Producers (IPPs), thermal plants, and gas infrastructure have significantly increased nominal capacity, the inability to translate this capacity into stable electricity supply suggests systemic dysfunction (Arthur & Aseidu-Okantah, 2021). This situation undermines industrial productivity, increases operational costs, and threatens Ghana’s broader energy transition objectives aligned with its net-zero ambition.
The central problem addressed in this paper is therefore: why does Ghana continue to experience electricity supply interruptions despite apparent adequacy in installed capacity? The main purpose of the study is to interrogate the structural and operational drivers of Ghana’s electricity supply gap and to model both supply-side and demand-side pathways for resolving this paradox. Specifically, the study seeks to quantify the dynamics of electricity deficits between 2016 and 2025, examine the determinants of supply gaps using econometric modelling, evaluate the potential of Energy Performance Certification (EPC) as a demand-side intervention (Nunoo, Adam, Essandoh-Yeddu et al., 2026), and provide policy-relevant recommendations for improving system reliability. The novelty of this research lies in its integrated analytical approach that combines reliability deficit theory, econometric modelling, and EPC-based demand reduction within a Ghana-specific institutional and policy framework.
2. Literature Review
2.1. Theoretical Underpinnings: Energy Deficit Versus Reliability Deficit
Traditional energy economics conceptualizes electricity crises as a function of inadequate generation capacity relative to demand (Nyasapoh et al., 2023; Koranteng Nkansah et al., 2022; Bhattacharyya, 2011). However, recent scholarships have expanded this view by introducing the concept of reliability deficits, particularly in developing economies where installed capacity may exceed demand, but system inefficiencies constrain delivery (Peprah et al., 2023; Odoi-Yorke et al., 2025; IEA, 2022; Essandoh, Akolgo, Kumi et al., 2021; Nyasapoh, Gyamfi, Debrah et al., 2024). Three interrelated deficit typologies are central to this expanded framework. Operational deficits arise when available capacity is significantly lower than installed capacity due to outages (Kuusaana, Smith & Monstadt, 2025; GRIDCo, 2025; EC, 2025b), maintenance challenges (James, Ahiabor & Abalo, 2025; GRIDCo, 2025), or fuel shortages (MoE>, 2025; Koranteng Nkansah, Suleman, Ackah et al., 2022; Ackah, Auth, Kwakye et al., 2021). Financial deficits emerge from liquidity constraints within the power sector, often linked to tariff distortions, revenue collection inefficiencies, and legacy debts (PURC, 2024; Ponkshe & Chisthi, 2022; World Bank, 2021). Infrastructure deficits relate to transmission and distribution inefficiencies, including high technical losses and grid congestion (GRIDCo, 2025; World Bank, 2021). This tripartite framework provides a more robust explanation for Ghana’s electricity challenges than traditional deficit theory, as it captures the systemic nature of reliability failures.
2.2. Conceptual Framework: Ghana’s Electricity Reliability Nexus
The conceptual framework for the study situates Ghana’s electricity supply system within a nexus of supply adequacy, operational reliability, financial sustainability, and demand management. Installed generation capacity represents the theoretical upper limit of electricity supply, whereas available capacity reflects the actual generation capacity that can be dispatched to the grid after accounting for technical constraints, maintenance schedules, fuel availability, and transmission limitations (EC, 2024; GRIDCo, 2023). The disparity between installed and available capacity has become a critical determinant of electricity reliability in Ghana and has contributed to recurring power supply disruptions despite apparent generation surpluses (Baiden, 2024; Obeng, 2018; Nyasapoh, Gyamfi, Debrah et al., 2024).
The gap between installed and available capacity is mediated by several operational and institutional factors. Fuel supply reliability, particularly the availability of natural gas from the Jubilee, TEN, and Sankofa fields and supplies managed by the Ghana National Petroleum Corporation (GNPC) and the Ghana National Gas Company (GNGC), significantly influences thermal power plant performance (GNPC, 2023; GNGC, 2024). Historical interruptions in domestic gas supply and imported gas from Nigeria through the West African Gas Pipeline have periodically reduced thermal generation output and constrained system reliability (World Bank, 2023; Ministry of Energy, 2023).
Operational reliability is further influenced by maintenance practices and transmission system efficiency. Inadequate maintenance of generation assets and aging transmission infrastructure have contributed to forced outages and increased technical losses within the power system (GRIDCo, 2023; International Energy Agency [IEA], 2022). The Ghana Grid Company (GRIDCo), as the national transmission system operator, plays a critical role in ensuring grid stability, managing reserve margins, and minimizing transmission constraints that affect power delivery (GRIDCo, 2023).
On the demand side, electricity consumption patterns are increasingly shaped by rapid urbanization, industrial expansion, population growth, and economic development (Nunoo, Essandoh-Yedu, Twum et al., 2025; World Bank, 2024; Energy Commission, 2024). However, weak implementation of demand-side management (DSM) measures and limited adoption of energy efficiency interventions have contributed to rising peak demand levels that place additional stress on the electricity system (Avordeh, Peprah, Quaidoo et al., 2025; Energy Commission, 2024). Although initiatives such as appliance standards, Energy Performance Certification (EPC), and public awareness campaigns have been introduced, their penetration remains insufficient to significantly reduce peak load growth (Nunoo, Essandoh-Yeddu, Twum et al., 2025; IEA, 2022).
The framework therefore posits that electricity reliability in Ghana is determined by the interaction between generation adequacy, fuel supply security, operational efficiency, financial sustainability, and demand-side management effectiveness. Weaknesses in any of these dimensions can widen the reliability gap, resulting in supply deficits, increased load shedding, and reduced system resilience (Bhattacharyya, 2019; Oyedepo, 2021).
2.3. Ghana-Specific Evidence
Empirical studies and sector reports highlight several structural inefficiencies within Ghana’s electricity system. First, the proliferation of independent power producers (IPP) contracts has resulted in overcapacity obligations, where the state incurs capacity charges regardless of actual generation as depicted by Table 1. Ghana’s overcapacity problem was mainly linked to take-or-pay PPAs, where capacity payments were due even when plants were not dispatched (Ponkshe & Chishti, 2022; Ackah, Auth, Kwakye et al., 2021; Kumi, 2017). Public records show excess capacity charges of US$937.5 million paid to three IPPs between 2017–2020, and government later renegotiated PPAs with six IPPs (Ministry of Finance, 2023; Ministry of Energy, 2023). Second, fuel supply constraints, particularly gas supply variability, limit thermal plant utilization, leading to underperformance of installed capacity (Table 2) (GRIDCo, 2025; ACEP, 2024; Osei et al., 2021; Arthur & Asiedu-Okantah, 2021). Table 2 demonstrates that Ghana’s electricity sector challenge between 2016 and 2025 was not merely a shortage of installed generation capacity, but increasingly a fuel availability and reliability problem. While thermal generation capacity expanded significantly through IPPs and state-owned plants (EC, 2024; Asamoah et al., 2023; Essandoh-Yeddu,Akolgo, Kumi et al., 2021), actual utilization was constrained by:
- a)
- Unreliable Nigerian gas imports through WAGP;
- b)
- Domestic gas processing and transmission bottlenecks;
- c)
- Periodic outages and maintenance at the Atuabo Gas Processing Plant;
- d)
- Variability in gas supply from Jubilee, TEN, and Sankofa fields; and
- e)
- Inadequate gas volumes, relative to growing thermal generation requirements.
This created a paradox of simultaneous generation overcapacity and operational underutilization, where Ghana incurred substantial capacity charges under “take-or-pay contracts” (Ponkshe & Chishti, 2022) while many thermal plants could not operate at full output due to fuel supply constraints (Energy Commission, 2024). Third, financial distress within the sector, driven by tariff under-recovery and accumulated debts, constrains maintenance and operational efficiency (World Bank, 2024; PURC, 2024). Table 3 indicates that Ghana’s electricity sector challenges between 2016 and 2025 extended beyond generation adequacy to a persistent financial viability crisis. Tariff under-recovery, high technical and commercial losses, “take-or-pay” obligations to IPPs, fuel procurement costs, and weak revenue collection contributed to a growing debt burden across ECG, VRA, GRIDCo, gas suppliers, and IPPs (World Bank, 2024; PURC, 2024; Ponkshe & Chishti, 2022). By 2025, sector liabilities exceeded US$3 billion, while governments repeatedly relied on the Energy Sector Recovery Programme (ESRP), Cash Waterfall Mechanism (CWM), and ESLA-backed financing to prevent systemic collapse (World Bank, 2024; PURC, 2024). These financial pressures constrained preventive maintenance, delayed infrastructure upgrades, reduced operational efficiency, and weakened overall power system reliability despite the existence of substantial installed generation capacity (PURC, 2023). Finally, weak demand-side management, including limited adoption of energy efficiency standards such as EPC, contributes to excessive peak demand (Energy Commission, 2025b; Nyasapoh et al., 2023; Peprah et al., 2023; Gyamfi et al., 2015). Table 4 suggest although Ghana achieved notable success with appliance efficiency programmes, particularly through CFL replacement initiatives and Minimum Energy Performance Standards (MEPS) (Baidoo, Danquah, Nunoo et al., 2024), the broader demand-side management framework remained relatively weak between 2016 and 2025. Energy efficiency interventions were largely concentrated on appliances rather than comprehensive building-level energy management and mandatory Energy Performance Certification (EPC) (Nunoo, Adam, Essandoh-Yeddu et al., 2026; Nunoo, Essandoh-Yeddu, Twum et al., 2025). Consequently, significant opportunities for reducing electricity consumption in residential, commercial, and public buildings remained unrealized. Existing studies estimate that lighting efficiency programmes alone reduced peak demand by approximately 200–240 MW, while appliance standards generated cumulative electricity savings exceeding 8,317 GWh. However, the absence of widespread EPC implementation and building energy benchmarking limited the sector’s ability to curb demand growth Nunoo, Adam, Essandoh-Yeddoh et al., 2025). As peak demand increased from below 3,000 MW in the mid-2010s to approximately 3,952 MW in 2024 and projected levels above 4,100 MW in 2025, demand-side inefficiencies contributed to increased reliance on thermal generation, higher fuel costs, and continued pressure on Ghana’s electricity system despite installed generation overcapacity (IEA, 2022).
2.4. Energy Deficit Versus Reliability Deficit in Ghana
The distinction between energy deficit and reliability deficit is particularly salient in the Ghanaian context. While the pre-2016 period was characterized by genuine supply shortages, the post-2016 era reflects a reliability crisis where system inefficiencies prevent the effective utilization of available capacity. This transition underscores the need for a paradigm shift in energy policy from capacity expansion to system optimization.
2.5. Conceptual Framework: Reliability Deficit Model
This study conceptualises Ghana’s electricity challenge as a transition from a conventional energy deficit problem to a reliability deficit problem. In a conventional energy deficit, total installed or dependable capacity is structurally lower than electricity demand. In contrast, a reliability deficit occurs where installed capacity appears adequate on paper, but effective available capacity is constrained by outages, fuel supply instability, financial arrears, grid bottlenecks and weak demand-side management. In Ghana, this distinction is important because recent official energy outlooks show that installed capacity has remained above projected system peak demand. For instance, the Energy Commission projected that in 2025 Ghana would have about 5,260 MW installed grid capacity and 4,855 MW dependable capacity against projected peak demand of about 4,125 MW, implying a formal reserve margin of about 18%. However, this technical adequacy does not automatically translate into reliable electricity supply when planned outages, unplanned outages, fuel supply constraints and payment arrears are considered (Figure 1).
The framework shows that Ghana’s electricity supply gap is not determined solely by the difference between installed capacity and demand. Rather, the decisive variable is available dispatchable capacity, which is the portion of dependable capacity that can actually be delivered at peak demand. This available capacity is shaped by the reliability of thermal plants, gas supply, hydropower inflows, transmission efficiency and the financial health of the sector. The framework also introduces Energy Performance Certification (EPC) as a demand-side moderating variable. EPC reduces the pressure on peak demand by promoting efficient buildings, appliances and energy management systems. In this model, EPC does not create new generation capacity; instead, it reduces the required peak load, thereby improving the reserve margin and reducing the likelihood of load shedding (Nunoo, Adam, Essandoh-Yeddu,2026).
2.6. Ghana-Specific Evidence
Ghana’s electricity sector evidence confirms that capacity expansion alone has not fully resolved power reliability challenges. The uploaded study shows installed capacity increasing from about 4,100 MW in 2016 to more than 5,200 MW by 2025, while available capacity begins to decline relative to peak demand after 2023. This is consistent with sector evidence showing that Ghana’s grid-connected installed capacity has remained above peak demand, yet the system continues to experience vulnerability due to fuel constraints, outages, financial arrears and transmission limitations. The Energy Commission’s 2024 Energy Outlook reported that Ghana had 5,194 MW installed grid capacity and 4,756 MW dependable capacity as of late 2023, increasing to 5,492.1 MW installed capacity when embedded generation was included. GRIDCo’s 2025 Electricity Supply Plan projected Ghana’s 2025 system peak demand at about 4,338 MW, an increase of 386 MW over the 2024 peak demand of 3,952 MW, representing annual peak-demand growth of about 9.8%.

Table 5.
Ghana Electricity Sector Evidence Supporting the Reliability Deficit Argument.
| Evidence Area | Ghana-Specific Observation | Policy Reliability Implication |
|---|---|---|
| Installed capacity | Installed capacity exceeds system peak demand in recent years | Ghana does not face a pure generation capacity deficit |
| Dependable/available capacity | Dependable capacity is lower than installed capacity, and actual availability can fall further during outages | Reliability depends on operational availability, not installed capacity alone |
| Gas/Fuel supply | Thermal generation is highly dependent on reliable domestic and imported gas supply | Fuel disruption reduces dispatchable capacity |
| IPP and financial obligations | Legacy arrears to IPPs and gas suppliers have affected sector liquidity | Financial distress can translate into operational unreliability |
| Transmission losses | Transmission losses and grid congestion reduce electricity delivered to load centres | Grid inefficiency converts capacity adequacy into reliability deficit |
| Demand-side weakness | Limited demand-side management increases peak pressure | EPC and efficiency programmes can reduce peak demand and improve reserve margins |
Source: Author’s construct based on field data, 2026.
Financial constraints are particularly important. Ghana’s power sector has faced large arrears to IPPs and gas suppliers. Reuters reported that Ghana aimed in 2025 to reduce about US$2.5 billion owed to independent power producers and gas suppliers, while noting that inefficiencies and revenue losses at ECG were contributing to sector stress. In January 2026, Reuters further reported that the government had paid US$1.47 billion in 2025 to clear legacy energy-sector debts, including payments to IPPs and gas suppliers, showing the scale of the financial deficit affecting sector stability.
Figure 2.
Ghana-Specific Reliability Deficit Pathway.
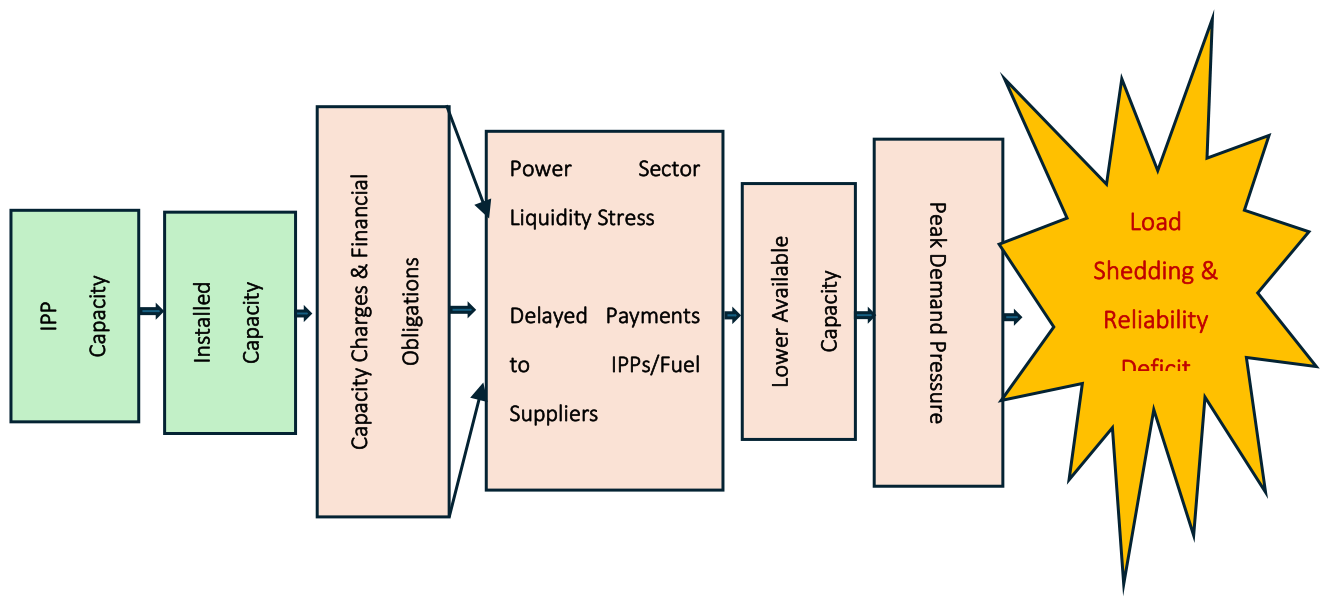
This evidence shows that Ghana’s electricity problem is multidimensional. The country has made important progress in generation expansion, but system reliability is constrained by the ability to convert installed capacity into dispatchable electricity at the time and location where demand occurs.
2.7. Energy Deficit Versus Reliability Deficit
The distinction between an energy deficit and a reliability deficit is central to this study. An energy deficit occurs when the physical electricity system lacks enough generation capacity to meet demand. A reliability deficit occurs when generation capacity exists but is unavailable, undeliverable or financially constrained (Bhattacharyya, 2019) (Table 6). Ghana’s post-2016 experience reflects the second condition.
This distinction is analytically important because it changes the policy prescription. If Ghana’s problem were simply an energy deficit, the solution would be additional generation capacity (Baiden, 2024; Obeng, 2018). However, if the problem is a reliability deficit, the solution lies in improving the performance of existing assets, strengthening the gas-to-power chain, reducing grid losses, addressing financial arrears and lowering peak demand through efficiency interventions ((Figure 3).
3. Methodology
This study adopts a mixed-methods approach combining qualitative literature synthesis with quantitative modelling. The research design is anchored in a structured review of peer-reviewed journal articles, policy documents, and industry reports published between 2010 and 2025. Data sources include the Energy Commission for generation statistics, Ghana Grid Company for demand and transmission data, the Ministry of Energy for policy frameworks, and gas supply data from Ghana National Petroleum Corporation and Ghana National Gas Company.
3.1. Analytical Framework
The analytical framework combines three mutually reinforcing methods: descriptive trend analysis, econometric modelling and energy performance certification (EPC)-based demand reduction modelling (Figure 4). This triangulated approach is suitable because Ghana’s electricity reliability problem cannot be explained by a single variable. It is simultaneously a technical, financial, infrastructural and demand-side issue (Ackah, Auth, Kwakye et al., 2021). The first stage uses descriptive trend analysis to compare installed capacity, available capacity and peak demand between 2016 and 2025. This identifies whether the system is experiencing a true capacity deficit or an operational reliability gap. The key comparison is not simply installed capacity versus peak demand, but available capacity versus peak demand. This is because installed capacity measures theoretical supply, while available capacity measures electricity that can actually be dispatched. The second stage applies multiple regression modelling to estimate the relationship between electricity deficit and selected explanatory variables. These variables include generation outages, gas supply, transmission losses and hydropower output. This stage identifies the relative contribution of each driver to the supply gap. The third stage applies EPC-based demand reduction modelling. This estimates how improvements in energy efficiency could reduce peak demand under conservative, moderate and aggressive scenarios. This is essential because Ghana’s reliability problem can be addressed not only by improving supply, but also by reducing avoidable demand.
The framework therefore allows the study to move from description to explanation and finally to intervention modelling. Descriptive analysis shows the existence of the reliability gap. Regression analysis explains the drivers of the gap. EPC modelling demonstrates how demand-side reforms can reduce or eliminate the gap.
3.2. Econometric Model Specification
The econometric model estimates the determinants of Ghana’s electricity deficit (Kuusaana, Smith & Monstadt, 2025; Koranteng Nkansah, Suleman, Ackah et al., 2021; Adom et al., 2021; Adom, 2019; Bhattacharyya, 2011). The dependent variable is electricity deficit, measured as the difference between peak demand and available capacity. A positive deficit implies that peak demand exceeds available capacity, creating load-shedding risk. A negative value implies that available capacity exceeds peak demand, suggesting reserve capacity.
The model is specified as:
Where:
A positive value of indicates a supply shortfall, while a negative value indicates surplus available capacity (Kuusaana, Smith & Monstadt, 2025; Adom et al., 2021; Adom, 2019; Bhattacharyya, 2011) as explained in Table 7.
From Table 7, the expected relationship between outages and electricity deficit is positive. When more generation capacity is unavailable due to forced outages, planned maintenance or technical faults, the system’s available capacity declines. This increases the likelihood that peak demand will exceed available supply. Gas supply is expected to have a negative relationship with electricity deficit. Ghana’s generation mix relies heavily on thermal power, much of which depends on natural gas. When gas supply is stable, thermal plants can operate more reliably. When gas supply is constrained, available generation falls, and the deficit widens. Transmission losses are expected to increase electricity deficits because they reduce the amount of electricity delivered from generation points to load centers. Even when generation capacity is adequate, high technical losses and grid congestion weaken reliability. Hydropower output is expected to reduce deficits because hydro plants provide important system stability. However, hydropower output is vulnerable to hydrological variability, climate change and reservoir management constraints.
3.3. EPC Demand Reduction Model
The EPC demand reduction model estimates how energy efficiency improvements can reduce Ghana’s peak electricity demand. The model is based on the principle that electricity reliability can be improved not only by increasing supply but also by reducing inefficient demand (Nunoo, Essandoh-Yeddu & Twum et al., 2025). EPC works by certifying and improving the energy performance of buildings, appliances and energy-consuming systems (Nunoo, Adam, Essandoh-Yeddu et al., 2025). The basic EPC model is specified as:
Where is the new peak demand after efficiency improvement, is baseline peak demand, and is the demand reduction rate.
The avoided demand is estimated as:
The post-EPC supply gap is estimated as:
If is positive, the system remains in deficit. If it is zero or negative, EPC has eliminated the deficit.
From Table 9, the model estimates 2025 baseline peak demand at 4,306 MW and available capacity at 3,800 MW, producing a deficit of about 506 MW. Under a conservative EPC scenario of 10% in Table 8, peak demand falls by 431 MW to 3,875 MW, leaving only a small residual gap. Under a moderate EPC scenario of 18%, demand falls to 3,531 MW, which is below available capacity. Under an aggressive EPC scenario of 25%, demand falls to 3,230 MW, creating a stronger reserve margin. This outcome demonstrates that EPC is not merely an environmental policy instrument. It is also a reliability-enhancing tool. In Ghana, EPC could reduce pressure on generation, lower fuel requirements, reduce emissions, defer costly generation investments and support renewable energy integration.
Table 8.
EPC Demand Reduction Scenarios based on 2025 peak demand.
| Scenario | Reduction Rate | Demand Saved (MW) | New Peak Demand (MW) | Reliability Implication |
|---|---|---|---|---|
| Baseline | 0% | 0 | 4,306 | Deficit persists |
| Conservative EPC | 10% | 431 | 3,875 | Deficit substantially reduced |
| Moderate EPC | 18% | 775 | 3,531 | Deficit eliminated under uploaded data assumptions |
| Aggressive EPC | 25% | 1,076 | 3,230 | Strong reserve margin restored |
Source: Author’s construct based on field data, 2026.
Table 9.
Installed Capacity, Available Capacity, Peak Demand and Deficit in Ghana (2016-2025).
| Year | Installed Capacity (MW) |
Available Capacity (MW) |
Peak Demand (MW) |
Deficit MW |
|---|---|---|---|---|
| 2016 | 4,100 | 3,500 | 2,500 | -1,000 |
| 2017 | 4,500 | 3,700 | 2,600 | -1,100 |
| 2018 | 4,800 | 4,000 | 2,800 | -1,200 |
| 2019 | 5,000 | 4,100 | 2,900 | -1,200 |
| 2020 | 5,100 | 4,200 | 3,000 | -1,200 |
| 2021 | 5,200 | 4,200 | 3,300 | -900 |
| 2022 | 5,300 | 4,100 | 3,600 | -500 |
| 2023 | 5,492 | 4,100 | 3,900 | -200 |
| 2024 | 5,260 | 3,900 | 4,125 | 225 |
| 2025 | 5,260 | 3,800 | 4,306 | 506 |
Source: Author’s construct based on field data, 2026.
4. Results and Discussion
4.1. Trend Analysis of Installed Capacity, Available Capacity and Peak Demand
The trend analysis in Table 9 shows that Ghana’s electricity system has experienced a growing divergence between installed capacity and effective available capacity. Installed capacity increased significantly between 2016 and 2025, but available capacity did not grow at the same pace. Peak demand, meanwhile, increased steadily due to population growth, urbanisation, industrialisation, commercial expansion and rising household electricity consumption.
The data (Table 9) show that Ghana had surplus available capacity between 2016 and 2023. However, the reserve margin narrowed over time. In 2024 and 2025, peak demand exceeded available capacity in the uploaded model, producing positive deficits of 225 MW and 506 MW respectively. This transition marks the shift from apparent capacity adequacy to reliability stress, clearly depicted by Figure 5.
Figure 5 illustrates that Ghana’s installed capacity remains high, but available capacity declines relative to peak demand. The reliability crisis emerges not because the country has no installed capacity, but because available capacity becomes insufficient at peak periods. Available capacity declined relative to peak demand from 2023 onward, producing a positive reliability gap in 2024 and 2025. This confirms that Ghana’s recent electricity challenge is better explained as a reliability deficit rather than a pure generation-capacity deficit. It supports the central argument that Ghana’s electricity supply challenge is driven less by inadequate installed capacity and more by outages, fuel constraints, financial stress and grid inefficiencies.
4.2. Regression Analysis
The regression model (Table 7) identifies outages, gas supply, transmission losses and hydropower output as key determinants of electricity deficits. The results indicate that generation outages have the strongest positive effect on electricity deficits (β = 0.62, p < 0.01), confirming that operational inefficiencies are the dominant driver. Gas supply exhibits a negative relationship with deficits (β = -0.48), underscoring the importance of fuel security. Transmission losses and hydropower variability also significantly influence system reliability. With an R2 value of 0.78, suggesting that the explanatory variables account for about 78% of the variation in electricity deficits, the model demonstrates strong explanatory power, indicating that the selected variables capture the key determinants of Ghana’s electricity supply gap (Table 10).
The coefficient for outages is positive and statistically significant. This means that as generation outages increase, electricity deficits also increase. This confirms the argument that the reliability of Ghana’s electricity system is strongly determined by plant availability (Kuusaana, Monyei, & de Vries, 2025; Adom et al., 2021; Adom, 2019; Bhattacharyya, 2011).
Even when installed capacity is high, forced outages reduce dispatchable supply. Gas supply has a negative and statistically significant coefficient. This means that higher gas availability reduces electricity deficits. The finding is consistent with Ghana’s thermal-generation dependence. Stable gas supply improves plant dispatch, while gas shortages can force plants to operate below capacity or rely on more expensive liquid fuels. Transmission losses also show a positive relationship with electricity deficits. This indicates that network inefficiencies reduce the volume of electricity delivered to consumers. GRIDCo’s 2024 Annual Report highlights the importance of maintaining transmission losses below target levels, confirming that losses remain a key system-performance indicator. Hydropower output has a negative coefficient, showing that higher hydro generation reduces electricity deficits. However, hydro reliability is exposed to seasonal and climatic variability. Therefore, while hydropower remains important for system stability, Ghana cannot rely on hydro alone to guarantee reliability.
4.3. EPC-Based Demand Reduction Modelling
The novelty of the research is identified with the introduction of an EPC model, evaluating the impact of energy efficiency on peak demand. With a baseline peak demand of 4,306 MW in 2025 (Table 11), moderate EPC adoption (18% reduction) reduces demand to approximately 3,531 MW, effectively eliminating the deficit. This finding demonstrates that demand-side interventions can play a transformative role in addressing Ghana’s electricity reliability challenges. The EPC model shows that energy efficiency can significantly improve electricity reliability by reducing peak demand. The baseline deficit in 2025 is estimated at 506 MW under the uploaded dataset. A conservative EPC scenario reduces demand by 431 MW, almost eliminating the deficit. A moderate EPC scenario reduces demand by 775 MW, fully eliminating the deficit. An aggressive EPC scenario reduces demand by 1,076 MW, creating a substantial reserve margin.
The EPC results provide one of the most important findings of the study. Ghana’s electricity reliability crisis can be significantly reduced through demand-side reforms (Nunoo, Adam Essandoh-Yeddu et al., 2026). Instead of relying only on new generation investments, Ghana can improve reliability by reducing inefficient peak demand in buildings, public institutions, commercial facilities and industry (Figure 6). This suggests that EPC should be treated as a national energy security instrument (Nunoo, Essandoh-Yeddu, Twum et al., 2025). It can reduce electricity demand, lower emissions, improve grid stability and support Ghana’s energy transition objectives. Ghana’s Energy Transition Framework projects long-term electricity demand growth and large-scale investments in clean energy, including renewables and other low-carbon technologies. Demand-side efficiency is therefore essential to avoid overbuilding generation capacity while improving affordability and reliability.
4.4. Spatial Reliability Deficit Analysis and Management
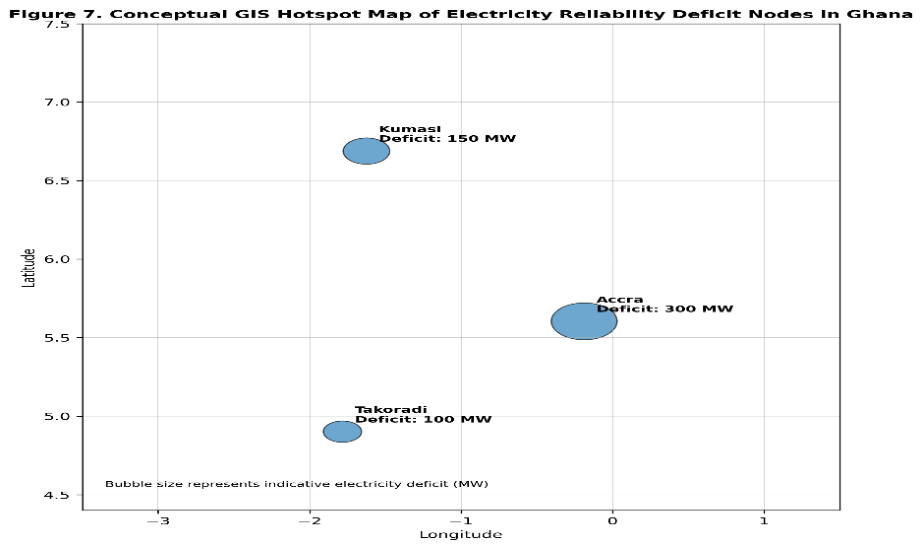
From field data, national electricity reliability challenges are spatially uneven. The key demand impact is concentrated in urban and industrial centres such as Accra, Kumasi and Takoradi. These locations host high residential, commercial, industrial and port-related electricity demand. The GIS dataset identifies all cities and towns in Ghana. However, Accra, Kumasi and Takoradi emerged as major demand and deficit hotspots
Table 12.
Indicative GIS Energy Deficit Hotspots.
| City | Latitude | Longitude | Peak Demand (MW) | Supply (MW) | Deficit (MW) |
| Accra | 5.6037 | -0.1870 | 1,800 | 1,500 | 300 |
| Kumasi | 6.6885 | -1.6244 | 900 | 750 | 150 |
| Takoradi | 4.9016 | -1.7831 | 700 | 600 | 100 |
Source: GRIDCo 2025, 2023.
Figure 7.
Conceptual GIS Hotspot Map of Electricity Reliability Deficit Nodes in Ghana.
4.5. Integrated Discussion
The evidence confirms Ghana’s electricity challenge can no longer be adequately supported by the installed capacity shortage explanation. Instead, the energy sector (system) is constrained by reliability deficits arising from operational, financial, fuel-supply and infrastructural weaknesses. The first major finding is that installed capacity expansion has not guaranteed reliable power supply. Although Ghana has invested heavily in generation capacity, the gap between installed and available capacity remains significant. The outcome reflects plant outages, fuel limitations and maintenance constraints. The second major finding identify financial liquidity as a hurdle as it affects electricity reliability. Energy-sector debt weakens the ability of utilities and state institutions to pay IPPs, procure fuel and maintain infrastructure. Recent debt repayments to IPPs and gas suppliers demonstrate that financial reform is not separate from technical reliability; it is central to it. The third major finding is that gas supply stability is essential. Ghana’s thermal generation fleet depends heavily on natural gas. Any disruption in gas supply directly affects available capacity. Therefore, gas-to-power coordination involving GNPC, Ghana Gas, power producers and GRIDCo is essential. The fourth major finding is that transmission efficiency remains critical. Even when electricity is generated, grid losses and congestion can reduce delivered supply. Grid modernisation, substation upgrades and investment in transmission redundancy are therefore necessary. The fifth major finding is that EPC and energy efficiency offer a powerful demand-side solution. Moderate EPC implementation could eliminate the modelled 2025 deficit. This suggests that Ghana should treat energy efficiency as equivalent to a “virtual power plant” because avoided demand can perform the same reliability function as new generation capacity.
Overall, the results demonstrate that Ghana’s electricity sector has entered a reliability-deficit regime. Installed capacity remains important, but it is no longer the most decisive indicator of electricity security. The relevant measure is available, dispatchable and deliverable capacity relative to peak demand. The study therefore recommends a shift from capacity-centred planning to reliability-centred planning. This requires integrated action across generation availability, gas supply security, power-sector financial reform, transmission efficiency and demand-side management. EPC-based energy efficiency should be mainstreamed as a strategic instrument for reducing peak demand, lowering system costs and strengthening Ghana’s just energy transition pathway.
5. Conclusions and Recommendations
This study demonstrates that Ghana’s electricity sector has transitioned from a capacity deficit to a reliability deficit regime. While investments in generation infrastructure have successfully expanded installed capacity, systemic inefficiencies continue to undermine supply reliability. Policy interventions should therefore prioritize improving operational efficiency through enhanced maintenance regimes, strengthening fuel supply security, and reducing transmission losses. Financial restructuring of the power sector is also critical to addressing liquidity constraints and ensuring sustainable operations. Equally important is the integration of demand-side management strategies, particularly EPC implementation, which offers a cost-effective pathway for reducing peak demand and enhancing system resilience. Future energy planning in Ghana must adopt a holistic approach that balances supply expansion with efficiency improvements and institutional reforms.
Funding
This study received no external funding.
Acknowledgments
The authors thank the Director of the Institute for Oil and Gas Studie, University of Cape Coast for the use of their laboratory and facility for data, data processing literature review and validation of data.
Ethical Approval
Not applicable as the study made use of no human or animal subject.
Consent to Participate
Not applicable as the study made use of no human or animal subject.
Consent to Publish
Not applicable.
Authors’ Contributions
All the authors contributed to the completion of this research, from the conceptualization, background, literature, methodology and results sections through to the initial and final draft of the paper. All authors read and, approved the final manuscript.
Competing Interests
The authors declare no competing interest of any form.
Availability of Data
Data will be made available upon reasonable request.
References
- Ackah, I., Auth, K., Kwakye, J., & Moss, T. (2021). A case study of Ghana’s power purchase agreements. Energy for Growth Hub & Institute of Economic Affairs (IEA Ghana). Washington, DC: Energy for Growth Hub. Retrieved from https://energyforgrowth.org/wp-content/uploads/2021/03/A-Case-Study-of-Ghanas-Power-Purchase-Agreements.pdf.
- Acheampong, T., Menyeh, B. O., & Agbevivi, D. E. (2021). Ghana’s changing electricity supply mix and tariff pricing regime: Implications for the energy trilemma. Oil, Gas & Energy Law, 19, 1–28.
- Adom, P. K. (2019). Electricity supply in Ghana: A multivariate econometric analysis of the impact of climate variability, system losses, and distortions in the water–energy nexus. Energy, 181, 481–495. [CrossRef]
- Adom, P. K., Bekoe, W., Amuakwa-Mensah, F., Mensah, J. T., & Botchway, E. (2021). Determinants of electricity demand in Ghana: The role of power crises. Energy for Sustainable Development, 63, 1–12. [CrossRef]
- Africa Centre for Energy Policy (ACEP). (2024). From generation to distribution: Investigating Ghana’s power sector value chain and its implications for reliable, affordable and clean energy supply. ACEP.
- Andersen, O. W., & Pedersen, R. H. (2023). The paradox of overcapacity in African energy sectors. Energy for Sustainable Development, 72, 83–87. [CrossRef]
- Arthur, J. L., & Asiedu-Okantah, S. (2021). Strategies for improving gas supplies for sustainable power generation in Ghana. Journal of Power and Energy Engineering, 9(9), 1–18. [CrossRef]
- Asumadu-Sarkodie, S., & Owusu, P. A. (2016). A review of Ghana’s energy sector national energy statistics and policy framework. Cogent Engineering, 3(1), 1155274. [CrossRef]
- Avordeh, T. K., Peprah, F., Quaidoo, C., & Opare-Boateng, R. (2025). Demand response as a catalyst: Ghana’s strategic pathway to 10% renewable energy by 2030. Energy Reports, 14, 3033–3047. [CrossRef]
- Baiden, J. K. (2024). The electricity tariff and utility performance: Evidence from Ghana, Uganda, and Namibia electricity markets. In I. Ackah & C. Gatete (Eds.), Energy Regulation in Africa (pp. 235–253). Springer. [CrossRef]
- Baidoo, A. N. A., Danquah, J. A., Nunoo, E. K., et al. (2024). Households’ energy conservation and efficiency awareness practices in the Cape Coast Metropolis of Ghana. Discover Sustainability, 5, Article 2. [CrossRef]
- Bhattacharyya, S. C. (2019). Energy economics: Concepts, issues, markets and governance (3rd ed.). Springer. [CrossRef]
- Diawuo, F. A., Kumi, E. N., Sika, F., & Modjinou, M. (2018). The energy efficiency situation in Ghana. Renewable and Sustainable Energy Reviews, 82, 1415–1423. [CrossRef]
- Energy Commission. (2024). National energy statistics 2000–2023. Energy Commission of Ghana.
- Energy Commission. (2025a). 2025 national energy statistical bulletin. Energy Commission of Ghana.
- Energy Commission. (2025b). 2025 energy outlook for Ghana. Energy Commission of Ghana.
- Essandoh, E. O., Akolgo, G. A., Kumi, E. N., & Atta-Darkwa, T. (2021). Review and analysis of Ghana’s power sector policies, programmes and reforms. Journal of Energy and Natural Resource Management, 6(1), 1–6.
- Fiasorgbor, N., Abdulai, R., & Antwi-Yeboah, M. (2022). A review of the characteristics and challenges of electricity distribution in Ghana: Case study of the Northern Electricity Distribution Company. Energy and Power Engineering, 14, 615–634. [CrossRef]
- Ghana Grid Company Limited (GRIDCo). (2023). National transmission system performance report and electricity supply plan 2024–2028. GRIDCo.
- Ghana Grid Company Limited (GRIDCo). (2025). 2025 electricity supply plan for Ghana. GRIDCo.
- Ghana National Gas Company. (2024). Annual report and financial statements 2023. Ghana National Gas Company.
- Ghana National Petroleum Corporation (GNPC). (2023). Annual report and financial statements 2022. GNPC.
- Gyamfi, S., Modjinou, M., & Djordjevic, S. (2015). Improving electricity supply security in Ghana: The potential and feasibility of renewable energy. Renewable and Sustainable Energy Reviews, 43, 1035–1045. [CrossRef]
- International Energy Agency. (2022). Africa energy outlook 2022. IEA.
- James, G. A., Ahiabor, F. S., & Abalo, E. M. (2025). Analysing the barriers to renewable energy adoption in Ghana using Delphi and a fuzzy synthetic evaluation approach. Energy for Sustainable Development, 85, 101667. [CrossRef]
- Koranteng Nkansah, H., Suleman, S., Ackah, I., Amarh, B. A., Eduah, D., & Jinapor, J. A. (2022). Determinants of electricity demand in Côte d’Ivoire, Ghana, Nigeria and Senegal. Energies, 15(14), 4998. [CrossRef]
- Kumi, E. N. (2017). The electricity situation in Ghana: Challenges and opportunities (CGD Policy Paper No. 109). Center for Global Development.
- Kuusaana, J. A. E., Smith, S., & Monstadt, J. (2025). Infrastructure resilience and electricity policy in Ghana and Tanzania. Energy for Sustainable Development, 85, 101680. [CrossRef]
- Marriette Sakah, M., Diawuo, F. A., Katzenbach, R., & Gyamfi, S. (2017). Towards a sustainable electrification in Ghana: A review of renewable energy deployment policies. Renewable and Sustainable Energy Reviews, 79, 544–557. [CrossRef]
- Ministry of Energy. (2023). Ghana energy transition framework. Government of Ghana.
- Ministry of Energy and Green Transition. (2025). Programme-based budget estimates. Government of Ghana.
- Ministry of Finance. (2019). Energy sector recovery programme. Government of Ghana.
- Ministry of Finance. (2023). Energy sector recovery programme document. Government of Ghana.
- Ministry of Finance. (2024). Annual report on the management of the Energy Sector Levies Act. Government of Ghana.
- Nunoo, E. K., Adam, M., Essandoh-Yeddu, J., Twum, E., Oteng, C., Asafo, J., & Kwabena, P. (2026). Energy performance certification in West Africa: Societal impact and future pathways. Societal Impacts, 7, 100164. [CrossRef]
- Nunoo, E. K., Essandoh-Yeddu, J., Twum, E., Oteng, C., Asafo, J., & Kwabena, P. (2025). The future of energy performance certification: A comparative assessment of challenges, innovations, and policy pathways in West Africa. Preprints. [CrossRef]
- Nyasapoh, M. A., Debrah, S. K., & Twerefou, D. K. (2023). Long-term electricity generation analysis and policy implications: The case of Ghana. Cogent Engineering, 10(1). [CrossRef]
- Nyasapoh, M. A., Elorm, M. D., & Derkyi, N. S. A. (2022). The role of renewable energies in sustainable development and energy transition in Ghana. Scientific African, 16, e01199. [CrossRef]
- Nyasapoh, M. A., Gyamfi, S., Debrah, S. K., Gabbar, H. A., Derkyi, A., & Sarfo, N. (2024). Ghana’s path to a sustainable energy future: Assessing renewable (solar and wind) energy penetration in the generation mix. SSRN Electronic Journal. [CrossRef]
- Obeng, N. (2019). Renewable energy and power: A review of the power sector reform and renewable energy law and policy nexus in Ghana. Africa Review, 11(1), 1–17. [CrossRef]
- Odoi-Yorke, F., Bain, J., Agyekum, E. B., Dzebre, D. E. K., Sekyere, C. K. K., Quansah, D. A., & Adaramola, M. S. (2025). Mapping Ghana’s renewable energy research landscape: A bibliometric insight into trends, progress, and policy relevance for sustainable development. International Journal of Ambient Energy, 46(1). [CrossRef]
- Oyedepo, S. O. (2021). Energy and sustainable development in Africa: The reliability challenge and pathways for improvement. Renewable and Sustainable Energy Reviews, 145, 111083. [CrossRef]
- Peprah, F., Gyamfi, S., Effah-Donyina, E., & Amo-Boateng, M. (2023). The pathway for electricity prosumption in Ghana. Energy Policy, 177, 113582. [CrossRef]
- Ponkshe, R., & Chishti, M. (2022). Financing sustainable energy in the Ghanaian electricity sector: Debt accumulation, IPP obligations and financial recovery challenges. In Proceedings of the Utah Valley University Sustainable Development Goals Conference (pp. 1–18). Utah Valley University.
- Public Utilities Regulatory Commission. (2023). Tariff review report. PURC.
- Public Utilities Regulatory Commission. (2024). Third quarter tariff review decisions for electricity and water. PURC.
- Reuters. (2025, May 13). Ghana aims to reduce $2.5 billion debt owed to power producers by year-end. Reuters. https://www.reuters.com.
- Tamakloe, E. K. K. (2022). The impact of energy efficiency programmes in Ghana. In M. W. Shahzad et al. (Eds.), Alternative Energies and Efficiency Evaluation. IntechOpen. [CrossRef]
- World Bank. (2021). Ghana power sector financial recovery report. World Bank.
- World Bank. (2023). Ghana energy sector transformation initiative: Improving power system reliability and financial sustainability. World Bank.
- World Bank. (2024). Ghana energy sector recovery program project appraisal document. World Bank.
- World Bank. (2026). Ghana national energy compact: Mission 300. World Bank.
Figure 1.
Conceptual Framework of Ghana’s Reliability Deficit Model.
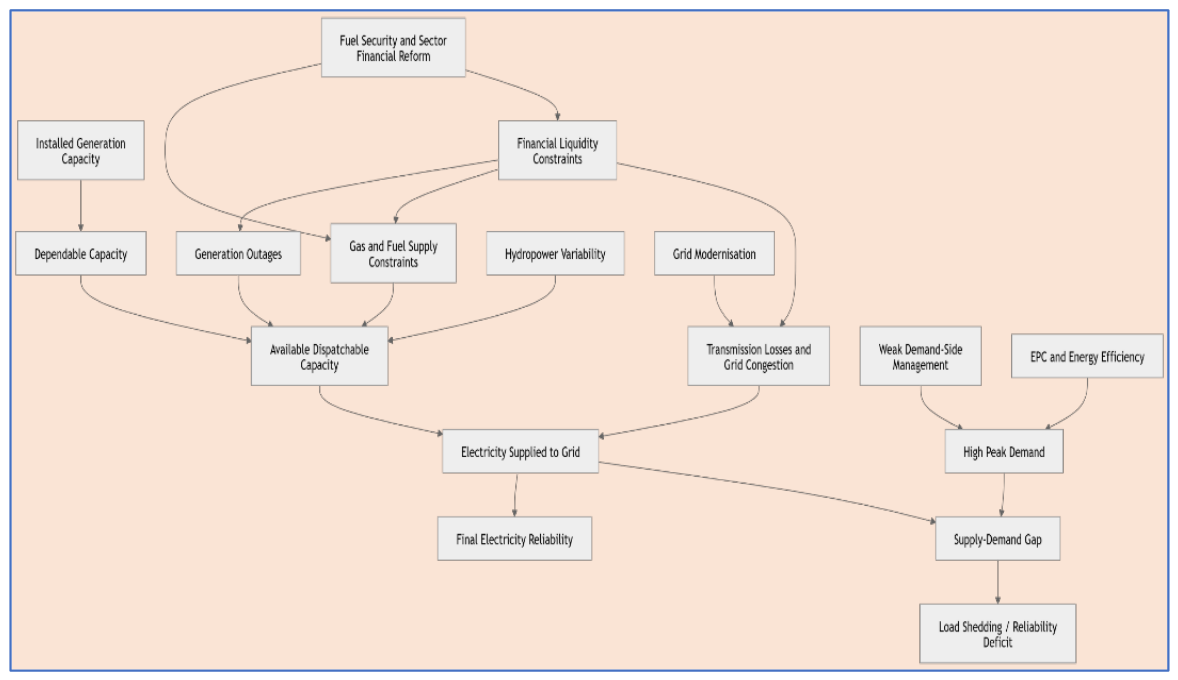
Figure 3.
Analytical distinction between capacity and reliability adequacy.
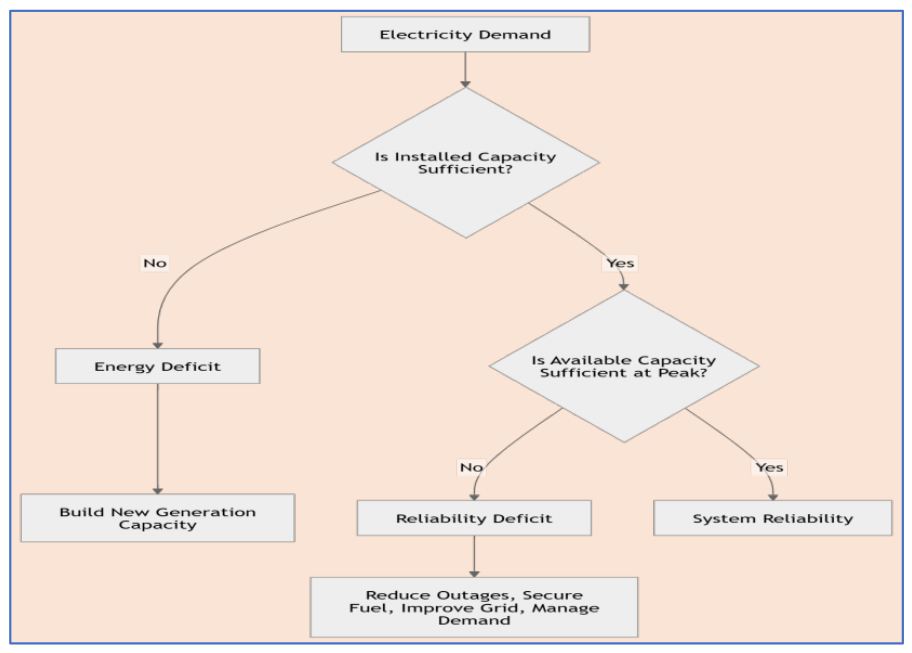
Figure 4.
Integrated Analytical Framework.
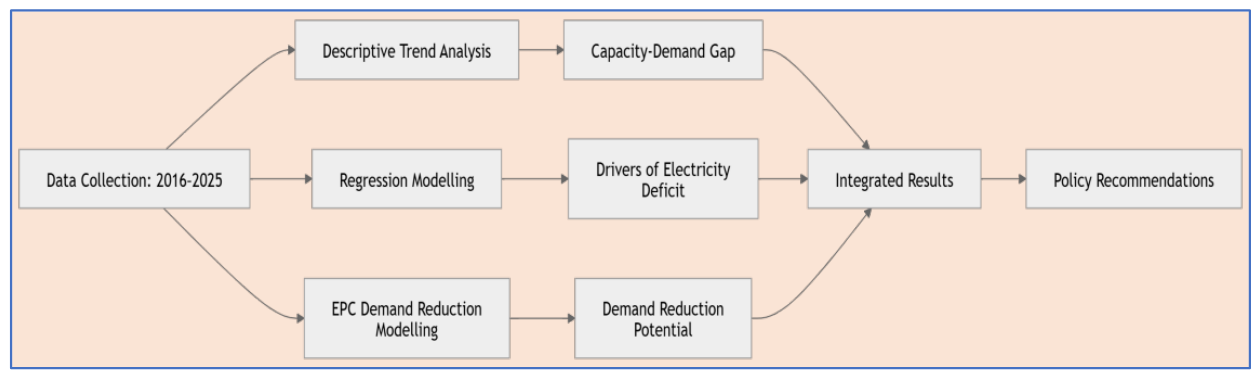
Figure 5.
Capacity-Demand Reliability Curve for Ghana's Electricity Sector, 2016-2025. Source: Authors construct based on field data, 2026.
Figure 5.
Capacity-Demand Reliability Curve for Ghana's Electricity Sector, 2016-2025. Source: Authors construct based on field data, 2026.
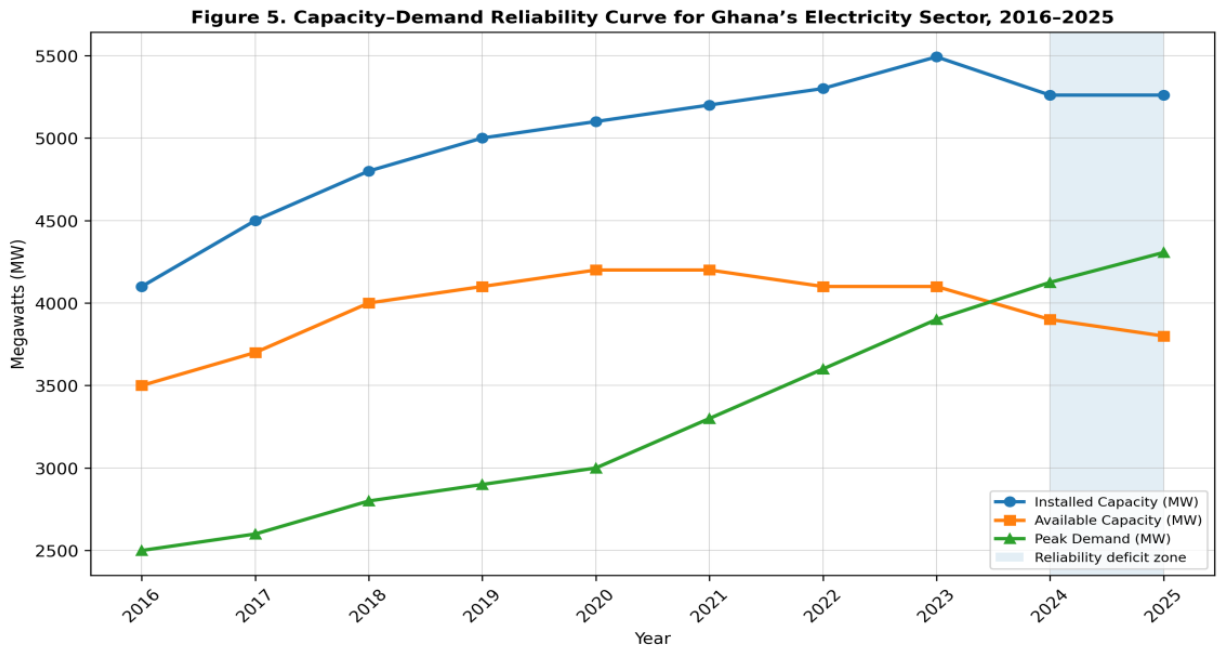
Figure 6.
EPC Demand Reduction and Reliability Impact. Source: Authors construct based on field data, 2026.
Figure 6.
EPC Demand Reduction and Reliability Impact. Source: Authors construct based on field data, 2026.
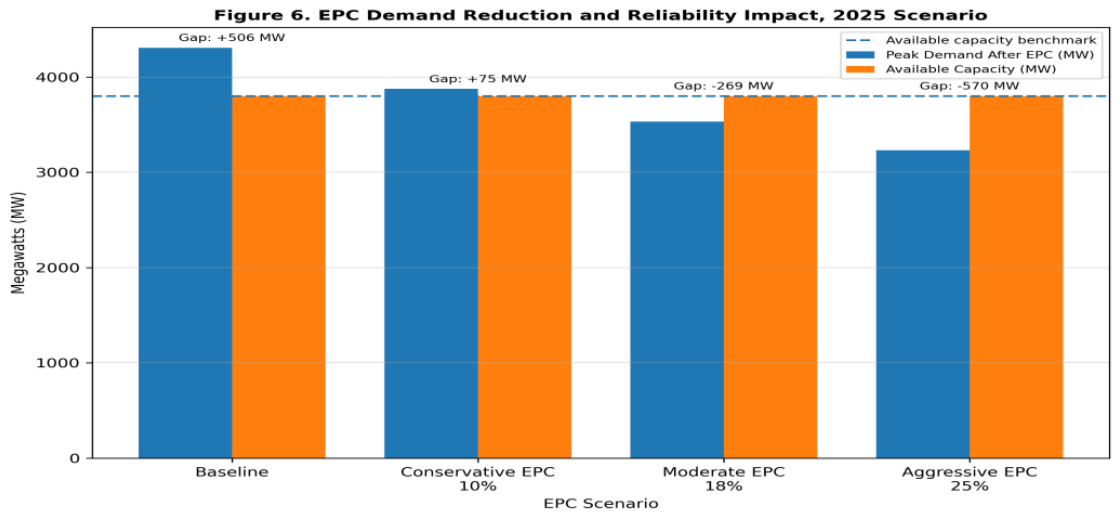
Table 1.
Independent Power Producers (IPPs) and Capacity Payment Obligations (2016–2025).
| IPP/Plant | Installed capacity, (MW) |
Dependable capacity (MW) | Contract / obligation issue | Evidence of excess-capacity / take-or-pay burden | 2016–2025 |
|---|---|---|---|---|---|
| Karpowership Ghana | 470 | 450 | Take-or-pay / capacity-charge PPA | Paid US$359m excess capacity charges, 2017–2020 | 2017–2025 |
| AKSA Energy | 370 | 330 | Take-or-pay / capacity-charge PPA | Paid US$347m excess capacity charges, 2017–2020 | 2017–2025 |
| Cenpower/Kpone IPP | 360 | 340 | Take-or-pay / capacity-charge PPA | Paid US$251m excess capacity charges, mainly 2019–2020 | 2019–2025 |
| Early Power | 200 | 189 | Renegotiated PPA among six IPPs | Named among six IPPs whose PPAs were renegotiated to reduce fiscal burden | 2020s–2025 |
| Twin City Energy/ Amandi | 210 | 201 | Renegotiated PPA among six IPPs | Named among six IPPs whose PPAs were renegotiated | 2020s–2025 |
| Cenit Energy Ltd. | 110 | 100 | Renegotiated PPA among six IPPs | Named among six IPPs whose PPAs were renegotiated | 2016–2025 |
| Sunon Asogli Power | 560 | 512 | IPP with capacity/energy payment exposure, but not one of the six named 2022 renegotiated PPAs | Public sources show it as a major IPP; not clearly identified in the cited six-IPP overcapacity renegotiation list | 2016–2025 |
| BXC Solar | 20 | 16 | Renewable IPP; capacity-payment exposure not clearly documented in public excess-capacity sources | Listed by Energy Commission as grid plant; not clearly tied to take-or-pay overcapacity charges in reviewed public sources | 2018–2025 |
| Meinergy Solar | 20 | 16 | Renewable IPP; capacity-payment exposure not clearly documented in public excess-capacity sources | Listed by Energy Commission; not clearly tied to take-or-pay overcapacity charges in reviewed public sources | 2021–2025 |
Source: Author’s construct based on field data, 2026.
Table 2.
Fuel Supply Constraints and Gas Supply Variability Affecting Thermal Power Plant Utilization in Ghana (2016–2025).
Table 2.
Fuel Supply Constraints and Gas Supply Variability Affecting Thermal Power Plant Utilization in Ghana (2016–2025).
| Year/ Period |
Major Fuel Supply Constraint | Source of Constraint | Impact on Thermal Plant Utilization | Estimated Sector Impact |
|---|---|---|---|---|
| 2017 | Inadequate domestic gas processing and transmission infrastructure | Limited gas processing and transportation capacity | Newly installed thermal plants could not achieve optimal dispatch levels despite excess installed capacity | Underutilization of available thermal generation assets |
| 2018 | Gas supply balancing challenges between domestic fields and WAGP imports | Fuel supply coordination constraints | Thermal generation capacity exceeded available fuel supply volumes | Capacity payments continued despite lower actual generation output |
| 2019 | Periodic gas supply shortfalls and maintenance-related interruptions | Offshore production and gas processing constraints | Reduced dispatch of gas-fired IPPs and VRA plants | Increased use of Light Crude Oil (LCO) and higher generation costs |
| 2020 | Domestic gas supply fluctuations and operational limitations | Sankofa and Jubilee gas production variability | Thermal plants operated below dependable capacity levels | Continued mismatch between installed capacity and fuel availability |
| 2021 | Fuel supply uncertainty during recovery of electricity demand | Gas nomination and transmission limitations | Lower thermal plant utilization rates than installed capacity suggested | Reliability concerns despite apparent generation surplus |
| 2022 | Constraints in natural gas availability and system balancing requirements | Domestic gas field and transmission limitations | Increased dependence on backup liquid fuels for thermal generation | Higher operational costs and lower generation efficiency |
| 2023 | Periodic maintenance activities on gas infrastructure and processing facilities | Atuabo Gas Processing Plant maintenance requirements | Temporary reduction in gas supply to thermal plants | Reduced thermal generation availability during maintenance periods |
| 2024 | Continuing inadequacy of gas supply relative to installed thermal capacity | Fuel supply-demand mismatch | Several thermal units remained under-dispatched despite contractual capacity obligations | Persistence of overcapacity and capacity-payment burden |
| 2025 | Available domestic and imported gas insufficient to fuel all thermal plants | National gas supply deficit estimated at about 136 MMscf requirement gap | Thermal plants projected to require supplementary liquid fuels to meet demand | Estimated thermal fuel expenditure of approximately US$2.02 billion; installed capacity cannot be fully utilized due to fuel limitations |
Source: Author’s construct based on field data, 2026.
Table 3.
Financial Distress in the Electricity Sector (Tariff Under-Recovery, Debt Accumulation, and Operational Inefficiencies)- 2016–2025.
Table 3.
Financial Distress in the Electricity Sector (Tariff Under-Recovery, Debt Accumulation, and Operational Inefficiencies)- 2016–2025.
| Year/ Period |
Financial Distress Indicator | Evidence/Data | Operational and Maintenance Impact | Sector Consequence |
|---|---|---|---|---|
| 2016 | Beginning of major post-dumsor financial strain | Rapid expansion of thermal IPPs and take-or-pay contracts increased fixed payment obligations beyond revenue recovery levels | Utilities faced growing liquidity pressures for fuel procurement and maintenance | Start of structural financial imbalance in the power sector |
| 2017 | Energy sector debt crisis intensifies | Energy sector debt estimated at approximately US$2.5 billion | Delayed payments to IPPs, fuel suppliers, and service providers | Reduced financial flexibility for plant rehabilitation and network investments |
| 2018 | Persistent tariff under-recovery | Electricity tariffs remained below full cost-recovery requirements while generation costs increased | Revenue shortfalls affected ECG, VRA, GRIDCo, and gas suppliers | Accumulation of arrears across the electricity value chain |
| 2019 | Formal adoption of Energy Sector Recovery Programme (ESRP) | Government projected that without reforms, cumulative sector deficits could reach US$8.2 billion by 2027 | Maintenance expenditure increasingly deferred due to funding constraints | Financial sustainability became a national fiscal concern |
| 2020 | Introduction of Cash Waterfall Mechanism (CWM) | ESRP implemented CWM to improve transparency and allocation of revenues among sector entities | Demonstrated severe cash-flow deficiencies within utilities | Revenue allocation prioritized debt servicing over infrastructure upgrades |
| 2021 | Continuing arrears accumulation | High-capacity charges and under-collection by ECG widened sector payment gaps | Delayed maintenance of generation, transmission, and distribution assets | Declining operational efficiency despite installed capacity surplus |
| 2022 | Growing IPP and fuel supplier liabilities | Capacity payment obligations remained significant despite low plant dispatch levels | Limited resources available for preventive maintenance and reliability improvements | Increased risk of plant outages and fuel procurement challenges |
| 2023 | Sector arrears reach critical levels | Energy sector arrears, including legacy debts, estimated at US$2.1 billion (2.8% of GDP) | Maintenance backlogs increased across utilities and generation plants | Financial distress became a major macroeconomic risk identified by IMF |
| 2024 | Large-scale government intervention through ESLA and ESRP | Government transferred GH¢1.04 billion from the Energy Sector Recovery Account to settle payment shortfalls; total ESLA-related transfers exceeded GH¢4.5 billion | Funds increasingly directed toward debt servicing rather than capital maintenance and system modernization | Continued operational inefficiencies despite fiscal support |
| 2024 | ECG payment arrears worsen | ECG reportedly failed to pay approximately GH¢3.9 billion owed to key sector participants including IPPs and fuel suppliers | Increased threat of supply curtailments and reduced maintenance activities | Heightened reliability risks within the power sector |
| 2025 | Peak energy-sector debt burden | Total sector liabilities estimated at over US$3 billion; additional US$1.8 billion required for fuel procurement | Financial resources diverted toward debt settlement and fuel purchases rather than infrastructure upkeep | Constrained operational efficiency and continued vulnerability to supply disruptions |
| 2025 | Legacy debt settlement and sector stabilization efforts | Government paid approximately US$393 million in legacy IPP debts and total energy-sector obligations of about US$1.47 billion during 2025 | Improved payment performance but maintenance deficits accumulated over previous years remained significant | Partial restoration of sector liquidity and investor confidence |
Source: Author’s construct based on field data, 2026.
Table 4.
Evidence of Weak Demand-Side Management and Limited Energy Efficiency Adoption leading to Rising Peak Electricity Demand in Ghana (2016–2025).
Table 4.
Evidence of Weak Demand-Side Management and Limited Energy Efficiency Adoption leading to Rising Peak Electricity Demand in Ghana (2016–2025).
| Year/ Period |
Demand-Side Management (DSM) / Energy Efficiency Status | Evidence and Data | Impact on Peak Demand and System Efficiency | Implication for Power Sector Reliability |
|---|---|---|---|---|
| 2016 | DSM implementation remained limited beyond appliance standards and CFL replacement programmes | Ghana’s energy efficiency efforts were largely concentrated in appliance standards and labelling rather than comprehensive building-level energy management systems | Growth in electricity demand continued despite installed generation surplus | Increasing pressure on generation and distribution systems |
| 2017 | Limited adoption of building energy efficiency frameworks | Absence of mandatory National Energy Performance Certification (EPC) system for buildings reduced incentives for efficient energy consumption | Commercial and residential buildings continued to contribute significantly to inefficient electricity consumption patterns | Higher peak demand requirements and increased generation reserve margins |
| 2018 | Energy efficiency programmes focused mainly on appliances rather than whole-building performance | Energy efficiency review showed CFL replacement programmes offset approximately 200–240 MW of peak demand, demonstrating the potential of DSM interventions | Without broader efficiency programmes, peak demand continued to rise with urbanization and appliance ownership growth | Increased dependence on thermal generation capacity |
| 2019 | Slow expansion of Minimum Energy Performance Standards (MEPS) | Existing standards primarily targeted refrigerators, air conditioners and lighting appliances; building-level efficiency enforcement remained weak | Significant electricity savings opportunities remained unrealized | Excessive growth in electricity demand relative to efficiency gains |
| 2020 | Demand-side management remained underdeveloped compared to generation investments | Review of Ghana’s MEPS programme estimated cumulative savings of 8,317.8 GWh from 2007–2020, highlighting the importance of efficiency measures, yet adoption remained limited across sectors | Rising electricity demand continued to outpace efficiency improvements in buildings and commercial facilities | Need for additional generation capacity despite available efficiency potential |
| 2021 | Limited institutional implementation of building energy audits and EPC-type systems | Energy Commission continued appliance-focused regulatory enforcement, but large-scale building certification and energy benchmarking remained limited | Commercial energy consumption increased with economic activity and urban expansion | Continued escalation of peak load demand |
| 2022 | New energy efficiency regulations introduced for multiple appliances and equipment categories | Ghana enacted several Energy Efficiency Standards and Labelling Regulations covering air conditioners, transformers, motors, televisions, fans, computers and lighting systems | Regulatory improvements expected to reduce future electricity demand growth | Benefits remained gradual due to slow market penetration |
| 2023 | Draft regulations for Energy Performance Certification (EPC) of buildings emerged | Energy Commission initiated consultations on draft EPC regulations, indicating that building efficiency certification had not yet been fully mainstreamed | Building-sector energy inefficiencies continued to contribute to peak demand growth | Significant DSM potential remained untapped |
| 2024 | Demand growth exceeded efficiency gains | Ghana’s 2025 Energy Outlook projected continuing electricity demand growth driven by urbanization, industrial activity and expanding electricity access | Peak demand reached approximately 3,952 MW in 2024 | Increased strain on generation dispatch and fuel requirements |
| 2025 | DSM and EPC implementation still insufficient relative to demand growth | Projected national peak demand estimated between 4,125 MW and 4,338 MW, representing significant growth over previous years | Weak building efficiency enforcement and limited EPC adoption contributed to higher electricity consumption during peak periods | Greater need for thermal generation, fuel procurement and system reserve capacity |
| Overall | Limited adoption of Energy Performance Certification (EPC) and comprehensive building efficiency standards | Energy Commission regulations explicitly state that inefficient appliances increase electricity demand and necessitate additional generation capacity | Unrealized efficiency potential contributed to excessive peak demand growth and higher capacity requirements | Reinforced Ghana’s paradox of overcapacity payments alongside rising operational reliability challenges |
Source: Author’s construct based on field data, 2026.
Table 6.
Difference between Energy Deficit and Reliability Deficit.
| Dimension | Energy Deficit | Reliability Deficit | Ghanaian Illustration |
|---|---|---|---|
| Core problem | Total supply is lower than demand | Installed capacity exists but cannot be fully delivered | Post-2023 outages despite installed capacity adequacy |
| Main indicator | Installed capacity < peak demand | Available capacity < peak demand | Available capacity falls below peak demand in uploaded dataset after 2024 |
| Main cause | Underinvestment in generation | Outages, fuel constraints, financial arrears, grid losses | Gas supply variability, IPP arrears, transmission bottlenecks |
| Policy response | Build new generation plants | Improve dispatch, liquidity, grid efficiency and demand-side management | EPC, grid modernisation, fuel security and financial restructuring |
| Planning focus | Megawatts installed | Megawatts available and delivered | Shift from capacity expansion to reliability governance |
Source: Author’s construct based on field data, 2026.
Table 7.
Econometric Variables of Ghana’s electricity deficit.
| Variable | Measurement | Expected Sign | Explanation |
|---|---|---|---|
| Deficitt | MW | Dependent variable | Measures the electricity supply gap at time (t) |
| Outagest | MW lost | Positive (+) | Higher outages reduce available capacity and increase deficits |
| Gast | MMscf/day | Negative (-) | Higher gas supply improves thermal generation and reduces deficits |
| Losst | % transmission loss | Positive (+) | Higher losses reduce delivered electricity and increase deficits |
| Hydrot | MW | Negative (-) | Higher hydropower output stabilises supply and reduces deficits |
| ϵt | Error term | Not applicable | Captures omitted factors such as distribution losses, tariff recovery and plant maintenance |
Source: Author’s construct based on field data, 2026.
Table 10.
Regression Results.
| Variable | Coefficient | p-value | Interpretation |
|---|---|---|---|
| Generation outages | +0.62 | 0.001 | Strong positive effect on deficit |
| Gas supply | -0.48 | 0.003 | Higher gas supply reduces deficit |
| Transmission losses | +0.31 | 0.021 | Higher losses increase deficit |
| Hydropower output | -0.27 | 0.045 | Higher hydro output reduces deficit |
| R2 | 0.78 | — | Strong explanatory power |
| Adjusted R2 | 0.74 | — | Model remains robust after adjustment |
Source: Author’s construct based on field data, 2026.
Table 11.
EPC Scenario Results and Post-EPC Deficit.
| Scenario | Peak Demand After EPC (MW) | Available Capacity (MW) | Post-EPC Gap (MW) | Outcome |
|---|---|---|---|---|
| Baseline | 4,306 | 3,800 | 506 | Deficit |
| Conservative 10% | 3,875 | 3,800 | 75 | Near balance |
| Moderate 18% | 3,531 | 3,800 | -269 | Surplus restored |
| Aggressive 25% | 3,230 | 3,800 | -570 | Strong reserve margin |
Source: Author’s construct based on field data, 2026.
Disclaimer/Publisher’s Note: The statements, opinions and data contained in all publications are solely those of the individual author(s) and contributor(s) and not of MDPI and/or the editor(s). MDPI and/or the editor(s) disclaim responsibility for any injury to people or property resulting from any ideas, methods, instructions or products referred to in the content. |
© 2026 by the authors. Licensee MDPI, Basel, Switzerland. This article is an open access article distributed under the terms and conditions of the Creative Commons Attribution (CC BY) license (http://creativecommons.org/licenses/by/4.0/).
Copyright: This open access article is published under a Creative Commons CC BY 4.0 license, which permit the free download, distribution, and reuse, provided that the author and preprint are cited in any reuse.