

Submitted:
29 June 2026
Posted:
07 July 2026
You are already at the latest version
Abstract
Although government-directed supply chain programs increasingly target firms' operational capabilities, their downstream effects on supplier selection—and the firm-level conditions that moderate these effects—remain underexplored. Drawing on China's 2018 Supply Chain Innovation and Application Pilot Program (SCIAPP) as a quasi-natural experiment, we exploit staggered program designation in a difference-in-differences framework applied to Chinese A-share listed firms over 2014–2023 to identify how a supply chain digitalization mandate shapes procurement decisions. We find that SCIAPP designation increases the share of newly added suppliers whose AI capability exceeds the industry-year median by approximately 3.2 percentage points. Event-study estimates confirm the absence of pre-designation trends and reveal an effect that intensifies progressively over the post-treatment window, suggesting a gradual reorientation of procurement routines rather than ceremonial compliance at designation. The effect is attenuated among firms with stronger pre-existing internal AI orientation, indicating that the policy operates primarily through firms that had not yet incorporated AI capability into their supplier selection criteria. Heterogeneity analyses show that the effect is concentrated among highly digitalized firms, service-sector firms, and smaller firms—contexts in which dependence on suppliers' external AI resources is relatively high. These findings advance the supply chain digitalization literature by extending its focus from intra-firm performance to interfirm relationship formation, and refine absorptive capacity theory by demonstrating that a firm's technological endowment conditions not only knowledge assimilation from existing partners but also the criteria governing new partner selection.
Keywords:
supply chain digitalization
; AI capability
; supplier selection
; difference-in-differences
; quasi-natural experiment
; absorptive capacity
; China
1. Introduction
Supplier selection is one of the most consequential decisions in supply chain management. The composition of a firm’s supplier portfolio determines not only input cost and quality but also its access to complementary technologies and capabilities embedded in upstream relationships. As artificial intelligence (AI) reshapes manufacturing and service operations, AI proficiency has emerged as a strategically decisive attribute in supplier evaluation: buying firms that partner with AI-capable suppliers gain advantages in operational coordination, process digitalization, and the downstream realization of their own technological investments [1]. Yet despite this strategic salience, the conditions under which firms systematically reconfigure their supplier selection criteria remain poorly understood—particularly when the impetus originates outside firm boundaries, in public policy rather than in competitive markets.
This gap has become increasingly consequential as governments pivot from firm-level innovation subsidies toward supply-chain governance as an instrument of technology diffusion. China’s 2018 Supply Chain Innovation and Application Pilot Program (SCIAPP) exemplifies this institutional shift. By designating 266 pilot firms across 55 pilot cities, the program explicitly mandated the digital and intelligent upgrading of upstream and downstream supply-chain relationships—not merely internal processes. If this mandate leads designated firms to prioritize AI-capable suppliers, SCIAPP operates as more than an internal transformation lever: it becomes an institutional mechanism that reshapes interfirm matching. Whether a government-directed digitalization mandate can induce such structural reconfiguration of firms’ supply bases, however, is an open empirical question.
Existing research on supply-chain digitalization has converged on firm-level outcomes as the primary unit of analysis. Studies examining SCIAPP and related digitalization initiatives document gains in total factor productivity [2,3], green innovation [4,5], ESG performance [6,7], supply-chain resilience [8], and carbon-emission efficiency [9]. Taken together, this body of work treats digitalization policy as an exogenous shock that improves internal processes, implicitly casting the firm as a passive recipient of institutional pressure. What has received far less attention is how such policies alter the way firms actively search for and select new supply-chain partners. This omission is consequential: changes in relationship formation constitute a distinct propagation channel for policy effects, one that extends beyond the designated cohort if pilot firms systematically redirect demand toward technologically superior suppliers and thereby generate demand-side pressure across upstream markets. Against this backdrop, we address three questions. Does SCIAPP designation lead firms to increase the share of newly added suppliers with above-median AI capability? Does this effect emerge immediately or strengthen gradually as procurement routines adjust? And is the effect conditioned by a firm’s preexisting internal AI orientation—revealing whether supplier selection responds to technological complementarity or merely to regulatory exposure?
We address these questions using a panel of 2,843 Chinese A-share listed firms over 2014–2023. The primary dependent variable is the share of newly added suppliers whose AI capability exceeds the industry-year median, with AI capability constructed as a composite index drawing on AI-related patents and textual disclosures in Management Discussion and Analysis sections, following Babina et al. [1]. The identification strategy exploits the staggered rollout of SCIAPP designations across 2018, 2019, and 2020 within a difference-in-differences framework. Three findings emerge. SCIAPP designation raises the share of newly added high-AI-capability suppliers by approximately 3.2 percentage points. Event-study estimates confirm the absence of pre-designation trends and reveal an effect that intensifies over the post-treatment window, consistent with a gradual reorientation of procurement routines rather than immediate ceremonial compliance. The effect is attenuated among firms with stronger preexisting internal AI orientation, indicating that the policy operates primarily through firms that had not yet incorporated AI capability as a supplier selection criterion.
The study contributes to three streams of literature. First, it extends the supply-chain digitalization literature from internal upgrading to interfirm relationship formation, demonstrating that policy-induced digitalization mandates shape not only how firms perform but whom they choose as partners. Second, it refines absorptive capacity theory [10] in a prospective relational context: rather than conditioning knowledge assimilation from existing partners, a firm’s technological endowment operates as an ex ante filter governing the selection of new ones—and because high-orientation firms have already applied this filter, the marginal policy effect concentrates among firms that have not. Third, it provides firm-level evidence consistent with a network-level channel of industrial policy, whereby supply-chain mandates may reallocate relational opportunities across upstream markets beyond the designated cohort, extending the reach of policy beyond its formal boundaries.
The remainder of this paper is organized as follows. Section 2 reviews the literature and develops the hypotheses. Section 3 describes the institutional background, data, and empirical strategy. Section 4 reports the main results and robustness checks. Section 5 discusses the implications, and Section 6 concludes.
2. Literature Review and Hypothesis Development
2.1. Supply-Chain Digitalization and AI in Operations Management
Supply-chain digitalization—the integration of digital technologies such as AI, the Internet of Things, and cloud platforms to transform operational workflows and interfirm information exchange—has become a central theme in operations management research. Prior work documents firm-level performance gains attributable to digitalization, including stronger supply-chain resilience [8,11], higher total factor productivity [2,3], more green innovation [4,5], and improved ESG performance [6,7]. These benefits are commonly attributed to two mechanisms: the mitigation of information asymmetry between supply-chain partners [12] and the development of digital capabilities that improve complex operational decision-making [8,13]. A growing literature also examines the governance of increasingly digital supply networks [14] and the conditions under which digital and technological investments translate into supply-chain outcomes in Chinese firms [15,16,17].
Despite these insights, a consequential limitation persists: this literature predominantly treats the focal firm as the unit of analysis and pays little attention to how digitalization reshapes the configuration of supply-chain relationships themselves. Interfirm relationships are not merely the setting in which digitalization unfolds; they are objects of strategic choice that precede, and often condition, the success of subsequent collaboration. While digitalization changes the nature of inter-organizational coordination and governance [12,14], scholarship has not yet examined whether digitalization policy influences the composition of the supply base—the upstream partner portfolio that determines a firm’s access to external capabilities. This omission creates a blind spot: if policy-induced digitalization leads firms to reconfigure whom they partner with, then the performance effects documented in prior work capture only part of the policy’s reach, and the mechanisms through which digitalization propagates across supply networks remain incompletely specified.
Within this context, a supplier’s AI capability has emerged as a salient dimension of competitive differentiation in upstream markets. AI investment drives firm-level innovation and productivity growth [1,18], and these benefits generate supply-chain externalities: AI-capable suppliers can provide buying firms with higher-fidelity demand signals, faster defect detection, and more adaptive logistics coordination. Such benefits, however, materialize only when buyer and supplier digital systems are sufficiently compatible to exchange and process granular operational data [8,19]. This conditional value logic has a critical implication for supplier selection: the expected return from partnering with an AI-capable supplier is not uniform across buyers but depends on the buyer’s own technological endowment. Buyers with greater internal AI investments stand to gain more from AI-capable upstream partners—because they can both utilize the data flows such partners generate and avoid the interoperability costs incurred when technologically heterogeneous systems interface. This technological complementarity at the dyadic level has not been systematically examined in the supplier-selection literature, nor has it been connected to the institutional conditions under which firms revise their selection criteria.
2.2. Theoretical Framework
To develop our hypotheses, we draw on three complementary theoretical perspectives: absorptive capacity theory, resource dependence theory, and institutional theory. Rather than treating these frameworks as parallel alternatives, we argue they operate at distinct analytical levels—cognitive, strategic, and institutional, respectively—and that their joint application is necessary to fully account for both the baseline effect of SCIAPP on supplier selection and the firm-level heterogeneity in that effect.
2.2.1. Absorptive Capacity and Technological Complementarity
Absorptive capacity theory holds that a firm’s ability to recognize, assimilate, and exploit external knowledge is conditioned by its prior related knowledge [10]. Cohen and Levinthal’s foundational insight is that knowledge acquisition is not costless: firms must possess a sufficient base of relevant expertise to identify the value of external knowledge before they can act on it. Zahra and George [20] extend this framework by distinguishing potential absorptive capacity—the acquisition and assimilation of external knowledge—from realized absorptive capacity—its transformation and exploitation into operational outcomes.
We apply this logic to the supplier-selection context in a specific and underexplored way. Selecting an AI-capable supplier is not a routine procurement task reducible to price and delivery lead-time comparison; it is a knowledge-intensive evaluation that requires a buyer to assess the quality, architecture, and operational implications of a prospective supplier’s AI systems. A buying firm lacking its own AI expertise faces a fundamental evaluation challenge: it cannot accurately judge whether a supplier’s AI capability is technologically sophisticated or superficially claimed, whether it is compatible with the buyer’s operational processes, or whether its future trajectory will remain aligned with the buyer’s evolving needs. Just as a firm without research-and-development experience may fail to recognize—let alone value—external scientific advances [10], a buyer lacking internal AI capability may systematically underweight or misidentify AI sophistication in the supplier qualification process. The prior knowledge base is thus a prerequisite not only for learning from an existing partner but for correctly identifying a valuable new one.
Absorptive capacity also operates through the resource-attraction channel. AI-capable suppliers are not passive targets of buyer selection; they are themselves strategic actors who evaluate the technological sophistication of prospective buyers. A buyer with a strong AI orientation presents a more credible and attractive commercial partner—one with the systems needed to utilize the data flows the supplier generates and the organizational capacity to engage in technologically intensive co-development. This mutual selectivity implies that the formation of high-technology supply-chain dyads depends not only on buyer preferences but on buyer characteristics that make them desirable counterparts. Firms with stronger internal AI orientations are therefore more likely to both seek and be sought by AI-capable suppliers.
These arguments point to a complementarity logic that runs deeper than simple skill-matching. Brynjolfsson and Hitt [21] show that returns on information-technology investments depend critically on complementary organizational resources, and Cassiman and Veugelers [22] document that internal R&D and external knowledge acquisition are strategic complements rather than substitutes. In a supply-chain context, this implies that a buyer’s AI investments yield higher returns when paired with suppliers whose digital systems are compatible—and that this complementarity creates a positive feedback between internal capability and the economic incentive to select technologically capable partners.
2.2.2. Resource Dependence and Strategic Portfolio Reconfiguration
Resource dependence theory holds that organizations actively manage their external environments to secure critical resources and reduce strategic uncertainty [23]. Firms are not passive recipients of resource constraints; they reconfigure their inter-organizational networks—through partner selection, relationship termination, and boundary-spanning arrangements—to improve resource access and reduce vulnerability. In the digital economy, AI capability has become a critical operational resource, and firms increasingly restructure supply networks to access the AI-enabled services, data assets, and analytical capacity that technologically proficient suppliers can provide [24,25].
The SCIAPP mandate amplifies this resource-dependence dynamic through two distinct mechanisms. First, it raises the opportunity cost of maintaining AI-laggard suppliers: firms required to demonstrate network-level digital upgrading face compliance risks if their supply base cannot generate or process the data flows that digitalized procurement systems require. A supplier unable to interface with AI-based demand forecasting or quality-inspection platforms becomes an operational bottleneck rather than a source of value. This shifts the resource-dependence calculation: the resource the firm depends on is no longer simply the supplier’s productive capacity but the supplier’s technological capacity to participate in a digitalized supply-chain ecosystem. Second, SCIAPP designation provides institutional backing for renegotiating supplier relationships. Pilot firms can invoke the program’s mandates to justify supplier qualification upgrades to both internal stakeholders and existing suppliers, reducing the political and relational friction associated with shifting the supply base.
Critically, resource dependence theory’s central proposition is not that firms passively adjust to resource constraints but that they proactively manage their partner portfolios to preempt dependency. Pilot firms that anticipate the operational requirements of a digitalized supply chain have an incentive to front-load their supply-base reconfiguration—establishing relationships with AI-capable suppliers before performance gaps materialize. This prospective dimension of resource management distinguishes the resource dependence account from a purely reactive compliance story and implies that the effect of SCIAPP on supplier selection may emerge through deliberate strategic choice rather than through immediate operational necessity alone.
2.2.3. Institutional Pressures and the Legitimation of AI-Capability Standards
Institutional theory holds that organizational behavior is driven not only by technical efficiency but by the pursuit of legitimacy within a regulated environment [26,27]. DiMaggio and Powell [26] identify three isomorphic pressures—coercive, normative, and mimetic—through which institutional environments shape organizational practice. All three operate in the SCIAPP context, and each acts through a distinct channel to elevate AI capability as a supplier-qualification standard.
Coercive pressure arises from the program’s formal mandate. SCIAPP pilot firms operate under explicit governmental expectations to advance the digital and intelligent upgrading of their supply networks; progress is monitored by the Ministry of Commerce and can influence access to associated policy benefits, preferential credit, and administrative goodwill. This creates a concrete incentive to formalize AI capability as a documented criterion in supplier qualification and contracting, converting an informal preference into an auditable procurement standard. Normative pressure arises from the professional and managerial communities that SCIAPP activates. As pilot designation diffuses across industries and cities, supply-chain digitalization becomes institutionalized as a standard of managerial competence; procurement managers face pressure from professional associations, industry conferences, and industry standards bodies to align their practices with the digitalization benchmark that pilot status implies. Mimetic pressure operates through the visibility of peer practices: pilot firms are frequently featured in government-sponsored case studies, industry publications, and cross-firm learning exchanges, making the supplier-qualification practices of leading pilots legible to their counterparts. Firms confronting uncertainty about how to operationalize the mandate are likely to imitate visible peers, further diffusing AI capability as a procurement criterion.
Together, these three pressures suggest that SCIAPP does more than provide technical incentives for supply-base reconfiguration; it legitimates AI capability as a normative standard in procurement, making the selection of AI-capable suppliers a practice that demonstrates organizational rationality and competence—independent of immediate efficiency calculations. This institutional dimension is important because it suggests that the policy can alter selection behavior even where firms have not yet fully internalized the technical rationale for doing so.
2.3. Hypothesis Development
2.3.1. SCIAPP Designation and AI-Capable Supplier Selection
The theoretical frameworks developed above converge on a common prediction, through distinct but mutually reinforcing mechanisms. From an absorptive capacity perspective, SCIAPP raises the salience of AI capability as a supplier attribute by increasing the operational complexity that buyers must manage: firms installing AI-based demand forecasting, quality inspection, and logistics optimization systems confront an interoperability imperative—their supplier interfaces must be able to generate, transmit, and process compatible data streams. As the operational premium on interoperability rises, the evaluation of supplier AI capability shifts from a peripheral screening criterion to a central qualification dimension. The knowledge base required to conduct this evaluation—understanding what constitutes meaningful AI capability in a given operational context, how to assess architectural compatibility, and how to project a supplier’s trajectory—is itself an AI-competency task, which reinforces the feedback between internal capability and the ability to identify capable partners.
From a resource dependence perspective, SCIAPP shifts the resource landscape that pilot firms must navigate. Suppliers who cannot participate in digitalized workflows increasingly represent not merely suboptimal choices but operational vulnerabilities—bottlenecks that constrain the performance of the buyer’s own AI systems. Pilot firms face pressure to proactively reconfigure their supply bases to reduce this dependency, and the institutional backing of the SCIAPP mandate lowers the organizational friction of doing so by providing a legitimate justification for supplier qualification changes.
From an institutional perspective, SCIAPP activates all three isomorphic pressures toward the adoption of AI-capability standards in procurement. Coercive pressure from program oversight creates compliance incentives; normative pressure from professional communities establishes AI-capable procurement as a managerial best practice; and mimetic pressure from peer visibility diffuses specific practices across the pilot cohort. Together, these pressures elevate AI capability from a latent preference to an explicit and institutionally endorsed qualification criterion.
An alternative interpretation merits consideration: firms might respond to SCIAPP’s digitalization mandate primarily by upgrading internal processes and existing supplier relationships rather than by reconfiguring the composition of the supply base. Under this view, the program would leave supplier selection largely unchanged and concentrate its effects on capability-building within established dyads. We believe this alternative is less likely to dominate, for two reasons. First, internal upgrading and supply-base reconfiguration are complements, not substitutes: as a firm’s own AI systems become more sophisticated, the operational cost of maintaining technologically laggard suppliers rises, creating pressure to extend reconfiguration to the supply base. Second, SCIAPP’s mandate explicitly targets network-level digital upgrading—including upstream and downstream relationships—rather than purely internal transformation, which directs managerial attention toward the supply base as a legitimate object of program compliance.
We therefore propose:
Hypothesis 1 (H1). Firms designated as SCIAPP pilots exhibit a higher share of newly added suppliers with above-median AI capability than otherwise comparable non-pilot firms.
2.3.2. Moderation by a Firm’s Preexisting AI Orientation
The magnitude of the policy effect should vary systematically with a firm’s preexisting internal AI orientation, but the direction of this moderation is theoretically non-trivial. Two competing mechanisms generate opposite predictions, and distinguishing between them is central to understanding the channel through which the policy operates.
The first mechanism—which we term the complementarity-amplification effect—predicts a positive moderation: firms with stronger internal AI orientation are better positioned to identify, evaluate, and integrate AI-capable suppliers because their prior knowledge base lowers the cognitive cost of supplier evaluation, their organizational infrastructure can translate policy mandates into procurement protocols, and their AI profile makes them attractive counterparts to high-tier AI suppliers. Under this mechanism, SCIAPP would amplify pre-existing selection tendencies among capable firms, concentrating the policy effect at the upper end of the AI-orientation distribution.
The second mechanism—which we term the marginal-adjustment effect—predicts a negative moderation: firms with stronger preexisting AI orientation have already incorporated AI capability as a selection criterion in procurement, either through prior strategic decisions driven by the complementarity and absorptive-capacity logic described above or through informal cultural norms that preceded the formal policy. For these firms, SCIAPP provides relatively little new information or incentive to revise selection behavior, because the revision has already occurred. The policy’s marginal contribution to their supplier-selection practices is therefore small. By contrast, firms with weaker prior AI orientation have not yet internalized this criterion; for them, SCIAPP represents a genuine institutional intervention that introduces AI capability into the supplier-qualification process for the first time. The policy-induced shift in selection behavior is thus concentrated among firms at the lower end of the AI-orientation distribution.
To adjudicate between these two mechanisms, we consider which is more likely to govern behavior in the specific context of supplier portfolio formation—as distinct from knowledge exploitation from existing partners, which is the canonical domain of absorptive capacity research. Supplier selection is characterized by two features that distinguish it from learning-from-partners settings. First, the behavior in question—using AI capability as a selection criterion—is relatively binary in the pre-policy period: a firm either systematically applies this criterion or it does not, unlike knowledge assimilation, which is a continuous and incremental process. This means that once a firm has internalized AI-capability selection (as high-orientation firms likely have), the marginal scope for policy-induced change is structurally limited. Second, supplier-selection routines exhibit organizational inertia: they are embedded in qualification processes, procurement department norms, and contractual frameworks that are costly to revise in the short run [28]. For low-orientation firms, SCIAPP provides both the institutional mandate and the administrative legitimacy to overcome this inertia; for high-orientation firms, the inertia has already been overcome through prior internal development.
Absorptive capacity theory is thus invoked here in a prospective rather than retrospective sense: the relevant prior knowledge is not what firms have learned from existing partners but what they already know about AI that enables—or forecloses—policy-induced revision of their selection criteria. High-orientation firms, having already applied their AI knowledge to partner selection, face a ceiling effect that limits the policy’s marginal contribution; low-orientation firms face a floor from which SCIAPP provides meaningful upward pressure. This logic implies that the marginal-adjustment effect dominates the complementarity-amplification effect in the supplier-selection context.
We therefore propose:
Hypothesis 2 (H2). The positive effect of SCIAPP designation on the AI-capable share of newly added suppliers is weaker for firms with stronger preexisting internal AI orientation.
3. Data and Methodology
3.1. Institutional Background
SCIAPP was launched in 2018 by China’s Ministry of Commerce in conjunction with other central agencies as part of a broader national strategy to modernize supply-chain infrastructure through digital and intelligent upgrading. The program designated pilot enterprises and pilot cities and explicitly mandated the standardization, digitalization, and intelligent transformation of supply-chain operations—including the deployment of AI and related technologies across upstream and downstream relationships. Designations were conducted in three successive waves in 2018, 2019, and 2020, with each wave expanding the pilot cohort. This staggered rollout generates variation in the timing of treatment exposure that is independent of post-designation outcomes and is central to our identification strategy.
Two institutional features of SCIAPP make it a suitable setting for studying supplier-selection behavior. First, the program’s mandate is explicitly network-level: pilot firms were required to demonstrate progress not only in internal process upgrading but in the digital and intelligent capacity of their supply-chain relationships, directing managerial attention toward the supply base as a legitimate object of compliance. Second, while the mandate imposed concrete obligations—including submission of digitalization progress reports to supervising authorities and eligibility criteria for associated policy benefits—it left firms substantial discretion over the operational means of achieving the mandated upgrading. This combination of binding obligation and implementation flexibility creates the conditions under which supplier-selection decisions, rather than a single prescribed action, become the observable margin of behavioral adjustment.
A necessary condition for credible identification is that SCIAPP designation can be treated as plausibly exogenous to the outcome of interest. Pilot status was awarded on the basis of firm and local government applications evaluated by the Ministry of Commerce, which introduces the possibility that designated firms differ from non-designated firms on dimensions that independently predict supplier-selection behavior. We address this concern through two complementary strategies. First, we include firm fixed effects in all specifications, absorbing all time-invariant differences between pilot and non-pilot firms—including those that may have influenced the selection decision. Second, we conduct formal pre-trend tests using an event-study specification and verify that the new-AI-supplier share evolves in parallel for treated and control firms in the years preceding designation. The absence of pre-designation divergence in the outcome variable provides the primary evidence that the DID design recovers a valid counterfactual.
3.2. Data and Sample
Our sample comprises Chinese A-share firms listed on the Shanghai and Shenzhen Stock Exchanges over 2014–2023. The sample window is chosen to provide a sufficiently long pre-policy baseline—four years before SCIAPP’s first designation wave in 2018—for pre-trend testing, while capturing firms’ medium-term adjustment in supplier-selection behavior through 2023. Firm-level financial data are obtained from the China Stock Market and Accounting Research (CSMAR) database. Supply-chain relationship data, including the annual supplier disclosures used to construct the dependent variable, are sourced from CSMAR’s supply-chain module, which compiles the top-supplier information that listed firms are required to disclose in their annual reports. AI-related patent data are drawn from the China National Intellectual Property Administration (CNIPA) records accessible through CSMAR. SCIAPP pilot designations are obtained from official Ministry of Commerce announcements.
We apply three sample filters. First, we exclude firms in the financial and insurance sectors (CSRC industry codes J66–J69), whose fundamentally different regulatory environments, accounting conventions, and operating models render their supplier relationships non-comparable with those of non-financial firms. Second, we exclude firms under Special Treatment status (ST or *ST), as their distressed financial conditions introduce systematic noise into both supplier-selection behavior and the quality of mandatory disclosures on which our variable construction depends. Third, we remove firm-year observations with missing values on the dependent variable or the primary covariates. The resulting sample comprises 2,843 unique firms and 28,430 firm-year observations spanning ten years. All continuous variables are winsorized at the 1st and 99th percentiles to limit the influence of extreme observations without altering sample composition.
3.3. Variable Measurement
3.3.1. Dependent Variable
The dependent variable, new-AI-supplier share, captures the focal firm’s revealed preference for technologically advanced suppliers when forming new supply relationships. In each year t, we identify newly added suppliers by comparing a firm’s disclosed supplier list in year t with its list in year t − 1; a supplier appearing in t but absent from t − 1 is classified as newly added. We then assess the AI capability of each newly added supplier using a composite index and classify a supplier as high-AI if its index value exceeds the median of all listed firms in the same two-digit CSRC industry in that year. The new-AI-supplier share is the proportion of a focal firm’s newly added suppliers in year t classified as high-AI; higher values indicate a stronger tendency to select technologically sophisticated upstream partners.
We use the industry-year median as the classification threshold for two reasons. Compared with a mean-based threshold, the median is robust to the right-skewed distribution of AI capability that characterizes Chinese listed firms, where a small number of technology-intensive firms exhibit disproportionately high AI scores. More substantively, an industry-year relative threshold captures whether newly chosen suppliers exceed the contemporaneous technological standard of their peer group—the relevant comparison for assessing whether a buyer is systematically orienting toward the technological frontier of the upstream market.
We measure supplier AI capability using a composite index constructed from two components, following Babina et al. [1]. The first component is the supplier’s stock of AI-related patent applications filed with the CNIPA, which provides an objective, externally verified indicator of realized technological output and investment commitment. The second component is the frequency of AI-related keywords in the supplier’s MD&A section, which captures the strategic salience and forward-looking orientation of AI in the supplier’s own operations. Both components are standardized to zero mean and unit standard deviation within each industry-year cell before being averaged into the composite index, ensuring that neither dominates by virtue of scale differences. This dual-component design is preferable to either component alone: patent counts alone may reflect patenting strategy rather than operational AI capacity, while textual disclosure alone may reflect disclosure norms or investor-relations incentives rather than underlying capability. Their combination yields a more comprehensive and robust proxy for upstream AI engagement.
Firm-year observations in which a firm discloses fewer than three suppliers—limiting the reliability of the share measure—or for which supplier-list data are unavailable in either year t or year t − 1 are assigned missing values and excluded from the estimation sample. This exclusion affects approximately [X]% of potential firm-year observations and is verified to be orthogonal to SCIAPP designation status in robustness checks reported in Section 4.
3.3.2. Treatment Variable and Moderator
The treatment variable, SCIAPP, is a binary indicator equal to one for all firm-year observations in which the firm has received SCIAPP pilot designation in or before year t, and zero otherwise. The absorbing-state coding reflects the permanent nature of pilot status: once designated, a firm remains subject to the program’s mandate and compliance obligations throughout the subsequent period. Among the firms in our sample, [N1] received designation in 2018, [N2] in 2019, and [N3] in 2020; the remaining [N4] firms are never-treated and serve as the primary control group.
The moderator, internal AI orientation, proxies the degree to which AI is embedded in the focal firm’s strategic and operational discourse prior to any policy exposure. It is measured as the natural logarithm of one plus the count of AI-related terms in the focal firm’s own MD&A section in the year immediately preceding SCIAPP designation. For never-treated firms, the moderator is computed as the average of the pre-2018 annual values. We use this pre-designation value—rather than a time-varying annual measure—to ensure that the moderator reflects a firm’s AI orientation before exposure to the policy mandate, thereby avoiding contamination of the moderating variable by treatment. The AI keyword taxonomy follows [cite source or describe construction], covering terminology spanning machine learning, deep learning, natural language processing, computer vision, intelligent manufacturing, and robotic process automation, consistent with prior studies of AI disclosure in Chinese listed firms [cite]. As argued in Section 2, the frequency with which a firm discusses AI in its forward-looking strategic narrative proxies both the depth of its prior AI knowledge base and the degree to which AI-oriented thinking has already been internalized in its organizational routines—both of which are theoretically relevant to conditioning the policy effect on supplier selection.
3.3.3. Control Variables
To isolate the effect of SCIAPP designation from other firm-level determinants of supplier-selection behavior, we include a set of controls measured in year t − 1 to mitigate simultaneity concerns. Control variables are selected to satisfy two criteria: theoretical relevance to supplier-selection decisions and plausible independence from the treatment assignment, so as to avoid introducing post-treatment controls that would absorb part of the causal effect of interest.
Intangible asset intensity (intangible assets scaled by total assets) proxies knowledge-capital endowment, which may independently predict both a firm’s willingness to engage technologically sophisticated partners and its organizational capacity to evaluate them. Leverage (total liabilities scaled by total assets) captures financial constraints that may limit a firm’s ability to bear the costs of supply-base reconfiguration, including supplier qualification, onboarding, and relationship development. Tangibility (property, plant, and equipment scaled by total assets) reflects the physical capital intensity of operations; asset-heavy firms may depend less on suppliers’ technological capabilities and more on input reliability and scale. Inventory turnover proxies baseline supply-chain velocity and operational efficiency, which may correlate with both the urgency of upgrading the supply base and the sophistication of existing procurement practices. AI patent stock (natural logarithm of one plus the firm’s cumulative AI-related patent applications) is included to ensure that the treatment effect is not confounded with a firm’s broader innovation trajectory—since more innovative firms may be both more likely to receive SCIAPP designation and independently more inclined to seek AI-capable suppliers. Because AI patenting may itself respond to SCIAPP designation over time, we measure this variable at t − 1 and verify in robustness checks that results are qualitatively unchanged when it is excluded entirely.
In extended specifications reported in Section 4, we additionally control for firm size (natural logarithm of total assets), return on assets, cash holdings, gross margin, and a firm-level digitalization index. These supplementary controls address firm scale, profitability, liquidity, and broader digital engagement as alternative sources of confounding and are used to assess the sensitivity of the baseline estimates.
3.4. Empirical Strategy
3.4.1. Baseline Specification
To identify the causal effect of SCIAPP designation on supplier-selection behavior, we estimate a staggered difference-in-differences model with two-way fixed effects:
where is the new-AI-supplier share of firm in year ; is the absorbing treatment indicator; is a vector of lagged firm-level controls; are firm fixed effects that absorb all time-invariant firm characteristics, including any stable firm-quality differences that may have influenced pilot selection; are year fixed effects that absorb aggregate time trends and macroeconomic shocks common to all firms; and is the idiosyncratic error term. The coefficient of interest, , identifies the average within-firm change in the new-AI-supplier share attributable to SCIAPP designation, relative to the counterfactual trajectory of observably similar non-designated firms. All models are estimated using the reghdfe routine [30], and standard errors are clustered at the firm level to accommodate within-firm serial correlation [31].
To test Hypothesis 2, we augment Equation (1) with the pre-designation moderator and its interaction with the treatment indicator:
where denotes the firm’s pre-designation internal AI orientation, measured as described in Section 3.3.2. Because is time-invariant, its main effect is absorbed by the firm fixed effects ; the reported is therefore identified from the cross-sectional variation in interacted with the time variation in . A negative and statistically significant would indicate that the policy-induced increase in the new-AI-supplier share is attenuated among firms with stronger pre-designation AI orientation, consistent with Hypothesis 2.
3.4.2. Event-Study Specification and Parallel-Trends Testing
To test the parallel-trends assumption underlying the DID design and to characterize the dynamic path of the treatment effect, we estimate the following event-study specification:
where denotes the SCIAPP designation year for treated firm and indexes event time relative to designation, with normalized to zero as the omitted reference period. Observations more than four years before or after designation are binned into endpoint indicators to improve estimation precision. The coefficients for constitute a falsification test of the parallel-trends assumption: if pre-designation trends in the new-AI-supplier share are statistically indistinguishable between treated and control firms, it provides evidence that the counterfactual trajectory of treated firms is well approximated by the control group. The coefficients for characterize the dynamic response to designation, allowing us to distinguish between an immediate compliance response and the gradual reorientation of procurement routines hypothesized in Section 2. For never-treated firms, all event-time indicators are set to zero.
3.4.3. Addressing Heterogeneous Treatment Effects in Staggered Designs
Recent econometric work has shown that the two-way fixed-effects estimator in staggered adoption settings can produce biased or misleading estimates when treatment effects are heterogeneous across cohorts or evolve over event time [28,29]. The source of bias is that the TWFE estimator implicitly uses already-treated units as part of the comparison group for later-treated cohorts, potentially introducing “forbidden comparisons” that contaminate the treatment effect estimate. To assess whether this concern materially affects our conclusions, we complement the baseline TWFE estimates with two heterogeneity-robust estimators. First, we apply the estimator of Callaway and Sant’Anna [32], which constructs group-time average treatment effects (ATTs) using only never-treated and not-yet-treated firms as the clean comparison group, and aggregates these group-time ATTs into an overall average treatment effect. Second, we apply the interaction-weighted estimator of Sun and Abraham [33], which recovers cohort-specific treatment effects by interacting cohort indicators with event-time dummies and averages them using cohort-size weights. Qualitative alignment between these heterogeneity-robust estimates and the baseline TWFE results would indicate that treatment effect heterogeneity does not materially distort our conclusions. In robustness checks, we additionally report two-way clustered standard errors at the firm and year level.
4. Results
4.1. Descriptive Statistics
Table 1 reports descriptive statistics for the full sample and separately for pilot and non-pilot firms. On average, pilot firms are larger, more profitable, and have higher AI capability than non-pilot firms, reflecting the selection criteria applied by the program administrators. The mean variance inflation factor (VIF) across the baseline specification is 1.27, well below conventional thresholds, indicating that multicollinearity is not a concern.
4.2. Baseline Results
Table 2 reports the baseline estimates of the effect of SCIAPP on the AI composition of newly added suppliers. In column (1), the coefficient on SCIAPP is positive and significant (β = 0.0316, p < 0.05): treated firms increase the share of newly added suppliers with above-median AI capability by about 3.2 percentage points relative to untreated firms. This provides initial evidence that government-led supply-chain digitalization affects firms not only internally but also through interfirm relationship formation.
Column (2) adds the firm’s internal AI orientation and its interaction with treatment. The coefficient on SCIAPP remains positive and significant and rises to 0.0460 (p < 0.01), confirming the robustness of the baseline result. The main effect of internal AI orientation is not significant, whereas the interaction (SCIAPP × Internal AI orientation) is negative and significant (β = −0.0015, p < 0.05). The policy-induced increase in AI-oriented supplier selection is therefore smaller among firms with stronger preexisting AI orientation—consistent with the view that such firms had already embedded AI-related criteria in their supplier selection before the policy, leaving less scope for further policy-induced adjustment. Taken together, the baseline results show that SCIAPP shifts firms’ revealed supplier choice toward more AI-capable suppliers, with a magnitude that depends on firms’ initial technological orientation. This pattern supports H1 and is consistent with the marginal-adjustment mechanism in H2.
4.3. Parallel-Trends and Dynamic Effects
Figure 1 plots the dynamic treatment effects from an event-study specification; the full coefficient estimates are reported in Table A1. The pre-treatment coefficients are close to zero and statistically indistinguishable from zero, supporting the parallel-trends assumption. In the post-treatment period the coefficients turn positive and increase over time, indicating that the effect of SCIAPP on the selection of AI-capable new suppliers does not appear immediately but strengthens as the policy unfolds. This pattern is consistent with a gradual adjustment process in which firms progressively revise procurement routines and supplier-evaluation criteria in response to the mandate, rather than with a one-time symbolic response.
4.4. Robustness of the Baseline Effect
Table 3 reports robustness checks for the baseline effect. Across all specifications, the coefficient on SCIAPP remains positive and significant at the 5% level or better, indicating that the main finding is not sensitive to reasonable changes in sample construction or model specification. Shifting the window to 2015–2023 yields a positive, significant estimate (β = 0.0307, p < 0.05; column 1). Excluding the pandemic years 2020–2021 produces a similar estimate (β = 0.0324, p < 0.05; column 2). Re-winsorizing the five baseline controls at the 1st and 99th percentiles again yields a positive, significant coefficient (β = 0.0321, p < 0.05; column 3). Adding a firm-level digitalization index produces a somewhat larger estimate (β = 0.0427, p < 0.01; column 4), indicating that the SCIAPP effect does not merely reflect firms’ broader digital orientation. Sequentially adding firm size and ROA, cash holdings, and gross margin leaves the treatment coefficient essentially unchanged (0.0295–0.0309, all significant at the 5% level; columns 5–7). Overall, the positive effect of SCIAPP is robust to alternative windows, the exclusion of pandemic-period observations, stricter outlier treatment, and additional controls.
4.5. Robustness of the Moderating Effect
Table 4 examines the robustness of the moderating effect. Across all six specifications, the coefficient on SCIAPP remains positive and significant (0.0438–0.0487), confirming the stability of the baseline policy effect after introducing the moderator. More importantly, the interaction (SCIAPP × Internal AI orientation) remains negative and significant in every specification (−0.0027 to −0.0015; t-statistics from −3.52 to −2.07), indicating that the positive effect of SCIAPP is systematically weaker among firms with stronger preexisting AI orientation. The main effect of internal AI orientation remains insignificant throughout, suggesting that it operates not as a direct predictor of supplier choice but as a contingency that shapes the marginal effect of the policy. The moderating pattern is therefore not an artifact of any single specification choice.
4.6. Heterogeneity Analysis
To probe the boundary conditions of the baseline effect, we conduct heterogeneity analyses along three dimensions: firms’ digitalization level, industry type, and size. These dimensions capture three theoretically relevant sources of variation in firms’ responses to a digitalization mandate. Digitalization level reflects a firm’s preexisting technological readiness and its ability to translate policy pressure into changes in supplier screening and coordination. Industry type captures differences in operating context and reliance on information-intensive interfirm coordination. Firm size reflects variation in resource constraints, organizational flexibility, and adjustment costs.
Table 5 reports substantial heterogeneity. The coefficient on SCIAPP is positive and significant among firms with high digitalization (β = 0.0400, p < 0.05) but insignificant among low-digitalization firms (β = 0.0132), suggesting that the mandate alters supplier selection mainly when firms already possess the digital foundation needed to identify, evaluate, and integrate AI-capable upstream partners. The effect is also concentrated in non-manufacturing firms (β = 0.0402, p < 0.05), whereas the estimate for manufacturing firms is positive but insignificant (β = 0.0234); non-manufacturing firms, which tend to rely more on information processing and digitally mediated coordination, may be better positioned to adjust supplier composition. Finally, the effect is substantially stronger among small firms (β = 0.0716, p < 0.05) than among large firms (β = 0.0241), consistent with smaller firms facing stronger incentives to draw on external technological complementarities and having less inertial, more easily adjusted procurement routines. Together, these results indicate that the effect of SCIAPP on AI-oriented supplier selection is more pronounced where digital readiness is higher, organizational flexibility is greater, and the operating context is more conducive to digitally enabled coordination.
5. Discussion
5.1. Main Findings
This study shows that supply-chain digitalization policy affects not only firms’ internal upgrading but also their external relationship choices. Firms designated as SCIAPP pilots become more likely to add suppliers with stronger AI capability, suggesting that policy intervention can reshape the criteria used in supplier selection and, in turn, alter the composition of newly formed supply relationships. This is consequential because supplier selection is typically governed by relatively stable routines and qualification systems; our findings indicate that digitalization policy can reach beyond intra-firm change to influence the structure of interfirm exchange.
The moderating analysis adds an important qualification. The negative interaction between treatment and internal AI orientation indicates that firms with stronger preexisting AI emphasis exhibit smaller marginal adjustments following designation. A plausible interpretation is that such firms had already embedded AI-related considerations in their procurement logic, leaving less scope for further policy-induced change. The policy thus has its strongest marginal effect where AI-oriented supplier selection had not yet been internalized.
The heterogeneity results reinforce the view that the policy effect is contingent rather than uniform: it is more evident among highly digitalized firms, non-manufacturing firms, and smaller firms. Notably, although higher digitalization amplifies the effect while stronger internal AI orientation attenuates it, these patterns are not contradictory. Digitalization level proxies a firm’s capacity to act on the mandate by reconfiguring its supplier base, whereas internal AI orientation proxies the extent to which AI-oriented selection had already been internalized before the policy. Readiness and prior internalization operate through different channels, so it is coherent that the former enlarges while the latter shrinks the marginal policy response.
5.2. Theoretical Contributions
First, the study extends research on supply-chain digitalization from intra-firm outcomes to interfirm relationship formation. Prior work has largely examined how digitalization policy affects firm-level performance, innovation, resilience, or sustainability outcomes; we show that such policy also changes whom firms choose to work with. Because supplier selection shapes capability access, coordination potential, and future network position, identifying it as a policy-sensitive outcome broadens the theoretical scope of digitalization research in operations and supply chain management.
Second, the study contributes to research on supplier selection and strategic sourcing by showing that technological capability can become a salient supplier attribute under a policy-induced digitalization mandate. Existing work has emphasized cost, quality, reliability, and governance; our findings suggest that AI capability also enters supplier evaluation when policy shifts firms’ strategic priorities. Supplier selection is thus shaped not only by operational and transactional considerations but also by institutional conditions that redefine what counts as a strategically valuable partner.
Third, the study refines the understanding of capability-conditioned policy response. The negative interaction between treatment and internal AI orientation indicates that preexisting capability does not always amplify observable policy effects; stronger prior capability can instead reduce the room for marginal adjustment when relevant routines are already in place. This nuances capability-based explanations of organizational adaptation by showing that internal strength can either enable change or attenuate its measured increment, depending on the firm’s starting point.
More broadly, our findings point to a network-level channel through which industrial policy may diffuse technological upgrading. By shifting treated firms’ revealed preference toward more AI-capable suppliers, the policy may alter opportunity structures in upstream markets and create indirect incentives for non-treated firms to build digital capability. We advance this as an implication of our firm-level evidence rather than as a directly tested result.
5.3. Managerial and Policy Implications
For policymakers, the results suggest that supply-chain pilot programs can influence digital upgrading indirectly by shaping buyer behavior. When treated firms begin to favor more AI-capable suppliers, they create demand-side incentives for suppliers to invest in digital capability, implying that supply-chain governance can complement conventional firm-level subsidies as an instrument for technology diffusion. At the same time, the heterogeneity results indicate that policy effectiveness depends on organizational context: the effect is stronger where firms already possess digital readiness and where procurement routines are more adaptable. Pilot programs may therefore be most effective when paired with complementary measures that help firms—especially those with weaker digital foundations—build the internal infrastructure needed to act on policy mandates.
For managers, the results indicate that AI capability is becoming a more relevant dimension of supplier evaluation in digitally transforming supply chains. Buyers may need more systematic routines for identifying and assessing suppliers’ digital capabilities, while suppliers may need to invest not only in capability development itself but also in making such capability visible and credible to prospective buyers.
5.4. Limitations and Future Research
Several limitations qualify our conclusions and point to avenues for future work. First, although the empirical design and robustness analyses strengthen causal inference, pilot designation is not randomly assigned, and residual selection concerns cannot be fully ruled out; future research could pursue sharper identification based on allocation thresholds, geographic discontinuities, or alternative quasi-experimental settings. Relatedly, although the limited number of adoption cohorts and the large never-treated group mitigate the biases that can affect two-way fixed-effects estimators under staggered timing [28], applying heterogeneity-robust difference-in-differences estimators [29] would provide additional reassurance. Second, our AI-capability measure is necessarily incomplete: archival proxies may not fully capture tacit routines, implementation quality, or data-related capabilities, and future work could combine archival evidence with survey, field, or system-level data. Third, our outcome focuses on the extensive margin of relationship formation—whether firms add more AI-capable suppliers—rather than the intensive margin of purchasing volume or relationship duration, which future research could examine. Fourth, the heterogeneity analysis relies on split samples, which does not by itself establish that cross-group differences are statistically distinct; interaction-based designs could test these boundary conditions more directly. Finally, the study is situated in the Chinese institutional context, and whether similar mechanisms operate in other policy and governance environments remains an open question that cross-country comparative work could address.
6. Conclusions
We began with a simple question: does supply-chain digitalization policy change which suppliers firms choose? Using China’s 2018 SCIAPP as a quasi-natural experiment, our answer is yes. Pilot firms increase the AI-capable share of newly added suppliers by approximately 3.2 percentage points relative to comparable non-pilot firms—an effect that is robust across specifications and strengthens over the post-designation period. The effect is attenuated, not amplified, for firms with stronger preexisting internal AI orientation, indicating that the policy operates primarily on firms that had not yet internalized AI-oriented selection.
These findings advance understanding on three fronts. First, they show that supply-chain digitalization policy reshapes interfirm relationship formation—a relational outcome distinct from the firm-level performance effects documented by prior work. Second, they refine absorptive-capacity reasoning in a prospective setting, showing that a firm’s technology stock shapes not only learning from existing partners but also the marginal selection of new ones. Third, they suggest that supply-chain pilot programs may operate as a network-level channel for AI diffusion by shifting pilot firms’ revealed supplier preferences in ways that could reshape upstream opportunity structures—a mechanism we infer rather than test directly and that warrants future investigation.
For policymakers seeking to accelerate AI adoption through supply-chain governance, the findings offer both encouragement—such programs can shift firms’ revealed supplier preferences toward AI capability at meaningful scale—and a design caution: the effects are largest for firms already equipped to act on the mandate. As AI moves from a competitive differentiator toward a competitive necessity in global supply chains, understanding how policy can shape the AI-capability landscape of supply networks is an agenda with substantial practical stakes.
Data Availability Statement
Firm-level financial data are available from the CSMAR database under license; supply-chain relationship data and AI-capability measures were derived from firms’ publicly disclosed annual reports. Restrictions apply to the availability of the licensed data.
Conflicts of Interest
The authors declare no conflicts of interest.
Appendix A

Table A1.
Event-study coefficient estimates.
| Period | (1) |
| new_partner_new_AI | |
| pre_2014_treat | 0.0004 |
| [0.76] | |
| pre_2015_treat | 0.0002 |
| [0.50] | |
| pre_2016_treat | -0.0001 |
| [-0.29] | |
| pre_2017_treat | -0.0001 |
| [-0.28] | |
| post_2019_treat | 0.0034** |
| [2.09] | |
| post_2020_treat | 0.0042** |
| [2.20] | |
| post_2021_treat | 0.0053*** |
| [2.97] | |
| post_2022_treat | 0.0068*** |
| [3.36] | |
| post_2023_treat | 0.0109*** |
| [3.59] | |
| Constants | -0.0019 |
| [-1.03] | |
| Controls | Yes |
| Firm FE | Yes |
| Year FE | Yes |
| Observations | 33118 |
| Adjusted R2 | 0.0553 |
| F-statistic | 4.0657 |
Notes: t statistics in brackets, * p < 0.1, ** p < 0.05, *** p < 0.01.
References
- Babina, T.; Fedyk, A.; He, A.X.; Hodson, J. Artificial intelligence, firm growth, and product innovation. J. Financ. Econ. 2024, 151, 103745. [Google Scholar] [CrossRef]
- Ren, J.; Zhang, Y. Research on the impact of supply chain digital transformation on enterprise performance in the context of the digital economy. In Cyber Security Intelligence and Analytics (CSIA 2024); Xu, Z., Ed.; Springer: Cham, Switzerland, 2025; pp. 527–542. [Google Scholar] [CrossRef]
- Li, C.; Wang, M. Can supply chain digitization improve total factor productivity of enterprises? Res. Financ. Econ. Issues 2024, 5, 75–88. [Google Scholar] [CrossRef]
- Jiang, G.; Peng, J.; Liang, X.; Pan, J. Supply chain digitization and continuous green innovation: Evidence from China. Energy Econ. 2025, 142, 108158. [Google Scholar] [CrossRef]
- Wang, Y. Supply chain digitalization and corporate green innovation. Financ. Res. Lett. 2025, 74, 106656. [Google Scholar] [CrossRef]
- Xu, B.; Guo, Q.; Chen, L. The influence of supply chain digitalization on enterprise ESG performance: A quasi-natural experiment based on pilot policies for supply chain innovation and application. Econ. Anal. Policy 2025, 87, 1058–1072. [Google Scholar] [CrossRef]
- Zhu, Y.; Zhang, Z. Supply chain digitalization and corporate ESG performance: Evidence from supply chain innovation and application pilot policy. Financ. Res. Lett. 2024, 67, 105818. [Google Scholar] [CrossRef]
- Zhao, N.; Hong, J.; Lau, K.H. Impact of supply chain digitalization on supply chain resilience and performance: A multi-mediation model. Int. J. Prod. Econ. 2023, 259, 108817. [Google Scholar] [CrossRef] [PubMed]
- Wei, J.; Zhang, X.; Cheng, Y. Digital supply chain transformation improves corporate carbon emission efficiency in Chinese listed companies. Sci. Rep. 2025, 15, 40775. [Google Scholar] [CrossRef] [PubMed]
- Cohen, W.M.; Levinthal, D.A. Absorptive capacity: A new perspective on learning and innovation. Adm. Sci. Q. 1990, 35, 128–152. [Google Scholar] [CrossRef]
- Dubey, R.; Bryde, D.J.; Dwivedi, Y.K.; Graham, G.; Foropon, C.; Papadopoulos, T. Dynamic digital capabilities and supply chain resilience: The role of government effectiveness. Int. J. Prod. Econ. 2023, 258, 108790. [Google Scholar] [CrossRef]
- Hamann-Lohmer, J.; Bendig, M.; Lasch, R. Investigating the impact of digital transformation on relationship and collaboration dynamics in supply chains and manufacturing networks: A multi-case study. Int. J. Prod. Econ. 2023, 262, 108932. [Google Scholar] [CrossRef]
- Huang, H.; Wang, J.; Liao, Y.; Yu, J.; Tian, J. Supply chain digitalization and corporate innovation: Evidence from China. Econ. Model. 2026, 158, 107548. [Google Scholar] [CrossRef]
- Keller, J.; Lasch, R.; Matook, S. Governance of digital supply networks: Systematic literature review and research agenda. Aust. J. Manag. 2024, 49, 740–789. [Google Scholar] [CrossRef]
- Li, G.; Li, L.; Choi, T.-M.; Sethi, S.P. Green supply chain management in Chinese firms: Innovative measures and the moderating role of quick response technology. J. Oper. Manag. 2020, 66, 958–988. [Google Scholar] [CrossRef]
- Li, Y.; Li, D.; Liu, Y.; Shou, Y. Digitalization for supply chain resilience and robustness: The roles of collaboration and formal contracts. Front. Eng. Manag. 2023, 10, 5–19. [Google Scholar] [CrossRef]
- Chen, M.; Tan, X.; Zhu, J.; Dong, R.K. Can supply chain digital innovation policy improve the sustainable development performance of manufacturing companies? Humanit. Soc. Sci. Commun. 2025, 12, 307. [Google Scholar] [CrossRef]
- Czarnitzki, D.; Fernández, G.P.; Rammer, C. Artificial intelligence and firm-level productivity. J. Econ. Behav. Organ. 2023, 211, 188–205. [Google Scholar] [CrossRef]
- Gupta, S.; Modgil, S.; Choi, T.-M.; Kumar, A.; Antony, J. Influences of artificial intelligence and blockchain technology on financial resilience of supply chains. Int. J. Prod. Econ. 2023, 261, 108868. [Google Scholar] [CrossRef]
- Zahra, S.A.; George, G. Absorptive capacity: A review, reconceptualization, and extension. Acad. Manag. Rev. 2002, 27, 185–203. [Google Scholar] [CrossRef]
- Brynjolfsson, E.; Hitt, L.M. Beyond computation: Information technology, organizational transformation and business performance. J. Econ. Perspect. 2000, 14, 23–48. [Google Scholar] [CrossRef]
- Cassiman, B.; Veugelers, R. In search of complementarity in innovation strategy: Internal R&D and external knowledge acquisition. Manag. Sci. 2006, 52, 68–82. [Google Scholar] [CrossRef]
- Pfeffer, J.; Salancik, G.R. The External Control of Organizations: A Resource Dependence Perspective; Harper & Row: New York, NY, USA, 1978. [Google Scholar]
- Faruquee, M.; Paulraj, A.; Irawan, C.A. Strategic supplier relationships and supply chain resilience: Is digital transformation that precludes trust beneficial? Int. J. Oper. Prod. Manag. 2021, 41, 1192–1219. [Google Scholar] [CrossRef]
- Argyres, N.; Bercovitz, J.; Zanarone, G. The role of relationship scope in sustaining relational contracts in interfirm networks. Strateg. Manag. J. 2020, 41, 222–245. [Google Scholar] [CrossRef]
- DiMaggio, P.J.; Powell, W.W. The iron cage revisited: Institutional isomorphism and collective rationality in organizational fields. Am. Sociol. Rev. 1983, 48, 147–160. [Google Scholar] [CrossRef]
- Scott, W.R. Institutions and Organizations: Ideas and Interests, 3rd ed.; SAGE Publications: Thousand Oaks, CA, USA, 2008. [Google Scholar]
- Goodman-Bacon, A. Difference-in-differences with variation in treatment timing. J. Econom. 2021, 225, 254–277. [Google Scholar] [CrossRef]
- Callaway, B.; Sant’Anna, P.H.C. Difference-in-differences with multiple time periods. J. Econom. 2021, 225, 200–230. [Google Scholar] [CrossRef]
- Correia, S. reghdfe: Stata Module for Linear and Instrumental-Variable/IV Regressions with Multiple Levels of Fixed Effects; Statistical Software Components S457874; Boston College Department of Economics: Boston, MA, USA, 2016; Available online: https://ideas.repec.org/c/boc/bocode/s457874.html.
- Petersen, M.A. Estimating standard errors in finance panel data sets: Comparing approaches. Rev. Financ. Stud. 2009, 22, 435–480. [Google Scholar] [CrossRef]
Figure 1.
Dynamic treatment effect of SCIAPP on the new-AI-supplier share.
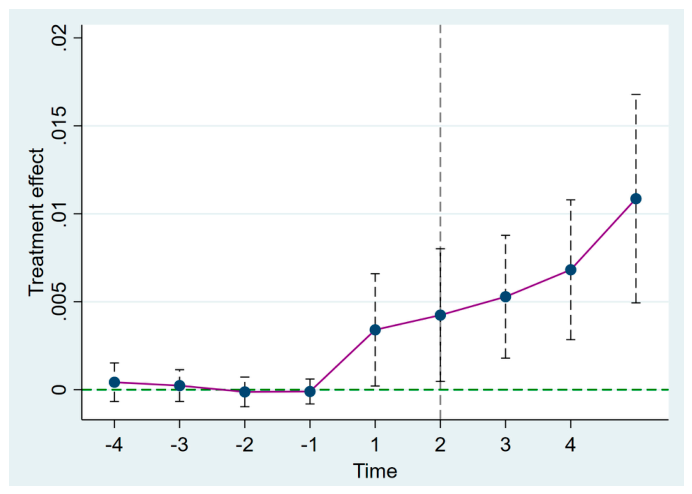
Table 1.
Descriptive statistics and correlation.
| Variables | N | Mean | (1) | (2) | (3) | (4) | (5) | (6) | (7) | (8) |
| new-AI-supplier share | 3807 | 0.0433 | 1.0000 | |||||||
| SCIAPP | 3807 | 0.0412 | -0.0052 | 1.0000 | ||||||
| Internal AI orientation | 3807 | 4.0276 | 0.0262 | 0.0257 | 1.0000 | |||||
| Intangible asset intensity | 3807 | 0.0754 | -0.0262 | -0.0566*** | 0.0158 | 1.0000 | ||||
| Leverage | 3807 | 0.4450 | -0.0226 | 0.1305*** | -0.0268* | 0.0043 | 1.0000 | |||
| Tangibility | 3807 | 0.2265 | -0.0483*** | -0.0664*** | -0.1240*** | -0.1186*** | 0.1566*** | 1.0000 | ||
| Inventory turnover | 3807 | 4.2879 | -0.01 | -0.0209 | 0.0043 | 0.0132 | 0.0429*** | 0.02 | 1.0000 | |
| AI patent stock | 3807 | 0.4099 | 0.3572*** | -0.0611*** | 0.0522*** | 0.009 | 0.0501*** | 0.0246 | -0.0005 | 1.0000 |
Note: *p<0.1, ** p < 0.05, *** p < 0.01.
Table 2.
Baseline effect results.
| (1) | (2) | |
| Baseline | + Moderation | |
| SCIAPP | 0.0316** | 0.0460*** |
| [2.24] | [2.81] | |
| Internal AI orientation | 0.0002 | |
| [0.46] | ||
| SCIAPP × Internal AI orientation | -0.0015** | |
| [-2.14] | ||
| Intangible asset intensity | 0.0417 | 0.0599 |
| [0.74] | [0.82] | |
| Leverage | 0.0013 | -0.0145 |
| [0.11] | [-0.84] | |
| Tangibility | -0.0051 | -0.0066 |
| [-0.24] | [-0.21] | |
| Inventory turnover | 0.0002 | 0.0001 |
| [1.49] | [0.61] | |
| AI patent stock | 0.0824*** | 0.0901*** |
| [9.12] | [8.60] | |
| Constant | -0.0024 | 0.0033 |
| [-0.26] | [0.29] | |
| Firm FE | Yes | Yes |
| Year FE | Yes | Yes |
| Observations | 4843 | 3492 |
| Adjusted R2 | 0.266 | 0.275 |
| F-statistic | 14.92 | 10.89 |
Notes: the dependent variable is the new-AI-supplier share. t-statistics based on standard errors clustered at the firm level are in brackets. All models include firm and year fixed effects. * p < 0.1, ** p < 0.05, *** p < 0.01.
Table 3.
Robustness of the baseline effect.
| (1) | (2) | (3) | (4) | (5) | (6) | (7) | |
| Baseline | Alt. window | Ctrls wins. | + Digital. | + Size, ROA | + Cash | + Margin | |
| SCIAPP | 0.0307** | 0.0324** | 0.0321** | 0.0427*** | 0.0299** | 0.0295** | 0.0309** |
| [2.21] | [2.01] | [2.27] | [2.58] | [2.03] | [2.06] | [2.18] | |
| Intangible asset intensity | 0.0420 | 0.0294 | 0.0408 | 0.0517 | 0.0408 | 0.0594 | 0.0375 |
| [0.72] | [0.55] | [0.70] | [0.71] | [0.73] | [1.03] | [0.66] | |
| Leverage | 0.0014 | -0.0082 | 0.0043 | -0.0149 | -0.0006 | 0.0074 | 0.0016 |
| [0.11] | [-0.78] | [0.23] | [-0.87] | [-0.05] | [0.62] | [0.13] | |
| Tangibility | -0.0094 | 0.0022 | -0.0049 | -0.0019 | -0.0105 | 0.0087 | -0.0070 |
| [-0.42] | [0.12] | [-0.22] | [-0.06] | [-0.48] | [0.39] | [-0.33] | |
| Inventory turnover | 0.0002 | 0.0004** | 0.0003 | 0.0001 | 0.0002 | 0.0001 | 0.0002 |
| [1.47] | [2.23] | [1.60] | [0.74] | [1.45] | [1.34] | [1.57] | |
| AI patent stock | 0.0841*** | 0.0817*** | 0.0845*** | 0.0879*** | 0.0823*** | 0.0823*** | 0.0824*** |
| [9.19] | [7.41] | [9.24] | [8.52] | [9.10] | [9.12] | [9.12] | |
| Digitalization | 0.0003 | ||||||
| [1.60] | |||||||
| Firm size | 0.0043 | ||||||
| [1.50] | |||||||
| ROA | -0.0022 | ||||||
| [-0.07] | |||||||
| Cash holdings | 0.0442* | ||||||
| [1.75] | |||||||
| Gross margin | 0.0085 | ||||||
| [1.38] | |||||||
| Constant | -0.0015 | -0.0010 | -0.0046 | -0.0031 | -0.0371 | -0.0193 | -0.0048 |
| [-0.16] | [-0.11] | [-0.43] | [-0.26] | [-1.40] | [-1.59] | [-0.53] | |
| Firm FE | Yes | Yes | Yes | Yes | Yes | Yes | Yes |
| Year FE | Yes | Yes | Yes | Yes | Yes | Yes | Yes |
| Observations | 4690 | 3602 | 4843 | 3586 | 4843 | 4843 | 4843 |
| Adjusted R2 | 0.265 | 0.287 | 0.266 | 0.276 | 0.266 | 0.266 | 0.266 |
| F-statistic | 15.12 | 10.27 | 15.35 | 12.08 | 11.36 | 14.11 | 13.05 |
Notes: the dependent variable is the new-AI-supplier share. t-statistics based on standard errors clustered at the firm level are in brackets. All models include firm and year fixed effects. * p < 0.1, ** p < 0.05, *** p < 0.01. Columns report, respectively: the 2015–2023 window; exclusion of 2020–2021; controls winsorized at the 1st/99th percentiles; and the baseline augmented with a digitalization index; firm size and ROA; cash holdings; and gross margin.
Table 4.
Robustness of the moderating effect.
| (1) | (2) | (3) | (4) | (5) | (6) | |
| Baseline | Alt. window | + Digital. | + Size, ROA | + Cash | + Margin | |
| SCIAPP | 0.0460*** | 0.0487*** | 0.0473*** | 0.0438** | 0.0458*** | 0.0464*** |
| [2.81] | [2.78] | [2.84] | [2.37] | [2.72] | [2.77] | |
| Internal AI orientation | 0.0002 | 0.0006 | 0.0001 | 0.0002 | 0.0002 | 0.0002 |
| [0.46] | [1.18] | [0.16] | [0.42] | [0.39] | [0.38] | |
| SCIAPP × Internal AI | -0.0015** | -0.0027*** | -0.0015** | -0.0015** | -0.0015** | -0.0015** |
| [-2.14] | [-3.52] | [-2.09] | [-2.11] | [-2.07] | [-2.09] | |
| Intangible asset intensity | 0.0599 | 0.0666 | 0.0522 | 0.0553 | 0.0681 | 0.0561 |
| [0.82] | [0.93] | [0.72] | [0.76] | [0.92] | [0.78] | |
| Leverage | -0.0145 | -0.0199 | -0.0150 | -0.0222 | -0.0126 | -0.0150 |
| [-0.84] | [-1.35] | [-0.88] | [-1.30] | [-0.78] | [-0.89] | |
| Tangibility | -0.0066 | 0.0035 | -0.0019 | -0.0067 | 0.0036 | -0.0047 |
| [-0.21] | [0.14] | [-0.06] | [-0.21] | [0.11] | [-0.16] | |
| Inventory turnover | 0.0001 | 0.0002 | 0.0001 | 0.0001 | 0.0001 | 0.0001 |
| [0.61] | [1.46] | [0.74] | [0.47] | [0.68] | [0.77] | |
| AI patent stock | 0.0901*** | 0.0864*** | 0.0879*** | 0.0881*** | 0.0880*** | 0.0881*** |
| [8.60] | [6.70] | [8.51] | [8.50] | [8.51] | [8.51] | |
| Digitalization | 0.0003 | |||||
| [1.49] | ||||||
| Firm size | 0.0064 | |||||
| [1.58] | ||||||
| ROA | 0.0346 | |||||
| [0.95] | ||||||
| Cash holdings | 0.0185 | |||||
| [0.57] | ||||||
| Gross margin | 0.0099 | |||||
| [1.12] | ||||||
| Constant | 0.0033 | 0.0001 | -0.0033 | -0.0544 | -0.0043 | 0.0001 |
| [0.29] | [0.01] | [-0.27] | [-1.50] | [-0.28] | [0.01] | |
| Firm FE | Yes | Yes | Yes | Yes | Yes | Yes |
| Year FE | Yes | Yes | Yes | Yes | Yes | Yes |
| Observations | 3492 | 2648 | 3586 | 3586 | 3586 | 3586 |
| Adjusted R2 | 0.275 | 0.288 | 0.275 | 0.275 | 0.275 | 0.275 |
| F-statistic | 10.89 | 7.64 | 9.58 | 8.68 | 9.95 | 9.64 |
Notes: the dependent variable is the new-AI-supplier share. t-statistics based on standard errors clustered at the firm level are in brackets. All models include firm and year fixed effects. * p < 0.1, ** p < 0.05, *** p < 0.01. Columns report the moderation specification under the baseline sample; an alternative sample window; and the baseline augmented with a digitalization index; firm size and ROA; cash holdings; and gross margin.
Table 5.
Heterogeneity analysis.
| (1) | (2) | (3) | (4) | (5) | (6) | |
| High digital | Low digital | Mfg. | Non-Mfg. | Large | Small | |
| SCIAPP | 0.0400** | 0.0132 | 0.0234 | 0.0402** | 0.0241 | 0.0716** |
| [2.34] | [0.90] | [0.93] | [2.50] | [1.38] | [2.37] | |
| Intangible asset intensity | 0.0256 | 0.0727 | -0.0431 | 0.1106 | 0.1205 | -0.0091 |
| [0.28] | [0.92] | [-1.04] | [1.17] | [1.45] | [-0.11] | |
| Leverage | -0.0229 | 0.0225 | -0.0088 | 0.0229 | -0.0137 | 0.0138 |
| [-1.29] | [1.15] | [-0.66] | [0.88] | [-0.81] | [0.81] | |
| Tangibility | 0.0187 | -0.0155 | -0.0126 | -0.0015 | -0.0187 | 0.0477 |
| [0.46] | [-0.52] | [-0.53] | [-0.04] | [-0.68] | [1.31] | |
| Inventory turnover | 0.0005** | -0.0001 | 0.0002 | 0.0002 | 0.0001 | 0.0002 |
| [1.99] | [-0.65] | [1.44] | [1.22] | [0.92] | [1.21] | |
| AI patent stock | 0.0921*** | 0.0583*** | 0.0827*** | 0.0837*** | 0.0606*** | 0.1067*** |
| [7.45] | [4.47] | [5.54] | [7.18] | [5.96] | [7.34] | |
| Constant | 0.0053 | -0.0104 | 0.0154* | -0.0285 | 0.0020 | -0.0114 |
| [0.37] | [-0.90] | [1.73] | [-1.47] | [0.15] | [-0.95] | |
| Firm FE | Yes | Yes | Yes | Yes | Yes | Yes |
| Year FE | Yes | Yes | Yes | Yes | Yes | Yes |
| Observations | 2389 | 1989 | 2779 | 2040 | 2723 | 2120 |
| Adjusted R2 | 0.294 | 0.193 | 0.261 | 0.275 | 0.158 | 0.343 |
| F-statistic | 11.47 | 3.67 | 6.07 | 9.18 | 6.68 | 10.67 |
Notes: the dependent variable is the new-AI-supplier share. t-statistics based on standard errors clustered at the firm level are in brackets. All models include firm and year fixed effects. * p < 0.1, ** p < 0.05, *** p < 0.01. Columns split the sample by digitalization level (high vs. low), industry (manufacturing vs. non-manufacturing), and firm size (large vs. small).
Disclaimer/Publisher’s Note: The statements, opinions and data contained in all publications are solely those of the individual author(s) and contributor(s) and not of MDPI and/or the editor(s). MDPI and/or the editor(s) disclaim responsibility for any injury to people or property resulting from any ideas, methods, instructions or products referred to in the content. |
© 2026 by the authors. Licensee MDPI, Basel, Switzerland. This article is an open access article distributed under the terms and conditions of the Creative Commons Attribution (CC BY) license.
Copyright: This open access article is published under a Creative Commons CC BY 4.0 license, which permit the free download, distribution, and reuse, provided that the author and preprint are cited in any reuse.


