

Submitted:
03 July 2026
Posted:
06 July 2026
You are already at the latest version
Abstract
Debris flows pose a significant hazard in mountainous and coastal arid regions, yet their rapid post-event assessment remains challenging. In March 2023, the Yaku event generated extreme rainfall across Peru’s Pacific watershed, triggering a debris flood in the Cusipata catchment, Lima department, Peru. This study presents an integrated analysis combining morphometric classification, hydrological modelling, and numerical simulation to characterise the debris flood hazard and support risk assessment. The catchment was classified as debris flood-dominated using three independent morphometric approaches, consistent with a hyperconcentrated flow regime inferred from field-measured sediment concentration. A local rainfall intensity–duration threshold was derived using True Skill Statistic optimisation, providing a basis for early warning systems and validated operationally during the 2026 rainy season. The catchment hydrological response was simulated using event-based modelling, and the resulting hydrograph was used as input to RAMMS debris flow simulations with a Voellmy friction model. Two scenarios were evaluated: the Yaku event using the pre-event topography, and a post-Yaku scenario reflecting damaged retention infrastructure. Hazard maps indicate a significantly increased flow extent and intensity in the post-Yaku scenario due to compromised protective structures. These results were applied to support a formal risk assessment and demonstrate the value of integrating drone-derived topography, locally calibrated thresholds, and physically based modelling for post-disaster hazard characterisation in arid Andean catchments.
Keywords:
debris flow
; hyperconcentrated flow
; RAMMS
; cyclone Yaku
; rainfall threshold
; HEC-HMS
; Peru
; Andes
1. Introduction
Debris flows (DFs) are a common yet significant hazard in mountainous regions and areas where steep slopes intersect loose sediment deposits [1,2,3,4,5,6,7,8]. According to the updated Varnes classification, DFs are defined as very rapid to extremely rapid flows of saturated debris occurring in steep channels with significant entrainment of material and water [9]. DFs are destructive water-saturated mass flows conditioned primarily by three factors: the presence of erosion-susceptible substrates providing large amounts of sedimentary material, steep channel gradients exceeding 25–30% depending on the friction angle of the material, and large water volumes triggering these phenomena [8,10]. DFs pose a direct threat to human life [2,11,12,13], as well as to downstream infrastructure including houses, roads, and bridges [2,14,15]. Additionally, the expansion of the urban interface in vulnerable and exposed regions, including western Lima in Peru [16,17], has heightened the threats posed by DFs. Given the numerous hazards posed by DFs, there is a continuous need for methods to delineate potential risk zones associated with DF inundation. This is particularly important in landscapes recently disturbed by debris flows, where a subsequent DF could produce an abrupt increase in impact due to collapsed protective measures, requiring rapid post-event risk assessment to provide reliable information for decision-makers.
The occurrence of a DF disturbs the landscape in different ways due to the geomorphological processes it induces. DFs primarily alter channel beds, bank morphology, drainage networks, and alluvial fans [18,19,20,21,22,23]. Four geomorphological changes increase in-channel hazards: (i) gradient steepening, headwall retreat, and denudation in the steep initiation zone; (ii) channel progradation; (iii) channel widening due to burial or incision due to erosion; and (iv) increased channel curvature and river sinuosity [8].
To identify potentially affected areas and the severity of impacts, it is desirable to simulate the debris flow path [24]. The primary consideration in DF analysis is the prediction of downslope propagation, or runout distance [25,26], which can be resolved using numerical simulations [27].
High-discharge sediment–water flows occurring naturally in open channels vary along a broad and continuous spectrum of sediment concentration and particle size distribution [28]. For example, Rickenmann and Zimmermann [1] define DFs as a fast-flowing mixture of sediment and water characterised by a volumetric concentration that may vary between 30 and 60%. Takahashi [29] proposes a mechanical classification of solid particle motion based on the volumetric concentration (C), establishing critical thresholds to distinguish between different flow regimes: individual particle transport (), immature debris flow (), debris flow (), and quasi-static debris flow (). Thouret et al. [8] define debris flows as flows with at least 60% solid volume completely mixed with water, distinguishing them from hyperconcentrated flows defined as two-phase flows intermediate in sediment concentration between normal streamflows and DFs, with a volumetric sediment concentration between 20% and 60%. Although the debate on the nomenclature of flow types continues [18,21,30,31,32], this study considers that the evolution of the sediment–water mixture includes three phases in terms of sediment concentration, grain-size distribution, and bulk density: streamflow (also referred to as water floods or clear-water flows), hyperconcentrated flow (also referred to as debris floods or mud floods), and fully developed debris flow (also referred to as debris flows or mudflows) [2,21,31,33,34]. The transition between any of these phases occurs spatially and temporally throughout the rainfall process [33,35].
Streamflows are liquid flows with a volumetric sediment concentration () below 20%. Hyperconcentrated flows are two-phase flows intermediate between streamflows and debris flows, with ranging from 20 to 45% (40–80% by weight) and densities between 1300 and 1800 kg/m3. Debris flows comprise a solid phase with exceeding 45% (>80% by weight), completely mixed with water [33]. The solid component consists mainly of gravel and boulders with low proportions of sand, silt, and clay, with a threshold of 3% by weight of fines (silt and clay) to distinguish between non-cohesive and cohesive DFs. The bulk density of a fully developed DF ranges between 1800 and 2400 kg/m3 [8,36]. Different methods have been developed to classify these flow types, including morphometric approaches [35,37,38], approaches based on sediment concentration and deposit morphology [39], and approaches based on hydrodynamic conditions and sediment availability using machine learning techniques [39]. Throughout this study, these sediment–water flows are collectively referred to as debris flows.
DFs are triggered primarily by intense rainfall and are sensitive to climate change [40,41,42]. As extreme storms become more frequent, addressing rainfall-induced DFs becomes increasingly critical in DF-prone regions [33]. In 2023, the Yaku event affected the northwestern regions of South America, primarily Peru and parts of Ecuador, exceeding historical monthly maxima at numerous rain gauge stations [43,44,45]. Severe impacts were recorded across several regions of Peru, including the middle-lower reach of the Rímac river basin on the central coast. One of the most widely used approaches to study rainfall as a DF triggering factor is the determination of rainfall thresholds [13,40,46,47,48]. Among the different methods available, empirical–statistical thresholds remain the most representative of DF occurrence at the local scale [36].
The objective of this study is to analyse and simulate a high-discharge sediment–water flow event in Cusipata catchment during the Yaku event, using a two-step approach: simulation of the runoff that triggers the DF, and simulation of the DF propagation to assess potentially affected areas. These results provide crucial information for further risk assessment and hazard mitigation decision-making. Additionally, a locally derived rainfall threshold is presented as a tool for early warning systems to anticipate DF occurrence in the study area.
2. Study Area and Yaku Event
2.1. Study Area
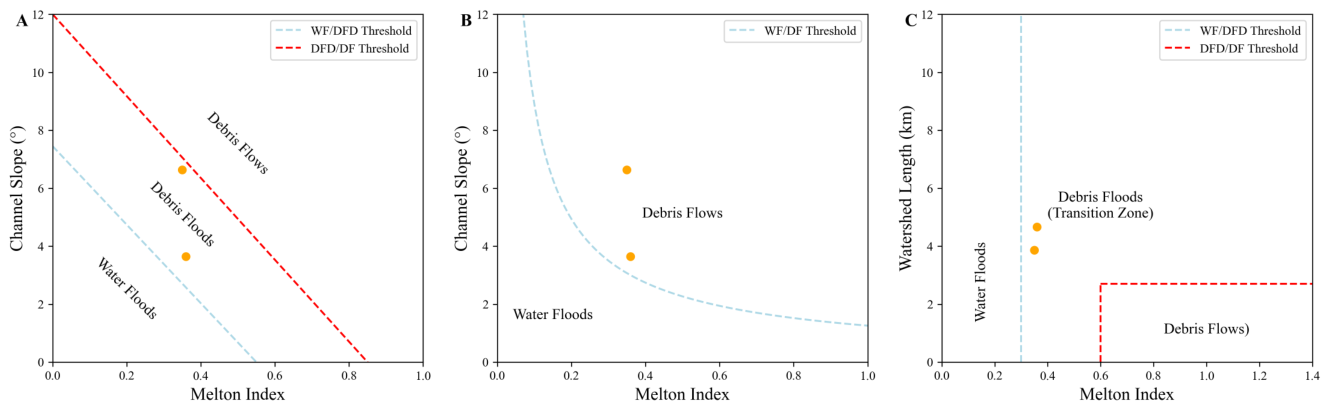
Cusipata catchment is a small catchment located on the western foothills of the Andes, within the middle-lower reach of the Rímac river basin in Peru, in the district of Chaclacayo, province and department of Lima. It is an ephemeral stream that drains naturally into the Rímac river on the Pacific watershed of Peru’s coastal region (Figure 1). The catchment has an arid and temperate climate with moisture deficit throughout the year and annual precipitation ranging from 0 to 5 mm [49]. The catchment covers an area of 8.1 km2, extending from 663 to 1703 m a.s.l. with a mean slope of 13.87%. The longitudinal profile of the channel exhibits a high energy gradient, with an elevation drop of 1028 m over a total length of 7.45 km (Figure 2). The Melton Index at the catchment outlet is 0.36 and 0.35 upstream of the urbanized area, suggesting from a morphometric perspective [18,35,37,38] that hyperconcentrated flows are expected, consistent with previous studies in the area [50].
2.2. Yaku Event
In March 2023, a cyclonic system developed over the eastern Pacific Ocean, designated as the Yaku event by SENAMHI. The Yaku event affected the northwestern regions of South America, primarily Peru and parts of Ecuador, promoting moisture inflow and accumulation that generated extreme rainfall between 5 and 15 March, exceeding historical monthly maxima rainfall records at numerous rain gauge stations and producing severe impacts across several regions of Peru, including the middle-lower Rímac river basin on the central coast. This event coincided with the onset of the 2023 Coastal El Niño, although its teleconnections have not yet been studied in depth. The Yaku event was classified by SENAMHI-Peru as a cyclone with unorganized tropical characteristics [43,44,45]. Rainfall in the middle-lower Rímac basin (including Cusipata catchment) occurred between 10 and 15 March, triggering DFs along the affected channels. The accumulated rainfall recorded at the Cusipata station was 21.8 mm. Most DFs are triggered by events with accumulated rainfall exceeding 5 mm [40], similar to values reported for small catchments in alpine regions [36].
3. Data and Methods
3.1. Data
Rainfall data were provided by SENAMHI-Peru. In 2022, SENAMHI installed the Cusipata rain gauge for research purposes, aimed at characterizing extreme rainfall events (latitude −11.98599°, longitude −76.76879°, altitude 752 m a.s.l.). This gauge is part of a network of stations operated by SENAMHI that have been used to support early warning systems (EWS) and extreme rainfall monitoring in the region. The gauge is a tipping-bucket type with a resolution of 0.2 mm and a sampling frequency of 10 minutes.
Topographic data were obtained from two digital elevation models (DEMs) generated before and after the Yaku event. These DEMs were produced by SENAMHI using photogrammetry with a Wingtra drone, with resolutions of 0.07 m and 0.23 m, respectively. Additionally, data on the mechanical properties of sediment deposits at eight locations along the channel were provided by SENAMHI, including coarse and fine particle size analyses, moisture content, liquid and plastic limits, soil classification (USCS), natural density, specific gravity of solids, friction angle, cohesion, and permeability.
During the rainy season from January to March 2023 (90 days), 15 days recorded rainfall rates above 0.2 mm, while only 6 days exceeded 1 mm. In February, one of the most intense events of the season occurred on 19 February 2023, with a rate of 3.2 mm over 2 hours. In March, as a result of the Yaku event, a series of rainy days occurred from Friday 10 March to Wednesday 15 March, with the peak rainfall on the afternoon of 14 March reaching 13.4 mm, which triggered a DF in Cusipata catchment (Table 1).
3.2. Hydrological Analysis
The hydrological analysis of the Yaku event was carried out using Lekan, a software application developed by Proyecto Reos [51], designed to support hydrological and hydraulic studies for flood mapping, hydraulic structure dimensioning, and related tasks involving natural surface flows. Lekan provides tools for meteorological and hydrological modelling and flow routing using a hydraulic scheme. The event-based hydrological response of the catchment was simulated using a semi-distributed hydrological model. The Green–Ampt infiltration model was used to partition rainfall into infiltration and runoff, with the SCS unit hydrograph as the transfer function. This methodological scheme was selected for its straightforward and rapid implementation and low computational requirements, making it well-suited for coupling with EWS.
3.3. Debris Flow Dynamics
Debris flow propagation dynamics were simulated using the debris flow module of the RAMMS software [52]. RAMMS DF has been widely used in research and practical applications [53,54] to model flow dynamics and runout over three-dimensional terrain [52], including applications in Peru [55,56]. RAMMS solves depth-averaged two-dimensional shallow water equations (SWE) with a Voellmy fluid friction model, in which the total frictional resistance is decomposed into a dry Coulomb friction term (scaled with flow depth) and a viscous-turbulent friction term (scaled with flow velocity) [52,57]. The RAMMS DF module is designed for rapidly moving rock-particle flow phenomena where the interstitial fluid is mud or slurry.
The spatial inputs required by RAMMS, including the pre-event DEM, the simulation domain extent, and additional field data, were obtained from the study conducted by Asencios Astorayme [50]. To optimise simulation runtime and numerical stability, a mesh resolution of 2 m was used for the initial calibration runs, subsequently refined to 0.5 m for the final simulations. The upstream boundary hydrograph was derived from the hydrological model using data from the rain gauge installed in the catchment.
The model was initialised using field data and assumptions from Asencios Astorayme [50], and was calibrated against the 14 March Yaku event, demonstrating reasonable results suitable for use in different future scenarios.
4. Results
4.1. Classification of Sediment–Water Flow Types
The sediment–water flood hazard analysis began with the identification of flow types occurring in the catchment using a morphometric approach [18], applying three independent morphometric classification methods [35,37,38] to ensure the robustness of the classification. Results indicate that the sediment transfer dynamics in the catchment are dominated by debris floods, consistent with previous studies in the area. The only exception is the method of Bertrand et al. [38], which lacks an intermediate class between water floods and debris flows and therefore classifies the catchment as fully developed debris flow.
Figure 3.
Melton Index, channel slope, and basin length thresholds using morphometric approaches of (a) Marchi et al. [37], (b) Bertrand et al. [38], and (c) Wilford et al. [35] for predicting sediment–water flow types in Cusipata catchment at the catchment outlet and upstream of the urbanized area.
Figure 3.
Melton Index, channel slope, and basin length thresholds using morphometric approaches of (a) Marchi et al. [37], (b) Bertrand et al. [38], and (c) Wilford et al. [35] for predicting sediment–water flow types in Cusipata catchment at the catchment outlet and upstream of the urbanized area.
4.2. Triggering Rainfall
Intense rainfall is the primary factor controlling debris flow activity [40,58]. During the Yaku event, a succession of rainfall episodes occurred in Cusipata catchment. The most impactful event occurred on 14 March, with a first rainfall period between 13:15 and 14:35 (duration 1.4 hours) and a second, more intense pulse recorded between 16:00 and 21:25 (duration 5.4 hours), totalling approximately 8 hours from onset, according to the Cusipata rain gauge records. Accumulated rainfall recorded across eight surface rain gauges ranged from 13.4 to 22 mm. The accumulated rainfall at the Cusipata station was 13.4 mm. Figure 4 illustrates the hourly rainfall recorded at the Cusipata station. The maximum hourly intensity was 2.6 mm·h−1 between 17:00 and 18:00 LT, representing 18% of the total accumulated rainfall. Overall, this storm can be characterised by its short duration and high intensity.
4.2.1. Local Rainfall Threshold
The local rainfall threshold for Cusipata catchment was derived from the available rainfall records at the Cusipata station covering the rainy season (21/12/2022–17/04/2023). The threshold was defined following the equation [59], where the shape parameter was estimated by linear regression of triggering rainfall events, and the scaling parameter was estimated by maximising the True Skill Statistic (TSS) using a Nelder–Mead optimisation [60]. The defined threshold is , with duration D in hours and intensity I in mm/h. The proposed threshold was also compared against thresholds from other studies at different scales: global [59], regional [40], and local for an alpine catchment [36] (Figure 5).
4.3. Catchment Hydrological Response Simulation
The catchment hydrological response simulation used the hourly rainfall recorded at the Cusipata station as input (Figure 6). The 0.2 mm rainfall recorded at 04:00 LT did not generate runoff. The hydrograph captures the two storm pulses, from 13:00 LT to past 23:00 LT. Peak liquid discharge was reached at 17:55 LT with a value of 4.23 m3/s. A volumetric sediment concentration , calibrated by Asencios Astorayme [50] for this catchment, was applied to obtain a mixed flow peak of 5.42 m3/s. These values were used as the boundary input to the debris flow model.
4.4. Debris Flow Model
Friction parameter selection requires careful model calibration using reference data such as field observations, photographs of deposition zones, estimated or measured flow velocities and depths, and material composition. Calibrating the Voellmy friction model is one of the most critical steps for obtaining realistic and useful results from RAMMS::DebrisFlow. Calibration requires a well-documented historical event, in this case the 14 March 2023 Yaku event. Reference data — including flow depths and velocities at multiple channel locations, material composition, flow path information, and initial release volumes — were obtained from the catchment characterisation study conducted by SENAMHI [50], the debris flow risk assessment report for the urban area of the Cusipata sub-basin prepared by CENEPRED-SENAMHI-Municipalidad de Lima, and procedures developed within this study. Calibration consisted of identifying the Voellmy friction coefficients (dry Coulomb friction and viscous-turbulent friction ) that best reproduce the historical event, following the steps described in the RAMMS user manual [52].
The calibration process was divided into two stages. The first stage aimed at reproducing the observed flood inundation extent through a set of RAMMS simulations, primarily varying the parameter (Figure 7). These simulations revealed that varying density without including erodible areas did not affect flow depth or propagation; furthermore, values above 0.15 failed to reproduce the observed flow extent. Additionally, this stage showed that a DEM resolution of 2 m proved insufficient to capture the fine-scale surface features of the study area; a 0.5 m resolution was therefore adopted for the second stage.
The second calibration stage focused on reproducing observed flow depths through simulations varying . The simulation outputs were compared against maximum flow depth observations at control cross-sections (XS are shown in Figure 7) situated along streets through which the flow transited. The RAMMS simulations were evaluated by comparing the peak flow depth at each XS against field-observed depth bounds (, ) derived from Yaku post-event surveys (Figure 8 and Figure 9) conducted by CENEPRED ([61]). The Coulomb friction parameter was held constant at , a value consistent with observed flow propagation within the modelled domain [52,62], yielding the best calibration results without erosion. Most erosion-related parameters retained their default values, with m/s and kPa, derived from observations at the Illgraben torrent [54,63]. XS-1 and XS-4 exhibited consistent agreement across all simulations, with deviations from the observed midpoint below 0.40 m. XS-2, XS-3, and XS-5 exhibited systematic overestimation ranging from 1.0 to 1.4 m above the observed reference, while XS-6 was reproduced within the observed range only by simulations Sim 19–Sim 22. Sim 21 achieved the best overall performance with an RMSE of 0.668 m and a MAE of 0.515 m, reproducing the observed depth range at three of six XS (50%), and was therefore selected as the reference run for hazard mapping and post-event analysis.
4.5. Debris Flow Simulation
Figure 10 shows the maximum simulated flow depths for the debris flood propagation during the most intense rainfall event of March 2023, using the pre-event topography. A post-Yaku scenario was also simulated using an updated DEM in which the retention check dams were damaged during the Yaku event, allowing unimpeded flow through the middle-lower reach of the catchment.
Hazard assessment is a key step in debris flood risk analysis, translating directly into emergency planning, flood risk management strategies, and mitigation measures to improve the resilience of communities in flood-prone areas [64]. Several quantitative hazard assessment methods exist for general flood hazards [64]; specific methodologies have also been proposed for debris flow-related flooding, including those of Loat and Petrascheck [65] from the Swiss government, Rickenmann [66], and the British government’s debris flow-affected flood analysis methodology [67,68,69]. This study adopted an update of the Rickenmann methodology by Tsao et al. [70] to estimate debris flood hazard by combining hydraulic intensity variables (flow depth and velocity), as shown in Figure 11.
5. Discussion
The 14 March event was the most impactful of the 2023 season. However, two additional events warrant discussion in the context of threshold performance. On 19 February 2023, a liquid flow was triggered by rainfall intensities significantly below the defined threshold, with event durations of 10 to 30 minutes. A likely explanation is the influence of antecedent precipitation within the preceding 7 days ( 1 mm), which may have reduced the effective triggering threshold by pre-conditioning the catchment surface. On 15 March 2023, a mudflow event was recorded in Cusipata catchment, despite no rainfall being registered at the Cusipata pluviometer. This apparent inconsistency is attributed to the spatial variability of convective rainfall at the local scale: the gauge, located in the middle-lower reach approximately 1 km from the initiation zone, likely failed to capture rainfall occurring in the upper catchment, as is commonly observed in small steep basins where storm cells can be highly localized [36,71,72]. Furthermore, the high antecedent rainfall accumulated during 10–14 March may have substantially reduced the triggering threshold, enabling a relatively minor upper-catchment rainfall to mobilize sediment. This event underscores the importance of spatially distributed rainfall data for improving the reliability of debris flow early warning systems in topographically complex catchments, representing a key avenue for future research. In this regard, the ongoing installation of weather radars in arid coastal basins of Peru — including the Ica and Piura regions — represents a significant opportunity to enhance spatial rainfall estimation and, consequently, the performance of locally calibrated intensity–duration thresholds in catchments where point gauge networks remain insufficient.
The low scaling exponent () of the Cusipata threshold contrasts markedly with values reported for comparable arid catchments along the Peruvian coast. Goyburo et al. [73] derived thresholds for mudflow events in the Malanche–Río Seco catchment at Punta Hermosa (151.9 km2) — also an arid coastal basin in Peru — reporting at the time of occurrence and two hours prior, for durations between 5 and 16 hours. The near-zero obtained for Cusipata (8.1 km2) implies that flow initiation is largely insensitive to event duration, suggesting that short but intense convective pulses — such as those recorded on 14 March 2023 — are sufficient to trigger debris floods regardless of duration. This difference in is consistent with the contrasting catchment sizes: the larger Malanche–Río Seco basin exhibits longer concentration times, making the triggering intensity more dependent on event duration, whereas the small and steep Cusipata catchment responds rapidly even to brief rainfall. This behavior may also reflect the extremely low antecedent moisture conditions typical of the coastal arid zone, where even brief rainfall saturates a thin active layer and immediately generates runoff. Although the threshold was calibrated from a limited dataset restricted to the 2022–2023 rainy season (January–March), its operational evaluation during the 2026 season confirms its practical utility for early warning purposes. Nevertheless, its parameters should be updated as additional triggering events are recorded in subsequent seasons, and it is proposed that future work develop differentiated activation levels (e.g., yellow, orange, and red alerts) based on an expanded event catalogue.
The rainfall thresholds derived in this study were operationally used during the January–March 2026 rainy season as part of a monitoring system, called ISAAC (Intense Rainfall Monitoring in Lima Region for Catchments Activations - https://bit.ly/ISAAC_SENAMHI), deployed for the study area and adjacent catchments. On 25 February 2026, the thresholds successfully anticipated debris flood activity in the catchments monitored, triggering timely alerts before the events reached the downstream populated areas. However, in Castilla catchment no population was affected, as flexible debris flow barriers and check dams intercepted the flows in the upper and middle reaches. In contrast, in San Francisco catchment, hyperconcentrated flows were recorded, clogging the channel upstream of the populated area and partially inundating it, evidencing the limitations of the existing control infrastructure under the observed flow conditions. A drone survey conducted on 26 February 2026 confirmed the interception of deposits upstream of the control structures at Castilla catchment and the inundation extent at San Francisco catchment (Figure 12). These results demonstrate the operational utility of locally calibrated intensity–duration thresholds for real-time hazard anticipation in arid coastal catchments, where the short response times between rainfall onset and flow initiation demand rapid and reliable warning tools, regardless of the level of mitigation infrastructure in place.
The morphometric classification of Cusipata catchment as debris flood-dominated ([35,37]) is consistent with its measured sediment volumetric concentration (; [50]), which places the event within the hyperconcentrated flow regime as defined by Thouret et al. ([8]) and Pierson ([31]). Although these two classifications arise from different frameworks — one geomorphological and one rheological — they are not contradictory: debris flood is the process-based descriptor used in morphometric approaches, while hyperconcentrated flow defines the same phenomenon in terms of sediment concentration and flow rheology. The exception is the Bertrand et al. ([38]) method, which lacks an intermediate class between water flood and debris flow, leading to a debris flow classification for the same Melton Index value. This highlights a known limitation of binary morphometric schemes, as noted by Brenna et al. ([18]), who emphasise that the transition between flow types is continuous rather than discrete, and that a single morphometric index is insufficient to fully characterise sediment–water flow dynamics. In this study, the term debris flood is adopted as the primary descriptor, in line with the majority of morphometric evidence, while acknowledging that the flow exhibits the rheological characteristics of a hyperconcentrated flow.
Regarding the model calibration, the systematic overestimation observed at XS 2, XS 3, and XS 5 is likely related to the limitations of representing urban flow dynamics in a continuum-based debris flow model. All cross-sections are situated along streets through which the flow transited, where buildings act as lateral barriers that effectively reduce the active flow width. Since RAMMS operates on a bare-earth DEM without explicit representation of building volumes, the model distributes the flow over a wider effective cross-section, resulting in greater computed depths than those recorded in the field. This is a known limitation of bare-earth terrain models in urban debris flow applications. Future simulations incorporating building footprints as solid obstacles within the DEM may reduce this bias.
The hazard assessment derived from the RAMMS simulations identifies three intensity levels — low, medium, and high — based on the combined thresholds of flow depth and velocity following the methodology of Rickenmann, updated by Tsao et al. [70] (Figure 11). In the Yaku scenario, high hazard is primarily confined to the main channel corridor, with medium and low hazard extending laterally into adjacent streets in the upper and middle reaches. In contrast, the post-Yaku scenario shows a marked increase in the spatial extent of all three hazard levels across the urban area, driven by the loss of retention capacity in the damaged check dams. High hazard zones expand significantly into the middle-lower reach, where previously protected areas become directly exposed to debris flood inundation. This spatial shift highlights the critical role of retention infrastructure in controlling hazard extent, and demonstrates that a future event of similar magnitude under post-Yaku topographic conditions would pose substantially greater risk to the downstream community than the 2023 event itself.
6. Conclusions
This study presents an integrated analysis of a debris flood triggered by the Yaku event on 14 March 2023 in the Cusipata catchment (8.1 km2), combining morphometric classification, hydrological modelling, numerical simulation, and field observations to characterise the hazard and support risk assessment in an arid coastal catchment of Peru.
Morphometric classification using three independent methods based on the Melton Index (0.35–0.36) consistently identified the catchment as debris flood-dominated, consistent with the measured sediment volumetric concentration () placing the event within the hyperconcentrated flow regime. A local intensity–duration rainfall threshold () was derived using True Skill Statistic optimisation, providing a quantitative basis for early warning. The threshold was successfully validated during the January–March 2026 rainy season, demonstrating its operational utility for anticipating debris flood events in adjacent catchments, including cases where the presence or absence of retention infrastructure determined the impact on downstream communities.
Hydrological modelling using the Green–Ampt infiltration model and the SCS unit hydrograph reproduced the catchment response to the 14 March storm, yielding a peak liquid discharge of 4.23 m3/s and a mixed flow of 5.42 m3/s at a volumetric sediment concentration of 0.22. These results provided the input hydrograph for the RAMMS debris flow simulations. Model calibration across six street-routed cross-sections identified Simulation 21 () as the best-performing run, reproducing the observed depth range at three of six cross-sections (RMSE = 0.668 m), with systematic overestimation in unconfined urban reaches attributed to the bare-earth DEM not representing building volumes.
Two simulation scenarios were produced: the Yaku event using the pre-event DEM, and a post-Yaku scenario using an updated DEM reflecting infrastructure damage ([61]). Hazard mapping following the methodology of Rickenmann updated by Tsao et al. [70] revealed a significant expansion of medium and high hazard zones in the post-Yaku scenario, driven by the loss of retention capacity in damaged check dams. These results were directly applied to support the formal risk assessment conducted by CENEPRED for the Cusipata catchment.
These findings underscore the value of integrating high-resolution pre- and post-event topographic surveys with numerical debris flow modelling for rapid and reliable risk assessment in data-scarce arid catchments. The combined use of drone-derived DEMs, locally calibrated rainfall thresholds, and physically based simulations provides a transferable framework for post-disaster hazard characterisation that can directly support risk governance decisions in arid coastal catchments prone to extreme rainfall-induced debris floods. Future work should address the high spatial variability of rainfall in the region and explore its coupling with real-time hydrodynamic models to enhance the reliability and anticipation capacity of early warning systems, including basin-scale platforms such as ARGO-Rímac (Forecasting System for Catchment Activation and Risk Management in the Rímac River Basin - https://caemil.shinyapps.io/argo_rimac/) for the Rímac basin.
Author Contributions
Conceptualization, C.M.A. and W.L.C.; methodology, C.M.A.; software, C.M.A.; formal analysis, C.M.A.; investigation, C.M.A.; data curation, C.M.A.; writing—original draft preparation, C.M.A.; writing—review and editing, C.M.A. and W.L.C.; visualization, C.M.A.; supervision, W.L.C. All authors have read and agreed to the published version of the manuscript.
Funding
This research received no external funding.
Institutional Review Board Statement
Not applicable.
Informed Consent Statement
Not applicable.
Data Availability Statement
The data that support the findings of this study are available upon reasonable and justified request to the corresponding author at wlavado@senamhi.gob.pe.
Acknowledgments
This work was supported by the National Service of Meteorology and Hydrology of Peru (SENAMHI), which also provided access to the rainfall and topography data. The authors are grateful to CENEPRED and Municipalidad de Lima for the joint risk assessment report used in the calibration.
Conflicts of Interest
The authors declare no conflicts of interest.
Abbreviations
The following abbreviations are used in this manuscript:
| DF | Debris Flow |
| DEM | Digital Elevation Model |
| DSM | Digital Surface Model |
| DTM | Digital Terrain Model |
| EWS | Early Warning System |
| RAMMS | Rapid Mass Movement Simulation |
| SENAMHI | Servicio Nacional de Meteorología e Hidrología del Perú |
| SCS | Soil Conservation Service |
| SWE | Shallow Water Equations |
| TSS | True Skill Statistic |
References
- Rickenmann, D.; Zimmermann, M. The 1987 debris flows in Switzerland: documentation and analysis. Geomorphology 1993, 8, 175–189. [CrossRef]
- Jakob, M.; Hungr, O. Debris-flow Hazards and Related Phenomena; Springer Praxis Books, Springer Berlin Heidelberg, 2007.
- Webb, R.; Magirl, C.; Griffiths, G.; Boyer, D.E. Debris Flows and Floods in the Southeastern Arizona from Extreme Precipitation in July 2006: Magnitude, Frequency, and Sediment Delivery. U.S. Geological Survey Open File Report 2008-1274 2008.
- Baum, R.L.; Godt, J.W. Early warning of rainfall-induced shallow landslides and debris flows in the USA. Landslides 2010, 7, 259–272. [CrossRef]
- Iverson, R.M. Debris flows: behaviour and hazard assessment. Geology today 2014, 30, 15–20. [CrossRef]
- Gorr, A.N.; Mcguire, L.A.; Youberg, A.M.; Rengers, F.K. A progressive flow-routing model for rapid assessment of debris-flow inundation. Landslides 2022, 19, 2055–2073. [CrossRef]
- An, H.; Ouyang, C.; Wang, F.; Xu, Q.; Wang, D.; Yang, W.; Fan, T. Comprehensive analysis and numerical simulation of a large debris flow in the Meilong catchment, China. Engineering Geology 2022, 298, 106546. [CrossRef]
- Thouret, J.C.C.; Antoine, S.; Magill, C.; Ollier, C. Lahars and debris flows: Characteristics and impacts. Earth-Science Reviews 2020, 201, 103003. [CrossRef]
- Hungr, O.; Leroueil, S.; Picarelli, L. The Varnes classification of landslide types, an update. Landslides 2014, 11, 167–194. [CrossRef]
- Wendeler, C. Debris-flow protection systems for mountain torrents: basics principles for planning and calculation of flexible barriers; Swiss Federal Institute for Forest, Snow and Landscape Research WSL, 2016; pp. 44–279.
- Dowling, C.A.; Santi, P.M. Debris flows and their toll on human life: a global analysis of debris-flow fatalities from 1950 to 2011. Natural hazards 2014, 71, 203–227. [CrossRef]
- Chae, B.G.; Park, H.J.; Catani, F.; Simoni, A.; Berti, M. Landslide prediction, monitoring and early warning: a concise review of state-of-the-art. Geosciences Journal 2017, 21, 1033–1070. [CrossRef]
- Segoni, S.; Tofani, V.; Rosi, A.; Catani, F.; Casagli, N. Combination of rainfall thresholds and susceptibility maps for dynamic landslide hazard assessment at regional scale. Frontiers in Earth Science 2018, 6. [CrossRef]
- Petley, D. Global patterns of loss of life from landslides. Geology 2012, 40, 927–930. [CrossRef]
- Kean, J.W.; Staley, D.M.; Lancaster, J.T.; Rengers, F.K.; Swanson, B.J.; Coe, J.A.; Hernandez, J.L.; Sigman, A.J.; Allstadt, K.E.; Lindsay, D.N. Inundation, flow dynamics, and damage in the 9 January 2018 Montecito debris-flow event, California, USA: Opportunities and challenges for post-wildfire risk assessment. Geosphere 2019, 15, 1140–1163. [CrossRef]
- Moya, L.; Vilela, M.; Jaimes, J.; Espinoza, B.; Pajuelo, J.; Tarque, N.; Santa-Cruz, S.; Vega-Centeno, P.; Yamazaki, F. Vulnerabilities and exposure of recent informal urban areas in Lima, Peru. Progress in Disaster Science 2024, 23, 100345. [CrossRef]
- Parés-Ramos, I.K.; Álvarez-Berríos, N.L.; Aide, T.M. Mapping Urbanization Dynamics in Major Cities of Colombia, Ecuador, Perú, and Bolivia Using Night-Time Satellite Imagery. Land 2013, 2, 37–59. [CrossRef]
- Brenna, A.; Marchi, L.; Borga, M.; Ghinassi, M.; Zaramella, M.; Surian, N. Sediment–water flows in mountain catchments: Insights into transport mechanisms as responses to high-magnitude hydrological events. Journal of Hydrology 2021, 602. [CrossRef]
- Chen, T.Y.K.; Hung, C.Y.; Mullenbach, J.; Hill, K. Influence of fine particle content in debris flows on alluvial fan morphology. Scientific Reports 2022, 12, 1–11. [CrossRef]
- Savi, S.; Tofelde, S.; Wickert, A.D.; Bufe, A.; Schildgen, T.F.; Strecker, M.R. Interactions between main channels and tributary alluvial fans: Channel adjustments and sediment-signal propagation. Earth Surface Dynamics 2020, 8, 303–322. [CrossRef]
- Brenna, A.; Marchi, L.; Borga, M.; Zaramella, M.; Surian, N. What drives major channel widening in mountain rivers during floods? The role of debris floods during a high-magnitude event. Geomorphology 2023, 430, 108650. [CrossRef]
- Bufe, A.; Turowski, J.M.; Burbank, D.W.; Paola, C.; Wickert, A.D.; Tofelde, S. Controls on the lateral channel-migration rate of braided channel systems in coarse non-cohesive sediment. Earth Surface Processes and Landforms 2019, 44, 2823–2836. [CrossRef]
- Davidson, S.L.; Marin-Esteve, B.; Eaton, B. What controls river widening? Comparing large and extreme flood events. Earth Surface Processes and Landforms 2024. [CrossRef]
- Lin, M.L.; Wang, K.L.; Huang, J.J. Debris flow run off simulation and verification - case study of Chen-You-Lan Watershed, Taiwan. Natural Hazards and Earth System Sciences 2005, 5, 439–445. [CrossRef]
- Cannon, S.H. An Evaluation of the Travel-distance Potential of Debris Flows; Number n.º 2;n.º 89 in An Evaluation of the Travel-distance Potential of Debris Flows, Utah Geological and Mineral Survey, 1989.
- Han, Z.; Chen, G.; Li, Y.; Zhang, H.; He, Y. Elementary analysis on the bed-sediment entrainment by debris flow and its application using the TopFlowDF model. Geomatics, Natural Hazards and Risk 2016, 7, 764–785. [CrossRef]
- Han, Z.; Li, Y.; Huang, J.; Chen, G.; Xu, L.; Tang, C.; Zhang, H.; Shang, Y. Numerical simulation for run-out extent of debris flows using an improved cellular automaton model. Bulletin of Engineering Geology and the Environment 2017, 76, 961–974. [CrossRef]
- Pierson, T. Distinguishing between debris flows and floods from field evidence in small watersheds. Water 2005, p. 4.
- Takahashi, T. Debris Flow Mechanics: Prediction and Countermeasures 2nd Edition; CRC Press, 2014; pp. 1–542. [CrossRef]
- Brenna, A.; Surian, N.; Ghinassi, M.; Marchi, L. Sediment–water flows in mountain streams: Recognition and classification based on field evidence. Geomorphology 2020, 371. [CrossRef]
- Pierson, T.C. Hyperconcentrated flow — transitional process between water flow and debris flow. In Debris-flow Hazards and Related Phenomena; Springer Berlin Heidelberg: Berlin, Heidelberg, 2005; pp. 159–202. [CrossRef]
- Church, M.; Jakob, M. What Is a Debris Flood? Water Resources Research 2020, 56. [CrossRef]
- Shen, P.; Zhang, L.; Chen, H.; Fan, R. EDDA 2.0: integrated simulation of debris flow initiation and dynamics considering two initiation mechanisms. Geosci. Model Dev 2018, 11, 2841–2856. [CrossRef]
- Vallance, J.W.; Iverson, R.M. Lahars and their deposits. The Encyclopedia of Volcanoes, 2015.
- Wilford, D.J.; Sakals, M.E.; Innes, J.L.; Sidle, R.C.; Bergerud, W.A. Recognition of debris flow, debris flood and flood hazard through watershed morphometrics. Landslides 2004, 1, 61–66. [CrossRef]
- Hirschberg, J.; Badoux, A.; McArdell, B.W.; Leonarduzzi, E.; Molnar, P. Evaluating methods for debris-flow prediction based on rainfall in an Alpine catchment. Natural Hazards and Earth System Sciences 2021, 21, 2773–2789. [CrossRef]
- Marchi, L.; Pasuto, A.; Tecca, P.R. Flow processes on alluvial fans in the eastern Italian Alps. Zeitschrift fur Geomorphologie 1993, 37, 447–458. [CrossRef]
- Bertrand, M.; Liébault, F.; Piégay, H. Debris-flow susceptibility of upland catchments. Natural Hazards 2013, 67, 497–511. [CrossRef]
- Du, J.; Zhou, G.G.; Tang, H.; Turowski, J.M.; Cui, K.F. Classification of Stream, Hyperconcentrated, and Debris Flow Using Dimensional Analysis and Machine Learning. Water Resources Research 2023, 59. [CrossRef]
- Millán-Arancibia, C.; Lavado-Casimiro, W. Rainfall thresholds estimation for shallow landslides in Peru from gridded daily data. Natural Hazards and Earth System Sciences 2023, 23, 1191–1206. [CrossRef]
- Prenner, D.; Kaitna, R.; Mostbauer, K.; Hrachowitz, M. The Value of Using Multiple Hydrometeorological Variables to Predict Temporal Debris Flow Susceptibility in an Alpine Environment. Water Resources Research 2018, 54, 6822–6843. [CrossRef]
- Segoni, S.; Rossi, G.; Rosi, A.; Catani, F. Landslides triggered by rainfall: A semi-automated procedure to define consistent intensity-duration thresholds. Computers and Geosciences 2014, 63, 123–131. [CrossRef]
- SENAMHI. Efecto del ciclón Yaku y su recorrido. Technical report, SENAMHI, Lima, 2023.
- SENAMHI. EVENTO EXTREMO N° 001-2023 SPM - DMA. Technical report, SENAMHI, Lima, 2023.
- SENAMHI. Precipitaciones y Temperaturas Extremas del aire MARZO 2023. Technical report, 2023. [CrossRef]
- Guzzetti, F.; Peruccacci, S.; Rossi, M.; Stark, C.P. Rainfall thresholds for the initiation of landslides in central and southern Europe. Meteorology and Atmospheric Physics 2007, 98, 239–267. [CrossRef]
- Tang, H.; McGuire, L.A.; Rengers, F.K.; Kean, J.W.; Staley, D.M.; Smith, J.B. Developing and Testing Physically Based Triggering Thresholds for Runoff-Generated Debris Flows. Geophysical Research Letters 2019, 46, 8830–8839. [CrossRef]
- Berti, M.; Bernard, M.; Gregoretti, C.; Simoni, A. Physical Interpretation of Rainfall Thresholds or Runoff-Generated Debris Flows. Journal of Geophysical Research: Earth Surface 2020, 125. [CrossRef]
- SENAMHI. Climas del Perú Mapa de Clasificación Climática Nacional.
- Asencios Astorayme, H.J.S. Caracterización lluvias intensas asociada a peligros de remoción de masa en la quebrada Cusipata - Chaclacayo. Technical report, SENAMHI, Lima, 2022.
- Cloarec, V. Lekan Software, 2023.
- Bartelt, P.; Buehler, Y.; Christen, M.; Deubelbeiss, Y.; Graf, C.; McArdell, B. RAMMS—rapid mass movement simulation, a modeling system for debris flows in research and practice, User Manual v1.8.0, Debris Flow, Manuscript update: July 2024, 2013.
- Könz, A.L.; Hirschberg, J.; McArdell, B.W.; Mirus, B.B.; de Haas, T.; Bartelt, P.; Molnar, P. Debris-flow entrainment modelling under climate change: Considering antecedent moisture conditions along the flow path. Earth Surface Processes and Landforms 2024, 49, 2950 – 2964. [CrossRef]
- Frank, F.; McArdell, B.W.; Huggel, C.; Vieli, A. The importance of entrainment and bulking on debris flow runout modeling: Examples from the Swiss Alps. Natural Hazards and Earth System Sciences 2015, 15, 2569–2583. [CrossRef]
- Motschmann, A.; Huggel, C.; Muñoz, R.; Thür, A. Towards integrated assessments of water risks in deglaciating mountain areas: water scarcity and GLOF risk in the Peruvian Andes. Geoenvironmental Disasters 2020, 7, 1–20. [CrossRef]
- MILLÁN ARANCIBIA, C.E.; ABRAHAM CHAVARRI VELARDE, E. DEBRIS FLOW MODELING FOR RISK ANALYSIS IN LOS CÓNDORES CATCHMENT, CHACLACAYO, LIMA, PERU. In Proceedings of the 38th IAHR World Congress - "Water: Connecting the World", sep 2019, Vol. 38, pp. 3525–3533. [CrossRef]
- Christen, M.; Kowalski, J.; Bartelt, P. RAMMS: Numerical simulation of dense snow avalanches in three-dimensional terrain. Cold Regions Science and Technology 2010, 63, 1–14. [CrossRef]
- Dahlquist, M.P.; West, A.J. Initiation and Runout of Post-Seismic Debris Flows: Insights From the 2015 Gorkha Earthquake. Geophysical Research Letters 2019, 46. [CrossRef]
- Caine, N. The rainfall intensity-duration control of shallow landslides and debris flows. Geografiska annaler A 1980, 62, 23–27. [CrossRef]
- Gao, F.; Han, L. Implementing the Nelder-Mead simplex algorithm with adaptive parameters. Computational Optimization and Applications 2012, 51, 259–277. [CrossRef]
- CENEPRED.; SENAMHI.; de Lima, M. Informe de evaluación de riesgos por flujos de detritos en el área urbana de la subcuenca de Cusipata, distrito de Chaclacayo, provincia de Lima. Technical report, CENEPRED, Lima, 2023.
- Frank, F.; McArdell, B.W.; Oggier, N.; Baer, P.; Christen, M.; Vieli, A. Debris-flow modeling at Meretschibach and Bondasca catchments, Switzerland: sensitivity testing of field-data-based entrainment model. Natural Hazards and Earth System Sciences 2017, 17, 801–815. [CrossRef]
- Berger, C.; McArdell, B.W.; Schlunegger, F. Direct measurement of channel erosion by debris flows, Illgraben, Switzerland. Journal of Geophysical Research: Earth Surface 2011, 116. [CrossRef]
- Maranzoni, A.; D’Oria, M.; Rizzo, C. Quantitative flood hazard assessment methods: A review. Journal of Flood Risk Management 2023, 16, 1–31. [CrossRef]
- Loat, R.; Petrascheck, A. Consideration of flood hazards for activities with spatial impact. Recommendations, 1997.
- Rickenmann, D. Hangmuren und Gefahrenbeurteilung. kurzbericht für das Bundesamt für wasser und Geologie. Unpublished report, Universität für Bodenkultur, Wien, und Eidg. Forschungsanstalt WSL, Birmensdorf, 18p 2005.
- DEFRA, E.A. R&D outputs: Flood risks to people. Phase 2. FD2321/TR1 The flood risks to people methodology, 2006.
- DEFRA, E.A. Flood risks to people (FD2321/TR2 Guidance Document), 2006.
- Wade, S.; Ramsbottom, D.; Floyd, P.; Penning-rowsell, E.; Surendran, S. Risks to people: developing new approaches for flood hazard and vulnerability mapping. 40th DEFRA Flood and Coastal Management Conference 2005, pp. 1–14.
- Tsao, T.C.; Huang, C.Y.; Chien, J.H.; Yin, H.Y.; Chen, C.Y. Comparison of Debris Flow Hazard Mapping between Empirical Function and Numerical Simulation - a Case Study in Taiwan. 2018. [CrossRef]
- Nikolopoulos, E.I.; Crema, S.; Marchi, L.; Marra, F.; Guzzetti, F.; Borga, M. Impact of uncertainty in rainfall estimation on the identification of rainfall thresholds for debris flow occurrence. Geomorphology 2014, 221, 286–297. [CrossRef]
- Marra, F.; Nikolopoulos, E.I.; Creutin, J.D.; Borga, M. Space–time organization of debris flows-triggering rainfall and its effect on the identification of the rainfall threshold relationship. Journal of Hydrology 2016, 541, 246–255. [CrossRef]
- Goyburo, A.; Gutierrez, L.; Rau, P.; Lavado-Casimiro, W. Empirical rainfall thresholds for mudflow events in an arid basin of the Peruvian coast. Frontiers in Water 2025, 7, 1637115. [CrossRef]
Figure 1.
(a) Topographic map of Cusipata catchment with the rain gauge location (red marker) and main channel (green line); (b) reference map showing the location of the Rímac basin, with the Pacific (west), Atlantic (east), and Titicaca (southeast) watersheds; (c) reference map of Cusipata catchment within the Rímac river basin.
Figure 1.
(a) Topographic map of Cusipata catchment with the rain gauge location (red marker) and main channel (green line); (b) reference map showing the location of the Rímac basin, with the Pacific (west), Atlantic (east), and Titicaca (southeast) watersheds; (c) reference map of Cusipata catchment within the Rímac river basin.
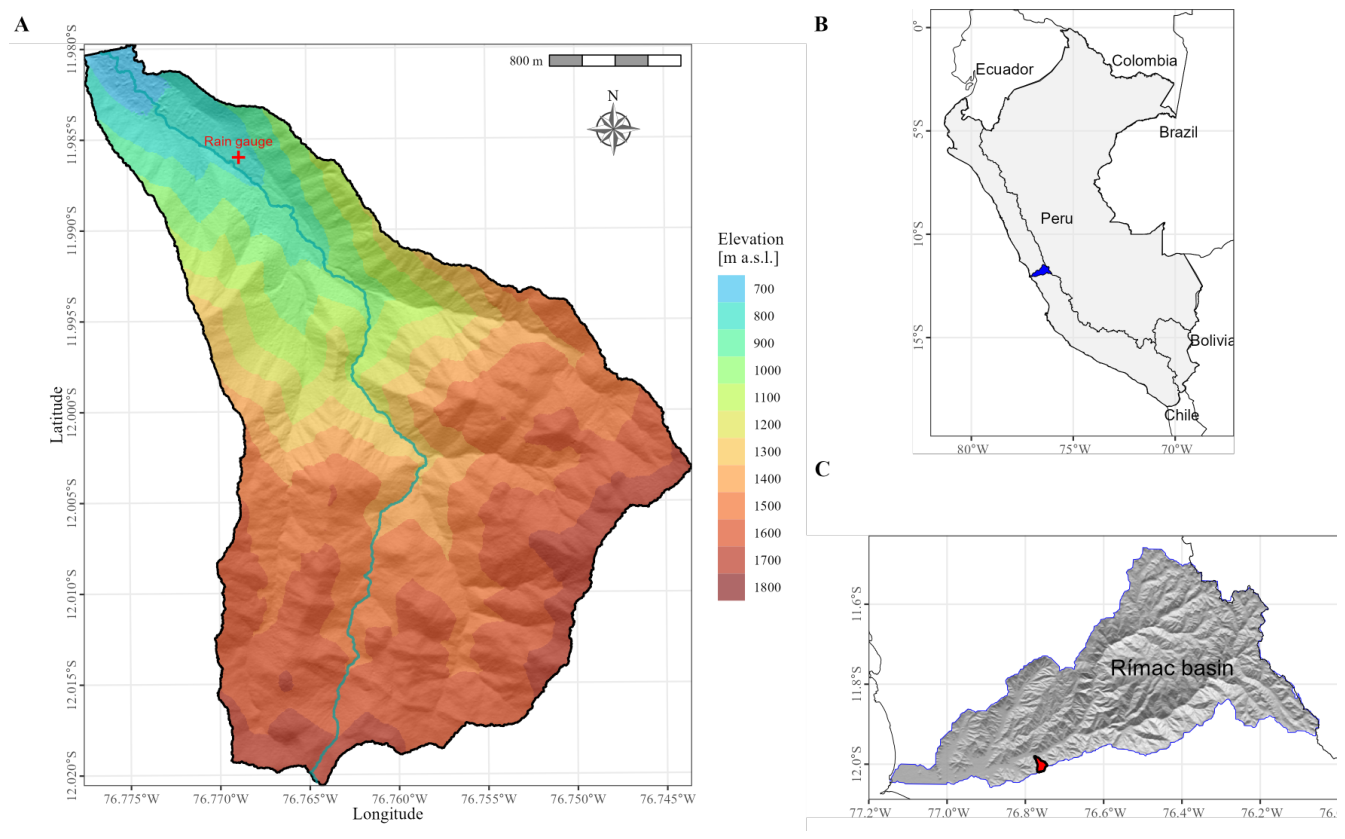
Figure 2.
(a) Hypsometric curve of the Cusipata catchment; (b) longitudinal profile of the main channel; (c) slope histogram of the main channel.
Figure 2.
(a) Hypsometric curve of the Cusipata catchment; (b) longitudinal profile of the main channel; (c) slope histogram of the main channel.
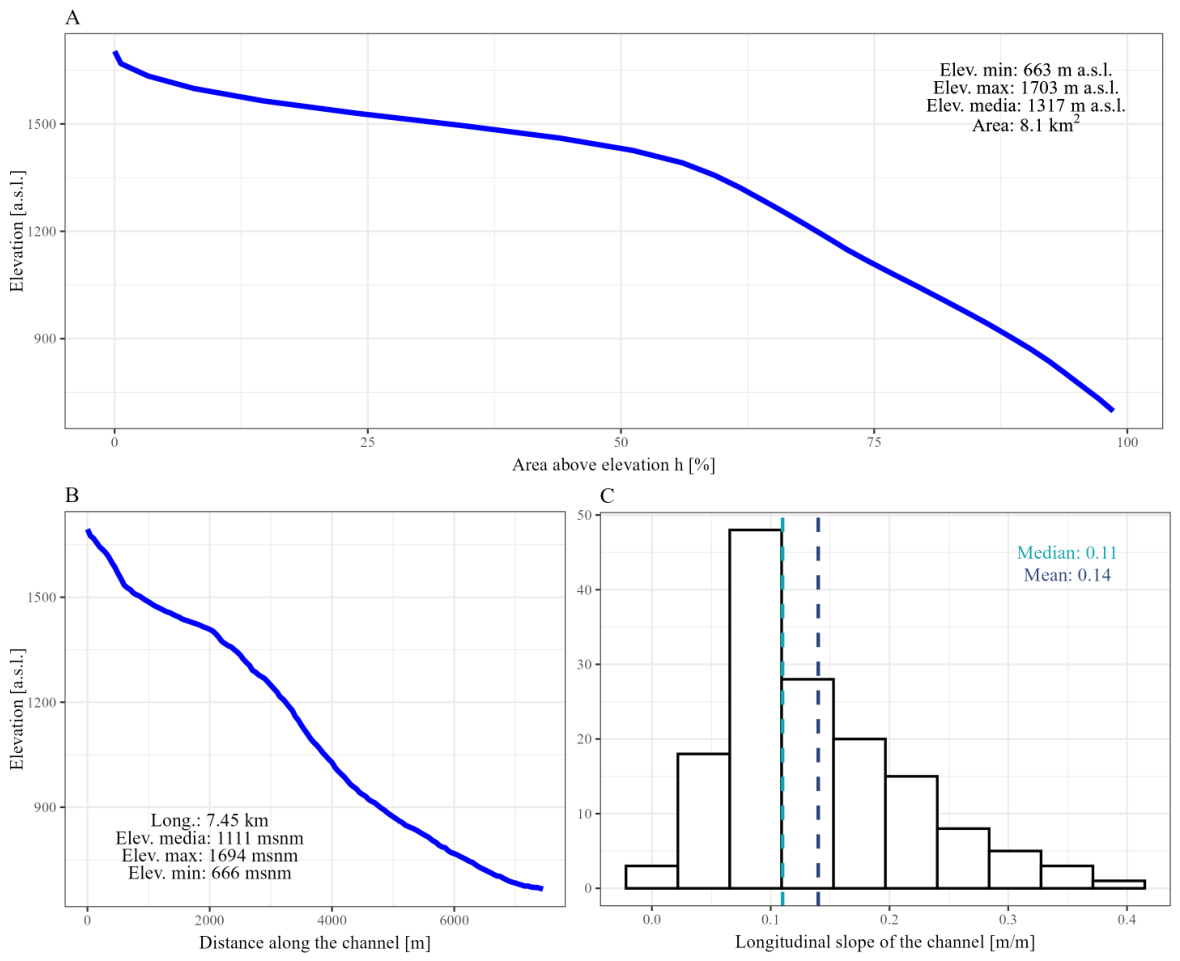
Figure 4.
Rainfall event of 14 March 2023 recorded at the Cusipata rain gauge.
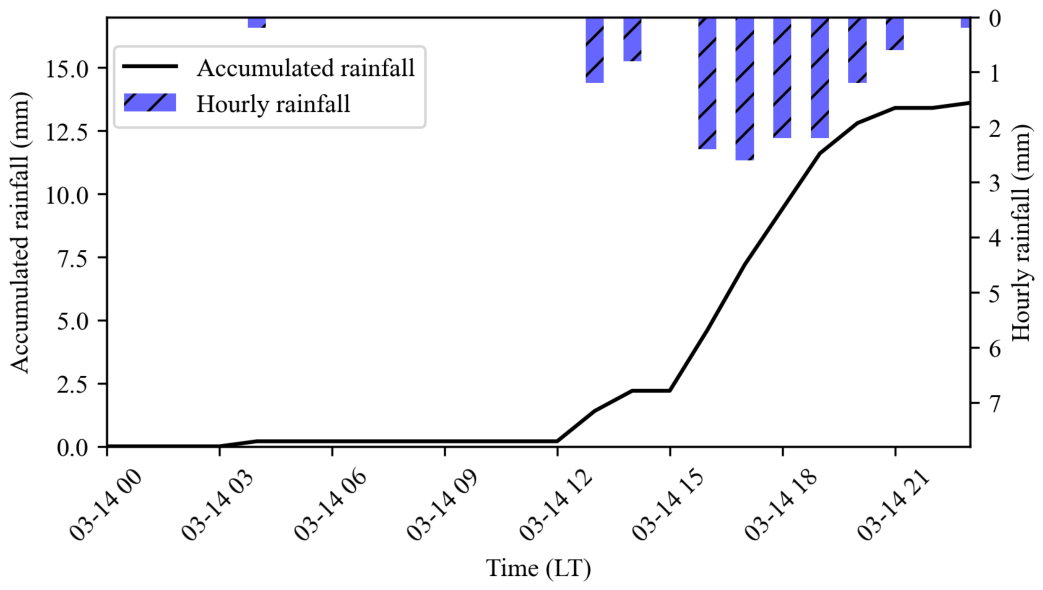
Figure 5.
TSS values during the optimisation process (left). Intensity–duration rainfall thresholds for Cusipata catchment (right).
Figure 5.
TSS values during the optimisation process (left). Intensity–duration rainfall thresholds for Cusipata catchment (right).
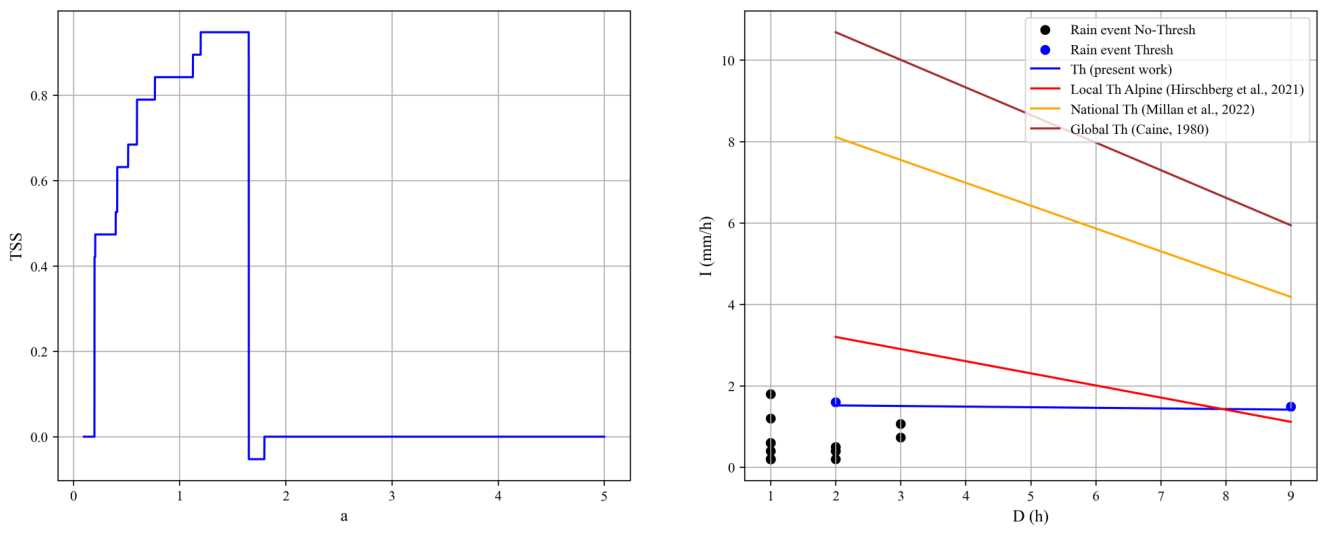
Figure 6.
Simulated liquid and mixed discharge hydrographs for the 14 March 2023 event during the Yaku event.
Figure 6.
Simulated liquid and mixed discharge hydrographs for the 14 March 2023 event during the Yaku event.
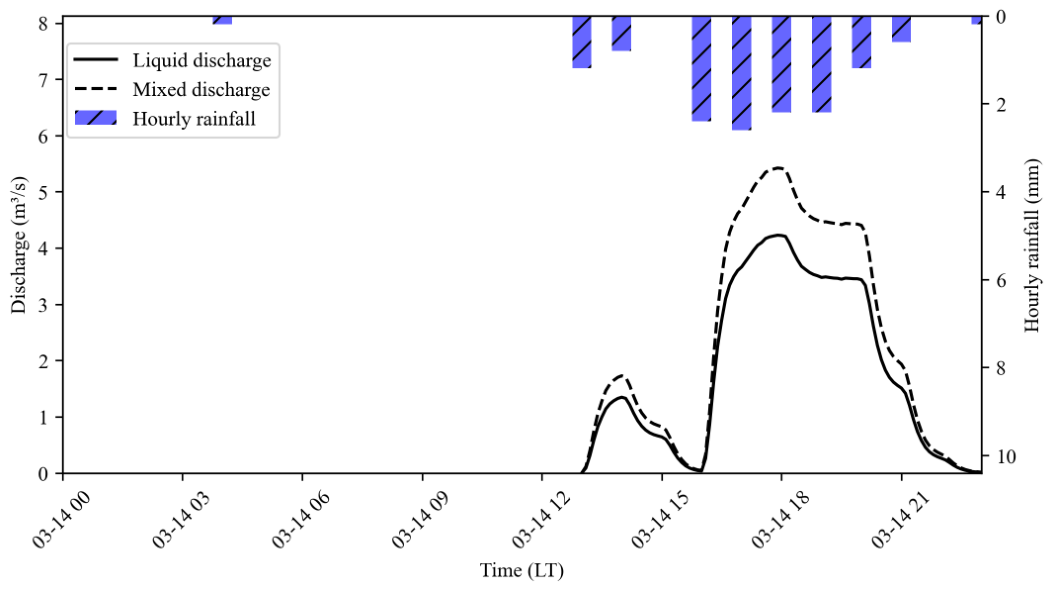
Figure 7.
Simulated deposition outputs (m) for selected RAMMS simulations (2, 3, 8, 9, and 12) under different parameter configurations for the first calibration stage. Numbered lines indicate control cross-sections (XS).
Figure 7.
Simulated deposition outputs (m) for selected RAMMS simulations (2, 3, 8, 9, and 12) under different parameter configurations for the first calibration stage. Numbered lines indicate control cross-sections (XS).
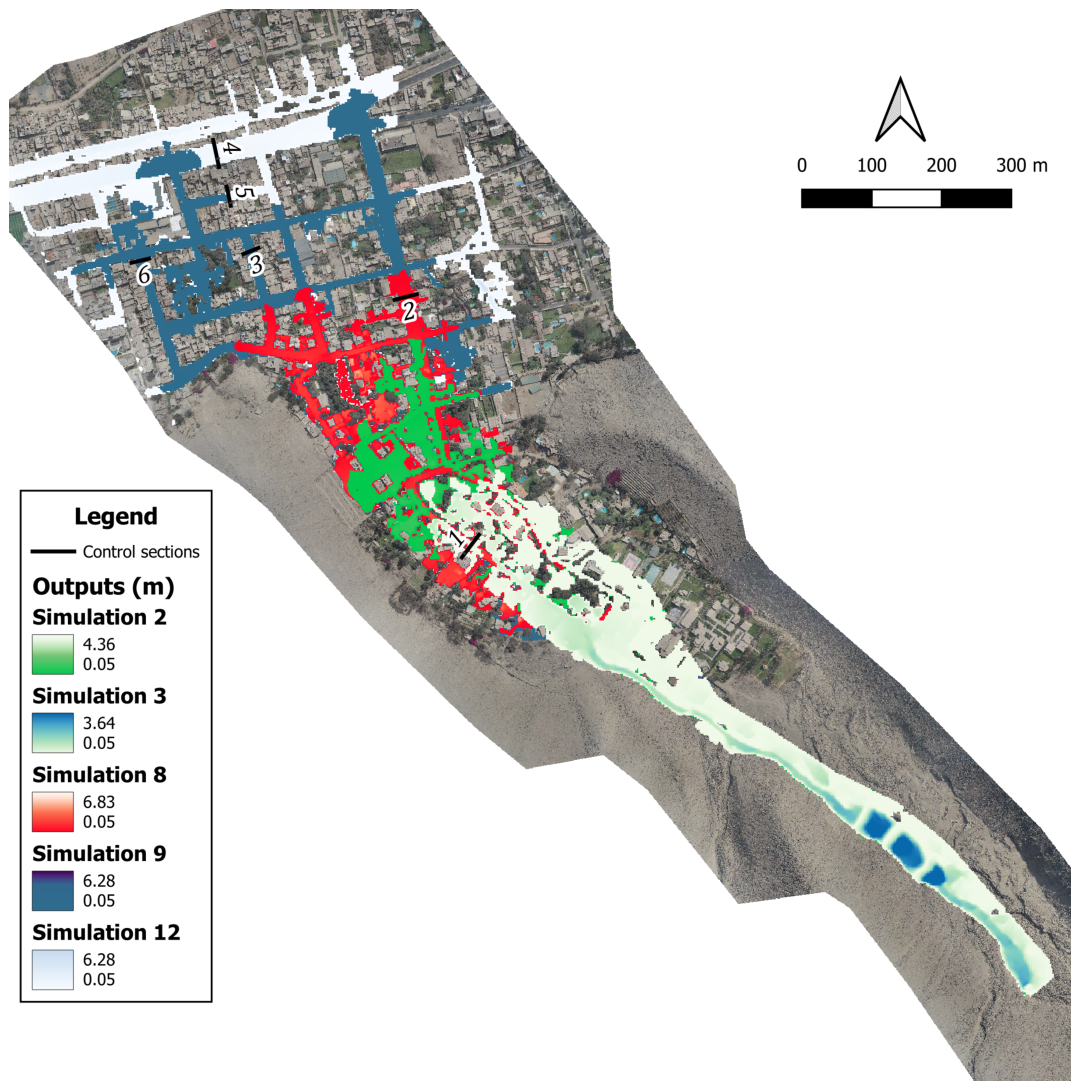
Figure 8.
Maximum simulated debris flow depth (m) at six cross-sections (XS) for selected RAMMS parameter configurations during the second calibration stage. Grey shading indicates field-estimated depth range.
Figure 8.
Maximum simulated debris flow depth (m) at six cross-sections (XS) for selected RAMMS parameter configurations during the second calibration stage. Grey shading indicates field-estimated depth range.
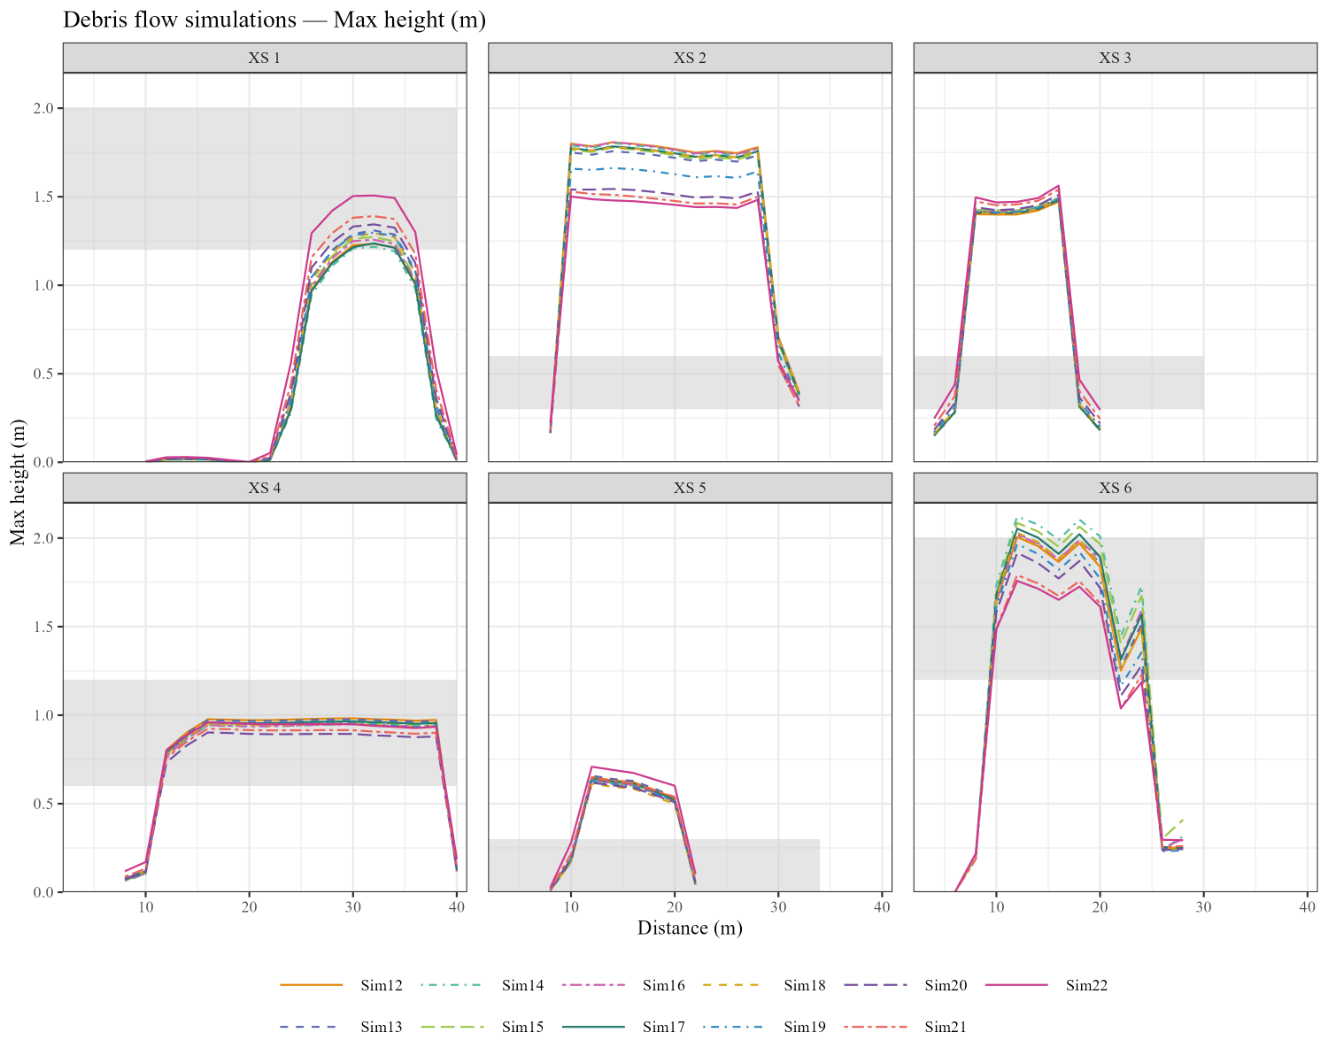
Figure 9.
Calibration heatmap for RAMMS debris flow simulations at six cross-sections (XS) during the second calibration stage. Cell values indicate the deviation of peak simulated depth from the observed midpoint (m). White cells fall within the field-observed depth range [, ]; shaded cells indicate overestimation beyond the observed bounds.
Figure 9.
Calibration heatmap for RAMMS debris flow simulations at six cross-sections (XS) during the second calibration stage. Cell values indicate the deviation of peak simulated depth from the observed midpoint (m). White cells fall within the field-observed depth range [, ]; shaded cells indicate overestimation beyond the observed bounds.
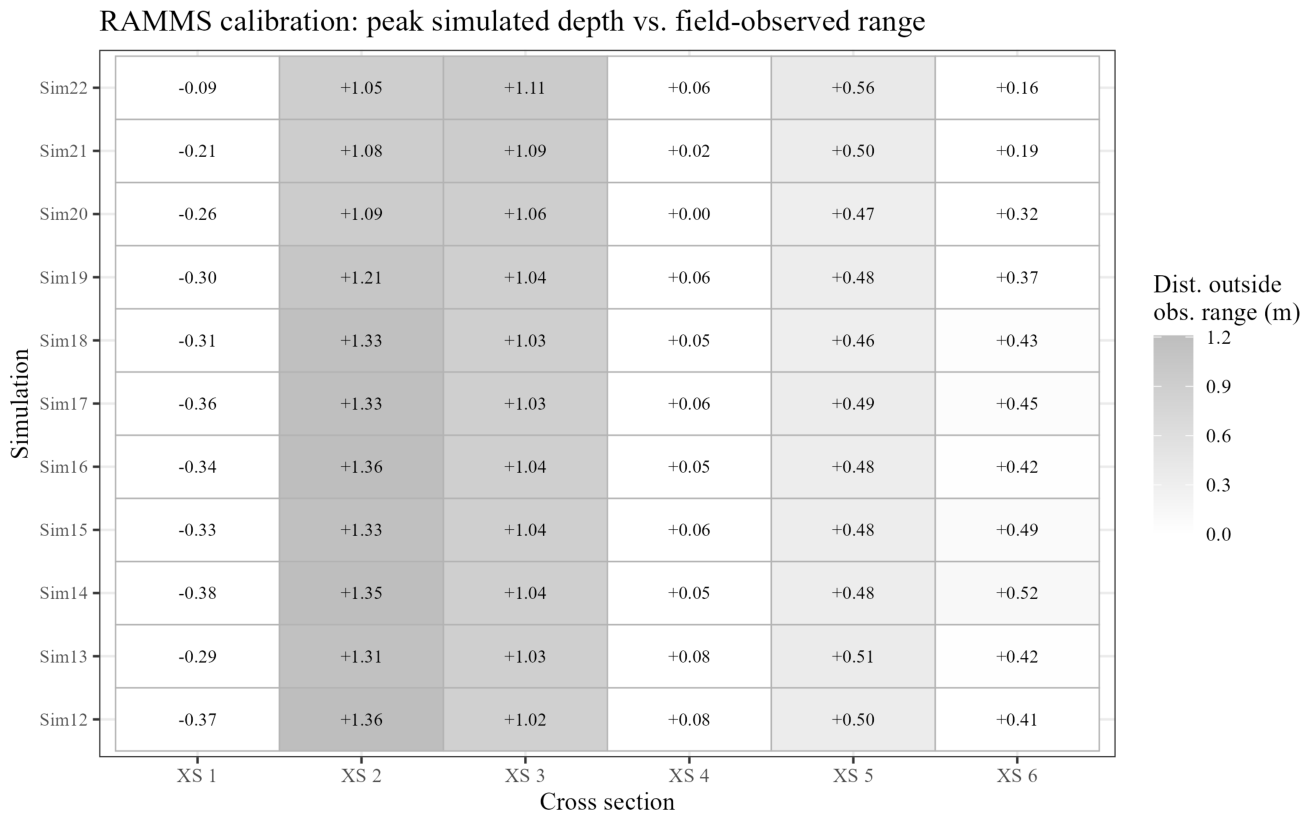
Figure 10.
(a) Maximum simulated debris flood flow depths for the Yaku event scenario and (b) the post-Yaku scenario.
Figure 10.
(a) Maximum simulated debris flood flow depths for the Yaku event scenario and (b) the post-Yaku scenario.
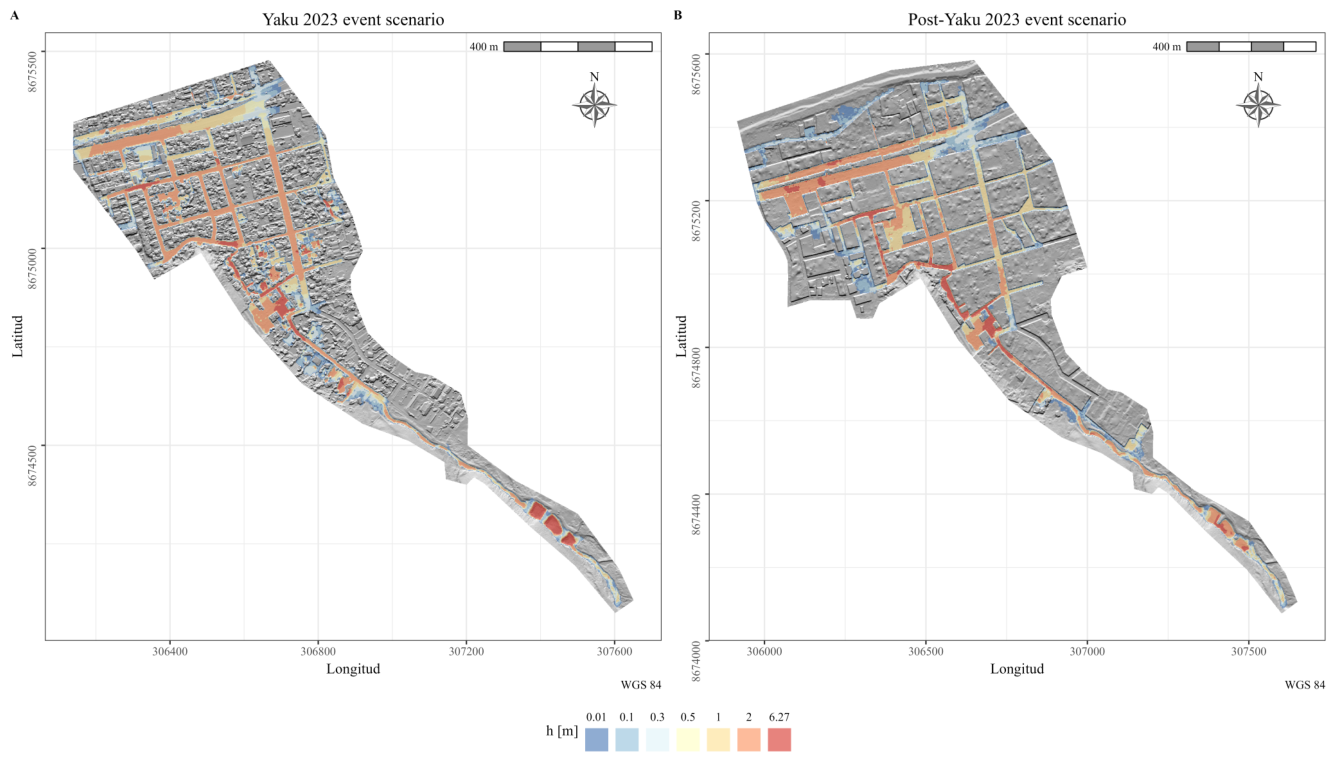
Figure 11.
(a) Estimated debris flood hazard for the Yaku event scenario and (b) the post-Yaku scenario (right).
Figure 11.
(a) Estimated debris flood hazard for the Yaku event scenario and (b) the post-Yaku scenario (right).
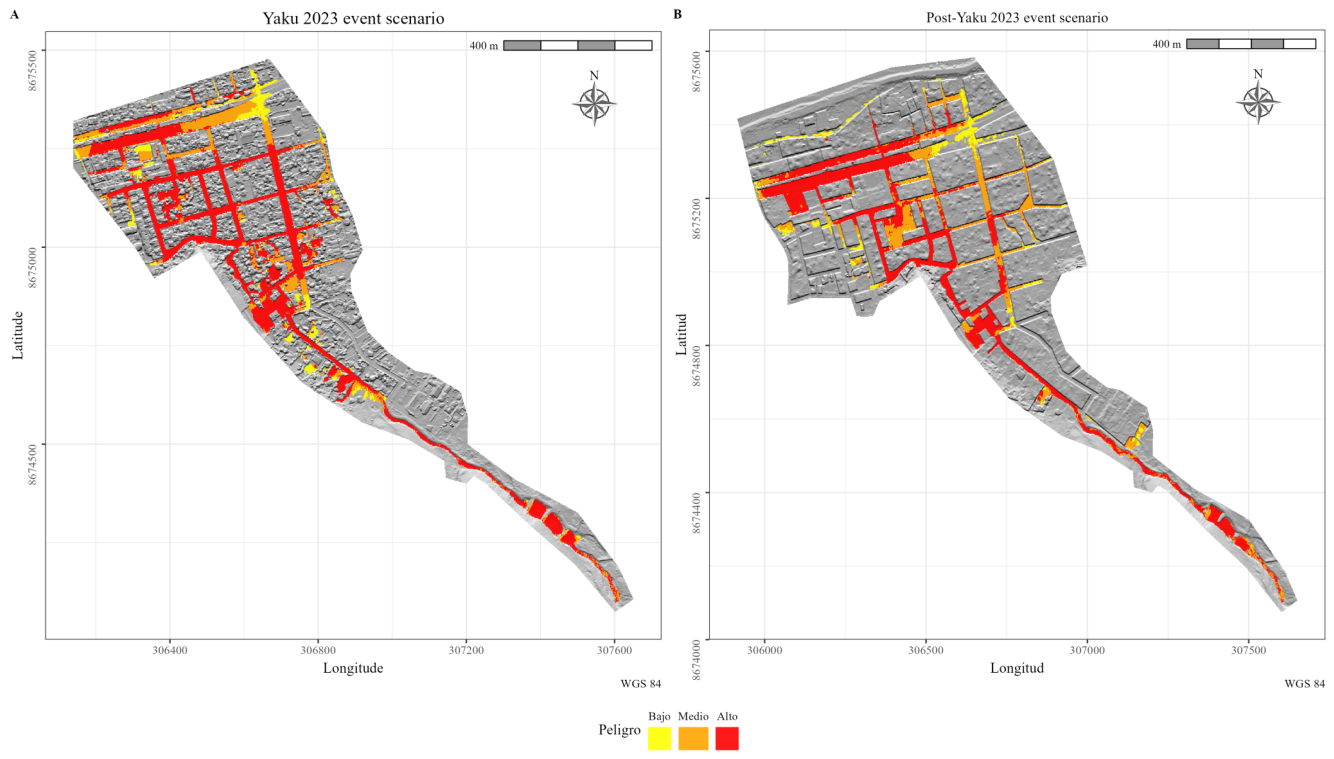
Figure 12.
Drone aerial photographs of debris flow deposits. Top: Castilla catchment. Bottom: San Francisco catchment.
Figure 12.
Drone aerial photographs of debris flow deposits. Top: Castilla catchment. Bottom: San Francisco catchment.
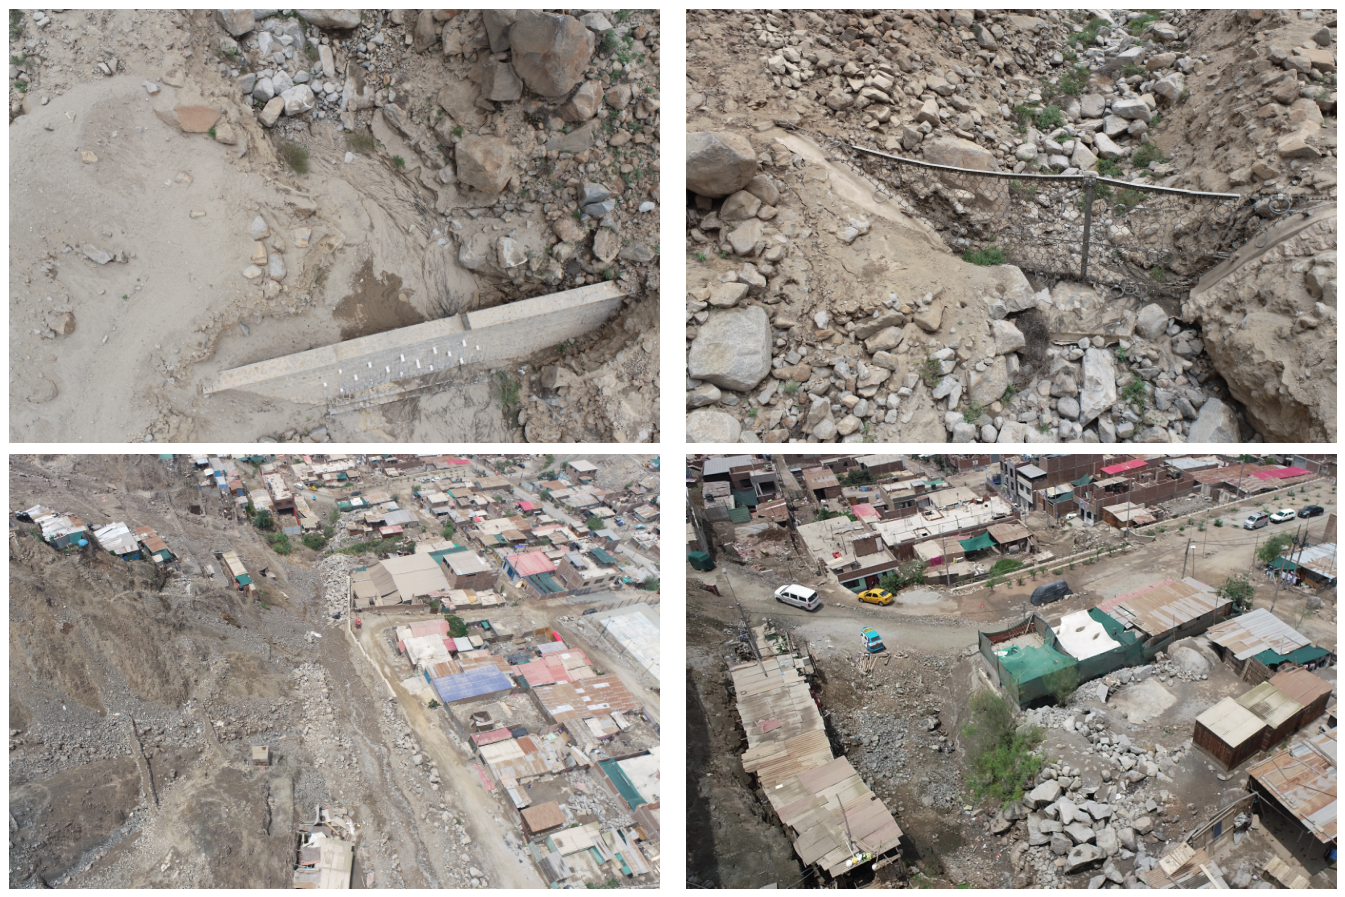

Table 1.
Rainfall events during the 2023 rainy season (January–March).
| Date | Total rainfall (mm) | Duration (hrs) |
|---|---|---|
| 19/02/2023 | 3.2 | 2 |
| 23/02/2023 | 1.0 | 1 |
| 10/03/2023 | 2.0 | 7 |
| 12/03/2023 | 3.2 | 5 |
| 13/03/2023 | 2.2 | 3 |
| 14/03/2023 | 13.4 | 9 |
Disclaimer/Publisher’s Note: The statements, opinions and data contained in all publications are solely those of the individual author(s) and contributor(s) and not of MDPI and/or the editor(s). MDPI and/or the editor(s) disclaim responsibility for any injury to people or property resulting from any ideas, methods, instructions or products referred to in the content. |
© 2026 by the authors. Licensee MDPI, Basel, Switzerland. This article is an open access article distributed under the terms and conditions of the Creative Commons Attribution (CC BY) license (http://creativecommons.org/licenses/by/4.0/).
Copyright: This open access article is published under a Creative Commons CC BY 4.0 license, which permit the free download, distribution, and reuse, provided that the author and preprint are cited in any reuse.


