

Submitted:
04 July 2026
Posted:
06 July 2026
You are already at the latest version
Abstract
(1) Background: Selenium (Se) and arsenic (As) influence oxidative stress pathways and may jointly affect cancer risk. We investigated whether Se and As status, individually and in combination, are associated with cancer incidence in women with familial breast cancer predisposition. (2) Methods: In this multicenter prospective study, 6134 BRCA1-negative women aged ≥40 years with hereditary breast cancer predisposition were recruited from 16 genetic clinics in Poland. Blood Se and As concentrations were measured repeatedly during follow-up (6–60 months). Primary analyses evaluated cancer risk across combined Se and As strata within a predefined optimal Se range (98–108 µg/L), including analyses stratified by CAT rs1001179 genotype. Exploratory analyses assessed a composite Risk Index (RI = Se + As × 50). Associations with incident cancer were examined using multivariable Cox regression models. (3) Results: Among 6134 participants, 4847 (79.0%) completed follow-up. The lowest cancer risk was observed in women with Se concentrations of 98–108 µg/L and As concentrations of 0.57–0.75 µg/L. Compared with women with As concentrations >1.07 µg/L, this subgroup showed a lower cancer hazard (HR 3.46; 95% CI 1.28–9.32). Associations were stronger when Se, As, and CAT genotype were analyzed jointly (HR 4.74; 95% CI 1.44–15.53). The RI was also associated with cancer risk (HR 4.51; 95% CI 1.72–11.83). (4) Conclusions: Cancer risk varied according to combined selenium and arsenic status. Stronger associations observed after CAT stratification support a potential role for oxidative stress–related gene–environment interactions in cancer susceptibility.
Keywords:
selenium
; arsenic
; breast cancer risk
; familial cancer
; trace elements
; risk index
; gene–environment interaction
; oxidative stress
1. Introduction
Familial breast cancers constitute ~30% of all consecutive breast cancers. Somewhere between 3% and 4% of all women match the pedigree and clinical criteria of a genetic predisposition to familial breast cancer with an increased risk of cancer up to 4 times that of the general population [1,2].
It is critical to identify factors that modify these risks. They can be genetic and / or environmental. The latter include dietary factors that encompass essential and toxic elements. Two such elements are selenium and arsenic, both of which may interact bio-logically and influence each other’s metabolism and systemic levels.
Oxidative stress is considered one of the key mechanisms involved in carcinogenesis and cancer progression. Both selenium and arsenic can influence cellular redox balance, although through different mechanisms. Selenium is an essential component of several antioxidant selenoproteins, including glutathione peroxidases and thioredoxin reductases, which protect cells against oxidative damage. In contrast, arsenic exposure has been associated with increased production of reactive oxygen species, oxidative DNA damage, chronic inflammation, and altered cellular signaling pathways. Consequently, the balance between selenium and arsenic status may be relevant for maintaining redox homeostasis and modifying cancer susceptibility.
Both elements (Se and As) have been associated with adverse health effects at sub-optimal concentrations, including potential associations with cancer risk and incidence.
It has been known for quite some time that increasing Se levels can be used to aid in the removal of As [3].
Given that both selenium and arsenic status have been associated with cancer risk and incidence in previous studies, it is important to investigate whether modulation of their blood levels is associated with changes in cancer risk in women with a family his-tory of breast cancer.
For the past 3 decades, we have investigated the potential role of selenium and arsenic in cancer-related outcomes among women at risk of familial breast cancer.
Selenium was the first trace element investigated in our studies. Meta-analyses, including our own findings, suggest a U-shaped relationship between selenium status and cancer risk, whereby both selenium deficiency and selenium excess are associated with an increased risk of malignancy.
According to this model, dietary supplementation of Se should confer benefit only if blood levels are too low, whereas persons with a high Se status should avoid Se supplements or a Se enriched diet [3,4,5].
There are several studies suggesting that Se toxicity depends on numerous factors including the form of Se (organic or inorganic), genetic differences in genes involved in the metabolism of Se and the presence of other toxic elements that influence the effects of Se [6,7].
Recently, we found that high blood Arsenic (As) levels are associated with a significantly increased risk of cancer in women [8,9].
Experimental studies indicate that selenium and arsenic may interact through several mechanisms, including the formation of biologically inactive complexes, modulation of antioxidant defense systems, regulation of inflammatory pathways, and effects on cellular redox signaling. These interactions appear to be dose-dependent and may vary according to genetic background and environmental context [3,10].
Given the importance of oxidative stress in carcinogenesis and the potential interplay between selenium, arsenic, and antioxidant defense pathways, we conducted a multicenter prospective study to evaluate whether combined selenium and arsenic status is associated with cancer incidence in women with familial breast cancer predisposition. We further explored whether these associations differed according to variation in the CAT gene, which encodes catalase, a key antioxidant enzyme involved in the detoxification of reactive oxygen species.
2. Materials and Methods
2.1. Study Population and Ethics
Invitation to participate in the study was sent by letter to 21,411 women from 16 cancer genetics outpatient clinics from 13 regions of Poland (Supplementary Table S1). Initially blood Se levels were studied from 9,716 women (Se deficient—3,937, Se excess—3,354, Se norm—2,425). All invited women were aged ≥ 40 years and had matching pedigree, clinical or molecular criteria of hereditary breast cancer (HBC). Exclusion criteria included confirmed BRCA1 pathogenic variants, lack of informed consent, or incomplete baseline data. In all participants at least three founder mutations (BRCA1 c.5266dupC, c.181T>G, c.4035delA)—the most common in Poland –were tested [11]. The large majority (~85%) of participants were initially unaffected. Of the remaining participants of the intervention group 14.5% and of the comparator group 12.6% had breast cancer (Table 1).
The flow of participants through the study, including eligibility assessment, selenium-based stratification, intervention allocation, and follow-up, is presented in Supplementary Figure S1.
The study was conducted in accordance with the Declaration of Helsinki and approved by the Ethics Committee of the Pomeranian Medical University in Szczecin (KB-0012/26/14; KB-0012/101/17). All participants provided written informed consent.
2.2. Study Design and Intervention
The study cohort included participants with baseline selenium deficiency (<98 µg/L) or excess (>108 µg/L). Women with selenium deficiency were randomly assigned to dietary modification (n = 887), placebo (n = 858), or selenium supplementation (n = 866). Women with selenium excess (n = 1551) received dietary modification advice.
Comparator cohorts consisted of eligible women who underwent screening and blood sampling but declined participation in the randomized intervention phase. These participants did not receive dietary or supplementation recommendations and were not randomized.
Randomization was performed centrally using computer-generated block randomization with variable block sizes. Participants, investigators, and study personnel were blinded to placebo and selenium supplementation allocation; only the Statistical Center had access to unblinded data. Compliance data are presented in Supplementary Table S2.
2.3. Follow-Up and Outcome Assessment
Blood measurements were performed at baseline, and at 6, 12, 18, 36, and 60 months. Telephone follow-up was conducted every 6 months. Participants received their Se results 2–4 weeks after visits.
Due to the observation of an association between high (>0.6 µg/l) blood arsenic levels and cancer risk (8), the study was extended in March 2019 by introducing dietary guidance aimed at reducing arsenic exposure.
Information on incident cancer diagnoses was obtained from participants’ medical records.
2.4. Laboratory and Genetic Analyses
Detailed ICP-MS methodology is provided in the Supplementary Methods.
To identify genes potentially interacting with selenium (Se) and arsenic (As), we performed a PubMed-based literature review. Using these criteria, 246 selenium-related genes and 388 arsenic-related genes were identified. In the second stage, variants within selected genes were identified using the Polinome Database (300 cancer-unaffected adult Poles from families without cancer, analyzed by whole-exome sequencing). Only variants with genotype frequencies between 35% and 65% were considered to ensure adequate statistical power for subgroup analyses. After the second-stage screening, 7 genes fulfilled the predefined selection criteria: CASP9 rs2234723; CAT rs1001179; CHFR rs2306541; GPX1 rs1050450; TET1 rs12773594; EPHX1 rs1051740; and TET1 rs3998860. From this group, CAT rs1001179 and CASP9 rs2234723 were selected for further analysis based on results from a nested case-control analysis (329 cases and controls, 1:2 matching) conducted within an independent prospective cohort of 2,927 women from families with hereditary breast cancer registered at the Hereditary Cancer Center in Szczecin.
Detailed genotyping methods are provided in the Supplementary Methods.
2.5. Exposure Variables
The following blood parameters were evaluated: (a) selenium concentration (Se), (b) arsenic concentration (As), (c) the Se/As ratio, reflecting potential antagonistic interactions between selenium and arsenic, and (d) a composite risk index (RI), calculated as Se concentration + (As concentration × 50), intended to explore potential synergistic effects between the two elements.
Exploratory analyses suggested that combined selenium and arsenic status may be associated with cancer risk. Therefore, a composite risk index (RI) was constructed to evaluate their potential joint effects.
This observation led to the exploratory construction of a combined risk index (RI) intended to evaluate potential joint effects of Se and As by formula: Se concentration (µg/l) + As concentration (µg/l) multiplied by coefficient. We tested different weighting coefficients for As (25, 50, 100, 200). The strongest statistical association between RI value and cancer risk was observed for a coefficient of 50; therefore, this value was used in subsequent exploratory analyses.
2.6. Statistical Analysis
To estimate hazard ratios (HRs) for cancer risk, Cox proportional hazards regression models (univariable and multivariable) were used. Proportional hazards assumptions were assessed using Schoenfeld residuals. The predefined arsenic threshold of 0.6 µg/L was based on our previous studies and pilot observations. Following completion of follow-up, the final arsenic exposure categories were defined using quartile cut-off values derived from the distribution of participants’ mean blood arsenic concentrations among women who remained free of cancer during follow-up. Once established, these cut-off values were applied consistently across all subsequent analyses. The predefined optimal selenium concentration range (98–108 µg/L) remained unchanged throughout the study.
Primary analyses were pre-specified before study initiation and included evaluation of cancer risk across combined selenium and arsenic strata within a predefined optimal selenium range (98–108 µg/L). Exploratory analyses included the construction and evaluation of a composite risk index (RI) integrating selenium and arsenic concentrations.
Analyses were performed in the following predefined populations:
1) Randomized intervention cohort (primary analysis)
• participants randomized to dietary modification, placebo, or selenium supplementation within the selenium deficiency stratum
• participants receiving dietary modification within the selenium excess stratum
2) Subgroup with optimized selenium status (primary analysis)
• participants achieving blood selenium levels of 98–108 µg/l during follow-up
3) Non-randomized external comparator cohort (secondary exploratory analysis)
• individuals who met eligibility criteria, underwent baseline screening, but declined participation in the randomized intervention phase
• these participants were not randomized and received no dietary or supplementation intervention during follow-up
Analyses involving intervention-related comparisons were restricted to the randomized cohort.
Multivariable models were adjusted for age, smoking status, oophorectomy, hormone replacement therapy, oral contraceptive use, and baseline cancer status.
Additional models were fitted including selenium and arsenic levels as continuous variables and as categorical variables.
To account for multiple testing across the main analyses presented in Table 2, Table 3, Table 4 and Table 5, adjustment for multiple comparisons was performed using the Bonferroni correction. These analyses included both primary analyses and selected exploratory components. All reported associations in these tables remained statistically significant after Bonferroni adjustment.
Additional analyses were performed according to predefined genetic subgroups: CAT rs1001179 (CC vs non-CC). These genetic subgroup analyses were pre-specified analyses.
Missing data were handled using complete-case analysis. Sensitivity analyses were performed to assess the robustness of findings (where applicable).
All analyses were performed using standard statistical software. A two-sided p-value <0.05 was considered statistically significant.
3. Results
3.1. Study Population
Out of 6134 recruited participants, 4847 completed follow-up (79.0%). Baseline characteristics of the study population are presented in Table 1.
3.2. Combined Selenium and Arsenic Status and Cancer Risk
In pre-specified primary analyses within the entire intervention cohort, differences in cancer risk were observed across the combined selenium and arsenic strata (Table 2). Among the analyzed strata, the lowest observed cancer risk was identified in participants with selenium concentrations of 98–108 µg/L and arsenic concentrations of 0.57–0.75 µg/L. In contrast, participants with a reference arsenic concentration >1.07 µg/L had a higher hazard ratio of cancer (HR 3.46; p=0.015; 95% CI 1.26–9.15). No significant differences were observed between the dietary intervention, selenium supplementation, and placebo subgroups (Table 6A).
3.3. Selenium, Arsenic and CAT Genotype
Pre-specified genotype-stratified analyses were performed for CAT rs1001179 and CASP9 rs2234723, the two variants selected a priori based on independent nested case-control analyses described in the Methods section. Among these two pre-specified variants, only CAT rs1001179 was associated with cancer risk, whereas no significant association was observed for CASP9. Differences in cancer risk across arsenic strata were subsequently evaluated according to CAT rs1001179 genotype, given the role of catalase in antioxidant defense and oxidative stress regulation (Table 3, Figure 1 and Figure 2). When selenium concentrations, arsenic concentrations, and CAT genotype were analyzed jointly, a significant association with cancer risk was observed (HR 4.74; 95% CI 1.44–15.53; p = 0.01).
3.4. Exploratory Analysis of the Risk Index
In exploratory analyses, differences in cancer risk were observed across quartiles of the risk index (RI), a composite measure integrating selenium and arsenic concentrations. Participants in the highest RI category (>166.54) had a higher hazard of cancer compared with the reference category (127.58–143.57) (HR 4.51; p=0.0012; 95% CI 1.72–11.83) (Table 4).
3.5. Risk Index and CAT Genotype
In analyses incorporating both the RI and CAT genotype, the magnitude of association increased. The strongest association was observed in combined subgroups defined by selenium concentrations of 98–108 µg/L, CAT genotype, and RI ranges (HR 8.49; p=0.003; 95% CI 2.03–35.49) (Table 5, Figure 3 and Figure 4).
3.6. Comparisons between Intervention and Comparator Cohorts
No statistically significant differences in cancer risk were observed between the randomized intervention subgroups, including dietary modification, selenium supplementation, placebo, and the selenium excess dietary intervention subgroup (Table 6A). These findings suggest that assignment to a specific intervention arm was not independently associated with cancer risk during follow-up.
Similarly, no statistically significant differences were observed between the entire intervention cohort and the comparator cohort (Table 6B). Similar results were obtained when the subgroup of the intervention cohort with selenium concentrations of 98–108 µg/L and arsenic concentrations <0.6 µg/L was compared with the comparator cohort (Table 6C).
Statistically significant associations were observed when predefined low-risk subgroups from the intervention cohort were compared with the entire comparator cohort. When selenium and arsenic concentrations together with CAT genotype were analyzed jointly, the hazard ratio was 5.52 (95% CI 1.52–20.11; p=0.009) (Table 6D). When the combined subgroup defined by selenium concentrations of 98–108 µg/L, CAT genotype, and RI ranges was compared with the comparator cohort, the hazard ratio was 10.03 (95% CI 2.08–48.17; p=0.004) (Table 6E). A greater incidence of breast cancer was observed in comparator group compared to the intervention group (Table S3, 56.7% vs 39.6%).
4. Discussion
In this multicenter study of women with familial breast cancer predisposition, we observed that cancer risk varied across combined selenium (Se) and arsenic (As) exposure profiles. The lowest observed cancer risk was associated with intermediate arsenic concentrations (0.57–0.75 µg/L) in combination with selenium concentrations of 98–108 µg/L, whereas higher arsenic concentrations (>1.07 µg/L) were associated with increased cancer risk. These findings suggest that the relationship between selenium, arsenic, and cancer risk may be non-linear and influenced by interactions between these elements rather than by their individual effects alone.
One potential biological explanation for these observations involves oxidative stress. Selenium plays a central role in antioxidant defense through its incorporation into selenoproteins, including glutathione peroxidases and thioredoxin reductases, which protect cells against oxidative damage. In contrast, arsenic exposure has been associated with increased generation of reactive oxygen species (ROS), oxidative DNA damage, mitochondrial dysfunction, and chronic inflammation. Consequently, the balance between selenium and arsenic status may influence redox homeostasis and thereby affect cancer susceptibility.
The finding that the lowest cancer risk was not associated with the lowest arsenic concentrations may indicate that the biological effects of arsenic are context-dependent and influenced by selenium status. Previous experimental studies have demonstrated that selenium may reduce arsenic toxicity through the formation of biologically inactive complexes as well as through modulation of oxidative stress and inflammatory pathways. Our results are consistent with the hypothesis that optimal selenium status may partially counteract adverse biological effects associated with arsenic exposure.
To better capture the joint and potentially non-linear relationship between selenium and arsenic, we constructed a composite risk index (RI). Although exploratory in nature, the RI showed stronger associations with cancer risk than analyses based on either element alone. This observation supports the possibility that selenium and arsenic act through interconnected biological pathways and that combined exposure metrics may better reflect the underlying redox environment than isolated measurements.
An important finding of the present study was the stronger association observed in the pre-specified analyses stratified according to CAT rs1001179 genotype. Catalase is a key antioxidant enzyme responsible for the detoxification of hydrogen peroxide and the maintenance of cellular redox balance. Genetic variation within CAT may influence the efficiency of antioxidant defense mechanisms and susceptibility to oxidative damage. The stronger associations observed in genotype-stratified analyses are therefore biologically plausible and support a potential role for oxidative stress–related gene–environment interactions in cancer susceptibility.
Previous studies have predominantly emphasized antagonistic interactions between selenium and arsenic. However, experimental evidence suggests that these interactions are highly dependent on dose, chemical form, exposure duration, and host-related factors. Selenium and arsenic may influence multiple components of the cellular antioxidant defense network, including ROS generation, inflammatory signaling, DNA damage responses, and redox-sensitive pathways. The non-linear associations observed in our study are consistent with the possibility that these mechanisms operate simultaneously and may vary across different exposure ranges.
The observed associations should also be interpreted in the context of overall dietary patterns. Arsenic concentrations in blood may partly reflect consumption of specific foods, particularly seafood and related products. Therefore, residual confounding related to diet cannot be excluded, and blood arsenic concentrations should not necessarily be interpreted as a direct causal factor. Instead, they may represent a broader marker of environmental and nutritional exposure influencing oxidative stress pathways.
This study has several limitations. First, the number of cancer events was relatively limited, particularly in stratified analyses, resulting in wide confidence intervals. Second, several analyses were based on subgroup comparisons and therefore require cautious interpretation. Third, the RI was developed using observed associations within the study population and requires external validation. Similarly, the final arsenic exposure categories were derived from the distribution of longitudinal arsenic measurements in participants who remained cancer-free and therefore require confirmation in independent cohorts. Finally, residual confounding related to dietary and environmental factors cannot be excluded, and the use of a non-randomized comparator cohort may introduce selection bias.
Despite these limitations, the study has important strengths, including its large multicenter design, repeated measurements of selenium and arsenic concentrations, long-term follow-up, and integration of environmental and genetic factors. These features enabled a detailed evaluation of potential interactions between trace-element status, oxidative stress–related pathways, and cancer susceptibility.
Overall, the present findings support the hypothesis that interactions between selenium status, arsenic exposure, and antioxidant defense mechanisms may contribute to cancer risk variation in women with familial breast cancer predisposition. Further studies are needed to validate these findings and to clarify the biological mechanisms linking trace-element status, oxidative stress, and cancer development.
5. Conclusions
In this study, cancer risk varied across combined selenium and arsenic exposure profiles within a predefined optimal selenium range. The lowest observed risk was associated with intermediate rather than the lowest arsenic concentrations, suggesting a non-linear relationship between these trace elements.
Pre-specified genotype-stratified analyses indicated that the association between selenium, arsenic, and cancer risk may be modified by catalase (CAT rs1001179), supporting a potential role of oxidative stress–related gene–environment interactions in cancer susceptibility.
Together, these findings suggest that interactions between selenium status, arsenic exposure, and antioxidant defense pathways may contribute to cancer risk variation in women with familial breast cancer predisposition. Further studies are required to confirm these observations and to clarify the underlying biological mechanisms.
6. Patents
Patent applications no: P. 443075/PL; P.445013; P.451259; P.451715; P.451716; P. 451717; P. 453171.
Supplementary Materials
The following supporting information can be downloaded at the website of this paper posted on Preprints.org, Supplementary Methods: S1. ICP-MS Measurements; S2. Genotype Assessment; Figure S1: Flow chart of participant recruitment, selenium-based eligibility assessment, enrollment, intervention allocation, comparator cohort selection, and follow-up; Table S1: Distribution of BRCA1-negative participants by study center; Table S2: Compliance in intervention groups among BRCA1-negative participants; Table S3. Distribution of incident cancer sites in the intervention and comparator cohorts.
Author Contributions
Conceptualization, J.L., M.R., A.K. and R.S.; methodology, J.L., W.M., R.D., E.S., K.L. and M.C.; software, K.L., P.B., M.B. and A.K.; validation, J.L., and W.D.; formal analysis, J.L., K.L. and M.L.; investigation, J.L., W.M., A.M., K.L., A.J., M.L., R.D., K.B., A.S., M.C. and M.G.; resources, T.H., J.G., C.C., T.D., P.P., M.J., K.K., T.K., D.G., R.P., J.T-S., M.S., R.S., E.K-K., A.P., A.J., R.W., S.G., M.S., B.K.-K. and K.D.; data curation, J.L.; writing—original draft preparation, J.L., R.S. and M.K.; writing—review and editing, J.L. and R.S.; visualization, J.L., K.L., C.R. and R.S.; supervision, J.L.; project administration, E.P. and K.E.; funding acquisition, J.L. All authors have read and agreed to the published version of the manuscript.
Funding
This research was funded by the National Centre for Research and Development, grant number INNOMED/1/16/NCBR/2014.
Institutional Review Board Statement
The study was conducted in accordance with the Declaration of Helsinki, and approved by the Institutional Ethics Committee of Pomeranian Medical University in Szczecin (protocol code KB-0012/26/14; date of approval 17-03-2014).
Informed Consent Statement
Informed consent was obtained from all subjects involved in the study.
Data Availability Statement
Data described in the manuscript are available from the corresponding author upon reasonable request, subject to approval by the study investigators and applicable ethical and data protection regulations.
Acknowledgments
We are grateful to all study subjects for their participation in this study. For excellent technical and administrative support to this study we thank: E. Putresza, K. Ertmańska, R. Gibaszek, E. Hawryszuk, A. Tomczak, D. Czajka, H. Płochocka, B. Szeszko, K. Bartniak, L. Olkowska, M. Zdziebło M, L. Jabłońska, S. Cieślak, A. Kazienko, E. Dolatowska, W. Krauze, A. Wojciechowska, E. Tubielewicz, D. Trzaszczka, K. Woronko, L. Frąckowiak, M. Wysokińska.
Conflicts of Interest
J.L., W.M., T.H., J.G., C.C., M.B., A.J., R.D., M.K., and A.K. are employees or collaborators of Read-Gene SA, a company that offers DNA and element testing. J.L., A.M., W.M. T.H., J.G., K.L., P.B., C.C., M.B., T.D., A.J., R.D., M.K., P.P., A.K., D.G., R.P., E.K-K., M.S., R.S. are the inventors of patent applications no: related to selenium and/or arsenic-based cancer prevention strategies. The remaining authors declare no competing interests.
Abbreviations
The following abbreviations are used in this manuscript:
| As | arsenic |
| CI | confidence interval |
| HR | hazard ratio |
| RI | risk index |
| Se | selenium |
References
- Liu, J.Z.; Chen, C.Y.; Tsai, E.A.; et al. The burden of rare protein-truncating genetic variants on human lifespan. Nat. Aging 2022, 2(4), 289–294. [Google Scholar] [CrossRef] [PubMed]
- Kharazmi, E.; Försti, A.; Sundquist, K.; Hemminki, K. Survival in familial and non-familial breast cancer by age and stage at diagnosis. Eur. J. Cancer 2016, 52, 10–18. [Google Scholar] [CrossRef] [PubMed]
- Zwolak, I. Disentangling the role of selenium in antagonizing the toxicity of arsenic and cadmium. Arch. Toxicol. 2025, 99(2), 513–540. [Google Scholar] [CrossRef] [PubMed]
- Rayman, M.P. Selenium and human health. Lancet 2012, 379(9822), 1256–1268. [Google Scholar] [CrossRef] [PubMed]
- Narod, S.A.; Huzarski, T.; Jakubowska, A.; et al. Serum selenium level and cancer risk: a nested case-control study. Hered. Cancer Clin. Pract. 2019, 17, 33. [Google Scholar] [CrossRef] [PubMed]
- Lemire, M.; Philibert, A.; Fillion, M.; et al. No evidence of selenosis from a selenium-rich diet in the Brazilian Amazon. Env. Int. 2012, 40, 128–136. [Google Scholar] [CrossRef] [PubMed]
- Donadio, J.L.S.; Rogero, M.M.; Guerra-Shinohara, E.M.; et al. Genetic variants in selenoprotein genes modulate biomarkers of selenium status in response to Brazil nut supplementation (the SU.BRA.NUT study). Clin. Nutr. 2019, 38(2), 539–548. [Google Scholar] [CrossRef] [PubMed]
- Marciniak, W.; Derkacz, R.; Muszyńska, M.; et al. Blood arsenic levels and the risk of familial breast cancer in Poland. Int. J. Cancer 2020, 146(10), 2721–2727. [Google Scholar] [CrossRef] [PubMed]
- Marciniak, W.; Matoušek, T.; Domchek, S.; et al. Blood arsenic levels as a marker of breast cancer risk among BRCA1 carriers. Cancers 2021, 13(13), 3345. [Google Scholar] [CrossRef] [PubMed]
- Styblo, M.; Thomas, D.J. Selenium modifies the metabolism and toxicity of arsenic in primary rat hepatocytes. Toxicol. Appl. Pharmacol. 2001, 172(1), 52–61. [Google Scholar] [CrossRef] [PubMed]
- Górski, B.; Jakubowska, A.; Huzarski, T.; et al. A high proportion of founder BRCA1 mutations in Polish breast cancer families. Int. J. Cancer 2004, 110(5), 683–686. [Google Scholar] [CrossRef] [PubMed]
- Kaur, G.; Javed, W.; Ponomarenko, O.; et al. Human red blood cell uptake and sequestration of arsenite and selenite: Evidence of seleno-bis(S-glutathionyl) arsinium ion formation in human cells. Biochem Pharmacol. 2020, 180, 114141. [Google Scholar] [CrossRef] [PubMed]
- EFSA Panel on Contaminants in the Food Chain. Update of the risk assessment of inorganic arsenic in food. EFSA J. 2024, 22(1), e8488. [Google Scholar] [CrossRef] [PubMed]
- International Agency for Research on Cancer (IARC). Arsenic, metals, fibres, and dusts: a review of human carcinogens. In IARC Monographs on the Evaluation of Carcinogenic Risks to Humans; IARC: Lyon, 2012; Volume 100C. [Google Scholar]
- Sergeeva, E.Y.; Dunaevskaya, S.S.; Deulina, V.V.; Fefelova, Y.A. Catalases: oxidative stress, inflammation and carcinogenesis. Sib. Med. Rev. 2024, 18–22. [Google Scholar] [CrossRef]
Figure 1.
Association between arsenic concentration and cancer risk according to CAT genotype in women with selenium levels 98–108 µg/L. Blue line indicates participants classified as the low-risk group; red line indicates all remaining participants. P value calculated using the log-rank test. Analysis was restricted to BRCA1-negative women from the intervention cohort, with selenium concentrations of 98–108 µg/L.
Figure 1.
Association between arsenic concentration and cancer risk according to CAT genotype in women with selenium levels 98–108 µg/L. Blue line indicates participants classified as the low-risk group; red line indicates all remaining participants. P value calculated using the log-rank test. Analysis was restricted to BRCA1-negative women from the intervention cohort, with selenium concentrations of 98–108 µg/L.
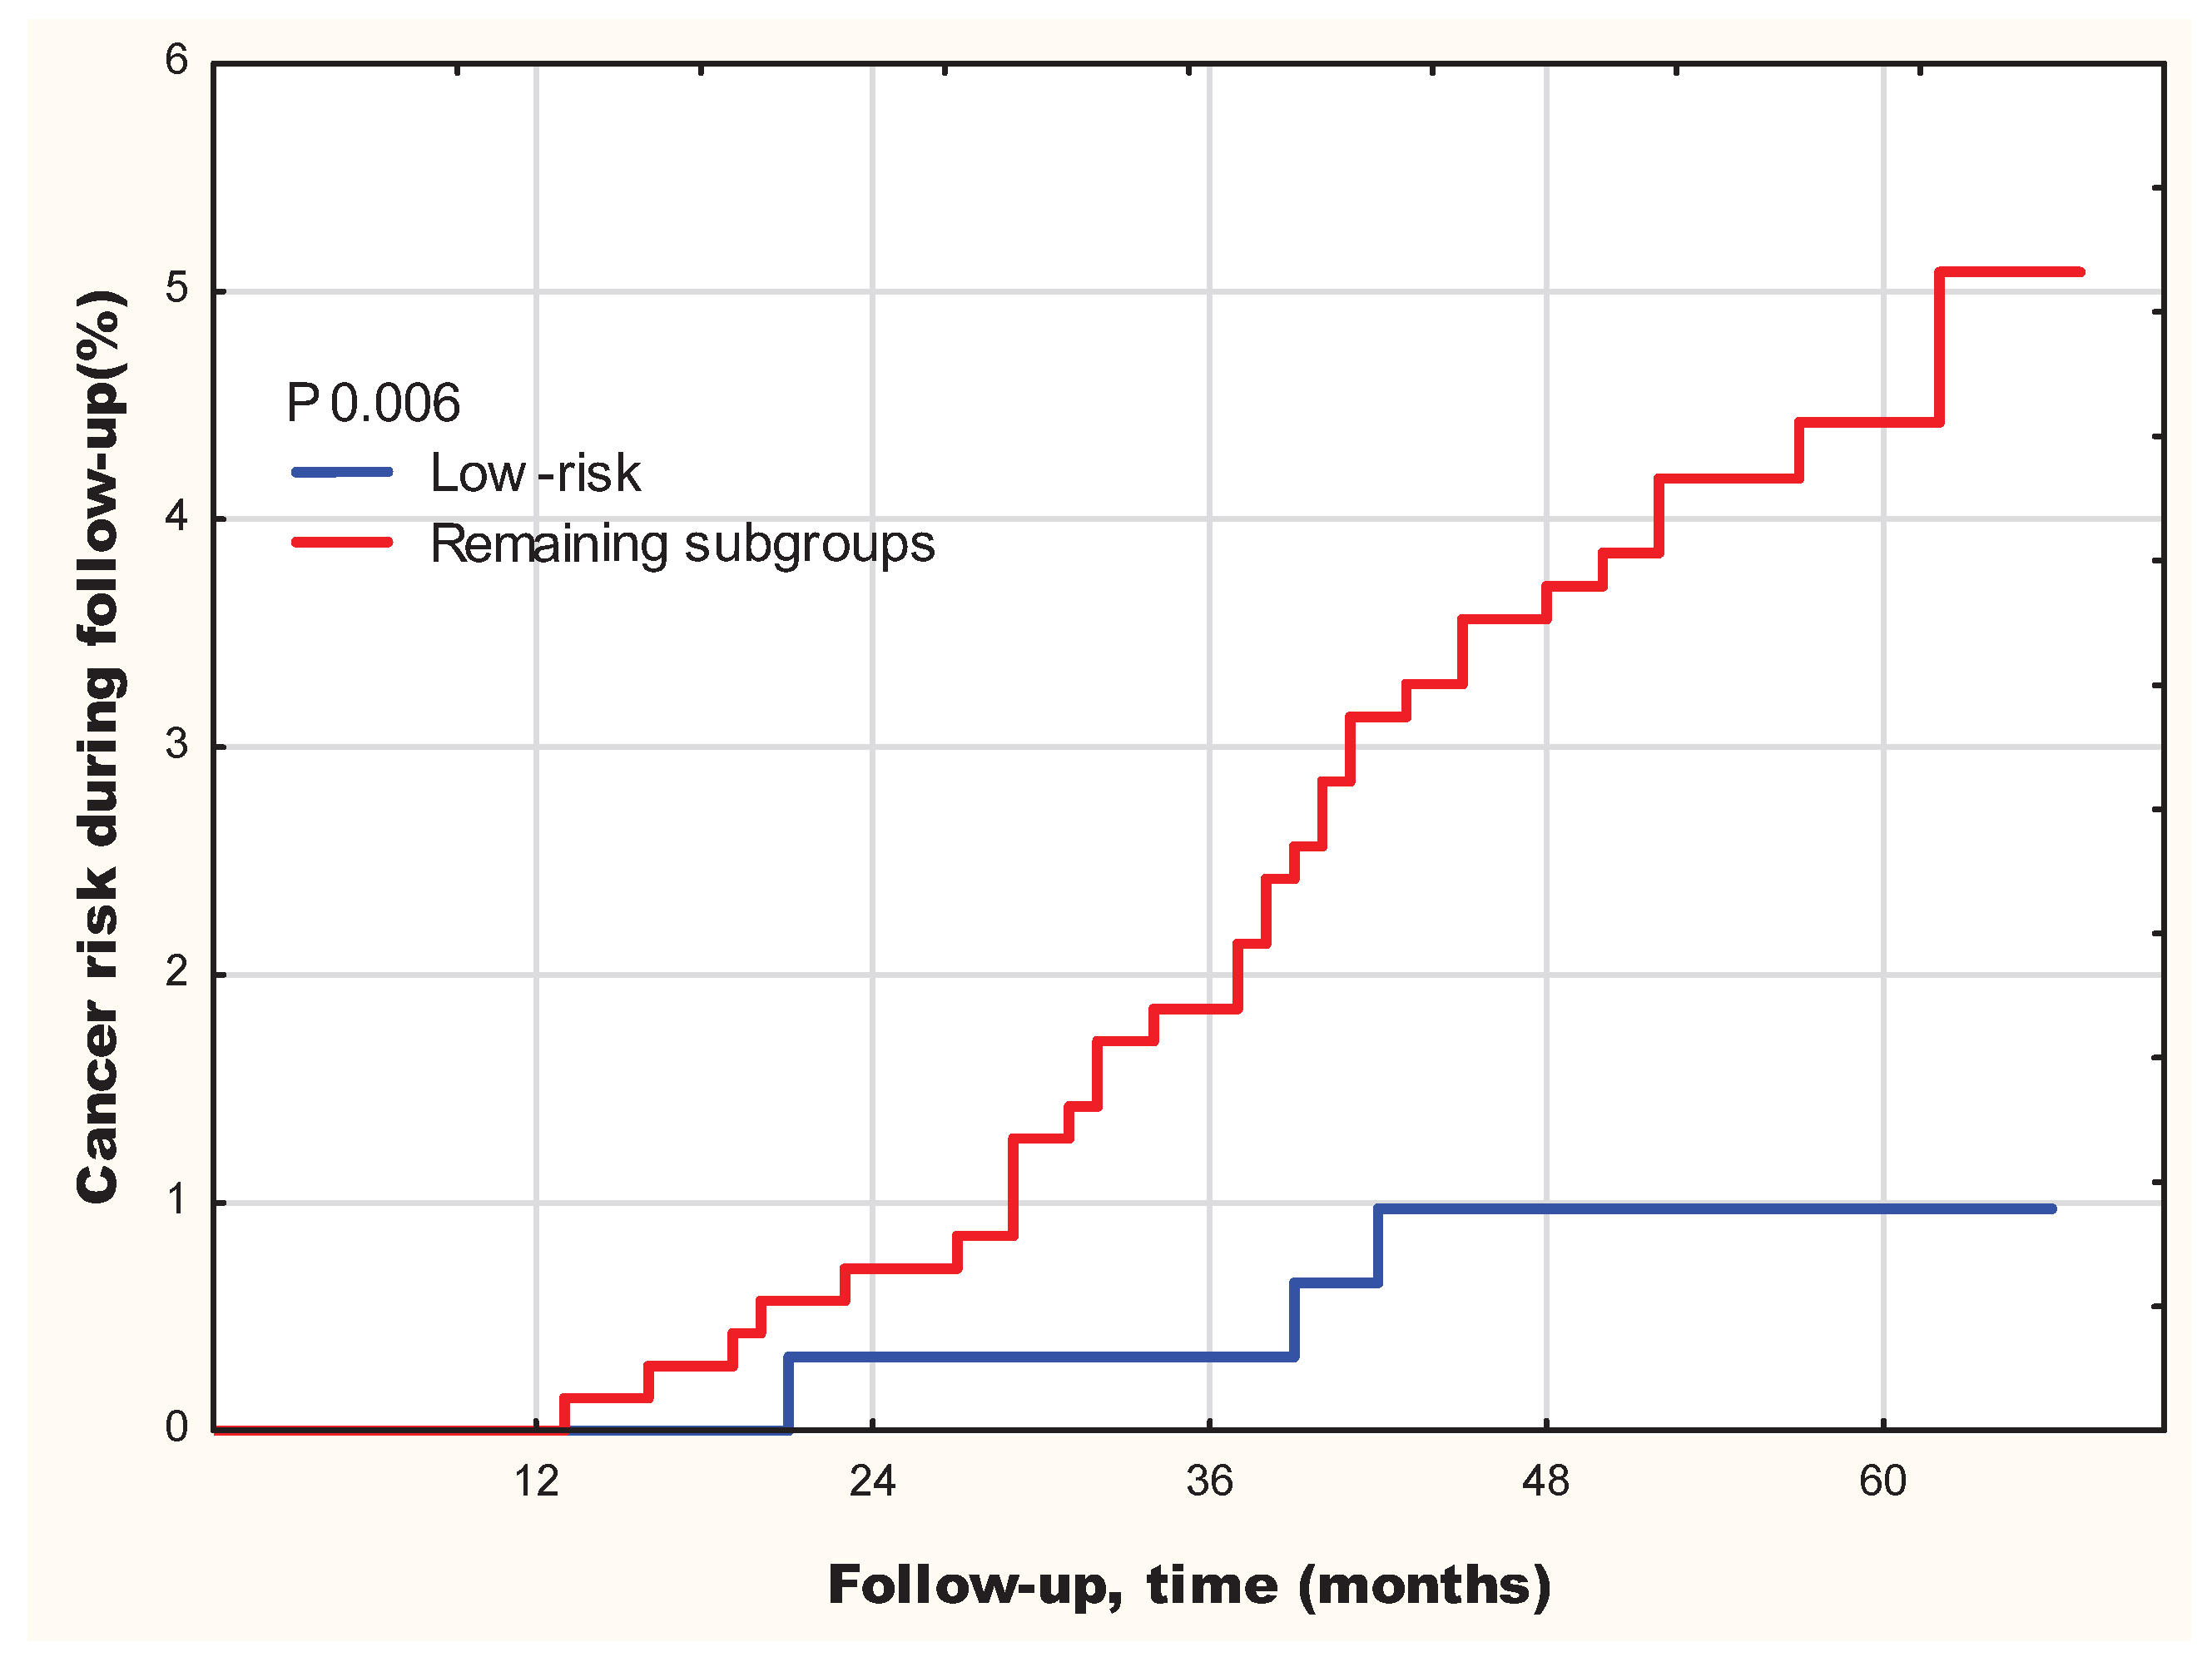
Figure 2.
Association between arsenic concentration and cancer risk stratified by CAT genotype in women with selenium levels 98–108 µg/L. Forest plot showing hazard ratios (HRs) and 95% CI for the low-risk subgroup compared with all remaining participants. Analysis was restricted to BRCA1-negative women from the intervention cohort, with selenium concentrations of 98–108 µg/L.
Figure 2.
Association between arsenic concentration and cancer risk stratified by CAT genotype in women with selenium levels 98–108 µg/L. Forest plot showing hazard ratios (HRs) and 95% CI for the low-risk subgroup compared with all remaining participants. Analysis was restricted to BRCA1-negative women from the intervention cohort, with selenium concentrations of 98–108 µg/L.
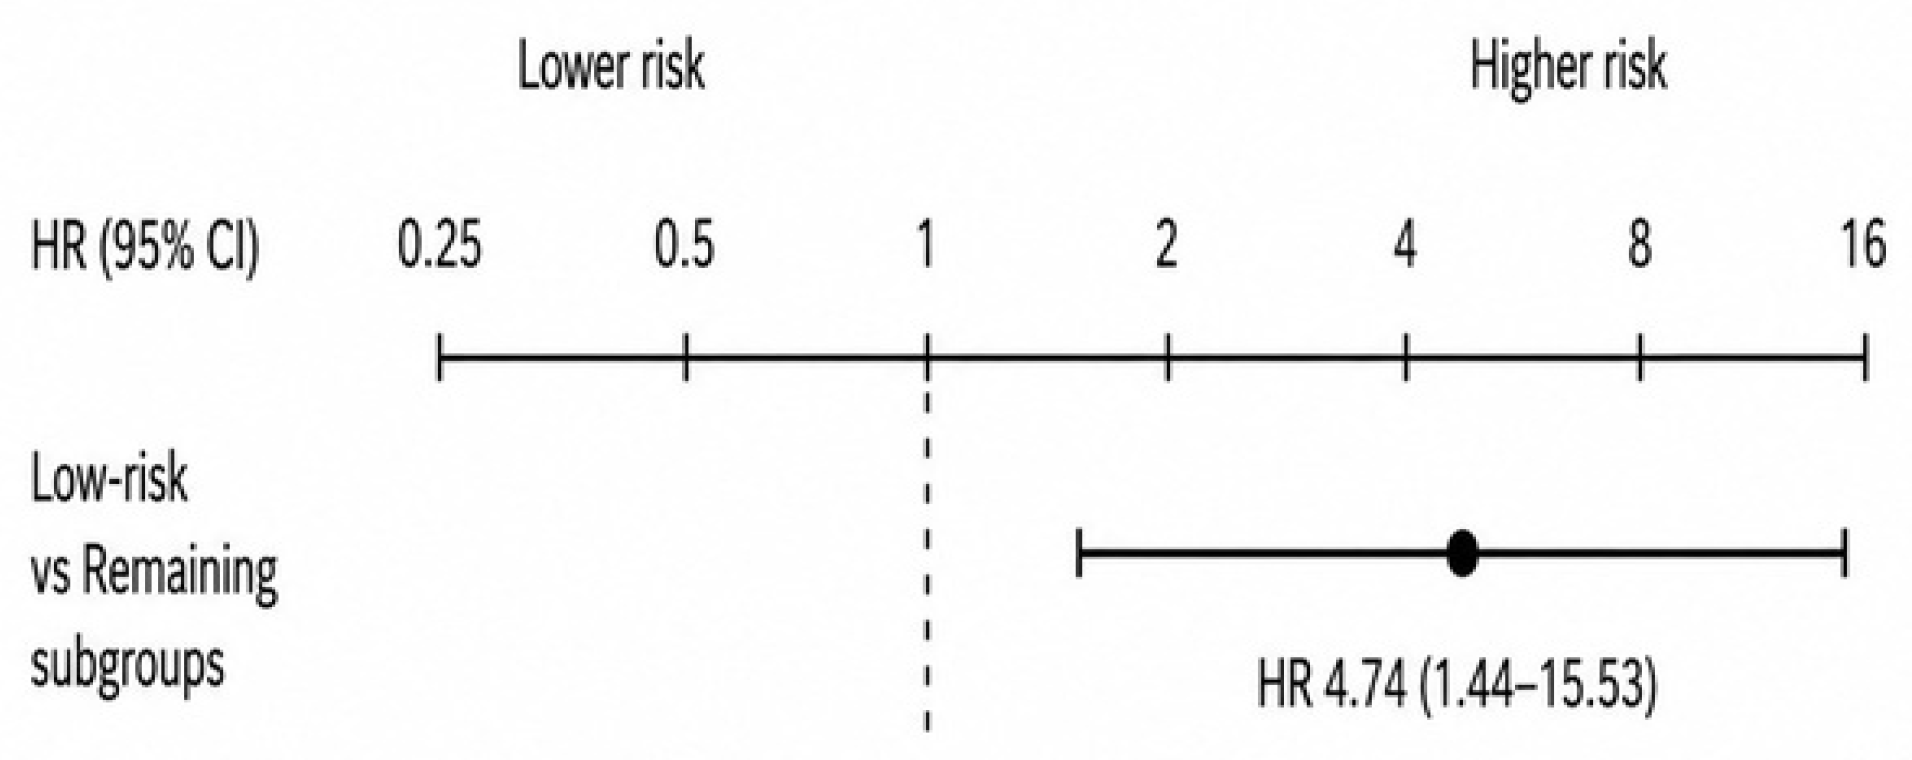
Figure 3.
Association between RI and cancer risk according to CAT genotype in women with selenium levels 98–108 µg/L. Green line indicates participants meeting the predefined CAT index criteria; black line indicates all remaining participants. P value calculated using the log-rank test. Analysis was restricted to BRCA1-negative women from the intervention cohort, with selenium concentrations of 98–108 µg/L.
Figure 3.
Association between RI and cancer risk according to CAT genotype in women with selenium levels 98–108 µg/L. Green line indicates participants meeting the predefined CAT index criteria; black line indicates all remaining participants. P value calculated using the log-rank test. Analysis was restricted to BRCA1-negative women from the intervention cohort, with selenium concentrations of 98–108 µg/L.
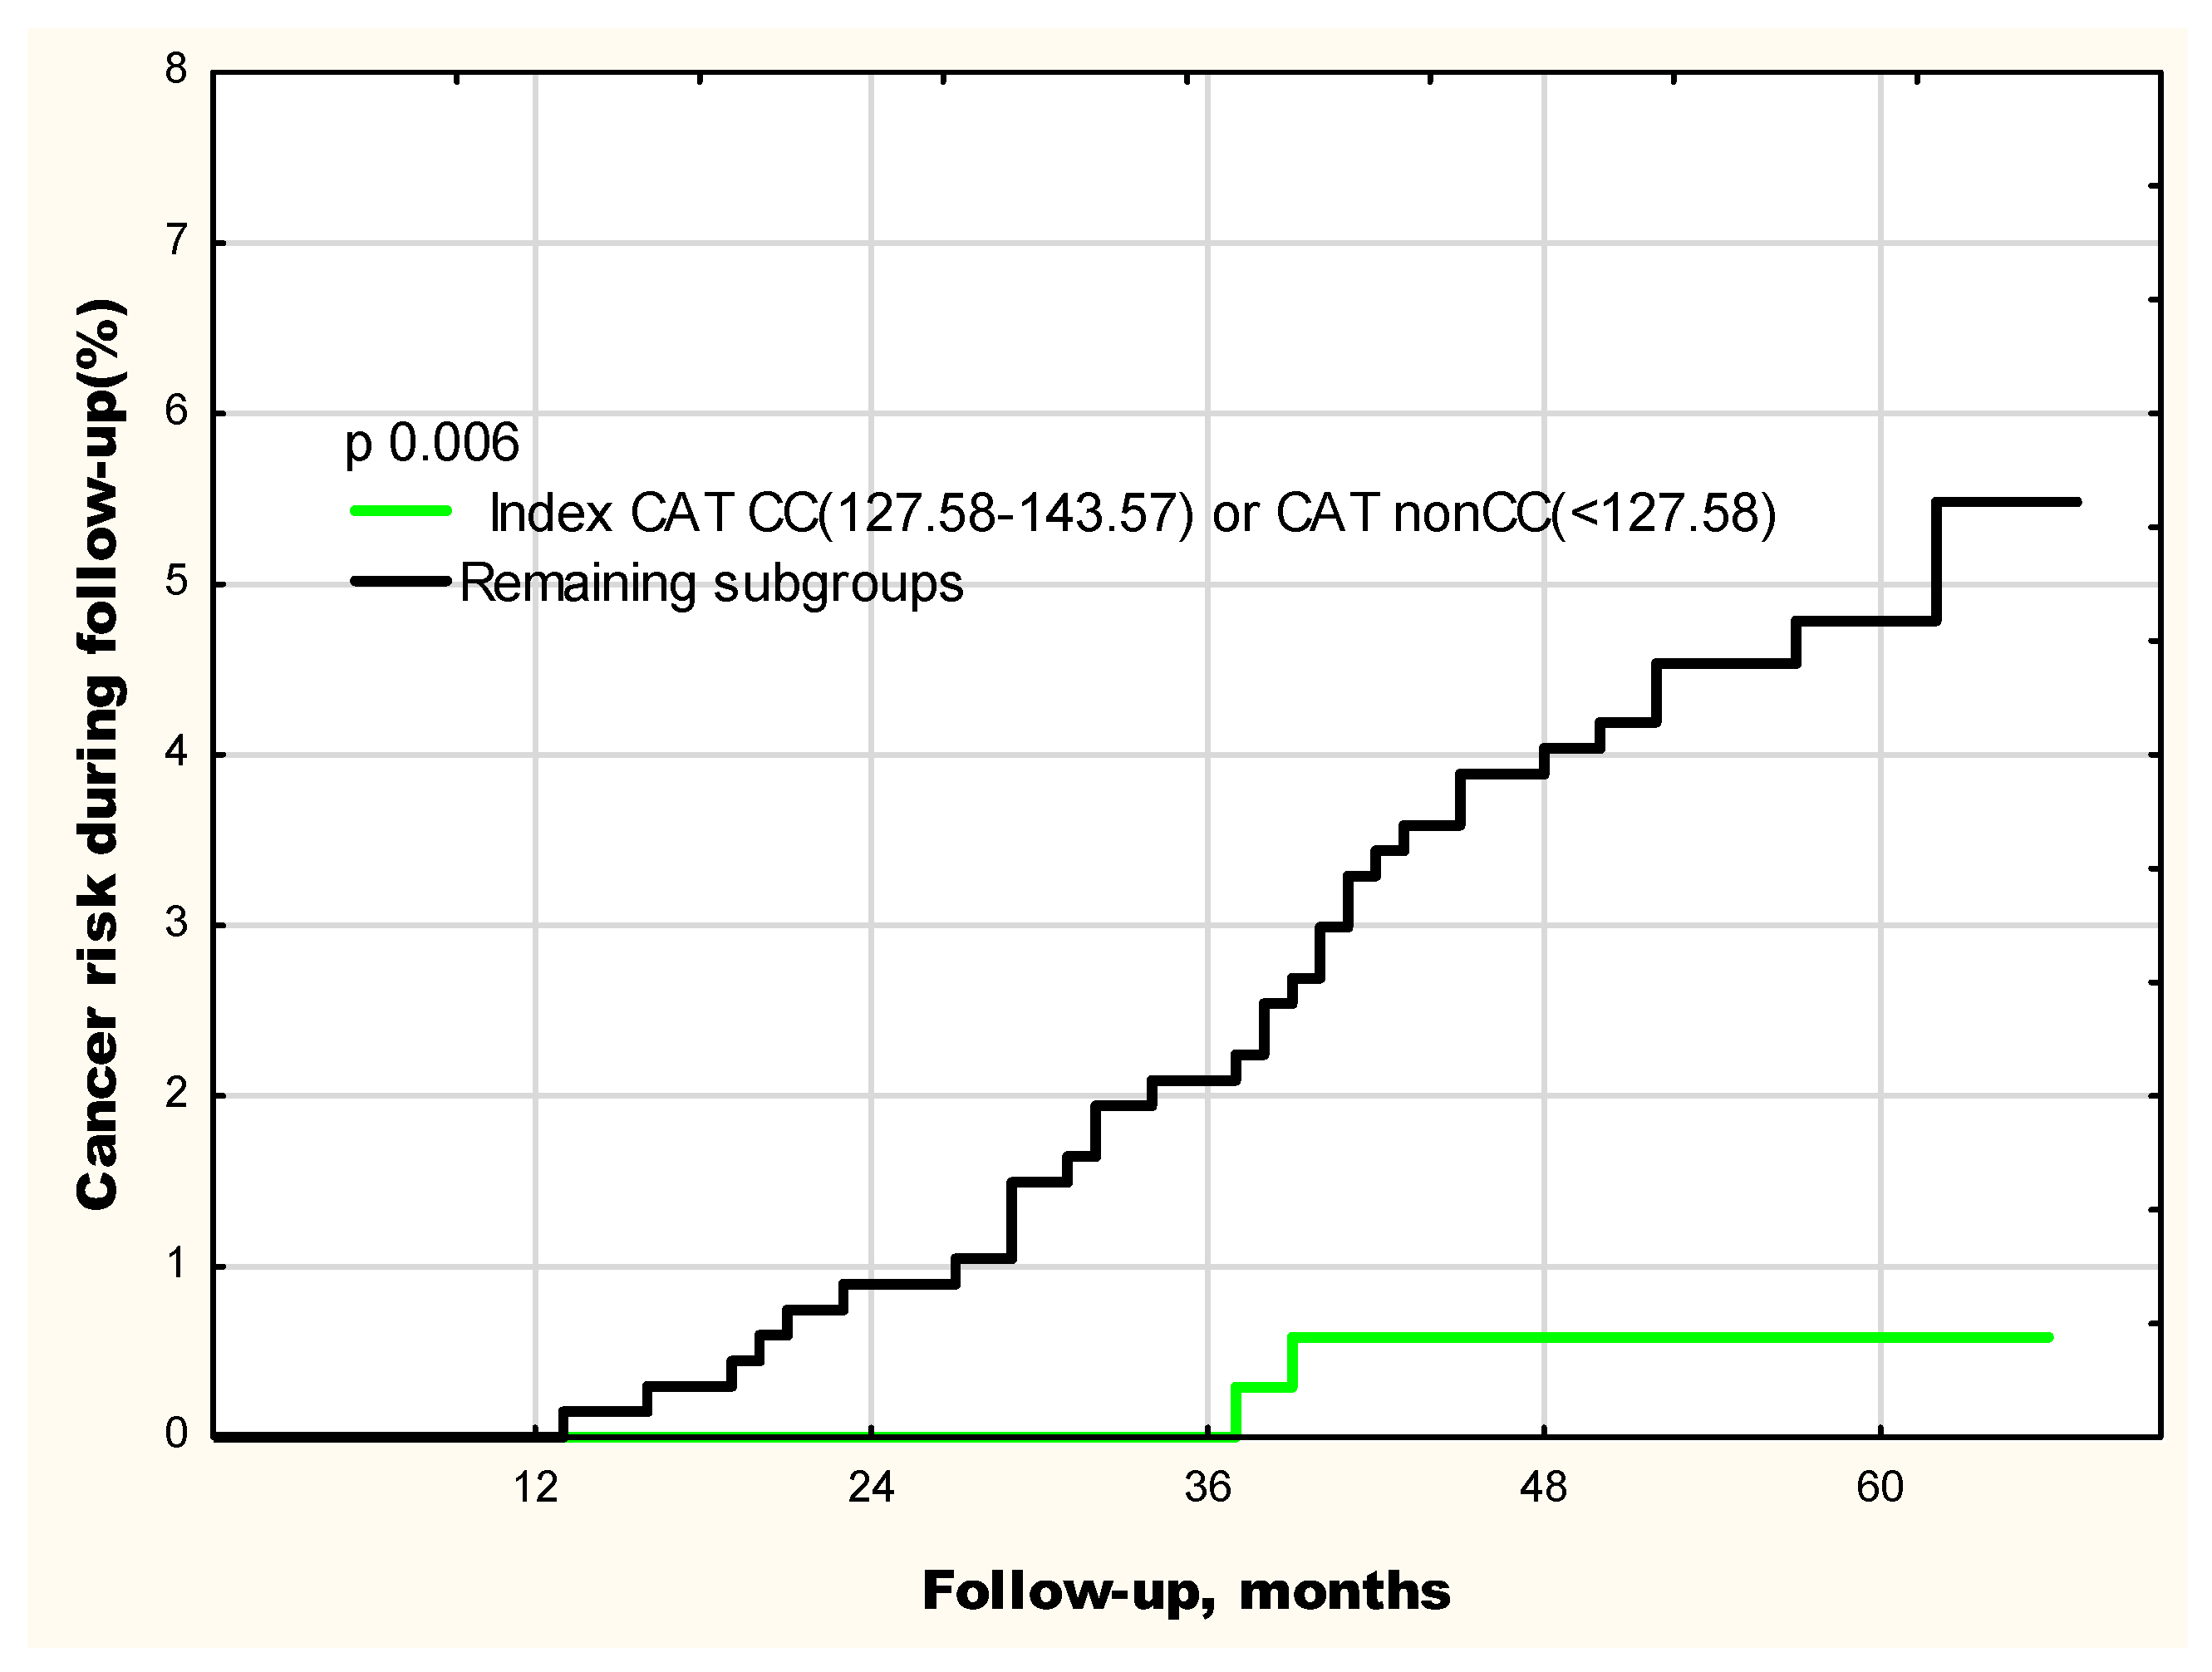
Figure 4.
Association between risk index (RI) and cancer risk stratified by CAT genotype in women with selenium levels 98–108 µg/L. Forest plot showing hazard ratios (HRs) and 95% CI for the low-risk subgroup compared with all remaining participants. Analysis was restricted to BRCA1-negative women from the intervention cohort, with selenium concentrations of 98–108 µg/L.
Figure 4.
Association between risk index (RI) and cancer risk stratified by CAT genotype in women with selenium levels 98–108 µg/L. Forest plot showing hazard ratios (HRs) and 95% CI for the low-risk subgroup compared with all remaining participants. Analysis was restricted to BRCA1-negative women from the intervention cohort, with selenium concentrations of 98–108 µg/L.
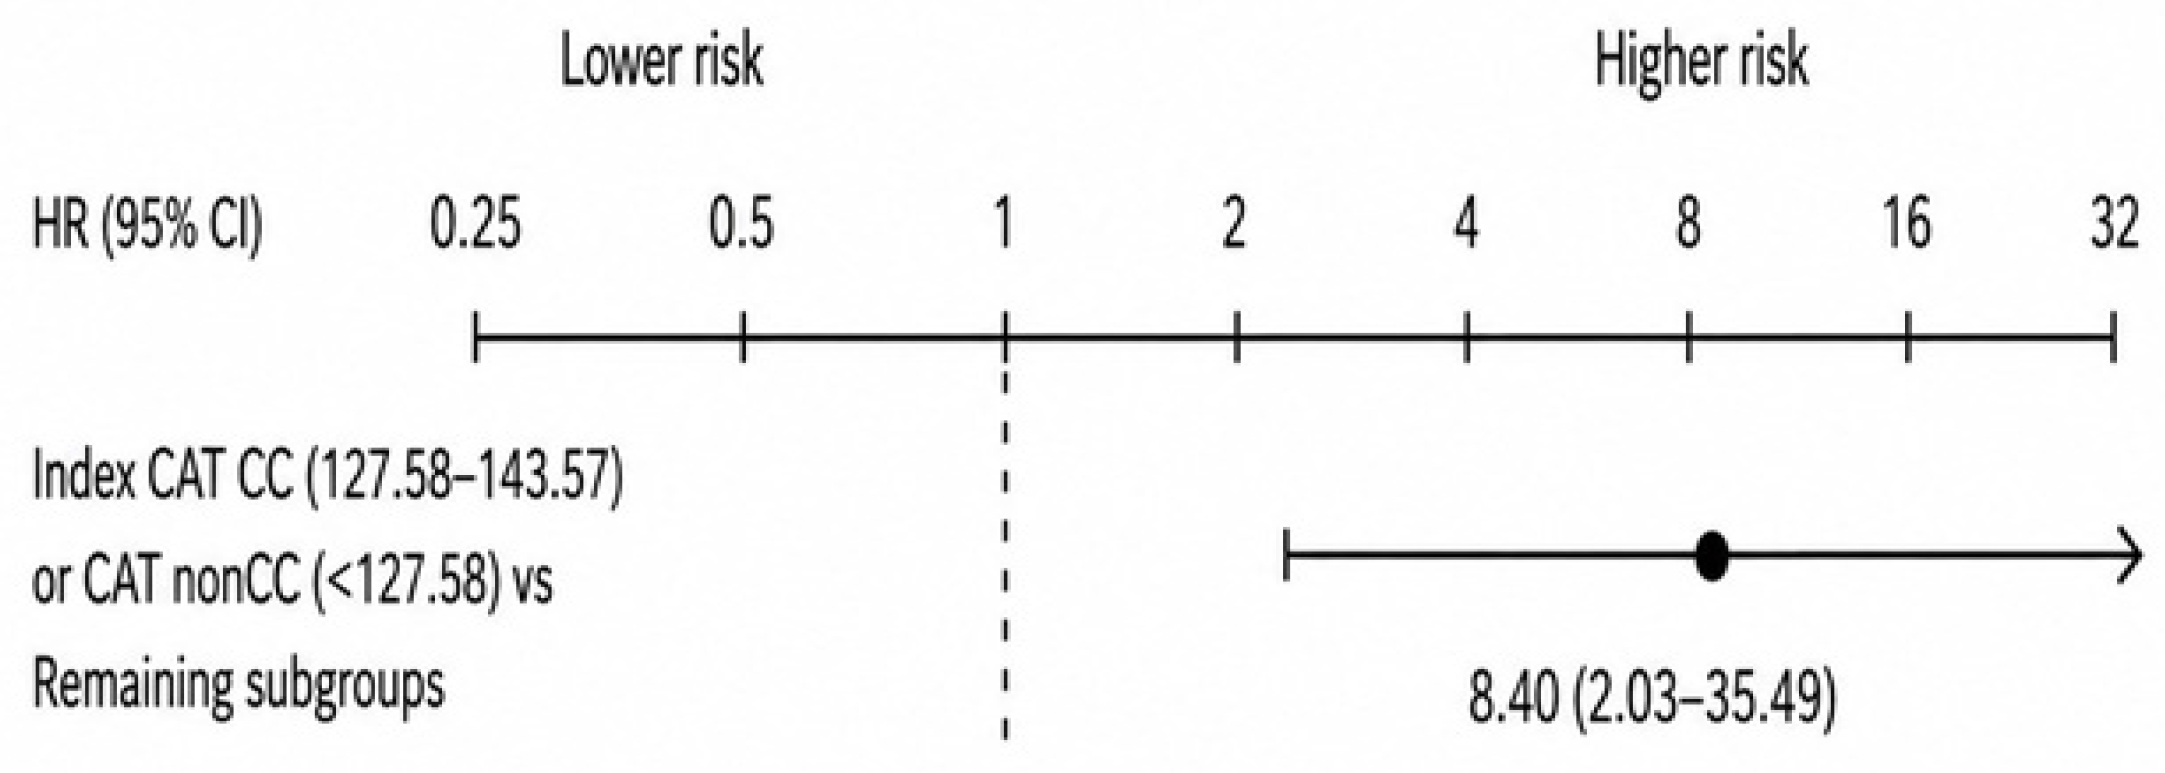

Table 1.
Baseline characteristics of the study population by study group.
| Intervention cohort (BRCA1-negative), n (%) | Comparator cohort (BRCA1-negative), n (%) | |
|---|---|---|
| No. of participants | 3,176 (100.0) | 1,671 (100.0) |
| Selenium excess—diet / comparator | 1,231 (38.8) | 830 (49.7) |
| Selenium deficiency—diet / comparator | 686 (21.6) | 841 (50.3) |
| Selenium deficiency—supplementation | 617 (19.4) | — |
| Selenium deficiency—placebo1 | 642 (20.2) | — |
| Mean selenium concentration (µg/L), baseline (SD) | 102.54 (21.90) | 104.71 (20.14) |
| Mean arsenic concentration (µg/L), baseline (SD) | 0.95 (1.07) | 1.06 (1.00) |
| Mean selenium concentration (µg/L), end of follow-up (SD) | 104.26 (13.94) | 107.0 (19.63) |
| Mean arsenic concentration (µg/L), end of follow-up (SD) | 0.9 (0.83) | 1.13 (0.94) |
| Mean age (years), SD | 54.0 (9.31) | 54.0 (9.09) |
| Mean follow-up (months), SD | 53.0 (12.23) | 53.0 (8.31) |
| Prevalent cancer at baseline, n (%) | 462 (14.5) | 211 (12.6) |
| Incident cancers, n (%) | 91 (2.9) | 60 (3.6) |
| Breast cancers, n (%) | 36 (1.1) | 34 (2.0) |
| Other cancers, n (%) | 55 (1.7) | 26 (1.6) |
| Preventive adnexectomies, n (%) | ||
| Yes | 389 (12.2) | 192 (9.7) |
| No | 2,779 (87.5) | 1,475 (88.3) |
| missing | 8 (0.3) | 4 (0.2) |
| Smoking, n (%) | ||
| Yes | 1,341 (42.2) | 654 (39.1) |
| No | 1,824 (57.4) | 1,004 (60.1) |
| missing | 11 (0.3) | 13 (0.8) |
| Oral contraceptive use, n (%) | ||
| Yes | 926 (29.2) | 572 (34.2) |
| No | 2,222 (70.0) | 1,079 (64.6) |
| missing | 28 (0.9) | 20 (1.2) |
| Hormone replacement therapy (HRT), n (%) | ||
| Yes | 419 (13.2) | 353 (21.1) |
| No | 2,728 (85.9) | 1,298 (77.7) |
| missing | 29 (0.9) | 20 (1.2) |
Values are presented as mean (SD) or n (%). 1Participants in the placebo group received dietary recommendations related to arsenic, but not to selenium.
Table 2.
Association between arsenic concentration and cancer risk in women with selenium concentrations 98–108 µg/L (BRCA1-negative).
Table 2.
Association between arsenic concentration and cancer risk in women with selenium concentrations 98–108 µg/L (BRCA1-negative).
| BRCA1-negative | |||
| As concentration (µg/L) | Cases, n (%) | Total, n | |
| <0.57 | 7 (2.6) | 270 | |
| 0.57–0.75 (reference) | 6 (2.0) | 300 | |
| 0.75–1.07 | 9 (3.4) | 260 | |
| >1.07 | 12 (6.6) | 180 | |
| Multivariable Cox regression1 | |||
| As concentration | HR | 95% CI | P value |
| 0.57–0.75(reference) vs >1.07 | 3.46 | 1.28–9.32 | 0.013 |
1Adjusted for age, smoking, oophorectomy, hormone replacement therapy, and oral contraceptive use. The proportional hazards assumption was not violated (Schoenfeld residuals test, P=0.77). P values remained statistically significant after Bonferroni correction for multiple comparisons.
Table 3.
Association between arsenic concentration and cancer risk stratified by CAT genotype in women with selenium levels 98–108 µg/L (intervention cohort, BRCA1-negative).
Table 3.
Association between arsenic concentration and cancer risk stratified by CAT genotype in women with selenium levels 98–108 µg/L (intervention cohort, BRCA1-negative).
|
CAT CC genotype Selenium 98–108 µg/L | |||
| As concentration (µg/L) | Cases, n (%) | Total, n | |
| < 0.57 | 5 (3.5) | 144 | |
| 0.57–0.75 (reference) | 1 (0.5) 1 | 189 | |
| 0.75–1.07 | 4 (2.5) | 160 | |
| > 1.07 | 6 (5.4) | 111 | |
|
CAT non-CC genotype Selenium 98–108 µg/L | |||
| As concentration (µg/L) | Cases, n (%) | Total, n | |
| < 0.57(reference) | 2 (1.7)1 | 120 | |
| 0.57–0.75 | 5 (4.3) | 115 | |
| 0.75–1.07 | 5 (5.0) | 100 | |
| > 1.07 | 6 (8.7) | 69 | |
| Multivariable Cox regression2 | |||
| Combined exposure category | HR | 95% CI | P value |
| Combined low-risk category3 vs remaining categories | 4.74 | 1.44–15.53 | 0.01 |
1Lowest risk category used as reference in Cox model. 2Adjusted for age, smoking, oophorectomy, hormone replacement therapy, and oral contraceptive use. The proportional hazards assumption was not violated (Schoenfeld residuals test, P=0.87). P values remained statistically significant after Bonferroni correction for multiple comparisons.3Defined as: CAT CC with arsenic 0.57–0.75 µg/L or CAT non-CC with arsenic <0.57 µg/L.
Table 4.
Association between risk index (RI) and cancer risk in BRCA1-negative women with selenium levels 98–108 µg/L (intervention cohort).
Table 4.
Association between risk index (RI) and cancer risk in BRCA1-negative women with selenium levels 98–108 µg/L (intervention cohort).
| BRCA1-negative | |||
| RI category1 | Cases, n (%) | Total, n | |
| <127.58 | 5 (3.3) | 148 | |
| 127.58–143.57 (reference) | 8 (1.6) | 486 | |
| 143.57–166.54 | 12 (4.8) | 249 | |
| >166.54 | 9 (7.1) | 127 | |
| Multivariable Cox regression2 | |||
| RI category1 | HR | 95% CI | P value |
| 127.58–143.57 (reference) vs >166.54 | 4.51 | 1.72–11.83 | 0.0012 |
1RI = selenium concentration + (arsenic concentration × 50). 2Adjusted for age, smoking, oophorectomy, hormone replacement therapy, and oral contraceptive use. The proportional hazards assumption was not violated (Schoenfeld residuals test, P=0.78). P values remained statistically significant after Bonferroni correction for multiple comparisons. The comparison was pre-specified based on the distribution of cancer risk across RI categories observed in preliminary analyses. The weighting coefficient for arsenic (×50) was selected based on exploratory analyses.
Table 5.
Association between risk index (RI) and cancer risk stratified by CAT genotype in women with selenium levels 98–108 µg/L (intervention cohort, BRCA1-negative).
Table 5.
Association between risk index (RI) and cancer risk stratified by CAT genotype in women with selenium levels 98–108 µg/L (intervention cohort, BRCA1-negative).
|
CAT CC genotype Selenium 98–108 µg/L | |||
| RI category1 | Cases, n (%) | Total, n | |
| <127.58 | 4 (4.6) | 87 | |
| 127.58–143.57 (reference) | 1 (0.4) | 281 | |
| 143.57–166.54 | 6 (3.8) | 156 | |
| >166.54 | 5 (6.3) | 80 | |
|
CAT non-CC genotype Selenium 98–108 µg/L | |||
| RI category1 | Cases, n (%) | Total, n | |
| <127.58 (reference) | 1 (1.7) | 60 | |
| 127.58–143.57 | 7 (3.4) | 204 | |
| 143.57–166.54 | 6 (6.5) | 95 | |
| >166.54 | 4 (5.5) | 47 | |
| Multivariable Cox regression2 | |||
| Combined exposure category | HR | 95% CI | P value |
| Combined low-risk RI category3 vs remaining categories | 8.49 | 2.03–35.49 | 0.003 |
1RI = selenium concentration + (arsenic concentration × 50). 2Adjusted for age, smoking, oophorectomy, hormone replacement therapy, and oral contraceptive use. The proportional hazards assumption was not violated (Schoenfeld residuals test, P=0.87). P values remained statistically significant after Bonferroni correction for multiple comparisons. 3Defined as CAT CC with RI 127.58–143.57 or CAT non-CC with RI <127.58.
Table 6.
Comparisons of cancer risk between others subgroups (except of those presented in Table 2, Table 3, Table 4 and Table 5), BRCA1(-).
| Multivariable Cox regression† | Schoenfeld residuals test | |||||
| Table 6A. Cancer risk—comparison between intervention subgroups | ||||||
| Study group | Cases, n (% of total) | Total, n | HR | 95% CI | P- value | P- value |
| Placebo | 20 (3.1) | 642 | 1.55 | 0.77–3.12 | 0.21 | |
| Selenium deficit | 21 (3.0) | 686 | 1.43 | 0.71–2.86 | 0.30 | |
| Selenium excess | 37 (3.0) | 1231 | 1.32 | 0.70–2.50 | 0.38 | |
| Selenium supplement | 13 (2.1) | 617 | Reference | — | — | 0.85 |
| Table 6B. Comparison between intervention cohort vs non-randomized comparator cohort | ||||||
| Intervention cohort | 91 (2.8) | 3,176 | 0.77 | 0.55–1.07 | 0.12 | |
| Comparator cohort | 60 (3.6) | 1,671 | Reference | — | — | 0.92 |
| Table 6C. Cancer risk in women with selenium 98–108 µg/L and arsenic <0.6 µg/L: intervention cohort vs comparator cohort | ||||||
| Intervention cohort | 8 (2.5) | 317 | 0.73 | 0.36–1.47 | 0.38 | |
| Comparator cohort | 60 (3.6) | 1,671 | Reference | — | — | 0.97 |
| Table 6D. Comparison of cancer risk between the low-risk arsenic/CAT subgroup and the remaining subgroups | ||||||
| Low-risk subgroup1 | 3 (0.9) | 308 | Reference | — | — | |
| Remaining subgroups | 60 (3.6) | 1,671 | 5.52 | 1.52–20.11 | 0.009 | 0.66 |
| Table 6E. Comparison of risk index between the low-risk RI/CAT subgroups and the remaining subgroups | ||||||
| Low-risk subgroup2 | 3 (0.6) | 341 | Reference | — | — | |
| Remaining subgroups | 60 (3.6) | 1,671 | 10.03 | 2.08–48.17 | 0.004 | 0.66 |
† Adjusted for age, smoking, oophorectomy, hormone replacement therapy, and oral contraceptive use. 1 Defined as CAT CC with arsenic 0.57–0.75 µg/L or CAT non-CC with arsenic <0.57 µg/L. 2 Defined as CAT CC with RI 127.58–143.57 or CAT non-CC with RI <127.58.
Disclaimer/Publisher’s Note: The statements, opinions and data contained in all publications are solely those of the individual author(s) and contributor(s) and not of MDPI and/or the editor(s). MDPI and/or the editor(s) disclaim responsibility for any injury to people or property resulting from any ideas, methods, instructions or products referred to in the content. |
© 2026 by the authors. Licensee MDPI, Basel, Switzerland. This article is an open access article distributed under the terms and conditions of the Creative Commons Attribution (CC BY) license (http://creativecommons.org/licenses/by/4.0/).
Copyright: This open access article is published under a Creative Commons CC BY 4.0 license, which permit the free download, distribution, and reuse, provided that the author and preprint are cited in any reuse.


