

Submitted:
05 July 2026
Posted:
06 July 2026
You are already at the latest version
Abstract
Multimodal situational awareness dashboards that combine sound and vision are increasingly deployed in security, facility, and safety monitoring, yet relatively little attention has been given to how these systems communicate the status of their underlying sensor data. In some prototype and demonstration systems, simulated values may be presented in ways that resemble live sensor outputs, making it difficult for operators to distinguish between actual observations and generated information. This article presents AI Sound and Vision Radar, a dashboard that integrates real-time visual object detection and tracking with real-time acoustic capture, spectral analysis, and sound source bearing estimation, together with a tool-calling large language model that enables natural language interaction. The audio and visual streams are associated through a lightweight bearing-gated fusion layer to provide a unified situational view. The system is designed around a transparency-first architectural pattern in which every sensing and reasoning module first attempts genuine hardware or API access, reports its connectivity status explicitly, and requires the interface to verify that status before presenting any value as live rather than simulated. We describe the system architecture and report the functional verification conducted during development, including interface rendering, multi-frame tracking persistence, occlusion handling, bearing-gated fusion behaviour, and end-to-end validation of the language model tool-calling workflow. We suggest that explicit sensor-provenance disclosure is a useful design consideration for multimodal monitoring systems and complements Explainable AI approaches that primarily focus on interpreting model decisions rather than communicating the origin and availability of sensor data.
Keywords:
multimodal sensor fusion
; situational awareness
; acoustic-visual fusion
; transparent and trustworthy AI systems
; object detection and tracking
; human-AI interaction
Introduction
Real-time dashboards that combine audio and video are used across security, facility management, industrial inspection, and campus monitoring. Artificial intelligence lets such systems automatically classify what a camera sees and what a microphone hears, and fusing the two gives an operator something closer to a coherent picture of a scene: not simply that someone is present, but that a person is visible at a given bearing and range while a raised voice is arriving from a compatible direction. This kind of cross-modal correlation is what turns two separate sensor feeds into a single situational-awareness product.
Two gaps motivate this work. The first is technical. Fusing acoustic and visual detections in real time on commodity hardware, without dedicated radar or sonar arrays or a calibrated stereo rig, is comparatively underexplored outside specialist defense and robotics literature, and public demonstrations of such systems rarely disclose which parts of the display are genuinely live and which are illustrative placeholders. The second gap concerns something more basic than detection accuracy: the honesty of system status reporting. Gunning and Aha (2019) describe DARPA’s Explainable Artificial Intelligence program as a response to the difficulty users face trusting machine learning systems whose internal reasoning remains opaque. Our concern is related but sits earlier in the pipeline: rather than reasoning transparency, we focus on whether the system accurately reports its own operational and connectivity state before any reasoning occurs. Before an operator can reasonably evaluate why a system reached a conclusion, they need to know whether the number in front of them came from a sensor or from a placeholder. A dashboard that silently substitutes synthetic values under a header reading “live” or “active” produces a distinct and, in an operational setting, potentially more consequential form of opacity than an unexplained model output, because the operator is not even aware that a judgment is being demanded of them.
This article presents AI Sound and Vision Radar, an iteratively developed dashboard that integrates five modules: a vision engine performing real-time object detection and tracking, an acoustic engine performing real-time capture, spectral classification, and time-delay bearing estimation, a lightweight fusion layer that correlates the two modalities by bearing, a location panel with tiered GPS and IP-based fallback, and a large language model analyst that answers operator questions by calling a tool that snapshots the dashboard’s current state. Each modules follows the same design principle: attempt hardware or API access directly, expose a typed connectivity flag, and require the presentation layer to verify that flag before treating a value as live. This principle is referred to throughout as the transparency-first pattern. We refer to this discipline throughout as the transparency-first pattern.
The remainder of the article proceeds as follows. The next section situates the work relative to prior research on situation awareness, multisensor fusion, and explainable AI. The System Architecture section describes each module and the design decisions behind it. The Verification section reports the functional tests performed during development, distinguishing clearly between what was verified and what remains untested. The Discussion section argues for the transparency-first pattern as a generalizable design principle. Limitations and Future Work follow before the Conclusion.
Background and Related Work
Endsley’s (1995) three-level model characterizes situation awareness as a progression: perception of relevant elements in the environment, comprehension of their meaning in relation to task goals, and projection of their status in the near future. A fused acoustic-visual display is really aimed at the first two levels. It hands the operator raw perception (something’s there, a sound just happened) and a first stab at comprehension (that sound and that object are probably the same thing). This framework also clarifies why undetected sensor data corruption poses a risk beyond conventional measurement error. When the perceptual layer cannot be trusted, the comprehension and projection stages built upon it are compromised, regardless of the sophistication of the reasoning applied downstream. Khaleghi et al. (2013) survey the multisensory fusion landscape and sort fusion architectures by where the combining happens: raw data fusion, feature-level fusion, and decision-level fusion, where each sensor spits out its own detections or classifications first and a separate stage links them together afterward. The fusion layer in this article fits that last category. The acoustic and visual pipelines run independently, each producing its own detections, and a lightweight bearing-gated matching step ties them together after the fact.
Tracking multiple objects through noisy detections is well-trodden ground at this point. The constant-velocity Kalman filter (Kalman 1960) is still a go-to tool for smoothing position estimates and bridging short gaps when detection drops out. When you’ve got multiple tracks and multiple detections to sort out, especially with clutter or crossing paths, joint probabilistic data association (Bar-Shalom and Fortmann 1988) is the standard upgrade over basic nearest-neighbour matching. Our vision engine uses a Kalman filter per object for tracking but keeps the association step simple with greedy nearest-centroid matching. We flag that trade-off directly in the Limitations section rather than pretending it does what a full Joint Probabilistic Data Association (JPDA) approach would. On the audio side, estimating direction of arrival from a small microphone array usually comes down to generalized cross-correlation time-delay estimation (Knapp and Carter 1976), which we run in a two-channel setup whenever a multi-channel input device is available. For vision, contrast-limited adaptive histogram equalization (Zuiderveld 1994) is a solid, well-established way to preprocess frames so detection stays consistent under uneven or backlit lighting, without messing with the colour info a classifier might depend on. Finally, this work engages with the explainability literature from an unusual angle. Gunning and Aha (2019) frame explainability as a property of a model’s decision process. The transparency-first pattern described here targets a different, earlier link in the chain: whether the data feeding that decision process is real. We suggest these are complementary rather than competing concerns and return to that argument in the Discussion.
System Architecture
AI Sound and Vision Radar was developed at Newcastle University in collaboration with the NVIDIA AI Technology Center Joint Laboratory as a demonstrator for real-time multimodal situational awareness on commodity hardware, meaning a single camera, a standard microphone or small microphone array, and no specialized sensing equipment. Figure 1 shows the dashboard during operation, with the acoustic radar panel, vision and surveillance feed, spectral and classification displays, and the AI analyst panel visible simultaneously.
Design Principle: The Transparency-First Pattern
Each sensing module in the system follows the same three-step procedure. First, the module attempts direct access to its designated input source, which may be a physical camera, an audio input device, a serial GPS receiver or IP-based geolocation endpoint, or a large language model API. Second, it exposes the result of that attempt as an explicit, typed flag. Think a boolean “connected” attribute on the camera and microphone stream classes, or an OFFLINE/ONLINE state on the AI analyst panel. Third, and this is the part that matters, the presentation layer has to check that flag before it renders anything as live. If the flag says the attempt failed, the module falls back to a clearly labeled simulation instead of quietly showing a value that looks just like real data. Take the acoustic panel: it only shows ACOUSTIC: LIVE once a microphone has been opened successfully. Otherwise it shows ACOUSTIC: SIMULATED (no mic detected). It never just defaults to a generic ACTIVE label whether or not a mic’s actually there.
Vision Module
The vision engine handles object detection with YOLOv8 (Jocher, Chaurasia, and Qiu 2023) through the Ultralytics inference API. If the YOLOv8 weights or the underlying deep learning framework aren’t available, it automatically falls back to a Haar-cascade person detector, so the module ends up with reduced accuracy instead of just failing outright. Captured frames go through contrast-limited adaptive histogram equalization (Zuiderveld 1994) applied to the luminance channel. This keeps detection consistent in low-light and backlit conditions without messing with the color balance a classifier relies on.
Each detected bounding box either gets matched to an existing track or starts a new one, using greedy nearest-centroid matching against the predicted positions from a per-object constant-velocity Kalman filter , gated at a 120-pixel association distance. Tracks that go unmatched for more than a set number of frames get aged out. If a track reappears within that window, it picks up its old identity instead of starting fresh, which is what lets the system ride out brief occlusion. Range comes from the similar-triangles monocular method (range equals real-world object width times focal length divided by pixel width), using a per-class table of reference widths and a default focal length that’s explicitly flagged as uncalibrated. Bearing comes from the horizontal pixel offset of an object’s centroid relative to the camera’s field of view. Velocity comes from the Kalman filter’s internal velocity state, converted from image-plane pixels per frame into an approximate real-world speed using the current range estimate.
Acoustic Module
Audio capture runs on the sounddevice library over PortAudio, opened in a background thread. That way, if the system can’t grab a microphone for whatever reason, the failure gets caught, logged to a last_error attribute, and shown to the operator instead of just vanishing silently. When a signal comes in, sound pressure level gets estimated from the frame’s root-mean-square amplitude, expressed as a relative decibel figure. Worth noting: that’s referenced to a nominal digital full-scale offset, not an actual physically calibrated sound-level reference. A seven-class acoustic scene classifier (silence, rumble, voice, music, alarm, machinery, transient) scores each frame based on the energy distribution across frequency bands, computed via a fast Fourier transform of the incoming block. This classifier is a transparent, hand-specified heuristic built on real spectral features, not a trained model. We come back to that distinction in the Limitations section. When two or more input channels are available, bearing gets estimated through generalized cross-correlation time-delay estimation between channel pairs (Knapp and Carter 1976), converting the estimated time delay into an angle using the known microphone spacing and the speed of sound.
Fusion Layer
The fusion layer implements a decision-level combination in the sense described by Khaleghi et al. (2013): the vision and acoustic pipelines each produce independent detections, and a separate step associates them. An acoustic source and a visual detection are considered co-located if their bearing angles fall within an eight-degree tolerance window. Matched pairs are reported as fused objects carrying both acoustic attributes (classification, sound pressure level) and visual attributes (object class, confidence, range, velocity); unmatched acoustic sources and unmatched visual detections are reported separately and explicitly labelled acoustic-only or visual-only rather than silently dropped. This is deliberately a simple gating approach. A production deployment handling cluttered scenes or crossing trajectories would extend it with a proper track-to-track association filter such as joint probabilistic data association (Bar-Shalom and Fortmann 1988), and the codebase notes this explicitly at the point where the simplification is made.
Location Module and AI Analyst
The location panel goes after a real position fix in two tiers: a serial GPS receiver over the NMEA 0183 protocol where that’s available, then IP-based geolocation as a no-hardware fallback. If neither one works out, the panel says so plainly, reporting an explicit no-location-source state along with the actual reason, instead of showing fabricated coordinates that look legit. The AI analyst is a conversational panel backed by a tool-calling large language model agent. Instead of getting a single context dump at the start of the conversation, the model gets one tool: a scene-snapshot function that pulls the dashboard’s current acoustic classification, sound pressure level, individual source bearings, vision-module detections with range and velocity, the fused scene, and GPS status, all built straight from the running application’s live data attributes. The model calls this tool whenever it needs current info before answering, so its responses reflect the dashboard’s actual state at the moment of the question, not some static snapshot from whenever the conversation started. It can also correctly flag when a given panel is running in simulation mode, since that distinction is built right into the data it’s working with.
Requests to the underlying API run on a background thread and get delivered back to the interface through a thread-safe queue, so a slow network round trip never locks up the graphical interface’s main loop. If there’s no API credential configured, the panel reports an explicit OFFLINE state along with instructions for the operator to fix it, following the same transparency-first discipline as the sensing modules.
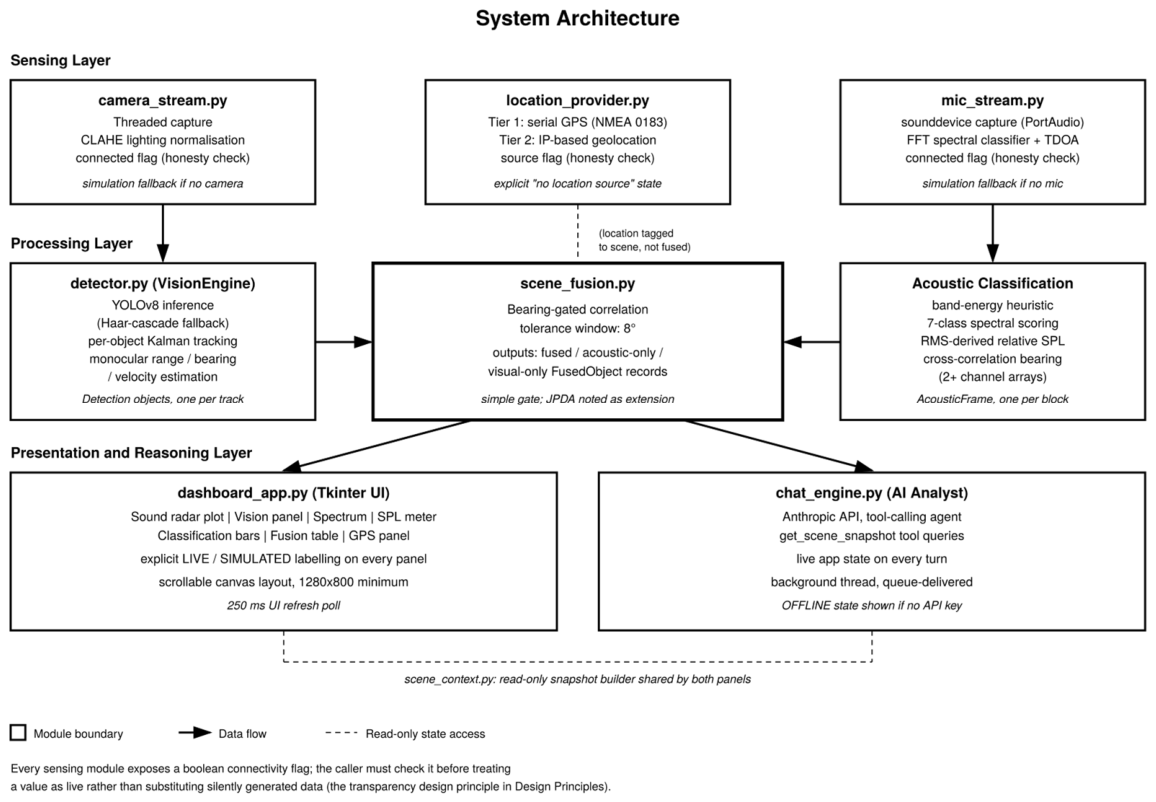
Figure 2 lays out how these five modules connect. Each sensing module feeds into the fusion layer. The fusion layer and the location module both feed the dashboard display and the scene-snapshot tool the AI analyst queries. And the connectivity flag from every sensing module carries through to whatever downstream module ends up presenting that data to the operator.
Verification
Development proceeded through repeated cycles of running the application, capturing actual output, and comparing it against intended behavior, rather than relying on code review alone. This section reports what was verified through that process, and what was not. Interface rendering was verified by running the dashboard under a virtual display (Xvfb) and inspecting real screenshots rather than reasoning about layout code in isolation. This caught two rendering defects that static code reading had missed. The first was a collapsing, overflowing right-hand column, caused by a container frame lacking a fixed width and inconsistent use of Tkinter’s pack-propagate setting; the fix gave affected panels explicit widths with propagation disabled and resized the fusion table’s columns to fit. The second was a table row rendering with an unstyled white background under the interface’s active theme, a known quirk where the default table layout ignores a configured field background color; the fix replaced the default layout with a plain sticky region that respects the configured color. A third, subtler defect surfaced later: the entire top row of panels, including the AI analyst panel, rendered at effectively zero width because the pack-propagate lock had been applied to the row container before any of its four child columns existed, freezing its width at that instant. This was isolated using a thirty-line standalone reproduction outside the full application, and the fix, removing the lock from the row container while keeping it on each column, was confirmed by direct measurement of each panel’s position and width afterward.
Tracking behavior was verified in the vision engine’s simulation mode, where synthetic objects move along known trajectories. Multi-frame identity persistence was confirmed: a single track identifier held across five frames of continuous movement rather than being reassigned. Occlusion survival was confirmed separately: a track persists through a period with no detection, correctly re-associates with the same identifier when the object reappears within the configured window, and is aged out only after that window is exceeded.
Fusion correctness was verified in simulation mode by checking that acoustic sources and visual detections at compatible bearings were correctly matched into fused objects, while those outside the eight-degree tolerance window were correctly reported as acoustic-only or visual-only rather than merged or discarded. The transparency-first pattern itself was verified, not just implemented. In the development container, which lacks physical audio input hardware, the acoustic module’s behavior was verified using a standalone diagnostic script that checked device import, enumeration, and a live test recording. The module reported a specific captured error rather than a generic failure, and the dashboard displayed ACOUSTIC: SIMULATED (no mic detected) rather than an unqualified ACTIVE label. Separately, the location module’s IP-based geolocation fallback was confirmed to fail in this same environment, since outbound requests to the geolocation endpoint are blocked by the sandbox’s network allowlist and return an HTTP 403; the panel correctly displayed an explicit no-location-source state with that reason rather than fabricated coordinates. Both outcomes reflect the sandboxed environment, not defects in the modules, and both were confirmed directly rather than assumed.
The AI analyst’s tool-calling behavior was verified end to end using a mocked language-model client wired into a running dashboard instance. A message typed into the actual chat input triggered the background thread; the mocked client executed a two-call tool-use round trip matching the target API’s format; the tool call retrieved a live scene snapshot from the running application; and the resulting reply, rendered in the actual chat history, correctly referenced the dashboard’s real values at that moment, including sound pressure level, dominant acoustic classification, and loudest source. The send call to the background thread was separately confirmed to return in under one millisecond regardless of the mocked client’s simulated latency, confirming the interface thread isn’t blocked while a request is in flight.
Several aspects of the system have not yet been evaluated, and these limitations are explicitly acknowledged rather than implied to have been addressed. In particular, no quantitative assessment of the accuracy of the range, bearing, or velocity estimates has been conducted against instrumented ground-truth targets. This is because the development environment did not include a physical camera setup with known target distances or a calibrated microphone array; instead, a standard laptop camera was used for development and testing. These constraints define the scope of the limitations discussed in the Limitations section and highlight key directions for future work.
Discussion
The verification results support a focused contribution that is distinct from conventional evaluations of detection accuracy. Rather than assessing how accurately the system estimates range, bearing, or velocity, the evaluation demonstrates that the architecture behaves as intended under the development scenarios considered. The system consistently distinguishes between live sensor data and simulated fallback values, ensuring that generated data are identified as such rather than presented as live observations. This distinction does not establish the accuracy of the underlying sensing algorithms. It does, however, provide evidence that the transparency mechanism operates as intended. The distinction carries practical implications for AI-enabled monitoring systems more broadly. Operators often make decisions by combining information from multiple sensing modalities, and their confidence depends not only on prediction quality but also on understanding where the information originates. If simulated values are displayed without clear indication, users may unintentionally place the same level of trust in generated data as they do in live sensor measurements. Explicitly communicating data provenance helps preserve the context needed for informed decision making, particularly when sensors become unavailable or operate outside their intended conditions.
The transparency-first design pattern explored in this work addresses this issue by making the source of each sensing modality visible within the user interface. Rather than expecting operators to infer whether a sensor is active or unavailable, the interface reports the status of each module directly and indicates whether the displayed information is obtained from live hardware, recorded data, or simulated fallback values. This approach is intended to support informed interpretation of system outputs while reducing ambiguity about the operational state of the sensing platform.
This perspective complements existing research on Explainable AI (XAI). Much of the XAI literature focuses on helping users understand how a model reaches its predictions and on improving confidence in those predictions through interpretable explanations. The approach presented here considers a related but earlier stage of the decision-making process by making the provenance of the underlying sensor data explicit. Together, explainability and provenance transparency address different aspects of trustworthy AI. One concerns the reasoning behind model outputs, while the other concerns the origin and status of the information that those outputs are based upon. We suggest that future multimodal monitoring systems may benefit from considering both aspects during interface design and system evaluation. A second observation from this study relates to the verification of interactive AI systems. Several interface issues identified during development became apparent only after the application was executed and its behaviour was observed in realistic operating conditions. These issues were not evident from reviewing the implementation alone. This experience is consistent with broader software engineering practice, where runtime behaviour often reveals interactions that are difficult to identify through static inspection. For AI systems that integrate sensing, inference, visualisation, and user interaction, verification is likely to benefit from combining code review with scenario-based runtime evaluation. Such an approach provides greater confidence that the complete system behaves as intended when its individual components operate together.
Limitations
The current prototype has several limitations that define the scope of the findings presented in this article. First, the range and velocity estimates produced by the vision module rely on a default, uncalibrated focal length and should therefore be regarded as approximate. A deployment intended for quantitative measurement would require camera-specific intrinsic and extrinsic calibration to improve estimation accuracy. Second, the fallback Haar cascade detector is included solely to maintain basic system functionality when YOLOv8 is unavailable. It is limited to person detection and does not support the wider range of object categories available through the primary detector. As a result, system capability is reduced whenever the fallback detector is active.
Third, the acoustic scene classification module uses a transparent rule-based heuristic derived from spectral band energy rather than a machine learning model trained on labelled acoustic scene datasets. This design was chosen to provide interpretable behaviour and reduce computational complexity during prototype development. Consequently, the classification performance has not been benchmarked against established acoustic scene classification models, and no conclusions are drawn regarding its comparative accuracy. The multimodal fusion component also adopts a deliberately lightweight approach. It associates acoustic and visual observations using bearing-gated matching and assumes that both sensing modalities share a common boresight reference frame. This assumption simplifies the prototype implementation but would require proper extrinsic calibration in a practical deployment where camera and microphone array alignment cannot be guaranteed.
More broadly, the work presented here focuses on demonstrating the functional integration and behavioural correctness of a multimodal sensing system. The evaluation verifies that the individual modules interact as intended, that fallback mechanisms operate correctly, and that the interface transparently communicates the provenance of sensor data. The study does not include quantitative validation of range, bearing, or velocity estimates against instrumented ground truth, nor does it evaluate system performance through user studies or operational field trials. These remain important directions for future work and will be necessary to establish the system’s performance under real-world deployment conditions.
Future Work
Several extensions follow directly from the limitations above. Replacing the heuristic acoustic classifier with a model trained on labelled acoustic-scene data, most plausibly a convolutional network over mel-spectrogram features, would allow a direct accuracy comparison against the current transparent baseline. A camera calibration procedure would let range and velocity estimates be reported with quantified uncertainty rather than as approximate figures. Upgrading the fusion layer to a proper track-to-track association filter would allow the system to handle cluttered scenes with multiple simultaneous sources at similar bearings. Finally, the AI analyst currently exposes only a read-only scene-snapshot tool; extending it to a small set of bounded write actions, such as toggling a module or adjusting an alert threshold, would need its own guardrails and is left as future work rather than attempted here.
Conclusion
This article described AI Sound and Vision Radar, a multimodal dashboard that fuses real-time visual object detection and tracking with real-time acoustic capture, classification, and bearing estimation, presented through an interface that includes a tool-calling AI analyst able to query the system’s live state. The system’s central architectural commitment is that every sensing and reasoning module discloses its own connectivity state before any value derived from it is presented as live, a discipline we call the transparency-first pattern. Functional verification, including interface rendering checks under a real display, multi-frame tracking persistence and occlusion survival, bearing-window fusion correctness, and an end-to-end tool-calling round trip for the AI analyst, confirmed that the system behaves as architecturally intended and does not present simulated data as live under the conditions tested. We’ve been upfront about what remains unverified: quantitative accuracy against ground truth, classifier accuracy relative to a trained model, and any field or operator evaluation. We see the transparency-first pattern as a useful design principle for multimodal situational-awareness systems more broadly, one that complements model-level explainability rather than replacing it. We hope this work encourages closer attention to sensor-provenance disclosure as a core requirement in monitoring dashboard design.
Data and Ethics Statement
This work did not involve human-subjects research, and no personally identifying data was collected or analyzed. The dashboard image in Figure 1 illustrates the system’s interface during a local development session and is included for illustrative purposes. All performance claims in this article are limited to the functional and behavioral verification described in the Verification section; no institutional review was required for this systems-engineering demonstration.
Biographical Sketch
Professor Cheng Siong Chin is Chair Professor of Intelligent Systems Modelling and Simulation at Newcastle University and Editor-in-Chief of Cybernetics and Systems. He has taught system modelling in the university’s Engineering programme since 2010 and holds an Adjunct Professorship at Chongqing University. He directs the Newcastle University-NVIDIA Joint Laboratory and serves as Director of Research and Innovation in Singapore, where he has secured nine EDB Industrial Postgraduate Programme grants as PI or Co-PI in intelligent systems and predictive analytics. His publications include five books, two edited volumes, and three US patents. He sits on the editorial boards of IEEE Access and Applied Artificial Intelligence.
Associate Professor Jianhua Zhang received the M.S. degree and Ph.D. degree from Yanshan University in 2006, 2011, respectively. From 2012 to 2013, he did his postdoctoral research at University of the West of England (UWE), Bristol, UK. He is currently working in Qingdao University of Technology, China. Editor of International Journal of Applied Mathematics in Control Engineering. His research interests include adaptive nonlinear control, neural-network control, and control applications.
Dr. M. Venkateshkumar is an Assistant Professor (Senior Grade) in the Department of Electrical and Electronics Engineering at Amrita School of Engineering, Amrita Vishwa Vidyapeetham, Coimbatore. With over 15 years of teaching and research experience, he specializes in Power Systems Engineering, particularly AI-based hybrid renewable energy systems for grid-connected and standalone applications. He serves as an Associate Editor of IEEE Access and holds leadership positions as Vice Chairman of the IEEE Education Society and IEEE Power & Energy Society under the IEEE Madras Section. He has also authored three books and book chapters published by Elsevier and IntechOpen. His contributions have been recognized with the Young Scientist Award from the Government of Tamil Nadu and the MathWorks Outstanding Contribution Award (USA) for three consecutive years (2015–2017).
Acknowledgments
This work was carried out at Newcastle University Singapore in collaboration with the NVIDIA AI Technology Joint Laboratory.
References
- Bar-Shalom, Y., and Fortmann, T. E. 1988. Tracking and Data Association. New York: Academic Press.
- Endsley, M. R. 1995. Toward a Theory of Situation Awareness in Dynamic Systems. Human Factors 37(1): 32–64. [CrossRef]
- Gunning, D., and Aha, D. W. 2019. DARPA’s Explainable Artificial Intelligence (XAI) Program. AI Magazine 40(2): 44–58. [CrossRef]
- Jocher, G., Chaurasia, A., and Qiu, J. 2023. Ultralytics YOLOv8 (Version 8.0.0) [Computer software]. https://github.com/ultralytics/ultralytics.
- Kalman, R. E. 1960. A New Approach to Linear Filtering and Prediction Problems. Journal of Basic Engineering 82(1): 35–45. [CrossRef]
- Khaleghi, B., Khamis, A., Karray, F. O., and Razavi, S. N. 2013. Multisensor Data Fusion: A Review of the State-of-the-Art. Information Fusion 14(4): 28–44. [CrossRef]
- Knapp, C. H., and Carter, G. C. 1976. The Generalized Correlation Method for Estimation of Time Delay. IEEE Transactions on Acoustics, Speech, and Signal Processing 24(4): 320–327. [CrossRef]
- Zuiderveld, K. 1994. Contrast Limited Adaptive Histogram Equalization. In Graphics Gems IV, ed. P. S. Heckbert, 474–485. San Diego: Academic Press. [CrossRef]
Figure 1.
The AI Sound and Vision Radar dashboard during operation. Clockwise from top left: the acoustic radar panel showing bearing and intensity, the vision and surveillance panel tracking a detected person, the acoustic classification and AI intelligence panels, the alert log, and the live spectrum, sound-level, and GPS panels along the bottom row. https://www.youtube.com/watch?v=uU5HsfbIOCc .
Figure 1.
The AI Sound and Vision Radar dashboard during operation. Clockwise from top left: the acoustic radar panel showing bearing and intensity, the vision and surveillance panel tracking a detected person, the acoustic classification and AI intelligence panels, the alert log, and the live spectrum, sound-level, and GPS panels along the bottom row. https://www.youtube.com/watch?v=uU5HsfbIOCc .
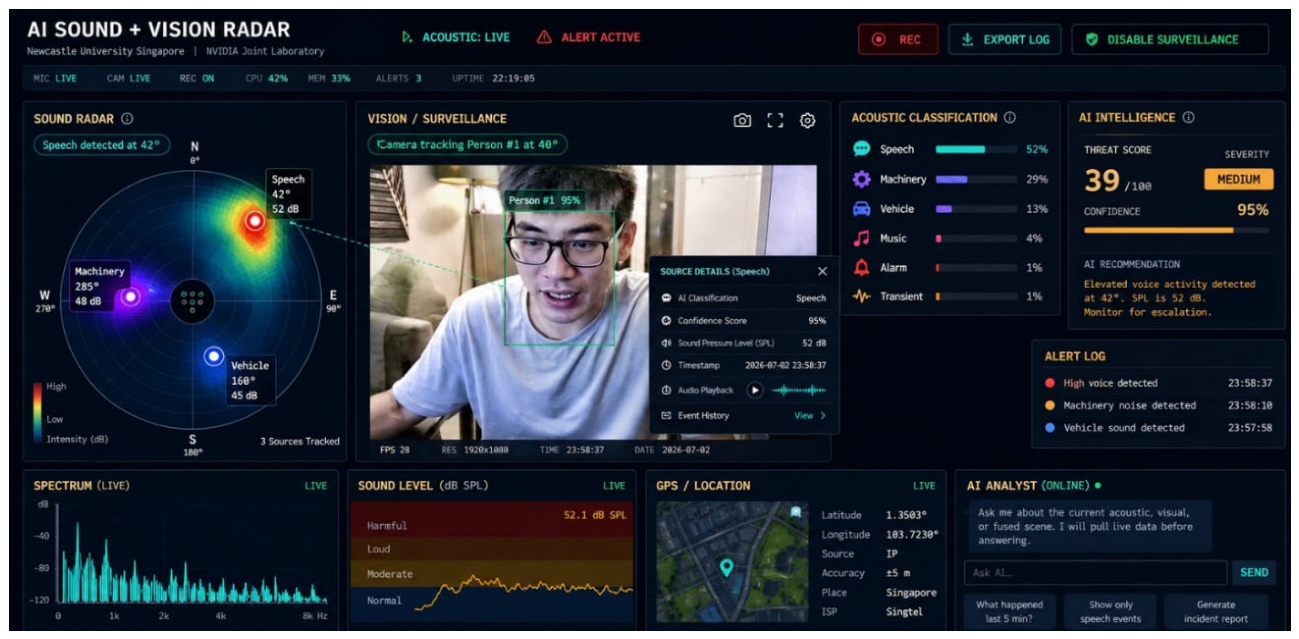
Figure 2.
System architecture. Sensing modules (camera, microphone, GPS) each expose a connectivity flag before any downstream module treats their output as live. The vision engine and acoustic classifier feed the bearing-gated fusion layer, whose output reaches both the dashboard display and the scene-snapshot tool queried by the AI analyst.
Figure 2.
System architecture. Sensing modules (camera, microphone, GPS) each expose a connectivity flag before any downstream module treats their output as live. The vision engine and acoustic classifier feed the bearing-gated fusion layer, whose output reaches both the dashboard display and the scene-snapshot tool queried by the AI analyst.
Disclaimer/Publisher’s Note: The statements, opinions and data contained in all publications are solely those of the individual author(s) and contributor(s) and not of MDPI and/or the editor(s). MDPI and/or the editor(s) disclaim responsibility for any injury to people or property resulting from any ideas, methods, instructions or products referred to in the content. |
© 2026 by the authors. Licensee MDPI, Basel, Switzerland. This article is an open access article distributed under the terms and conditions of the Creative Commons Attribution (CC BY) license (http://creativecommons.org/licenses/by/4.0/).
Copyright: This open access article is published under a Creative Commons CC BY 4.0 license, which permit the free download, distribution, and reuse, provided that the author and preprint are cited in any reuse.


