

Submitted:
04 July 2026
Posted:
06 July 2026
You are already at the latest version
Abstract
Background: The Objective Structured Clinical Examination (OSCE) has been the backbone of assessment in medical education, and the number of stations required to achieve sufficient reliability in high-stakes examinations is an important consideration for resource-limited programs. Methods: The correlation between the number of stations and psychometric performance was simulated using post-hoc resampling of the 17-station Final MBBS Medicine and Therapeutics OSCE across three campuses of the University of the West Indies. Blueprint coverage was maintained in balanced subsets of 6, 8, 10, 12 stations. We compared the failure rates of subset and full-exam failure, internal consistency, generalizability, and correlation of scores. Results: Failure rates increased as the number of stations decreased; however, none of the differences between subset and full-exam performance were significant. Station count was positively related to internal consistency (α ≈.32-61 at 6 stations; α ≈.64-70 at 17 stations) and G-coefficients (≈.18–.42 at 6 and ≈.36–.70 at 17 stations) but were still lower than the highly consistent ≥.80 criterion. High Construct validity even at 6 stations (with high subset total correlations (r≥.79), and approaching 1.00 with 17-station subsets, ANOVA showed a subset size effect on mean values for campuses 1 and 2 but not for campus 3. Conclusions: Ten to twelve stations maintained a strong construct validity. The reliability at 10-12 stations was close to that of the 17 stations total. Campus-level variability highlights the need for examiner training, station quality, and better standard setting in addition to the station count.
Keywords:
OSCE
; reliability
; generalizability theory
; clinical assessment
; MBBS
; psychometrics
; station sampling
; medical education
1. Introduction
Objective Structured Clinical Examination (OSCE) is the standard of clinical competency evaluation in medical education.[1,2] OSCE is traditionally regarded as the gold standard for such assessments because it has a structured format and is comprehensive in terms of clinical scenarios.[3] The reliability and validity of assessment methods used in medical education are crucial, given the high stakes of examinations such as the Final Bachelor of Medicine and Bachelor of Surgery (MBBS) OSCE.[4]
The reliability and validity of OSCE are a function of the number of testing stations in addition to factors including station quality, blueprint, and examiner consistency.[5] Studies have shown that an increase in the number of stations leads to stronger reliability.[6,7] However, a recent meta-analysis has shown that an OSCE with as few as 5–10 stations, each ≤ 10 minutes, can achieve acceptable reliability and internal consistency.[2]
Generalizability Theory (G-Theory) offers a robust platform to estimate reliability through its ability to combine several sources of measurement error, which is an advantage over the techniques of Classical Test Theory (CTT) such as Cronbach’s alpha. The method was developed by Cronbach himself to address the limiting assumptions of CTT.[8] G-Theory does not presuppose a single source of error as does alpha but rather breaks down variance into facets such as stations, raters, and interactions.[2,9,10,11] G-Theory facilitates decision studies (D-studies) to forecast[4] reliability when the design varies (e.g., an increase in the number of stations or the number of examiners). According to G-Theory studies, approximately 20-30 stations would be required to achieve G =.80, which is typically regarded as a threshold level of G appropriate for moderate- to high-stakes testing.[2,10]
Although there is some evidence regarding the number of stations used for high-stakes examinations, more research is needed to establish the minimum number of OSCE stations to ensure sufficiently strong psychometric qualities, particularly in the Final MBBS exams under the constraints experienced in the Caribbean.[2,5] The current study seeks to address this gap by contributing to viable evidence-based exam design preserving validity and reliability for high-stakes OSCE examinations in Caribbean settings.
A multinational publicly supported university with medical faculties on campuses in Jamaica, Trinidad and Tobago, and Barbados, as well as a training site in The Bahamas, The University of the West Indies (UWI) has an overall enrolment of about 1000 medical students in the 5-year MBBS degree program.[1] On completion of the fifth year, students must sit a final MBBS exit examination in the three major disciplines—Medicine and Therapeutics, Obstetrics and Gynecology, and Surgery. These exams consist of a written component and a clinical component in the format of OSCE. Students must pass these exams to be eligible for provisional licensure and internship training in English-speaking Caribbean countries. For many years, the UWI medical faculty has used 17 testing stations in the Final OSCE. The present study aimed to simulate the relationship between the number of OSCE stations and assessment reliability and validity using post-hoc station resampling to inform decisions about feasibility, such as minimum station numbers, for the Final OSCE examination.
2. Materials and Methods
Study Design
This study employed a cross-sectional observational design using psychometric analysis to establish the minimum number of OSCE stations needed for a sufficiently valid and reliable assessment. Reliability was examined using Cronbach’s alpha and Generalizability Theory (G-Theory), and validity was assessed through content and construct validity measures.
Setting and Subjects
Data from the 2019 Final MBBS Medicine and Therapeutics OSCE, administered on three UWI campuses, was used for this analysis. A total of 485 students (260, 194, and 31 from campuses 1, 2, and 3, respectively) completed the OSCE. All students were included in the analysis. Examiners (one per testing station) were drawn from a pool of qualified faculty at each campus. Each campus used a designated proportion of both local examiners and sister-campus examiners.
OSCE Structure
The OSCE at each campus included 17 stations covering relevant learning domains: communication skills (pediatric history, adult history, community health counselling, and psychiatric history); clinical examination skills (pediatric abdomen, pediatric cardiovascular, pediatric neurology, adult abdomen, adult cardiovascular, adult neurology, adult respiratory, rheumatology, and dermatology); and technical skills stations (pediatric and adult). On each campus, the OSCE was staged over one to four days with two or more circuits each day, depending on the size of the student cohort. There was one examiner in each station. All stations were 7 minutes long except for pediatric history, which is 15 minutes, and adult history, which is 23 minutes. Each circuit had 20-23 students. To maintain station content confidentiality, candidates were quarantined to avoid communication between morning and afternoon circuits, and in campuses where OSCE was staged on more than one day, the scenarios and cases for all stations were changed daily but maintained fidelity to the exam blueprint.
Standard Setting and Scoring
Minimum competence thresholds for each station were established prior to the OSCE using the modified Angoff method, with discipline-specific examiners providing judgements for their respective stations. Campus-level pass thresholds were calculated as the sum of station-level minimum competence scores: Campus 1 (310/530), Campus 2 (319/530), Campus 3 (312/530), and Campus 4 (312/530). Raw station scores were converted to standard-set scores using a criterion-referenced formula: for candidates scoring at or above the minimum competence mark (X ≥ PM), the converted score = [(X − PM) / (MM − PM)] × 50 + 50; for candidates scoring below the minimum competence mark (X < PM), the converted score = (X / PM) × 50, where X is the candidate's raw score, PM is the station pass mark, and MM is the maximum mark. Candidates meeting or exceeding the total campus threshold were classified as passing regardless of individual station performance.
Study Procedure
OSCE data from the 17 stations served as the base to model (or pilot) smaller sets of stations to determine whether reliability and validity were preserved. This methodology has been used in other settings, where G-theory methods were used to carry out G/D research based on resampling/simulation of existing OSCE data.[2,9] In the present analysis, subsets of stations were generated with the help of permutation and combination methods. Subsets comprised 6, 8, 10, and 12 stations, and the entire 17-station OSCE was taken as a benchmark. Subsets were content balanced for domain coverage. Each station was rated using structured and standardized rating checklists and global ratings.
Outcome Measures
Fail rates of 12/10/8/6 stations and mean/median failure rates with 95% simulation intervals (2.597.5) were calculated for each campus. Correlation was used to assess the correspondence of performance on the shorter OSCEs (12, 10, 8, and 6 stations) with the full 17-station OSCE on each campus.
Reliability was assessed using Cronbach's alpha, G-coefficient, and standard error of measurement (SEM). Content validity in exam construction was supported by blueprint coverage and expert review, while construct validity was assessed via comparisons and correlation of total scores among the differently sized OSCE simulations.
Statistical Analysis
The Monte Carlo paired resampling of 2,000 random subsets of N stations (without replacement) of 17 stations as the baseline was used to determine failure rates for each campus. Pass/fail status was re-calculated for the same candidates in each subset to permit a paired comparison for each simulation against the full 17-station results. We reported the difference in failure rate between subsets, which was the difference between the failure rate of the subsets and the failure rate of the 17 stations, the mean failure rate at each N, a 95 percent simulated interval (2.5th -97.5th percentile), and the two-sided Monte Carlo p-value. Multiplicity was adjusted at the alpha level of 0.05 through the False Discovery Rate (FDR) of Benjamin and Hawker to address the multiple comparisons (12) between the tests (3 campuses x 4 values of N).
Campus-by-campus correlation analysis was done to determine the effectiveness of shorter OSCEs (12, 10, 8, and 6 stations) in comparison to the total score on 17 stations. We calculated the correlation between the subset total (in over 2 000 random subsets) and the 17-station total for each N for each campus using Pearson’s r (linear association), Spearman’s ρ (rank-order association), and ICC (Intraclass Correlation Coefficient) (3,1) for two-way mixed single-measure agreement. The reliability of each subset was examined by both Cronbach’s alpha and Generalizability Theory (p x s design), and Decision Studies (D-studies) were employed to determine reliability in different numbers of stations. ANOVA was conducted to compare the mean score of subsets, and Pearson correlation was used to determine construct validity. Alpha and G-coefficients were sufficiently reliable using a target of .80.
Ethical Considerations
Data used in this analysis were de-identified as per institutional policy. Ethical approval was secured from The UWI Institutional Review Board (IRB No. 200707-B), and the study complied with the Declaration of Helsinki. In keeping with ethical standards for secondary data analysis, the research team received only anonymized datasets, thereby safeguarding participant confidentiality throughout the study.
3. Results
The Number of Stations and Failure Rate
The baseline (17-station) failure rate was 3.85%, 3.09%, and 0.00% for Campus 1, 2, and 3, respectively. A comparison of the N-station and 17-station failure rates for each campus is shown in Table 1. Using the per-station standard setting (sum of minima), average failure rates increased as the number of stations decreased; however, with the conservative, tie-inclusive two-sided Monte Carlo test and FDR adjustment, differences were not statistically significant at .05 for any campus.
ANOVA Subset Mean Scores
The difference in subset mean scores was significant for campus 1 (F(4,1290) = 9.046, p < 0.001) and campus 2 (F(4,960) = 11.53, p < 0.001), indicating that subset size had an impact on performance estimates. For Campus 3, this difference was not significant (F(4,145) = 0.463, p = 0.763).
Generalizability, Reliability, and Construct Validity
Each 6 to 17-station subset was examined for reliability, generalizability, and construct validity across all three campuses.
Reliability Analysis and Predictions of Decisions Study
Increasing the number of stations resulted in increased Cronbach’s alpha values for all three campuses (Figure 1). Reliability was the lowest at 6 stations, with a maximum of .61 on Campus 3 and a minimum of .32 on Campus 2. With a total of 17 stations, reliability was significantly higher, with alpha values of .76, .71, and .64 for Campuses 1, 2, and 3, respectively. A similar trend was observed using G-Theory coefficients (Figure 2). Coefficient values for the 6-station subset were .21, .18, and .42 for Campuses 1, 2, and 3, respectively. These values increased to .43, .36, and .70 for Campuses 1, 2, and 3, respectively, for the 17-station OSCE.
Construct Validity According to the Number of Stations and Correlation of Scores
Findings from the correlational analysis comparing performance of shorter OSCE subsets with the 17-station total for each campus are shown in Table 2, including mean values with 95% simulation intervals [2.5% 97.5%] for the 2,000 random subsets of each N. Mean correlation values indicate how closely the smaller number sets reflected the 17-station OSCE. A higher ICC mean (3,1) is indicative of better approximation with the 17-station total.
The Pearson correlation coefficients of station subsets with full scores from the 17- station OSCE were consistently high for all three campuses (Figure 3). All campuses had correlations greater than .79, even for the 6-station subset. The correlations approached 1.00 with the addition of stations, with all three campuses demonstrating perfect linear relationships with an increase in the number of stations.
The Pearson correlations between the subset scores and the total 17-station OSCE score increased with the number of stations. The r value increased from 0.80 to 1.00, 0.79 to 1.00, and 0.84 to 1.00 when the station number increased from 6 to 17 at campuses 1, 2, and 3, respectively.
4. Discussion
This study demonstrated an increase in the failure rate in a final MBBS OSCE examination as the number of stations decreased on all three campuses of The University of the West Indies. However, differences did not achieve statistical significance for any campus. Previous studies have shown that the failure rates and score variability are likely to increase as the number of OSCE stations decreases. This effect is likely exaggerated in smaller cohorts, in which measurement error and failing score cut-off variability increase.[12] In the current analysis, conservative statistical techniques may have reduced the power needed to detect significance.[13] This tendency for failure rates to increase in OSCE exams with smaller station numbers is an important consideration for the design of high-stakes clinical examinations, especially when resources are limited.
The results of this study are consistent with prior studies finding that reliability increases as the number of stations increases.[2,14] However, the revealing finding from this study was that only at 17 stations did Cronbach’s alpha exceed .70, and then only at two of three campuses. There was variability among campuses in terms of the magnitude of changes in Cronbach’s alpha associated with the number of OSCE stations, suggesting that differences in reliability among sites cannot be explained solely by station number. Moreover, although the number of total and subset stations and exam blueprint were equivalent for all campuses, there were differences in the reliability estimates among sites. This finding is consistent with previous studies demonstrating that OSCE reliability is influenced by multiple factors, including examiner effects, station discrimination, and local scoring practices, which can vary across examination sites despite common design specifications.[2,10,13,15] Increasing the number of stations alone is not sufficient to guarantee consistent reliability of the results across sites. Examiner training and station quality must also be considered. These factors may have contributed to the relatively high reliability observed on Campus 3 compared to Campuses 1 and 2.
For the current study, G-theory coefficient values were consistently lower than values of Cronbach’s alpha. This is a well-documented phenomenon in OSCE exams reflecting the influence of content specificity and error sources other than internal consistency.[14] These findings underscore the importance of adequate sampling of stations and sound scoring procedures to facilitate generalizability.[9]
The current findings are broadly consistent with existing evidence regarding the relationship of OSCE reliability with the number of stations. Meta-analytic data suggest that 5-10 stations of about 10 minutes each can provide Cronbach’s alpha values approaching .88.[2] Generalizability research indicates that it may take 20 to 30 stations to achieve a G threshold of .80.[10] This difference indicates that alpha and G-coefficients answer different psychometric questions. Alpha is suitable for estimating internal consistency, whereas G-theory is more suitable for estimating pass-fail reliability of OSCE examinations. Accordingly, the lower G-coefficients reported in this paper may be attributable to station sampling error that limits decision reliability but not instability in candidate performance. According to Chen et al. [16], reliability can be maintained with a smaller number of stations by using examiner variance management, which emphasizes the importance of rater training and standardized scoring.
Our analysis showed that the correlation varied with station numbers but remained high even for 8 stations (r coefficients usually .85-.90), such that even lower numbers of stations perform reasonably well in comparison to the 17-station standards, at least for larger cohorts (Campuses 1 & 2). All subsets demonstrated construct validity through near-perfect correlation to the 17-station benchmark. These results are consistent with the Messick validity framework for assessment in medical education,[17] which emphasizes the importance of multimodal assessment of construct validity, synthesizing evidence based on the content of the examination, response process, internal structure, relationship of exam scores to other variables, and consequences (outcomes). These correlations are indicative of internal construct coherence in the examination blueprint but must be viewed with a degree of caution, given that subset scores were based on the same parent OSCE and not based on external and independent measures of clinical competence.
A consistently high level of value in the correlations between observed and true scores at all campuses, even with very small numbers of stations, would indicate a high level of construct validity in all subsets. However, since subset data are embedded in the parent data, these correlations are not independent demonstrations of construct validity but indicators of consistency of scores. Rank-ordering (Spearman p) is a closer approximation of Pearson; thus, the rank of the candidates is mostly retained, even when the number of stations is fewer. ICC (3,1) decreases more rapidly since it considers agreement on the same scale; subset totals are lower in value, and ICC (3,1) considers them to be less in agreement even when a highly linear relationship exists. This is not surprising and is not a contradiction.
According to established frameworks such as unified validity[18] and Standards of Educational and Psychological Testing,[19] validity should be supported by a variety of evidence sources: content, response process, internal structure, relation to other variables, and consequences.[17,20] Even though the OSCE is a high-stakes and must-pass examination, students must also pass two years of clerkship exams prior to sitting the OSCE and must pass a written test simultaneously. In this sequential assessment design, although reduced OSCE reliability can increase the likelihood of classification error, it does not do so independently, which reduces the risk of lower OSCE reliability in the context of high construct coverage.
Blueprinting minimizes irrelevant variance and underrepresentation by connecting learning goals to station content and formatting, enhancing content validity and reliability.[21,22] Homer and Russell[23] warn that a small number of OSCE stations can jeopardize this compensation and, therefore, exam results. Exams with reduced numbers of stations should be supported with intensive blueprinting and calibration of examiners.[22,23] Conversely, conjunctive standards (e.g., minimum number of stations passed) could avoid compensation effects but add more statistical complexity.[23] The design of OSCE is complicated further by contextual constraints in resource-limited environments, such as the Caribbean, Latin America, and Africa.[12] A 2025 scoping review emphasized challenges related to standardization, SP training, and validation processes in settings with limited institutional capacity.[24] Similarly, Abdelaziz et al.[25] reported successful implementation of multidisciplinary OSCEs in Egypt using resource-saving strategies that achieved somewhat satisfactory psychometric performance (α ≈ .60). These findings support our recommendation for a minimum of 10–12 stations for Final MBBS OSCEs under Caribbean constraints, supplemented by rigorous blueprinting and examiner calibration.[26]
Limitations
Some study limitations limit generalizability of findings. First, the data are limited to one (June 2019) Final MBBS OSCE on three UWI campuses with uneven cohort sizes (Campus 1 - 260, Campus 2 - 194, Campus 3 - 31). These testing contexts may not be generalizable to others. Further, the small sample size for Campus 3 may adversely affect the stability of estimates. Shorter exams were simulated by setting up 6, 8, 10, and 12 station subsets of the original 17 stations but not by using separate shorter OSCEs. Further, unequal time durations (7 minutes for most stations but 15 for pediatric history and 23 for adult history) may affect comparisons. The application of G-theory modeled only persons vs stations but omitted examiner, circuit/day, and standardized patient facets, even for multi-day testing settings with 17 examiners, which could be additional sources of error and influence D-study projections. ANOVA was used to compare means of subsets without explicitly considering repeated measures on the same candidates, which may lead to non-independence.
5. Conclusions
In this multicampus study modelling Final MBBS OSCE performance, reliability improved with station count but remained below the .80 threshold even with the maximum (17) number of stations. Construct validity was strong in all subsets, and the difference in failure rate between reduced and full station formats was not statistically significant using conservative Monte Carlo testing with FDR correction. Taken together, these findings suggest that 10-12 stations can maintain score consistency in comparison to the full 17-station OSCE, but the reduced-station scenario does not provide sufficient decision reliability for high-stakes pass/fail examinations without implementation of further quality control measures. Thus, adding more stations is not as important as enhancing examiner training, station quality, standardization, and rater calibration, which appear to have contributed to cross-campus variations in psychometric performance. In line with current approaches differentiating internal consistency and decision dependability, G theory suggests in this context that improvements in feasibility may be better achieved by increasing station sampling and reducing rater procedures, instead of reducing the number of stations. Therefore, we recommend implementing OSCEs of 12 or more stations where possible, combined with systematic examiner calibration and blueprint-based station optimization to enhance exam quality and feasibility in resource-constrained environments.
Author Contributions
Conceptualization, AK, MHC, MAAM, and KK; methodology, AK, MHC, MAAM, ME, KC and KK; formal analysis, AK, MHC, MAAM, JPC, BS and SM; data curation, AK, MHC, MAAM, EM, BS and MF; writing—original draft preparation, AK, MHC, MAAM, KK, KC, SM and MF; writing—review and editing, AK, MHC, MAAM, KK, SM, MF, EM, KC, ME, BS and JPC; supervision, AK, MHC, MAAM, KC and KK; project administration, AK, MHC, MAAM, EM, ME, BS, and JPC. All authors have read and agreed to the published version of the manuscript.
Funding
This research received no external funding.
Institutional Review Board Statement
The study was conducted in accordance with the Declaration of Helsinki and approved by the UWI/Ministry of Health and Wellness Ethics Committee (IRB No. 200707-B).
Informed Consent Statement
Given the retrospective and observational nature of the study, which involves analysis of de-identified past examination data, the ethics committee waived the requirement for informed consent.
Data Availability Statement
The data supporting the findings of this study are available from the corresponding author upon reasonable request. Access is restricted due to the sensitive nature of the data.
Acknowledgments
We are grateful to Professor SmaIl Mahdi (Retired) for his assistance with the data analysis
Conflicts of Interest
Dr. Md Anwarul Azim Majumder serves on the Editorial Board of IME. The remaining authors declare no conflicts of interest related to this work.
Abbreviations
The following abbreviations are used in this manuscript:
| OSCE | Objective Structured Clinical Examination (OSCE) |
| MBBS | Bachelor of Medicine and Bachelor of Surgery |
| CTT | Classical Test Theory |
| UWI | The University of the West Indies |
| ICC | Intraclass Correlation Coefficient |
References
- Majumder, M.A.A.; Kumar, A.; Krishnamurthy, K.; Ojeh, N.; Adams, O.P.; Sa, B. An evaluative study of objective structured clinical examination (OSCE): students and examiners perspectives. Adv. Med. Educ. Pract. (In eng) 2019, 10, 387–397. [Google Scholar] [CrossRef] [PubMed]
- Peng, Q.; Luo, J.; Wang, C.; Chen, L.; Tan, S. Impact of station number and duration time per station on the reliability of Objective Structured Clinical Examination (OSCE) scores: a systematic review and meta-analysis. BMC Med. Educ. (In eng) 2025, 25(1), 84. [Google Scholar] [CrossRef] [PubMed]
- Elshama, S. How to Design and Apply an Objective Structured Clinical Examination (OSCE) in Medical Education? Iberoam. J. Med. 2020, 3, 51–55. [Google Scholar] [CrossRef]
- Bhanji, F.; Naik, V.; Skoll, A.; et al. Competence by Design: The Role of High-Stakes Examinations in a Competence Based Medical Education System. Perspect. Med. Educ. (In eng) 2024, 13(1), 68–74. [Google Scholar] [CrossRef] [PubMed]
- Shafiayan, M.; Kordestani Moghaddam, A. Station Numbers and Duration: Factors Affecting the Validity of OSCE - A Review Article. J. Med. Educ. 2024, 23. [Google Scholar] [CrossRef]
- Barman, A. Critiques on the Objective Structured Clinical Examination. Ann. Acad. Med. Singap. (In eng) 2005, 34(8), 478–82. [Google Scholar] [CrossRef] [PubMed]
- Brannick, M.T.; Erol-Korkmaz, H.T.; Prewett, M. A systematic review of the reliability of objective structured clinical examination scores. Med. Educ. (In eng) 2011, 45(12), 1181–9. [Google Scholar] [CrossRef] [PubMed]
- Cronbach, L.J.; Rajaratnam, N.; Gleser, G.C. THEORY OF GENERALIZABILITY: A LIBERALIZATION OF RELIABILITY THEORY. Br. J. Stat. Psychol. 1963, 16(2), 137–163. [Google Scholar] [CrossRef]
- Peeters, M.J.; Cor, M.K.; Petite, S.E.; Schroeder, M.N. Validation Evidence using Generalizability Theory for an Objective Structured Clinical Examination. Innov. Pharm. (In eng) 2021, 12(1). [Google Scholar] [CrossRef] [PubMed]
- Gruppen, L.D.; Davis, W.K.; Fitzgerald, J.T.; McQuillan, M.A. Reliability, Number of Stations, and Examination Length in an Objective Structured Clinical Examination. In Advances in Medical Education; Scherpbier, A.J.J.A., van der Vleuten, C.P.M., Rethans, J.J., van der Steeg, A.F.W., Eds.; Springer Netherlands: Dordrecht, 1997; pp. 441–442. [Google Scholar]
- Huebner, A.; Lucht, M. Generalizability Theory in R. Pract. Assess. Res. Eval. 2019, 24(5), n5. [Google Scholar]
- Homer, M. Setting defensible minimum-stations-passed standards in OSCE-type assessments. Med. Teach. (In eng) 2023, 45(10), 1163–1169. [Google Scholar] [CrossRef] [PubMed]
- Van Der Vleuten, C.P. The assessment of professional competence: Developments, research and practical implications. Adv. Health Sci. Educ. Theory Pract. (In eng) 1996, 1(1), 41–67. [Google Scholar] [CrossRef] [PubMed]
- Monteiro, S.; Sullivan, G.M.; Chan, T.M. Generalizability Theory Made Simple(r): An Introductory Primer to G-Studies. J. Grad. Med. Educ. (In eng) 2019, 11(4), 365–370. [Google Scholar] [CrossRef] [PubMed]
- Schleicher, I.; Leitner, K.; Juenger, J.; et al. Examiner effect on the objective structured clinical exam - a study at five medical schools. BMC Med. Educ. (In eng) 2017, 17(1), 71. [Google Scholar] [CrossRef] [PubMed]
- Chen, T.C.; Lin, M.C.; Chiang, Y.C.; Monrouxe, L.; Chien, S.J. Remote and onsite scoring of OSCEs using generalisability theory: A three-year cohort study. Med. Teach. (In eng) 2019, 41(5), 578–583. [Google Scholar] [CrossRef] [PubMed]
- Downing, S.M. Validity: on meaningful interpretation of assessment data. Med. Educ. (In eng) 2003, 37(9), 830–7. [Google Scholar] [CrossRef] [PubMed]
- Messick, S. VALIDITY OF PSYCHOLOGICAL ASSESSMENT: VALIDATION OF INFERENCES FROM PERSONS' RESPONSES AND PERFORMANCES AS SCIENTIFIC INQUIRY INTO SCORE MEANING. ETS Res. Rep. Ser. 1994, 1994(2), i–28. [Google Scholar] [CrossRef]
- American Educational Research Association APA; National Council on Measurement in Education. Standards for educational and psychological testing; American Educational Research Association: Washington, D.C., 2014. [Google Scholar]
- Hamstra, S.J.; Yamazaki, K. A Validity Framework for Effective Analysis and Interpretation of Milestones Data. J. Grad. Med. Educ. (In eng) 2021, 13((2) Suppl, 75–80. [Google Scholar] [CrossRef] [PubMed]
- Abdellatif, H.; Alsemeh, A.E.; Khamis, T.; Boulassel, M.-R. Exam blueprinting as a tool to overcome principal validity threats: A scoping review. Educ. Médica 2024, 25(3), 100906. [Google Scholar] [CrossRef]
- Subhiyah, R.G.; Clauser, A.L.; Martin, D.F. Rapid Blueprinting: An Efficient Method for Designing Content of Assessments. Med. Sci. Educ. (In eng) 2024, 34(2), 471–475. [Google Scholar] [CrossRef] [PubMed]
- Homer, M.; Russell, J. Conjunctive standards in OSCEs: The why and the how of number of stations passed criteria. Med. Teach. (In eng) 2021, 43(4), 448–455. [Google Scholar] [CrossRef] [PubMed]
- Armijo-Rivera, S.; Fuenzalida-Muñoz, B.; Vicencio-Clarke, S.; et al. Advancing the assessment of clinical competence in Latin America: a scoping review of OSCE implementation and challenges in resource-limited settings. BMC Med. Educ. (In eng) 2025, 25(1), 587. [Google Scholar] [CrossRef] [PubMed]
- Abdelaziz, A.; Hany, M.; Atwa, H.; Talaat, W.; Hosny, S. Development, implementation, and evaluation of an integrated multidisciplinary Objective Structured Clinical Examination (OSCE) in primary health care settings within limited resources. Med. Teach. (In eng) 2016, 38(3), 272–9. [Google Scholar] [CrossRef] [PubMed]
- O'Malley, A.; Fitzgerald, N.; Moylett, E.; et al. A comparison of objective structured clinical examinations (OSCEs) for medical students, modified during the COVID-19 pandemic. Ir. J. Med. Sci. (In eng) 2025, 194(4), 1533–1542. [Google Scholar] [CrossRef] [PubMed]
Figure 1.
Cronbach’s Alpha value for 6, 8, 10, 12 and 17 stations across Campuses.
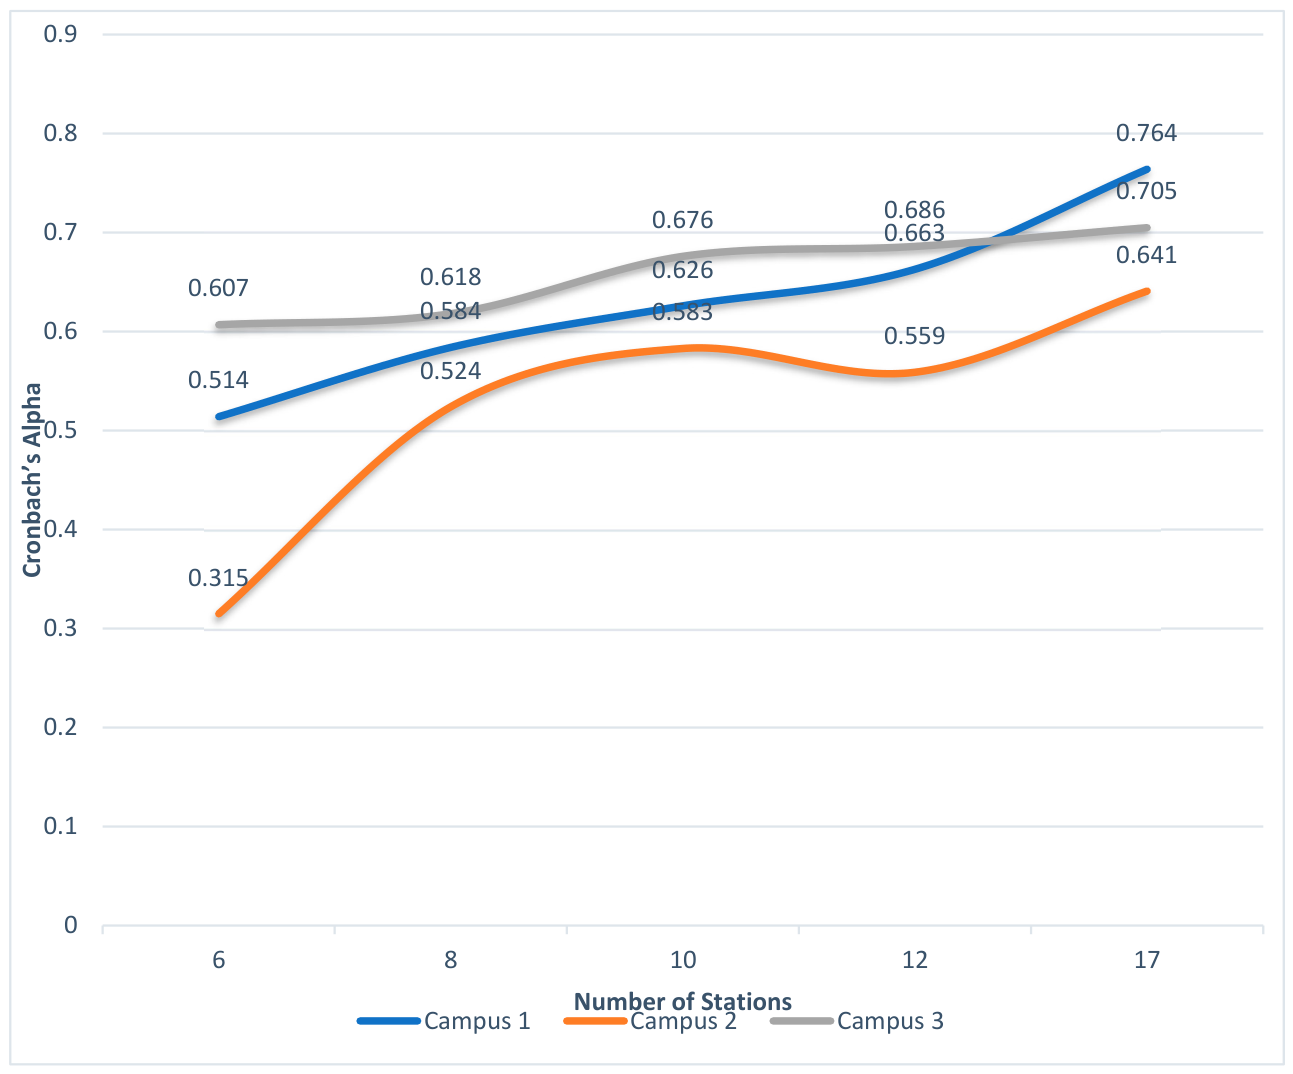
Figure 2.
G-Theory Coefficient at 6, 8, 10, 12 and 17 stations across Campuses.
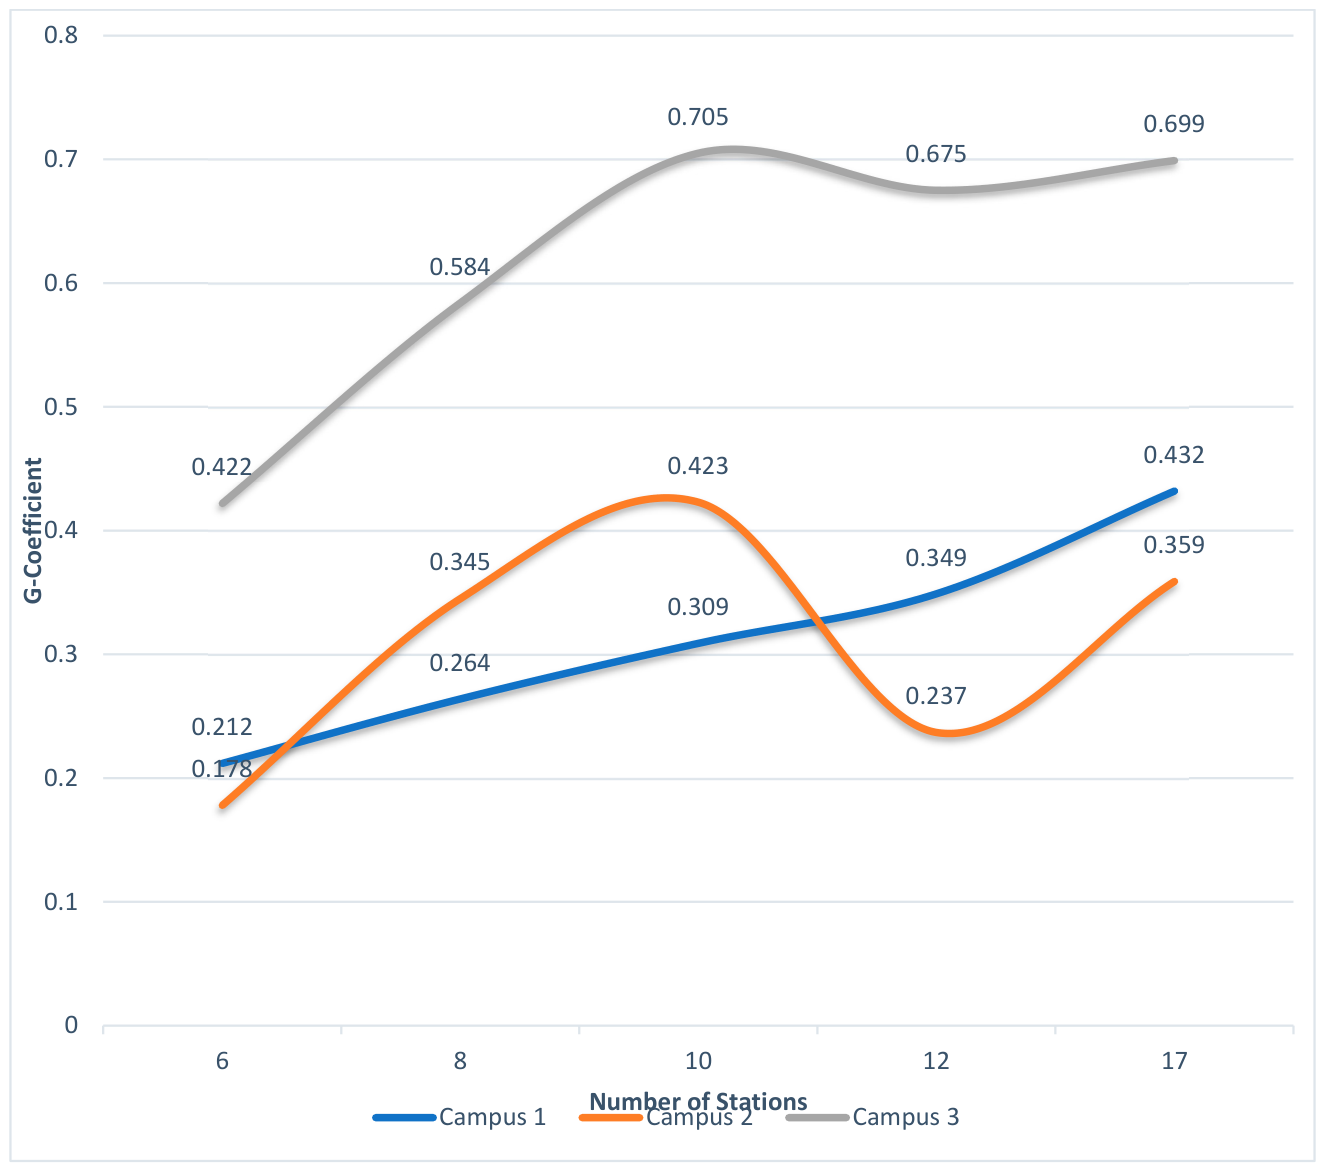
Figure 3.
Pearson r plot for 6, 8, 10 and 12 stations vs 17 stations.
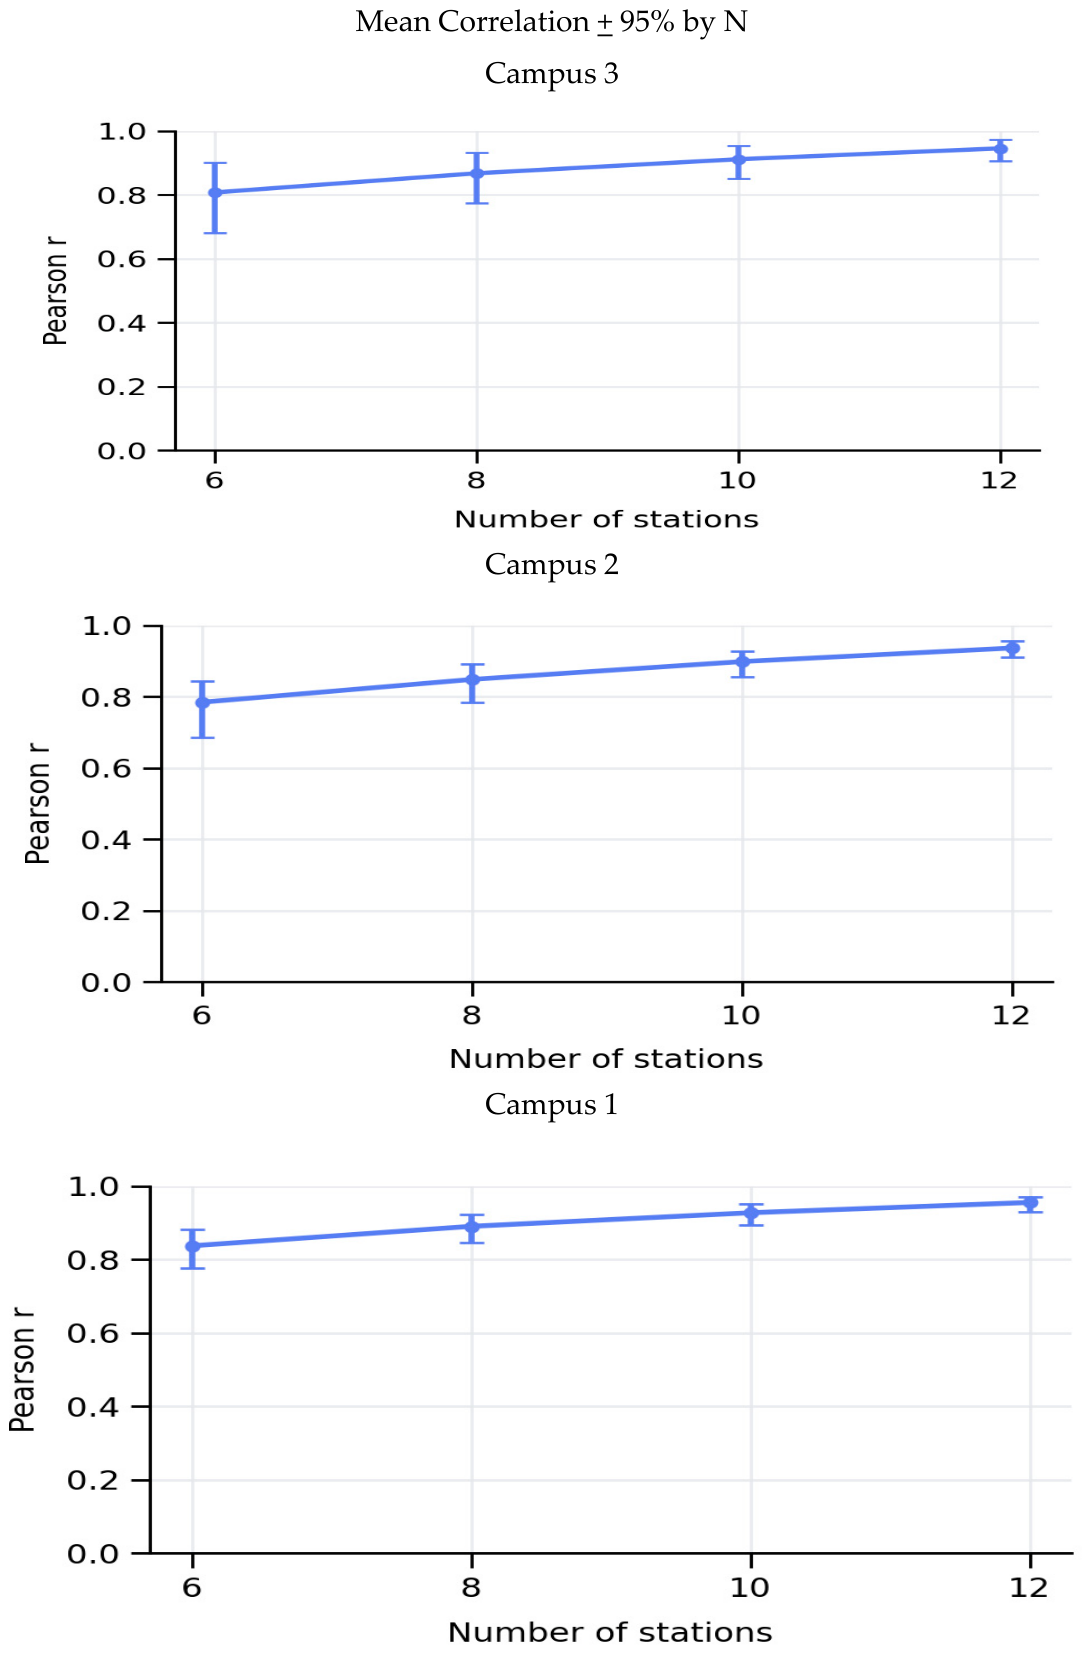

Table 1.
Campus-wise comparison of N-station vs 17-station failure rates.
| Campus | N stations | Mean fail % | Diff (pp) vs 17 | 95% CI for Diff (pp) | p (MC) | q (BH-FDR) |
| 1 | 12 | 5.33 | 1.48 | −0.77 to +4.23 | 0.305 | 0.749 |
| 10 | 5.95 | 2.1 | −0.77 to +6.15 | 0.29 | 0.749 | |
| 8 | 6.76 | 2.91 | −1.15 to +8.08 | 0.24 | 0.749 | |
| 6 | 8.06 | 4.21 | −1.15 to +11.54 | 0.204 | 0.749 | |
| 2 | 12 | 3.35 | 0.26 | −1.55 to +2.58 | 1 | 1 |
| 10 | 3.74 | 0.64 | −1.55 to +3.61 | 0.838 | 0.958 | |
| 8 | 4.49 | 1.39 | −1.55 to +5.67 | 0.603 | 0.898 | |
| 6 | 5.74 | 2.65 | −1.55 to +9.79 | 0.404 | 0.808 | |
| 3 | 12 | 3.1 | 3.1 | 0.00 to +12.90 | 0.878 | 0.958 |
| 10 | 4.7 | 4.7 | 0.00 to +16.13 | 0.673 | 0.898 | |
| 8 | 6.56 | 6.56 | 0.00 to +19.35 | 0.483 | 0.828 | |
| 6 | 9.04 | 9.04 | 0.00 to +25.81 | 0.312 | 0.749 |
Diff (pp) = (N-station mean failure rate) – (17-station failure rate) in percentage points. 95% CI for Diff = Monte-Carlo percentile interval across 5,000 random station subsets. p (MC) = Two-sided Monte Carlo p value (tie inclusive). q (BHFDR) = p value after Benjamini–Hochberg correction across all 12 tests.
Table 2.
A campus-by-campus correlation analysis evaluating the performance of shorter OSCEs (12, 10, 8, and 6 stations) relative to each campus’s observed 17-station total.
Table 2.
A campus-by-campus correlation analysis evaluating the performance of shorter OSCEs (12, 10, 8, and 6 stations) relative to each campus’s observed 17-station total.
| CAMPUS | Stations | Pearson r (mean [95%]) | Spearman ρ (mean [95%]) | ICC (3,1) (mean [95%]) |
| 1 | 12 | 0.955 [0.930, 0.970] | 0.946 [0.909, 0.967] | 0.912 [0.864, 0.945] |
| 10 | 0.927 [0.893, 0.950] | 0.913 [0.866, 0.945] | 0.837 [0.771, 0.888] | |
| 8 | 0.890 [0.845, 0.923] | 0.872 [0.810, 0.918] | 0.734 [0.648, 0.811] | |
| 6 | 0.837 [0.776, 0.882] | 0.813 [0.731, 0.875] | 0.597 [0.498, 0.687] | |
| 2 | 12 | 0.936 [0.911, 0.956] | 0.917 [0.888, 0.943] | 0.899 [0.858, 0.933] |
| 10 | 0.898 [0.856, 0.928] | 0.872 [0.829, 0.907] | 0.822 [0.757, 0.875] | |
| 8 | 0.848 [0.783, 0.892] | 0.815 [0.752, 0.863] | 0.717 [0.630, 0.792] | |
| 6 | 0.784 [0.686, 0.843] | 0.745 [0.651, 0.806] | 0.587 [0.476, 0.681] | |
| 3 | 12 | 0.945 [0.905, 0.972] | 0.930 [0.883, 0.965] | 0.904 [0.858, 0.941] |
| 10 | 0.911 [0.850, 0.954] | 0.896 [0.824, 0.950] | 0.827 [0.754, 0.891] | |
| 8 | 0.867 [0.775, 0.932] | 0.851 [0.744, 0.927] | 0.724 [0.623, 0.811] | |
| 6 | 0.807 [0.680, 0.900] | 0.791 [0.646, 0.906] | 0.591 [0.473, 0.706] |
Disclaimer/Publisher’s Note: The statements, opinions and data contained in all publications are solely those of the individual author(s) and contributor(s) and not of MDPI and/or the editor(s). MDPI and/or the editor(s) disclaim responsibility for any injury to people or property resulting from any ideas, methods, instructions or products referred to in the content. |
© 2026 by the authors. Licensee MDPI, Basel, Switzerland. This article is an open access article distributed under the terms and conditions of the Creative Commons Attribution (CC BY) license.
Copyright: This open access article is published under a Creative Commons CC BY 4.0 license, which permit the free download, distribution, and reuse, provided that the author and preprint are cited in any reuse.