

Submitted:
03 July 2026
Posted:
06 July 2026
You are already at the latest version
Abstract
Process mining relies on event logs extracted from information systems. Manual work on the factory shop floor leaves few digital traces and therefore remains largely outside its reach. Egocentric video, recorded by head-mounted cameras, captures this work in detail, but raw footage is not event data. This paper presents a fully automated pipeline that derives standard event logs from egocentric factory videos using foundation models. The pipeline transcribes each video into a timestamped textual narration, induces a controlled vocabulary of processes and activities for each factory, and converts every transcription into a sequence of events constrained to this vocabulary. Applied to six factories of the Egocentric-10K corpus, it produces event logs covering more than one hundred hours of manual work without task-specific training or human annotation. We evaluate the resulting logs in two steps. A validity assessment confirms that the extracted events are structurally sound and faithful to the transcribed footage. An analysis-oriented assessment then investigates which questions the logs can answer in practice: how worker time is distributed over value-adding work, material handling, transport, and rework; how often value-adding work is interrupted; and how workers performing the same task compare. In several cases, the logs surface improvement opportunities that qualitative reporting missed, while also revealing that the induced vocabulary determines what can and cannot be measured. Pipeline, prompts, and all derived artifacts are publicly available.
Keywords:
process mining
; event log extraction
; egocentric video
; large language models
; manufacturing
1. Introduction
Process mining derives knowledge about operational processes from event logs: timestamped, labeled events grouped into cases [1]. The discipline rests on the implicit assumption that the process leaves digital traces in an information system from which such a log can be extracted. This assumption breaks down where a large share of value creation still happens: on the manual shop floor. In labor-intensive manufacturing, the operationally decisive behavior consists of physical actions, such as picking a part from a bin, loading a blank into a die, inspecting a seam, or carrying a container across the hall, that no system records. At best, an MES logs order- or machine-level checkpoints, leaving the actual work (its sequence, duration, interruptions, and material-handling overhead) invisible: the blind spots of process mining [2].
A complementary data source has recently become available at scale: egocentric video. Head-mounted cameras record the shop floor from the worker’s perspective, capturing hand-object interactions, machine operation, and movement at a level of detail that neither fixed cameras nor enterprise systems can match. The Egocentric-10K corpus1 exemplifies this development: thousands of hours of first-person factory footage from more than two thousand workers in real facilities (Figure 1). The problem is the transformation gap: raw egocentric video is not event data. An event log requires discretized events with vocabulary-consistent activity labels, timestamps, and case identifiers; producing these manually costs many annotator-hours per hour of footage.
Three research streams approach this gap without closing it (Section 2): video-based process mining relies on fixed cameras and per-setting computer-vision models; sensor-based process mining lifts signals that carry far less semantic content than video; and LLM-assisted log extraction converts unstructured text into event logs but has not been connected to video, where segmentation, timestamp estimation, and vocabulary control dominate the problem.
We close this gap with a fully automated five-stage pipeline that turns egocentric factory video into standard event logs using foundation models as its only extraction machinery. Applied to six factories of Egocentric-10K, the pipeline produces 322 per-video event logs with 10,698 events from 59 workers. We position these logs as inferred observational data, not ground truth. Three research questions are addressed. RQ1 (Feasibility and validity): can a foundation-model pipeline, without task-specific training or human annotation, produce event logs satisfying the structural requirements of process mining at the scale of hundreds of videos? RQ2 (Fidelity): how faithfully do the generated events reflect the observed work, temporally and semantically? RQ3 (Value): which operational analyses and optimization insights do the logs enable for an end user, and where do they hit the limits of the data? Our contributions are (i) the pipeline and its design rationale, (ii) a publicly released derived dataset for six real factories,2 (iii) a two-step assessment covering both the validity of the logs and the operational analyses they support, and (iv) a characterization of failure modes and non-capabilities.
2. Related Work
Event log construction and data quality. Deriving event logs is a methodological, quality-sensitive process rather than a technical export step: event-data preparation decomposes into extraction, correlation, and abstraction [3], and the case notion is itself a modeling decision. Inferred logs may carry the classical imperfections (imprecise timestamps, ambiguous boundaries, missing events), which motivates our validity preconditions.
Process mining on video data. A dedicated research line turns video into event data. Knoch et al. [4] pioneered the extraction of traces from fixed-camera recordings of a manual assembly workstation, without labeled training data, and used them for process discovery and conformance checking. Kratsch et al. [2] generalize such individual solutions into a reference architecture for video-enabled process mining that chains video preprocessing, computer-vision activity recognition, and event abstraction into log generation, explicitly motivating video as the remedy for the blind spots of system-recorded event data. Lepsien et al. [5] instantiate an analytics pipeline for process mining on video and decompose it into preprocessing, activity recognition, and event correlation stages. Most recently, SnapLog [6] discovers events from video streams via image embeddings, similarity-based temporal segmentation, and few-shot classification, trading trained activity classifiers for a small set of labeled example frames per activity. Sensor-based process mining [7] complements this line with abstraction techniques for lower-semantic signals.
Our work differs from video-based process mining along four dimensions. Viewpoint: prior approaches observe a single workstation through a fixed, exocentric camera, so the analysis ends at the camera’s field of view; egocentric video follows the worker across stations and hallways and captures the hand-object detail in which material handling, transport, and interruptions become visible. Training effort: existing pipelines require setting-specific vision models or labeled example frames per activity; our pipeline uses general-purpose foundation models with no annotation or training at all, which is what makes processing six factories and hundreds of videos feasible. Label semantics: vision-based activity recognition assigns labels from a predefined class set, whereas we induce a natural-language vocabulary of verb-object activities from the corpus itself, so the label set adapts to each factory and stays human-readable. Evaluation: prior work measures extraction accuracy on a single station; we additionally assess which analyses the resulting logs support and where they fail.
LLM-assisted process mining. LLMs have been benchmarked on process mining tasks [8]; upstream, they extract event logs from textual sources [9]. We extend this stream to video as the originating modality, with two additions the video setting makes essential: transcript-anchored timestamp estimation and closed controlled vocabularies that suppress label drift across hundreds of extractions.
3. Approach
The pipeline (Figure 2) transforms raw video into event logs through five automated stages. Two design principles govern it. Late abstraction: the video is first verbalized without any process mining schema; activity labels are introduced only after a factory-wide vocabulary exists [3]. Closed-world labeling: event extraction may only use labels from the factory vocabularies, which suppress hallucination and harmonize granularity across videos and workers. No model is fine-tuned and no human annotation enters the pipeline; all prompts are released.
3.1. Source Data
The input is Egocentric-10K. We processed six factories covering heterogeneous labor-intensive domains, totaling 59 workers and 322 clips; Table 1 characterizes the type of manual work performed in each. Clips are typically around 20 minutes; a few recordings span multiple hours.
| Please transcribe the attached egocentric video into a very detailed chronological text description. [...] Format every entry as: [HH:MM:SS - HH:MM:SS] description [...] Only create a new entry when something meaningful changes, such as: the action changes / a new object is handled / the person changes location [...] If a repeated behavior continues in exactly the same way, summarize that repeated stretch once with an appropriate timestamp range. [...] If the scene is partially unclear, mention the uncertainty briefly instead of guessing. Do not use tables, bullets, JSON, labels, categories, or analysis language. |
| Listing 1: Extract of the S1 video transcription prompt. |
| You are given multiple detailed chronological transcriptions from egocentric factory videos recorded by the same worker. Your task is to synthesize those transcriptions into a process- focused report [...] Only suggest process optimizations that are visible or reasonably inferable from the observed workflow. [...] Do not suggest worker-level optimizations such as "work faster" [...] Write the output in plain text with exactly these section headings: Process Summary / Detailed Process Breakdown / Possible Process Optimizations / Evidence Limits |
| Listing 2: Extract of the S2 worker summarization prompt. |
3.2. S1: Change-Point Transcription
Each video is uploaded to a multimodal foundation model (Gemini 3.1 Pro) with a prompt requesting a chronological narration of timestamped entries. Three requirements matter downstream. Change-point segmentation: a new entry is opened only when the action, handled object, location, attention focus, or social context changes; stable repetition is merged into one long interval, so transcript boundaries approximate behavioral change points, which S4 reuses as candidate event boundaries. Descriptive neutrality: labels, categories, and analysis language are forbidden, so no ad-hoc activity schema is imposed prematurely. Marked uncertainty: unclear scenes (blur, occlusion) must be flagged rather than guessed. Listing shows the central instructions. S1 produced 13,304 timestamped entries for the 322 videos.
3.3. S2 and S3: Summaries and Vocabularies
S2 synthesizes each worker’s transcriptions into a process-focused report (process summary, detailed breakdown, optimization opportunities, evidence limits); optimization remarks are restricted to process design, excluding judgments of individual performance. S3 aggregates the worker reports of a factory into a factory report whose two key sections form the controlled vocabularies: a deduplicated list of coarse process labels (12 to 24 per factory, e.g., metal stamping, material replenishment) and a rich catalogue of fine-grained activity labels (55 to 131 per factory), each a verb-object phrase such as load raw metal blank into die. The prompt demands coverage of non-value-adding behavior (transport, staging, waiting, setup, cleanup, inspection, handoffs) and prohibits near-duplicates; Listings and show the central instructions of both stages. The two-level structure (process ⊃ activity) later provides two analysis granularities from the same log.
| Produce a long, detailed, process-mining-oriented activity catalogue for the factory [...] Each activity must be a short string only, suitable as a candidate event label for process mining. Prefer specific verb-object phrases such as "load raw blank into press" rather than generic labels such as "operate machine". Include not only value-adding operations, but also transport, staging, waiting, inspection, rework-like handling, setup, cleanup, handoff, documentation, and, coordination activities when visible. [...] |
| Listing 3: Extract of the S3 vocabulary induction prompt. |
| You are converting one timestamped raw factory annotation into a structured event list for process mining. [...] The value of `activity` must be exactly one label from the allowed factory activity list. The value of `process` must be exactly one label from the allowed factory process list. Do not invent new activity labels. [...] If multiple labels are plausible, choose the closest allowed label. [...] Each array item must be an object with exactly these keys: `estimated_start_time`, `estimated_end_time`, `activity`, `process` [...] Include only process-relevant operational events. [...] If no valid operational events can be extracted, return {"events":[]}. |
| Listing 4: Extract of the S4 constrained event extraction prompt. |
3.4. S4: Constrained Event Extraction
A text-only LLM (GPT-5.4) converts each transcription, independently per video and in parallel, into a JSON list of events with exactly four fields: estimated start and end time, activity, and process. The contract: (i) closed vocabularies: both labels must be exactly one of the allowed labels; (ii) transcript-anchored timing: transcript timestamps are the primary basis for boundaries; an interval holding one stable activity becomes one event, a composite interval may be split; (iii) operational-relevance filter: non-work segments are omitted, and an empty list is admissible; (iv) strict output discipline: JSON only, validated against schema and vocabularies at parse time. Listing shows the central instructions. For example, the entry “[00:04:05 – 00:04:36] A new empty frame is placed on the pattern plate. Powder is poured in ... picks up a flat wooden tool and aggressively scrapes it across the surface” yields, among others, the event (00:04:24, 00:04:36, level powder surface with wooden scraper, Sand mold creation).
3.5. S5: Log Consolidation
Per-video CSVs (start/end timestamp, activity, process, factory, worker) are merged into worker- and factory-level logs: clips of one worker are concatenated in recording order, shifting relative timestamps by the cumulative end of preceding clips onto a synthetic axis anchored at 2000-01-01 (videos carry no wall-clock metadata; durations and orderings are meaningful, calendar dates are not). Merged events carry provenance (source_file), case_id, offsets from video start, and durations. The artifacts support several case notions without re-extraction (video-as-case, used in our assessment, worker-as-case, and process-phase segmentation), since the case notion is a modeling decision, not a property of the data.
3.6. Design Rationale
Text as the intermediate representation decouples the expensive per-video vision step from the factory-global vocabulary: transcripts are created once, are human-auditable, and serve as extraction source, evidence base for vocabulary induction, and reference for the assessment; they are the pipeline’s provenance layer. Vocabularies are factory-scoped because manual work is domain-specific, while coarse process labels retain cross-factory comparability.
4. Assessment
The pipeline produces logs by inference, so their validity must be checked; but validity is only a precondition, not the point. The decisive question is whether the logs deliver analytical value: do they let an analyst answer questions that no enterprise system can answer, with operational consequences? The assessment is therefore structured around three questions. Q1 (Preconditions): are the logs trustworthy enough to base conclusions on? Q2 (Analysis capability): which classes of process mining analysis do the logs support, and what do they reveal in the six factories? Q3 (Optimization evidence): do the logs produce concrete, prioritizable optimization findings beyond the qualitative reports the pipeline itself generates? All computations use pm4py [10] on the released artifacts only and are reproducible from the published assessment code.
4.1. Q1: Validity Preconditions
Table 2 reports the validity checks per factory; details and scripts are released with the artifacts. Structure and vocabulary: all 10,698 events are schema-complete, chronologically ordered, and conform 100% to the factory vocabularies, with 89 to 97% of catalogue activities actually used. Temporal fidelity: median event coverage is about 95% for the 314 recordings up to one hour; on the seven multi-hour recordings the extraction stage truncates (median coverage 1.2%), so those are excluded from all time statistics below. Event boundaries coincide with transcribed change points in 82% of cases (±5 s). Semantic fidelity: a stratified manual audit (42 events and 42 transcript entries, judged by one author) yields strict event precision 0.86 with zero contradicted labels, and operational recall of about 0.89. Finding F1: within the dominant length regime the logs are a faithful, conservatively extracted account of observed work; the analyses below inherit at most this quantified uncertainty.
4.2. Q2: Analysis Capability
We execute four analysis classes covering the main promises of process mining for manual work: performance analysis (A1), operational diagnostics (A2), control-flow analysis (A3), and resource comparison (A4). For A1 and A2, each of the 112 process labels is mapped to one of seven operational categories: value-adding transformation (VA), material handling and staging (MH), transport (TR), quality inspection (QI), cleaning and maintenance (CM), rework (RW), and documentation (DOC). The mapping is released with the code; its role is that of an activity-based-costing scheme in industrial engineering.
4.2.1. A1: Work-Time Composition
Table 3 (left) shows where event-covered worker time goes: a quantified, comparable account of manual work that exists in no information system. The non-value-adding share varies by a factor of seven across factories (3.7% to 25.8%), immediately ranking where improvement effort should go: the foundry (006) loses one quarter of observed time to handling, transport, and cleaning. Factory 003 spends 10.8% of observed time on rework (Defect patching: workers fill and patch surface defects on castings), a finding with direct economic meaning that points upstream to casting quality. The machining factory (005) shows the highest transport share (9.7%): machinists act as their own logistics and quality staff. Finding F2: the logs quantify where manual work time goes, including a rework share that no qualitative report mentioned.
4.2.2. A2: Fragmentation of Value-Adding Work
Time shares understate the damage of interruptions: thirty 15-second replenishment breaks are operationally worse than one 7.5-minute one. Collapsing consecutive same-category events into runs per worker, Table 3 (right) reports how often value-adding work is interrupted and how long it runs uninterrupted. Combining both views separates two problem profiles that demand different interventions. Factory 001 loses little total time (6.9% non-VA) but is interrupted 9.2 times per hour by short episodes (mean 15 s): the problem is material presentation at the workstation, not travel distance. Factory 006 combines the highest frequency (14.4 interruptions/hour; 28.4 MH/TR episodes per observed hour) with the highest loss (19.8% of time in MH/TR), and value-adding work never runs longer than about three minutes: a layout and logistics problem. Finding F3: interruption profiles distinguish presentation from logistics problems, a diagnosis a lean consultant derives from days of stopwatch observation, here obtained from data recorded anyway.
4.2.3. A3: Flow Visibility
Discovery at the raw activity level (Inductive Miner [11], noise 0.2, video-as-case) yields high-fitness, low-precision models (token-based replay fitness 0.95 to 0.99, precision 0.06 to 0.27) with nearly all traces unique: workers interleave handling and cleaning with value-adding cycles at self-chosen points, a property of flexible manual work, not noise. Activity-level logs therefore support local pattern analysis (4 to 17% of directly-follows pairs are self-loops) and drill-down rather than readable end-to-end models. Collapsing to the process level of the two-level vocabulary (12 to 24 phase labels, 2 to 26 segments per trace) lifts precision up to 0.59 at fitness above 0.96 (factory 001; 0.069 at activity level): discover at phase level, quantify at activity level.
4.2.4. A4: Worker Benchmarking
Because the vocabulary is shared within a factory, workers performing the same dominant process are directly comparable (Table 4). The spreads are the finding: five surface-finishing workers in 003 range from 67% to 97% VA share, and the two ironing workers in 004 differ by 24 points. Such gaps localize either best practices worth standardizing or hidden structural differences between nominally identical stations. Conversely, the two lathe machinists in 005 are within one point of each other: station design, not behavior, drives that factory’s 19.4% non-VA share. A Pareto view sharpens targeting: the top three value-adding activities absorb 27% to 62% of VA time per factory, so tooling or automation investments can be evaluated against quantified time bases. Finding F4: phase-level discovery plus shared vocabularies turn the logs into a benchmarking instrument that localizes efficiency spreads of up to 30 points on identical tasks.
4.3. Q3: Optimization Evidence by Triangulation
The pipeline independently produces qualitative optimization observations (the S3 factory reports, generated without any event log). Confronting those claims with the log-derived numbers tests whether the logs add value beyond narrative reporting (Table 5). The three relations are the value proposition of event logs over narrative reports: quantification enables prioritization (006 first), refinement changes the intervention (presentation aids rather than dedicated handlers in 001), and the two 003 rows show a log-only discovery and an honest failure mode: the vocabulary is a measurement instrument, and what it does not name, the log cannot see. The methodological rule that follows: vocabulary induction should be required to cover a standard set of operational categories (transport, waiting, rework, inspection), so that their absence is a measured zero rather than a blind spot. Finding F5: the logs confirm, refine, and extend the pipeline’s own qualitative findings, and the triangulation exposes vocabulary gaps as measurable blind spots.
4.4. What the Logs Cannot (Yet) Answer
Non-capabilities are part of the assessment. Throughput and yield: events carry no product identifiers, so pieces per hour and first-pass yield require object-centric extensions [12]. Calendar-time utilization: timestamps live on a synthetic per-worker axis; shifts, breaks, and machine utilization are not represented. Cross-worker flows: handoffs appear as events, but material is not tracked across workers. Waiting: the extraction prompt filters non-operational footage, which also removes most waiting, so waiting-as-waste is under-measured. Each limitation maps to a concrete pipeline extension (object references, wall-clock anchoring, cross-camera correlation, a waiting category).
5. Discussion
5.1. Threats to Validity
Construct: the operational-category mapping (112 labels to 7 categories) embeds judgment calls (e.g., whether mold coating is value-adding); the mapping is released, and the headline findings rest on unambiguous labels. All fidelity checks use the transcript, not the video, as reference, so vision-stage errors propagate silently into every downstream number; a video-grounded audit is the necessary next step before operational decisions. Because waiting is filtered and long recordings truncate, the reported non-value-adding shares are lower bounds. Internal: the semantic audit was performed by a single author on limited samples (42+42) without inter-rater agreement. External: six factories from one corpus, all discrete manufacturing; the analysis classes transfer, the numbers do not, and the pipeline is prompt- and model-version-dependent (the assessment of the released artifacts is fully reproducible without any model API). Conclusion: benchmarking compares observation windows of different lengths; the spreads are hypotheses for follow-up, not verdicts on individuals.
5.2. Ethical Considerations
Egocentric video is worker-centered data, and the benchmarking analysis of A4 shows how easily such logs could be misused for individual performance rating [13]. Our pipeline restricts optimization remarks to process design; the released logs use pseudonymous worker identifiers, and no footage is redistributed. Deployments require consent, purpose limitation, aggregation, and access control, and benchmarking results should feed workstation design, not appraisal.
6. Conclusions
This paper asked whether event logs derived automatically from egocentric videos of process executions deliver real analytical value. The answer is a qualified yes. A five-stage foundation-model pipeline produced 322 event logs with 10,698 events from six factories without task-specific training or human annotation, and the assessment shows what an analyst gains: a quantified account of where manual work time goes, a rework share that no narrative report surfaced, interruption profiles that separate material-presentation from logistics problems, and worker benchmarking that localizes 30-point efficiency spreads. The exposed limits define the agenda: vocabulary induction with mandatory operational categories, windowed extraction for long recordings, video-grounded audits, wall-clock anchoring, and object-centric extensions. We release pipeline, prompts, dataset, and assessment code so the community can study, stress-test, and extend event logs that see the process through the worker’s eyes.
Funding
Funded by the European Union. This work has received funding from the European High Performance Computing Joint Undertaking (JU) and from the German Federal Ministry of Research, Technology and Space (BMFTR), the Ministry of Culture and Science of North Rhine-Westphalia (MKW NRW), and the Hessian Ministry of Science and Research, Arts and Culture (HMWK) under grant agreement No 101250682.
References
- van der Aalst, W.M.P. Process Mining - Data Science in Action, Second Edition; Springer, 2016. [Google Scholar]
- Kratsch, W.; König, F.; Röglinger, M. Shedding light on blind spots - Developing a reference architecture to leverage video data for process mining. Decis. Support Syst. 2022, 158, 113794. [Google Scholar] [CrossRef]
- Diba, K.; Batoulis, K.; Weidlich, M.; Weske, M. Extraction, correlation, and abstraction of event data for process mining. WIREs Data Min. Knowl. Discov. 2020, 10. [Google Scholar]
- Knoch, S.; Ponpathirkoottam, S.; Schwartz, T. Video-to-Model: Unsupervised Trace Extraction from Videos for Process Discovery and Conformance Checking in Manual Assembly. Proc. BPM. Springer Lecture Notes in Computer Science. 2020, Vol. 12168, 291–308. [Google Scholar] [CrossRef]
- Lepsien, A.; Koschmider, A.; Kratsch, W. Analytics Pipeline for Process Mining on Video Data. Proc. BPM (Forum) 2023, Vol. 490, 196–213. [Google Scholar] [CrossRef]
- Pegoraro, M.; Seng, J.; Heller, D.; van der Aalst, W.M.P.; Kersting, K. All Eyes on the Workflow: Automated and Efficient Event Discovery from Video Streams. CoRR 2026, abs/2604.22476. [Google Scholar]
- Brzychczy, E.; Aleknonyte-Resch, M.; Janssen, D.; Koschmider, A. Process mining on sensor data: a review of related works. Knowl. Inf. Syst. 2025, 67, 4915–4948. [Google Scholar] [CrossRef]
- Berti, A.; Kourani, H.; van der Aalst, W.M.P. PM-LLM-Benchmark: Evaluating Large Language Models on Process Mining Tasks. Proc. ICPM Work. Springer Lecture Notes in Business Information Processing. 2024, Vol. 533, 610–623. [Google Scholar]
- Dani, V.S.; Dees, M.; Leopold, H.; Busch, K.; Beerepoot, I.; van der Werf, J.M.E.M.; Reijers, H.A. Event Log Extraction for Process Mining Using Large Language Models. Proc. CoopIS. Springer Lecture Notes in Computer Science. 2024, Vol. 15506, 56–72. [Google Scholar]
- Berti, A.; van Zelst, S.J.; Schuster, D. PM4Py: A process mining library for Python. Softw. Impacts 2023, 17, 100556. [Google Scholar] [CrossRef]
- Leemans, S.J.J.; Fahland, D.; van der Aalst, W.M.P. Discovering Block-Structured Process Models from Event Logs - A Constructive Approach. Proc. Petri Nets. Springer Lecture Notes in Computer Science. 2013, Vol. 7927, 311–329. [Google Scholar] [CrossRef]
- van der Aalst, W.M.P. Object-Centric Process Mining: Dealing with Divergence and Convergence in Event Data. Proc. SEFM. Springer Lecture Notes in Computer Science. 2019, Vol. 11724, 3–25. [Google Scholar] [CrossRef]
- Mannhardt, F.; Petersen, S.A.; Oliveira, M.F. Privacy Challenges for Process Mining in Human-Centered Industrial Environments. In Proceedings of the Intelligent Environments. IEEE, 2018; pp. 64–71. [Google Scholar]
| 1 | |
| 2 |
Figure 1.
Frames from Egocentric-10K: head-mounted cameras capture manual factory work (part handling, machine operation, assembly, packaging) from the worker’s perspective.
Figure 1.
Frames from Egocentric-10K: head-mounted cameras capture manual factory work (part handling, machine operation, assembly, packaging) from the worker’s perspective.
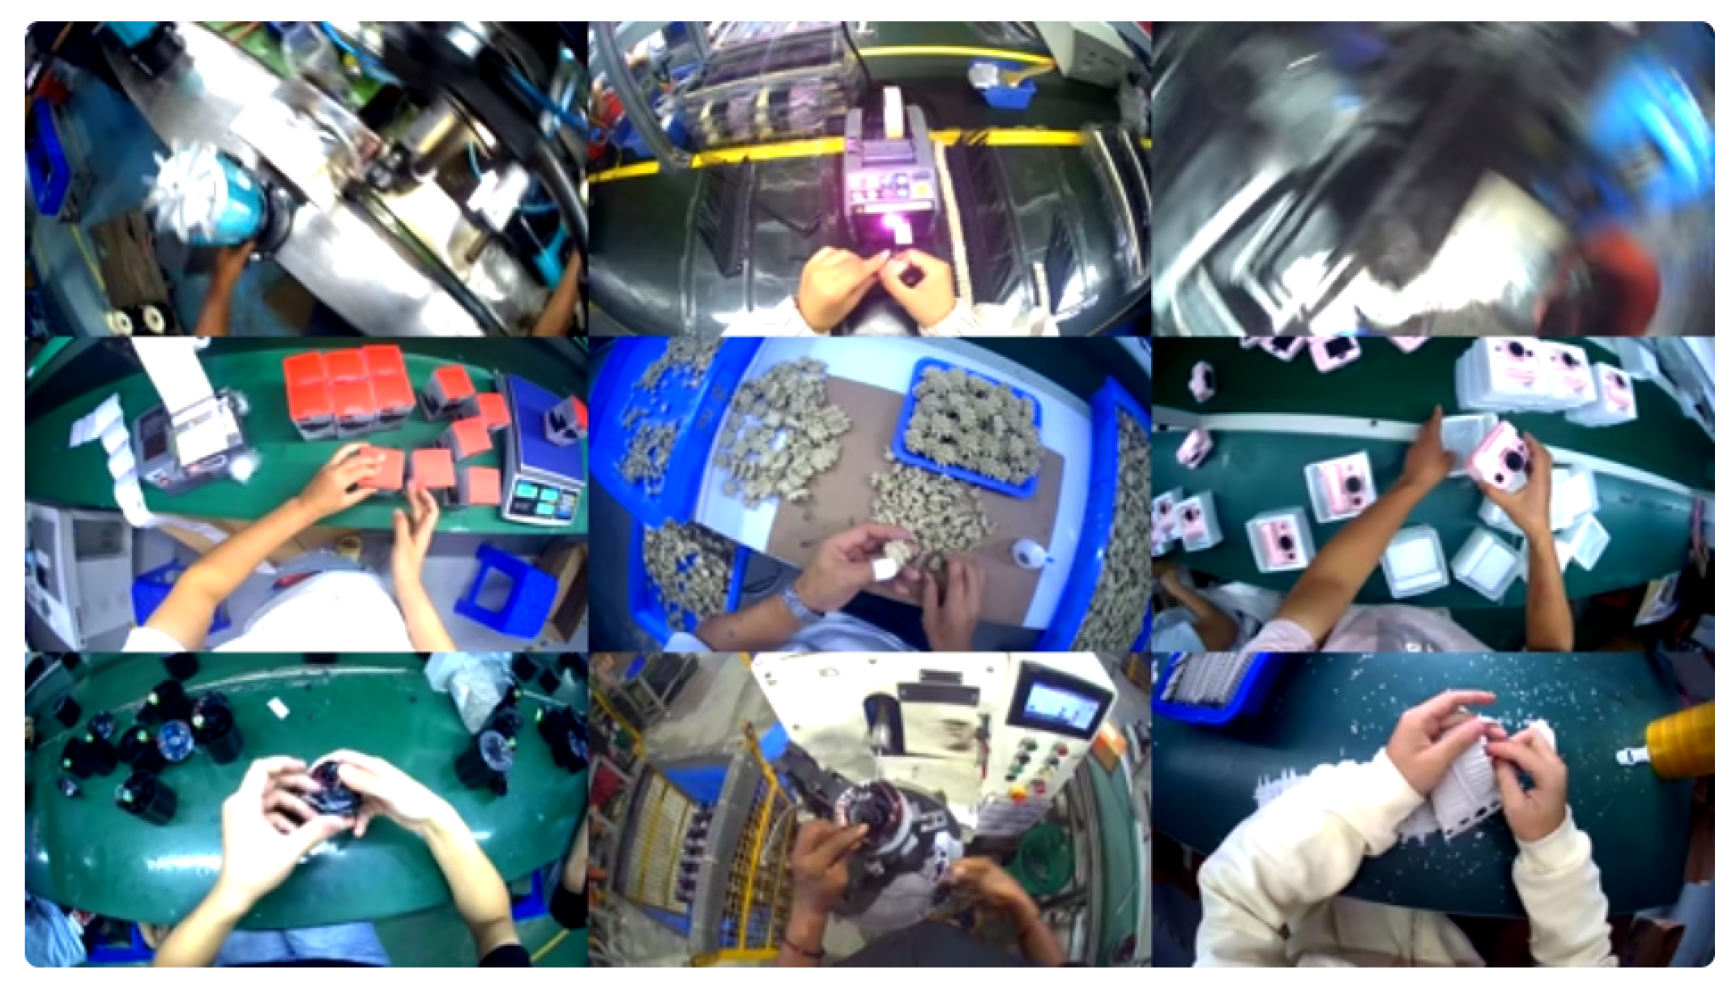
Figure 2.
The five-stage pipeline. A multimodal model (S1 to S3) produces transcripts, summaries, and controlled vocabularies; a text-only model (S4) converts each transcript into vocabulary-constrained events; S5 consolidates CSV logs.
Figure 2.
The five-stage pipeline. A multimodal model (S1 to S3) produces transcripts, summaries, and controlled vocabularies; a text-only model (S4) converts each transcript into vocabulary-constrained events; S5 consolidates CSV logs.
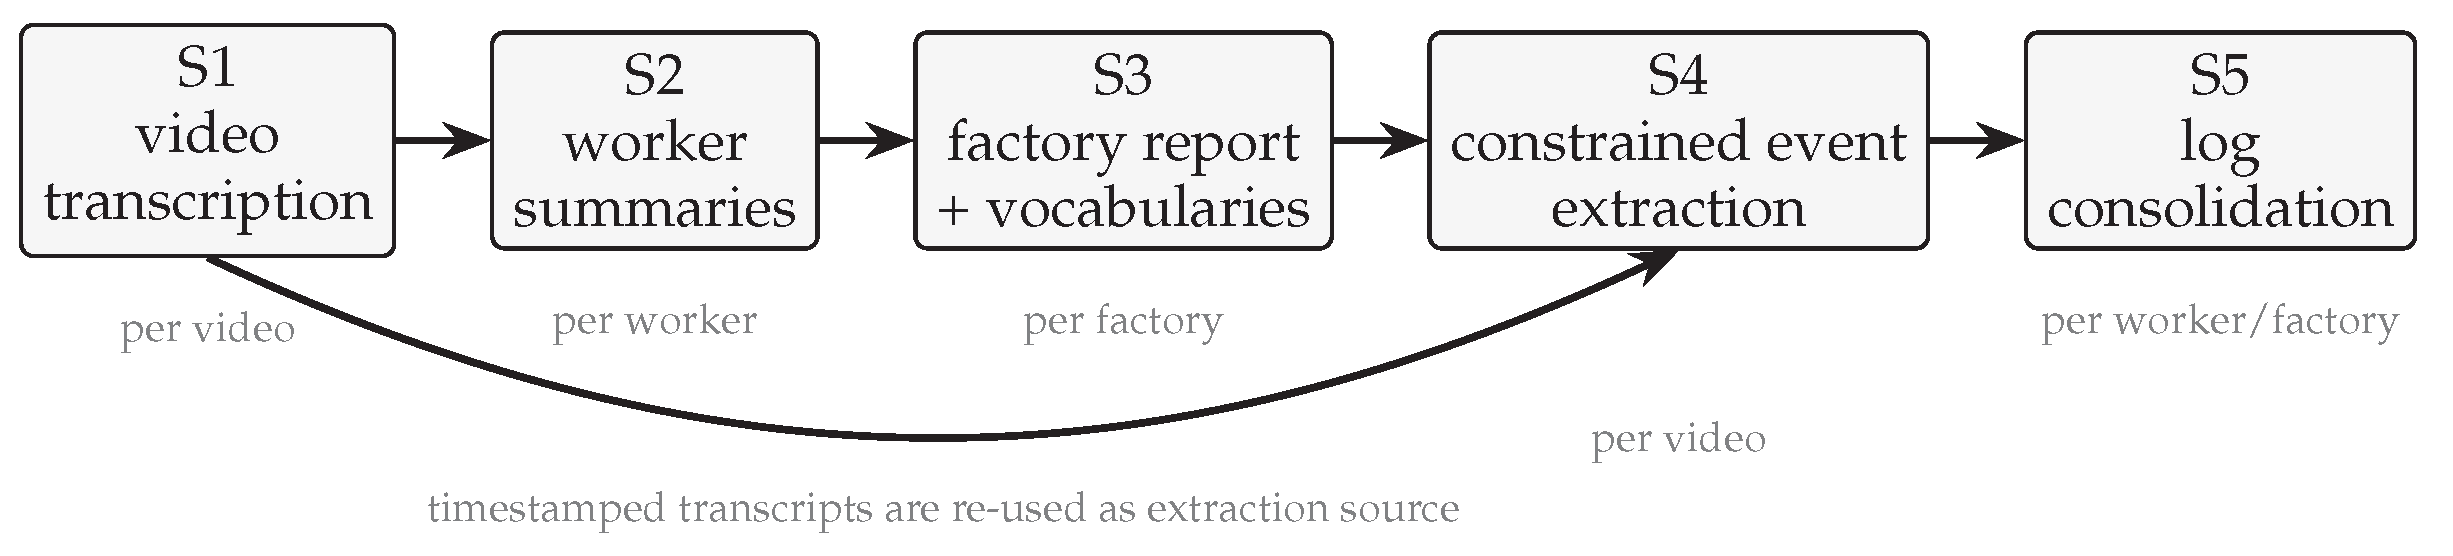

Table 1.
Manufacturing domain and dominant processes per factory. Process labels stem from the induced S3 vocabularies; percentages are shares of observed event time.
Table 1.
Manufacturing domain and dominant processes per factory. Process labels stem from the induced S3 vocabularies; percentages are shares of observed event time.
| Factory | Domain | Dominant processes (time share) |
|---|---|---|
| 001 | Metal hardware stamping and bench assembly | Metal stamping (48%), manual mechanical assembly (34%), component bagging (7%) |
| 002 | Garment finishing and packaging | Fabric folding (19%), garment bagging (17%), garment ironing (13%) |
| 003 | Investment-casting post-processing | Surface finishing and polishing (42%), wax pattern assembly (19%), defect patching (11%) |
| 004 | Garment sewing and confection | Overlock seaming (24%), garment folding (11%), thread trimming (11%) |
| 005 | Machining and electric motor assembly | Manual lathe machining (32%), drill press machining (19%), material transport and logistics (10%) |
| 006 | Sand-casting foundry | Sand mold creation (17%), pattern cleaning and coating (14%), compression molding (12%) |
Table 2.
Corpus and validity preconditions (Q1) per factory. Conf. = share of events whose labels are in the factory vocabularies; Cov. = share of observed span covered by events; Align. = share of event boundaries within ±5 s of a transcript boundary.
Table 2.
Corpus and validity preconditions (Q1) per factory. Conf. = share of events whose labels are in the factory vocabularies; Cov. = share of observed span covered by events; Align. = share of event boundaries within ±5 s of a transcript boundary.
| Factory | Workers | Videos | Events | Activity vocab. | Process vocab. | Conf. | Cov. | Align. | ||
|---|---|---|---|---|---|---|---|---|---|---|
| size | used | size | used | |||||||
| 001 | 11 | 97 | 2,288 | 131 | 125 | 13 | 13 | 100% | 94.8% | 93.1% |
| 002 | 10 | 54 | 1,541 | 75 | 67 | 24 | 24 | 100% | 28.2% | 71.8% |
| 003 | 11 | 72 | 2,449 | 55 | 52 | 12 | 12 | 100% | 93.0% | 86.8% |
| 004 | 10 | 51 | 1,893 | 71 | 65 | 22 | 22 | 100% | 92.1% | 90.4% |
| 005 | 11 | 22 | 1,103 | 102 | 97 | 18 | 17 | 100% | 25.0% | 75.0% |
| 006 | 6 | 26 | 1,424 | 61 | 59 | 24 | 24 | 100% | 14.1% | 62.1% |
| All | 59 | 322 | 10,698 | 100% | 52.8% | 82.1% | ||||
Table 3.
Value analyses per factory (recordings over one hour excluded). Left (A1): share of event-covered time per operational category. Right (A2): median value-adding share per worker, interruptions of value-adding work per hour, and median uninterrupted value-adding run.
Table 3.
Value analyses per factory (recordings over one hour excluded). Left (A1): share of event-covered time per operational category. Right (A2): median value-adding share per worker, interruptions of value-adding work per hour, and median uninterrupted value-adding run.
| A1: time composition | A2: fragmentation | |||||||||
|---|---|---|---|---|---|---|---|---|---|---|
| Factory | VA | MH | TR | QI | CM | RW | DOC | VA share | Intr./h | VA run |
| 001 | 93.1 | 4.1 | 1.8 | 0.0 | 0.2 | 0.0 | 0.9 | 94.5% | 9.2 | 4.6 min |
| 002 | 96.3 | 0.1 | 2.3 | 0.2 | 0.0 | 0.0 | 1.1 | 97.3% | 3.9 | 8.8 min |
| 003 | 82.1 | 0.4 | 0.0 | 0.0 | 6.3 | 10.8 | 0.4 | 86.4% | 3.6 | 9.0 min |
| 004 | 89.9 | 3.0 | 3.5 | 2.0 | 0.9 | 0.0 | 0.7 | 91.3% | 10.6 | 3.6 min |
| 005 | 80.6 | 5.4 | 9.7 | 4.3 | 0.0 | 0.0 | 0.0 | 85.9% | 5.6 | 6.2 min |
| 006 | 74.2 | 12.1 | 7.8 | 0.0 | 5.7 | 0.0 | 0.3 | 87.0% | 14.4 | 3.1 min |
Table 4.
A4: worker benchmarking on shared dominant processes (workers with at least 30 minutes of observed footage).
Table 4.
A4: worker benchmarking on shared dominant processes (workers with at least 30 minutes of observed footage).
| Factory | Shared process | Workers | VA share | Mean VA run |
|---|---|---|---|---|
| 001 | Manual mechanical assembly | 6 | 89.7 to 97.8% | 1.7 to 6.7 min |
| 001 | Metal stamping | 3 | 90.6 to 98.5% | 3.2 to 7.9 min |
| 003 | Surface finishing and polishing | 5 | 67.3 to 96.9% | 3.3 to 13.7 min |
| 004 | Garment ironing | 2 | 52.8 to 77.1% | 3.5 to 4.1 min |
| 004 | Overlock seaming | 4 | 87.8 to 96.5% | 1.5 to 10.3 min |
| 005 | Manual lathe machining | 2 | 95.0 to 95.8% | 6.9 to 9.4 min |
Table 5.
Q3: triangulation of qualitative report claims against log evidence.
| Report claim (S3, qualitative) | Log evidence (quantitative) | Relation |
|---|---|---|
| 001: “most pervasive bottleneck is the lack of dedicated material handlers” | 449 MH/TR episodes, 14.6/h, mean 15 s, 5.9% of time | Refined: frequency, not time share; presentation, not headcount |
| 006: “excessive manual material handling ... facility-wide bottleneck” | 19.8% of time in MH/TR, 28.4 episodes/h, VA runs of 3.1 min | Confirmed, quantified: largest capacity loss in the corpus |
| 003: workers “halt value-adding operations to carry heavy metal trays” | MH/TR only 0.4%; the 003 vocabulary has no transport label | Blind spot: transport is transcribed but not representable |
| 003 report does not mention rework | Defect patching = 10.8% of observed time | New finding: largest improvement lever in 003, log-only |
Disclaimer/Publisher’s Note: The statements, opinions and data contained in all publications are solely those of the individual author(s) and contributor(s) and not of MDPI and/or the editor(s). MDPI and/or the editor(s) disclaim responsibility for any injury to people or property resulting from any ideas, methods, instructions or products referred to in the content. |
© 2026 by the authors. Licensee MDPI, Basel, Switzerland. This article is an open access article distributed under the terms and conditions of the Creative Commons Attribution (CC BY) license (http://creativecommons.org/licenses/by/4.0/).
Copyright: This open access article is published under a Creative Commons CC BY 4.0 license, which permit the free download, distribution, and reuse, provided that the author and preprint are cited in any reuse.


