

Submitted:
03 July 2026
Posted:
06 July 2026
You are already at the latest version
Abstract
Predicting plantation establishment failure prior to planting remains a major operational challenge due to the strong spatial variability in post-harvest environmental conditions. This study developed a spatially explicit modelling framework that integrated pre-planting unmanned aerial vehicle (UAV)-derived environmental, structural, terrain, and operational-treatment data to predict establishment risk across plantation landscapes. Environmental, terrain, vegetation, and structural predictors were derived from pre-planting UAV imagery, while plantation establishment outcomes were quantified approximately 21 months later using an automated tree-detection and assessment framework. The datasets were integrated within a ridge-regularised logistic regression model incorporating interaction terms, multi-scale predictors, operational treatment masks, and blocked spatial cross-validation. The model achieved strong predictive performance under geographically independent validation, with moisture-related variables, vegetation condition, and structural metrics contributing most strongly to establishment-failure prediction. Predicted risk surfaces closely matched observed patterns of reduced stocking density and suppressed growth. The results demonstrate that plantation establishment risk can be predicted in advance of planting using pre-existing environmental and operational information, indicating that a substantial proportion of future plantation performance is determined by site conditions present before establishment begins.
Keywords:
forestry plantation establishment
; UAV remote sensing
; spatial modelling
; precision forestry
; residue management
; risk mapping
; multispectral
1. Introduction
Successful plantation establishment is fundamental to sustaining forest productivity, operational efficiency, and long-term ecosystem function within managed plantation systems. Early establishment failure can reduce stand productivity, increase replanting costs, delay rotations, and create persistent spatial variability in stand structure and yield [1,2,3]. Consequently, understanding and predicting the factors that influence establishment success remains a major challenge in plantation forestry.
Plantation establishment outcomes are influenced by complex interactions among environmental conditions, operational practices, and microsite variability [4,5,6,7,8,9,10,11,12,13,14,15,16,17]. Factors such as soil moisture availability, terrain position, residue distribution, vegetation competition, and site preparation practices can vary substantially over short spatial distances, producing heterogeneous establishment outcomes across plantation landscapes [18,19,20,21,22,23,24,25,26,27,28,29,30,31]. This fine-scale variability is often difficult to characterise using conventional field inventories or coarse-resolution satellite imagery.
Recent advances in UAV remote sensing provide new opportunities to quantify environmental heterogeneity at operationally relevant spatial scales. UAV-based photogrammetry and multispectral imaging can generate high-resolution orthomosaics, terrain models, vegetation indices, and structural metrics capable of characterising microsite conditions associated with plantation establishment processes. While UAV remote sensing has been widely applied to inventory estimation, canopy assessment, and operational monitoring, comparatively few studies in forestry have attempted to predict future plantation performance from environmental conditions that existed before planting occurred [32,33,34,35,36,37].
A key challenge is whether plantation establishment outcomes can be predicted prior to planting so that site preparation, residue management, and operational treatments can be adjusted proactively. Such predictive capability would provide substantial benefits for precision forestry by enabling targeted intervention and risk-based management. However, robust prediction also requires careful treatment of spatial autocorrelation because neighbouring observations within raster datasets are rarely independent. Spatially blocked validation approaches have therefore been recommended to provide realistic estimates of predictive performance in ecological applications [38,39,40].
This study develops a spatially explicit predictive modelling framework for plantation establishment failure using environmental, structural, terrain, and operational information derived from pre-planting UAV remote sensing. High-resolution RGB and multispectral imagery were used to derive vegetation indices, drought metrics, terrain attributes, structural texture measures, and operational treatment layers, while post-planting establishment outcomes were quantified using the Program for Identifying Nursery Trees (PINT) framework [35,41]. These datasets were integrated within a ridge-regularised logistic regression framework incorporating interaction terms, multi-scale predictors, and blocked spatial cross-validation to predict the spatial probability of establishment failure.
The objectives of this study were to: (1) develop a spatially explicit predictive model of plantation establishment failure using pre-planting UAV-derived variables; (2) integrate environmental, terrain, structural, and operational treatment predictors within a unified modelling framework; (3) evaluate predictive performance using blocked spatial cross-validation; (4) generate operational risk maps identifying areas of elevated establishment risk; and (5) assess how alternative operational treatment scenarios influence predicted establishment outcomes.
By linking pre-planting environmental conditions with subsequent plantation performance, the study demonstrates how UAV remote sensing and spatial modelling can support operational decision-making, targeted intervention, and precision management within heterogeneous plantation environments. A distinguishing feature of this study is that all predictor variables were derived from imagery acquired before planting occurred, whereas establishment outcomes were measured approximately 21 months later. The study therefore evaluates whether future plantation performance can be predicted from pre-existing environmental conditions rather than contemporaneous observations.
1.1. Related Work
Plantation establishment success is strongly influenced by interactions among environmental conditions, operational practices, and seedling physiological responses during the early post-planting period. Moisture availability is widely recognised as one of the dominant controls on seedling survival because newly planted seedlings initially possess limited root access to soil water and are highly vulnerable to drought stress [18,19,20,21,22,23,24,25,26,27,28,29,30]. Water deficits can reduce stomatal conductance, impair photosynthesis, restrict root development, and increase mortality, particularly under high evaporative demand or elevated soil temperatures [22,23,24,25,26,27,28,29,30]. These effects are often amplified in recently harvested environments where canopy removal, soil exposure, and residue redistribution substantially alter local hydrological and thermal conditions [42,43,44,45].
Residue management and mechanical site preparation strongly influence these microsite conditions. Logging debris and coarse woody material may provide beneficial moisture buffering, reduce evaporative losses, moderate soil temperature fluctuations, and contribute to nutrient retention [2,3,4,5,11,12,13,14,15,46,47]. Conversely, excessive residue accumulation may obstruct planting operations, reduce root–soil contact, increase competition, or create physically unsuitable planting microsites success [2,4,5,46]. Mechanical disturbance associated with harvesting and site preparation can also increase soil compaction, alter infiltration characteristics, and modify surface roughness and drainage pathways, further contributing to spatial variability in establishment outcomes [3,11,12,13,14,15,47].
Planting quality is another important determinant of establishment success that is often difficult to quantify spatially. Root deformation, shallow planting, poor root–soil contact, air pockets, exposed roots, and planting into compacted or dry soil can substantially reduce survival and early growth [29,30,48]. Research on planting methods has shown that seedling handling, root moisture, and planter effects may strongly influence establishment outcomes, with early differences often persisting into later stand development [29,30,48]. These processes directly affect hydraulic continuity and early root growth following transplantation, thereby influencing the ability of seedlings to tolerate environmental stress during establishment.
Establishment outcomes therefore emerge from interacting environmental and operational processes operating across multiple spatial scales. Local variations in soil exposure, residue cover, terrain position, vegetation competition, coarse woody debris distribution, and disturbance intensity can produce strong microsite variability within plantation landscapes [7,8,9,10,11,12,13,14,15,16,17,18,19,20,21]. Such variability frequently occurs at sub-metre to metre scales that are difficult to characterise using conventional field inventories alone. As a result, establishment failure often exhibits spatially structured patterns associated with moisture stress, operational disturbance corridors, terrain complexity, and vegetation heterogeneity [4,5,11,12,13,14,15,18,19,20,21,22,23,24,25].
Recent advances in unmanned aerial vehicle (UAV) remote sensing provide opportunities to quantify the fine-scale environmental heterogeneity across operational plantation environments. UAV-based photogrammetry and multispectral imaging can generate orthomosaics, digital terrain models, point clouds, vegetation indices, and structural texture metrics at resolutions suitable for compartment-scale forestry assessment [32,33,34,49]. These approaches enable spatially continuous mapping of exposed soil, vegetation cover, surface roughness, residue distribution, and terrain characteristics that may influence establishment processes.
In forestry, UAV remote sensing has increasingly been applied to inventory estimation, canopy assessment, structural analysis, and operational monitoring [32,33,34,35,41,50,51,52]. However, many existing studies remain focused on mapping current forest conditions rather than predicting future establishment outcomes from pre-planting environmental characteristics. Comparatively few studies in forestry have integrated environmental, terrain, structural, and operational variables within a unified predictive framework capable of identifying establishment risk prior to planting.
Spatial ecological modelling also presents important statistical challenges because neighbouring observations within raster datasets are rarely independent [38]. Conventional random cross-validation can therefore overestimate predictive performance when training and testing datasets share similar spatial structure. Blocked spatial cross-validation has consequently been recommended for environmental and ecological prediction because it provides more realistic estimates of model transferability across geographically separated regions [40,53]. This is particularly important in plantation establishment modelling where the objective is not only to reproduce observed spatial patterns, but also to identify transferable environmental and operational drivers of establishment success and failure.
Collectively, the literature suggests that plantation establishment is governed by complex interactions among moisture stress, microsite variability, operational disturbance, and vegetation dynamics operating across heterogeneous landscapes. While UAV remote sensing provides new opportunities to characterise these conditions at operationally relevant spatial scales, relatively few studies have linked pre-planting environmental information with later establishment outcomes using interpretable spatial predictive frameworks. This study addresses that gap by integrating UAV-derived environmental and structural metrics, operational treatment information, and blocked spatial cross-validation within a spatially explicit modelling framework for plantation establishment risk prediction.
2. Materials and Methods
3.1. Study Area and Experimental Design
The study was conducted at the Mount Graham Pinus radiata (Radiata pine) plantation site in a region known as the Green Triangle in South Australia (Figure 1, A). The site was one of six sites that comprised a series of operational plantation trials established following commercial harvesting and site preparation activities.
Mount Graham was selected as the modelling site for this study because it contained multiple harvesting and tillage treatments during re-establishment to Radiata pine. This permitted investigation of the influence of residue redistribution, surface disturbance, and microsite conditions on plantation establishment.
Operational treatments were distributed in broad east–west strips across the plantation, with Treatment C occupying much of the eastern portion of the site and Treatments B, E, and H occurring primarily within western and central areas (Figure 1, B). A description of the operational treatments is given in Table 1.
The treatments were not randomly assigned but were implemented according to operational constraints and site conditions, resulting in partial confounding between treatment allocation and underlying environmental gradients.
3.2. UAV Data Acquisition and Processing
High-resolution RGB imagery was acquired using a DJI Zenmuse P1 camera, while multispectral imagery was collected using a MicaSense Altum sensor. All flights were conducted at an altitude of approximately 100 m using forward and side overlaps of approximately 85%, producing ground sampling distances of approximately 1.4 cm and 5.0 cm for the RGB and multispectral datasets, respectively.
Image sequences were then processed using Agisoft Metashape Professional to generate georeferenced orthomosaics, dense point clouds, digital surface models, and terrain products using structure-from-motion photogrammetry [54,55,56]. All orthomosaics, point clouds, terrain models, treatment masks, and derived environmental predictor layers were projected into a common coordinate reference system and resampled onto a common spatial analysis grid to ensure pixel-level correspondence among predictor and response datasets.
Only variables derived from the pre-planting UAV survey were used as model predictors. Establishment outcomes, including stocking density and tree height, were measured approximately 21 months after planting and used exclusively as response variables. This temporal separation ensured that the modelling framework evaluated the predictive value of pre-existing environmental and operational conditions rather than contemporaneous site observations.
3.3. Climatic Conditions During Establishment
The establishment period coincided with substantially below-average rainfall conditions across the study region. Approximately 180 mm of rainfall was recorded between the May 2024 pre-planting campaign and the November 2024 post-planting campaign, compared with a long-term mean of approximately 430 mm for the same period. Similarly, approximately 80 mm of rainfall was recorded between November 2024 and March 2025, compared with a long-term mean of approximately 135 mm (www.bom.gov.au/climate/data). These values represent rainfall deficits of approximately 58% and 41%, respectively. Monthly rainfall records were obtained from the nearest Bureau of Meteorology station and compared with long-term climatic averages to characterise climatic conditions during the plantation establishment period (Figure 2).
3.4. Establishment Assessment
Plantation establishment was quantified using the Program for Identifying Nursery Trees (PINT) framework [35]. Individual trees were detected from post-planting UAV imagery and used to derive spatially explicit estimates of stocking density, tree height, mortality, and weed cover.
Tree heights were estimated using canopy-height information derived from photogrammetric point clouds, while stocking density was calculated from the spatial distribution of detected trees. Weed coverage was similarly mapped from multispectral imagery and incorporated as an indicator of competitive pressure during establishment. Together, these variables provided quantitative measures of plantation performance throughout the monitoring period.
PINT has been tested on several hundred sites covering over 3,500 ha, with seedlings ranging from 3 months to 5 years old (mean tree heights ~10cm – 7m). Test sites contained a wide range of geomorphologies and levels of weed infestation. Diagnostic tests against ground truth visually identified in orthomosaic images indicate PINT has detection accuracies > 95% with false alarm rates around 1% [35,37,41]. Tree location accuracies are around 0.25 m (95% confidence).
Examples of PINT comparisons against ground-truth observations for (A) tree detection and (B) weed coverage are shown in Figure 3. Tree-detection accuracy was assessed within a series of 40 m × 40 m validation plots, while weed-detection performance was evaluated using polygon overlap between mapped weed patches and ground-truth observations (same sized plots). High correspondence between PINT outputs and ground-truth data demonstrates the reliability of the automated detection framework for subsequent establishment and vegetation analyses.
3.5. Environmental Predictor Generation
Environmental predictors were derived from pre-planting RGB, multispectral, and terrain datasets to characterise microsite conditions likely to influence plantation establishment. More than 50 environmental, structural, terrain, and operational predictors were generated and subsequently evaluated for inclusion within the modelling framework. For more details the reader is referred to [36] and [57].
Spectral Predictors: Spectral indices describing vegetation condition, soil exposure, and moisture status were derived from the multispectral imagery. These included vegetation and dryness metrics designed to characterise residual vegetation, exposed soil, and relative moisture conditions across the site.
Terrain Predictors: Terrain metrics were derived from digital elevation models and canopy-height products. These variables described local elevation, surface relief, and terrain complexity, which influence water redistribution, soil development, and operational accessibility.
Structural Predictors: Structural predictors were derived from texture and spatial analyses applied to RGB, multispectral, and canopy-height datasets. These metrics characterised surface roughness, periodicity, entropy, line density, coarse woody debris distribution, and operational disturbance patterns. Such variables provided quantitative descriptions of microsite heterogeneity associated with harvesting and site preparation activities.

Table 2.
Summary of parameters canvassed for use in regression model. RDMI = Ratio Dryness Monitoring Index, NRCT = Normalised Relative Canopy Temperature, NDVI = Normalised Difference Vegetation Index, DEM = Digital Elevation Map, PSD = Poser Spectral Density.
Table 2.
Summary of parameters canvassed for use in regression model. RDMI = Ratio Dryness Monitoring Index, NRCT = Normalised Relative Canopy Temperature, NDVI = Normalised Difference Vegetation Index, DEM = Digital Elevation Map, PSD = Poser Spectral Density.
|
Metrics (Predictor Group) |
Variables Included | Purpose |
| Moisture / dryness | Dryness, RDMI, NRCT, Soil | Represent moisture stress and exposed soil |
| Vegetation condition | NDVI, weed density | Represent vegetation cover and competition |
| Terrain structure | DEM metrics (e.g. entropy, energy), elevation | Represent terrain variability and roughness |
| Structural metrics | PSD, HAG gradients, Line density | Represent operational and microsite structure |
| Operational variables | Treatment masks | Represent site preparation and disturbance |
| Interaction predictors | All interaction terms | Represent combined environmental effects |
| Multi-scale predictors | Smoothed gradients | Represent broader landscape variability |
A soil-group map derived from the South Australian Government Department of Environment and Water soil-landscape database (www.data.environment.sa.gov.au/NatureMaps) was examined during exploratory analysis. According to this database the site occupies a dune–swale landscape comprising Mount Burr Sand, Young Sand, Mount Muir Sand, Hindmarsh Sandy Loam, and minor Red Basaltic soil groups. This represents considerable soil variation across the site.
However, soil groups were not incorporated directly into the final modelling framework because the sampling regimes differed substantially from the UAV-based observations and many UAV-derived moisture, vegetation, and terrain predictors already reflected the environmental consequences of soil variation. Instead, soil groups were rasterised to the common analysis grid and incorporated as categorical predictors, with Mount Burr Sand used as the reference class. Soil-group predictors were included to represent landscape-scale edaphic variation not fully captured by UAV-derived moisture, vegetation, and terrain metrics. Full integration of soil properties was left as a task for the future.
Feature Engineering and Predictor Selection: To capture interactions among environmental processes, additional predictor variables were generated through interaction terms and multi-scale spatial aggregation. Variables representing operational treatment classes were incorporated using spatial treatment masks, while large-scale environmental gradients were represented through neighbourhood-based predictor summaries.
Predictor relationships were examined prior to modelling to identify covariance and potential redundancy among variables (Figure 4). This information was used to guide predictor filtering and support subsequent application of regularised regression methods.
Establishment Index: Plantation performance was summarised using an establishment index combining stocking density and tree growth measurements. The index was defined as,
where represents the normalised stocking-density metric and represents the normalised tree-height metric.
Stocking density and tree height were first normalised to a common scale (0–1) to ensure comparable contribution to the index. The weighting scheme prioritised successful establishment and survival while retaining information on early growth performance.
The establishment index differentiates between establishment failure (low survival) and performance failure (survival accompanied by poor growth), allowing identification of areas that would be overlooked using stocking metrics alone
Establishment failure was defined as raster pixels (0.1m) not individual trees with establishment-index values below the 25th percentile of the observed distribution. After removal of pixels containing missing predictor or response data, a total of 91,161,184 valid observations were available for modelling (observations corresponded to raster cells rather than independent field measurements). Of these, 22,788,174 observations were classified as establishment failures (25%) and 68,373,010 as non-failures according to the establishment-index threshold. These observations formed the dataset used for model development and validation.
Predictive Modelling Framework: The probability of establishment failure was modelled using ridge-regularised logistic regression. Establishment failure was defined using threshold values applied to the establishment index, producing a binary response variable suitable for classification modelling.
Model coefficients were estimated by maximising a penalised likelihood function:
where Y represents establishment failure, are predictor variables, and are model coefficients.
Ridge regularisation was incorporated to reduce instability arising from correlated environmental predictors:
where is the likelihood function, , which is the probability of observing the data, , given the predictor variables and model coefficients, , and is the regularisation parameter controlling coefficient shrinkage.
Predictor variables were standardised to zero mean and unit variance prior to model fitting to improve numerical stability and facilitate comparison of coefficient magnitudes.
Spatial Cross-Validation: Model performance was evaluated using blocked spatial cross-validation to account for spatial autocorrelation among neighbouring observations [51,52,53]. The study area was partitioned into five geographically contiguous east-west folds approximately 140 m wide by 1,400 m long (Figure 5). During each iteration, one-fold was withheld for validation while the remaining folds were used for model training.
Predictive performance was assessed using area under the receiver operating characteristic curve (AUC), Brier scores, calibration statistics, and confusion-matrix-derived classification metrics. Mean performance statistics were subsequently calculated across all validation folds.
Treatment Scenario Analysis: To evaluate the influence of operational treatments on establishment outcomes, counterfactual treatment simulations were undertaken using the fitted modelling framework. Treatment layers were systematically modified while all other environmental predictors were retained unchanged, allowing estimation of the expected change in establishment-failure probability associated with alternative management scenarios. These simulations were used to assess treatment effectiveness and identify opportunities for spatial optimisation of operational practices across the plantation landscape.
Operational treatments were arranged in broad north–south strips across the plantation. Treatment C occupied most of the eastern portion of the site, while Treatments B, E, and H occurred primarily within the western and central areas. Treatment D was represented by a relatively small, localised block near the boundary between Treatments H and C (Figure 1, B). A substantial proportion of the eastern high-risk zone coincided with Treatment C, suggesting that operational treatment effects may have contributed to the observed establishment pattern.
Treatment predictors represented treatment classes aggregated across multiple operational polygons rather than individual treatment areas. This reduced confounding between treatment identity and spatial location and allowed estimation of more generalisable treatment effects.
Statistical Analysis: Predictor importance was estimated from standardised model coefficients, allowing comparison of the relative influence of environmental, structural, terrain, operational, and interaction variables on establishment-failure probability. Predictor contributions were subsequently interpreted in conjunction with spatial risk maps and observed establishment patterns to identify dominant drivers of plantation performance.
Summary of Framework: The overall analytical workflow, which integrates pre-planting UAV-derived environmental, vegetation, terrain, structural, and operational predictors with post-planting establishment assessments to model and map future establishment-failure risk, is depicted graphically in Figure 6.
3. Results
3.1. Establishment Outcomes
Substantial spatial variation in plantation performance was observed across the Mount Graham site (Figure 7). Reduced stocking density and suppressed tree growth were concentrated primarily within eastern portions of the plantation and along several operational disturbance corridors. Tree height exhibited greater spatial variability than stocking density, indicating that growth performance remained sensitive to environmental conditions even where tree survival was maintained.
The ridge-regularised modelling framework successfully reproduced these broad spatial patterns (Figure 8). Predicted establishment-failure probability increased within areas characterised by reduced stocking density and suppressed tree growth, while lower failure probabilities occurred within regions exhibiting higher stocking densities and greater tree height. In several areas, moderate stocking densities coincided with relatively low establishment-index values, indicating that growth performance was suppressed despite successful survival. This demonstrates that stocking alone underestimated spatial variability in plantation condition and highlights the value of incorporating tree growth into establishment assessment.
Approximately 43% of the site was classified as high or very high establishment risk, while 34% was classified as low risk (Table 3), demonstrating that substantial spatial variability in plantation performance can be identified prior to planting using UAV-derived environmental information. High-risk zones were concentrated primarily within eastern portions of the plantation and along operationally aligned linear features associated with access tracks, fire breaks, and planting corridors (Figure 9). Risk classes formed large contiguous regions rather than isolated individual pixels, indicating that establishment failure was governed by broad environmental and operational gradients rather than local stochastic variation alone.
4.2. Model Performance
Model performance was evaluated using five-fold blocked spatial cross-validation to account for spatial autocorrelation among neighbouring observations. Validation performance was high and highly consistent across the five spatial validation folds, with AUC values ranging from 0.901 to 0.909 and a mean AUC of 0.904 ± 0.004 (Table 4). The small variation among folds indicates stable model performance under geographically independent validation conditions and good spatial transferability.
Additional classification metrics demonstrated robust model performance: accuracy (0.87), sensitivity (0.70), specificity (0.93), precision (0.76), balanced accuracy (0.81), and F1-score values (0.73). The model also exhibited good probabilistic calibration (Brier score = 0.102, expected calibration error (ECE) = 0.028), indicating close agreement between predicted establishment-failure probabilities and observed outcomes (Figure 10). Calibration and ROC analyses further demonstrated reliable probability estimates across the full range of predicted establishment-failure probabilities.
Collectively, these results indicate that the modelling framework provided accurate spatial discrimination of establishment risk while maintaining stable predictive performance under geographically independent validation. Notably, strong predictive performance was achieved despite all predictor variables being derived prior to planting and the response variables being measured approximately 21 months later. This finding suggests that a substantial proportion of the observed establishment variability was associated with environmental and operational conditions present before plantation establishment commenced.
To assess the spatial stability of model predictions, uncertainty was quantified as the standard deviation (SD) of predicted establishment-failure probabilities across the five blocked spatial cross-validation models (Figure 11). Prediction uncertainty was generally low throughout the plantation, with standard deviations typically below 0.01. Areas of elevated uncertainty occurred primarily along transitions between low- and high-risk zones and near operational boundaries, whereas the major high-risk region in the eastern portion of the site exhibited relatively consistent predictions across validation folds. These results indicate that the principal spatial patterns of establishment risk were robust to variation in training data and were not driven by a small subset of observations.
4.3. Ecological Processes Influencing Establishment Success
Predictor contributions were aggregated into five broad ecological and operational process groups (Figure 12). Moisture-related processes collectively contributed the largest proportion of model influence (31.8%), indicating that water availability and drought stress were the dominant controls on plantation establishment during the study period. Terrain and structural factors associated with microsite heterogeneity represented the second-largest contribution (27.5%), followed by vegetation condition and competition processes (19.8%), operational management factors (13.7%), and interaction terms (11.1%), the latter indicating establishment outcomes were governed by multiple interacting environmental and management processes rather than by individual predictors acting independently.
Vegetation-related predictors represent both site productivity and competition processes. Vegetation condition indices and weed-density metrics provide information on the distribution of ground cover and competing vegetation, which can influence seedling performance through competition for water, nutrients, and light. During periods of moisture limitation, vegetation competition may further reduce available soil moisture and amplify establishment stress.
Structural and terrain-related predictors reflect the spatial organisation of microsite conditions across the plantation. Measures of surface complexity, roughness, elevation, and terrain entropy capture variation in residue distribution, soil exposure, drainage characteristics, and local moisture accumulation. These factors influence the creation of favourable and unfavourable microsites for seedling establishment and contribute to the pronounced spatial heterogeneity observed within the site.
Operational predictors represent management decisions associated with site preparation, residue management, and planting configuration. The contribution of treatment-related variables indicates that management interventions influenced establishment outcomes, although their effectiveness was strongly mediated by local environmental conditions. This suggests that operational practices interact with underlying site variability rather than acting independently.
Finally, the importance of interaction terms highlights that establishment success is governed by multiple interacting processes rather than single environmental drivers. Relationships between moisture availability, vegetation condition, terrain characteristics, and operational treatments were frequently non-additive, indicating that establishment outcomes emerge from the combined influence of environmental and management factors operating across multiple spatial scales.
3.4. Predictor Contributions
Individual predictor contributions identified DEM entropy, moisture-related variables (Dryness, RDMI and NRCT), vegetation-condition metrics (NDVI and weed density), and treatment-related variables as the strongest individual determinants of establishment risk. Although several predictors contributed strongly to model performance, the aggregated analysis (Figure 12) indicates that broader ecological processes associated with moisture availability, microsite heterogeneity, vegetation competition, and operational management exerted the greatest overall influence on plantation establishment outcomes.
4.5 Soil Groups
Mean establishment index differed significantly among soil groups (Kruskal–Wallis, p < 0.001), with Mount Burr Sand exhibiting the lowest mean establishment performance.
Predicted establishment-failure probability differed significantly among soil groups (Figure 13), Kruskal–Wallis test, p < 0.001. Hindmarsh Sandy Loam exhibited the lowest mean failure probability (0.021 ± 0.020), indicating consistently favourable establishment conditions. Mount Muir Sand showed intermediate failure risk (0.112 ± 0.168), while Mount Burr Sand (0.260 ± 0.295) and Young Sand (0.312 ± 0.269) exhibited substantially higher predicted failure probabilities (Table 5). Red Basaltic soils were not represented within the study area and were therefore excluded from statistical comparisons.
4.6. Treatment Scenario Analysis
Treatment effects varied substantially across the plantation (Figure 14). Simulated treatment deployment scenarios indicated measurable differences in predicted establishment-failure probability among treatment classes while holding mapped environmental predictors constant.
Failure probabilities were estimated by applying each treatment across the modelling dataset while holding environmental, vegetation, terrain, and structural predictors constant. Difference from best treatment indicates the increase in predicted failure probability relative to the lowest-risk treatment.
Treatments E, H, and B were associated with reduced predicted establishment-failure probability relative to current conditions, whereas Treatments C and D increased predicted risk. Treatment E produced the lowest mean predicted failure probability and Treatment D the highest.
The treatment-simulation framework therefore provides a practical mechanism for evaluating alternative residue-management and site-preparation strategies prior to implementation, enabling comparison of likely establishment outcomes under different operational scenarios.
4. Discussion
4.1. Predictive Performance and Spatial Transferability
The ridge-regularised modelling framework achieved strong predictive performance under blocked spatial cross-validation (AUC = 0.904 ± 0.004), indicating pre-planting environmental and operational conditions contained substantial information regarding subsequent plantation establishment outcomes.
Importantly, performance was evaluated using geographically separated validation folds rather than conventional random partitioning, providing a more conservative assessment of model transferability under spatially independent conditions. The relatively small variation in AUC among folds suggests that the model captured environmental processes operating consistently across the site rather than relying solely on local spatial structure.
The strong correspondence between predicted establishment-failure probability, stocking density, and tree-height patterns further supports the validity of the modelling framework. High-risk regions were consistently associated with reduced survival and suppressed growth, indicating that the selected predictor set successfully captured the dominant environmental and operational gradients influencing plantation performance. These findings demonstrate that pre-planting UAV-derived variables can provide meaningful predictive information regarding future establishment outcomes, offering potential for operational risk assessment prior to plantation establishment.
However, because treatment allocation was not fully randomised and some treatments coincided with broader environmental gradients, treatment effects should be interpreted as associations rather than definitive causal responses.
5.2. Moisture Availability as the Dominant Driver of Establishment Success
Predictor contribution analysis identified moisture-related variables as among the strongest determinants of plantation establishment outcomes. This finding is consistent with extensive forestry literature demonstrating that soil moisture availability is a primary control on early seedling survival and growth, particularly during the critical period immediately following planting when root systems remain poorly developed and access to soil water is limited.
Although individual predictor contributions provide insight into model behaviour, interpretation is more informative when predictors are considered as representations of broader ecological and operational processes. Aggregated predictor contributions indicated that moisture availability, vegetation competition, surface structural complexity, operational management, and interactions among these processes collectively explained most of the variation in establishment outcomes. Moisture-related predictors contributed the largest proportion of model explanatory power, suggesting that water availability was the dominant process influencing early plantation establishment.
The strong influence of dryness-related predictors likely reflects the unusually dry conditions experienced during the establishment period. Rainfall totals between successive monitoring campaigns (2024 pre-planting and 2026 for the 21 months) were approximately 58% and 41% below long-term averages, indicating that seedlings were exposed to prolonged moisture deficits during early development (Figure 2). Under these conditions, relatively small differences in residue cover, soil exposure, surface roughness, vegetation competition, and terrain position can produce substantial variation in soil moisture retention and evaporative losses, with corresponding effects on establishment probability.
Although soil groups were not included as model predictors, the spatial correspondence between predicted failure probability and mapped soil distributions suggests that moisture-related variables may have indirectly captured some of the site-quality variation associated with differences in soil water availability. Similarly, the importance of variables such as RDMI, PDI, exposed-soil metrics, and vegetation-condition indices indicates that elevated establishment-risk zones were generally associated with environmental conditions conducive to greater moisture stress, whereas lower-risk areas corresponded with conditions more favourable for moisture retention.
Moisture-related interaction terms also contributed strongly to model performance, indicating that drought effects operated in combination with vegetation condition, terrain structure, and operational disturbance rather than as an isolated driver. These results suggest that the rainfall deficit not only increased overall establishment stress but also amplified differences among residue-management and tillage treatments by altering microsite moisture buffering capacity. Consequently, management practices that improve moisture retention may become increasingly important as climatic variability and drought frequency increase within plantation environments.
5.3. Importance of Microsite Heterogeneity
The results indicate that plantation establishment failure was not randomly distributed but instead exhibited strong spatial organisation associated with microsite variability. Structural predictors describing surface roughness, entropy, line density, residue distribution, and terrain complexity contributed substantially to model performance, indicating that establishment outcomes were influenced by environmental conditions operating at multiple spatial scales. The results suggest establishment outcomes are governed by interactions between microsite-scale conditions (e.g. soil disturbance and residue distribution) and broader mesoscale gradients associated with moisture availability and terrain structure.
The observed spatial patterns suggest that local differences in soil exposure, residue retention, coarse woody debris distribution, and operational disturbance modified the microsite environment experienced by individual seedlings. Areas characterised by high structural variability may have contained greater heterogeneity in rooting conditions, soil–residue contact, moisture availability, and planting quality, resulting in increased establishment variability.
These findings reinforce the importance of considering fine-scale environmental heterogeneity when assessing plantation establishment success. Traditional compartment-level assessments often assume relatively uniform site conditions, whereas the present results demonstrate that substantial variability may occur over distances of only a few metres. UAV-derived datasets provide a practical means of capturing this heterogeneity and incorporating it into predictive decision-support frameworks.
To further examine the relationship between operational treatments and predicted establishment outcomes, treatment-zone boundaries were compared with the spatial distribution of establishment-risk classes (Figure 15). Although elevated establishment risk occurred throughout the site, high and very high-risk classes were concentrated within the eastern treatment blocks, particularly areas assigned to Treatment C, although treatment effects remain partially confounded with underlying environmental gradients.
5.4. Operational Influences and Treatment Effects
The influence of treatment variables and operationally derived structural metrics suggests that plantation establishment outcomes were affected not only by environmental conditions but also by management practices. Several high-risk zones were spatially aligned with operational features including access tracks, firebreaks, harvesting corridors, and planting rows. These features are likely associated with altered soil structure, compaction, residue distribution, and disturbance intensity, all of which can influence seedling performance.
The ability of the model to reproduce linear operational features indicates that engineered structural predictors successfully captured both fine-scale disturbance patterns and broader landscape gradients influencing establishment outcomes.
Conversely, low- and moderate-risk areas generally occurred within portions of the plantation characterised by more favourable environmental conditions and reduced operational disturbance. These areas were typically associated with conditions indicative of improved moisture retention and lower establishment stress, suggesting that both site quality and operational impacts contributed to the spatial distribution of establishment outcomes.
The objective of the analysis was prediction rather than causal inference. Although treatment variables contributed substantially to model performance, the observational design and non-random spatial allocation of treatments prevent definitive attribution of establishment outcomes to treatment effects alone.
Treatment scenario analysis further demonstrated measurable differences among operational treatments after accounting for environmental variation. The results indicate that management decisions can influence establishment outcomes independently of underlying environmental gradients.
The ability to explicitly incorporate treatment information within the modelling framework represents an important step toward operational decision support. Rather than simply identifying areas of poor performance after establishment has occurred, the framework provides a mechanism for evaluating alternative treatment strategies before implementation and estimating their likely consequences across entire plantation compartments.
The treatment-scenario analysis indicated potential differences in operational treatments. Treatment E produced the lowest predicted establishment-failure probability across the site, followed by Treatments H and B, whereas Treatments C and D generated substantially higher probabilities of failure. Treatment D consistently represented the highest-risk treatment scenario (Figure 14).
Nevertheless, interpretation of treatment effects should be undertaken with caution as treatment allocation was spatially fixed and thus potentially confounded with underlying environmental gradients. Although Treatment H consistently exhibited the most favourable establishment outcomes, Treatment C was associated with elevated establishment-failure risk across much of the eastern portion of the site. Notably, the smaller isolated strip of Treatment C located within the central plantation also exhibited relatively poor establishment compared with adjacent Treatment H areas, suggesting observed performance differences may not be solely attributable to the broad east–west environmental gradient. Nevertheless, environmental conditions within Treatment C may still have contributed to the elevated risk observed in these areas.
Treatment D also exhibited comparatively poor establishment performance. However, the spatial location of this treatment may have influenced the observed outcomes. The Treatment D block occupied a relatively restricted area within the plantation and may have been subject to local environmental conditions that differed from those experienced by other treatments. Consequently, some of the apparent treatment effect may reflect site-specific factors rather than treatment efficacy alone.
Collectively, these findings suggest that treatment performance was context dependent and influenced by underlying environmental variability and highlight the difficulty of separating treatment effects from environmental variation within operational-scale plantation trials. While the results suggest that treatment selection influences establishment outcomes, additional studies incorporating replicated treatment layouts across a broader range of environmental conditions are required to accurately quantify treatment efficacy and determine optimal pre-planting treatment strategies. Such studies would improve the ability to distinguish operational treatment effects from underlying site-quality gradients and provide stronger evidence for treatment-specific recommendations. Some unexplained variation may reflect planting-quality effects that were not directly measurable using UAV-derived predictors, and these factors may have been indirectly associated with operational treatments.
5.5. Integrating Survival and Growth into Establishment Assessment
A key innovation of the present study is the integration of stocking density and tree height into a composite establishment index. Conventional establishment assessments frequently focus on survival alone, implicitly assuming surviving trees contribute equally to future stand development. However, the results indicate that areas exhibiting acceptable stocking densities may nevertheless experience reduced growth performance.
The establishment index therefore provides a more biologically meaningful representation of plantation performance by recognising that successful establishment requires both survival and subsequent growth. Several areas identified as moderate risk using stocking density alone exhibited substantially lower establishment-index values owing to suppressed tree height. These areas would likely have been overlooked using conventional stocking-based assessments despite representing potentially underperforming portions of the plantation.
The integration of survival and growth information therefore improves the sensitivity of establishment assessment and provides a stronger foundation for operational intervention and long-term productivity evaluation.
5.6. Implications for Precision Forestry
The strong spatial coherence of predicted risk classes has important operational implications. High-risk zones formed large contiguous regions rather than isolated pixels, suggesting that management interventions can be implemented at meaningful operational scales. This creates opportunities for targeted replanting, modified site preparation, residue redistribution, weed management, or supplementary treatments focused on areas most likely to experience establishment failure.
More broadly, the framework demonstrates how high-resolution UAV remote sensing can be integrated with spatial statistical modelling to support precision forestry. By linking pre-planting environmental conditions with subsequent plantation performance, managers can move from reactive assessment toward proactive risk identification and treatment optimisation. Such approaches may become increasingly valuable as climatic variability and drought frequency continue to increase uncertainty surrounding plantation establishment success.
A notable outcome of this study is that all predictor variables were derived from UAV imagery acquired prior to planting, whereas establishment outcomes were assessed approximately 21 months later. The ability to predict plantation performance approximately 21 months before assessment suggests that a substantial component of establishment variability was already encoded within pre-planting environmental and operational conditions.
This finding has important operational implications because it demonstrates that establishment risk can be identified before planting occurs. Rather than using remote sensing solely as a monitoring tool, the approach enables predictive assessment of future plantation performance. Such information could be used to modify site preparation treatments, residue management strategies, planting prescriptions, or operational resource allocation before establishment failure occurs. The framework therefore represents a transition from retrospective assessment toward proactive establishment-risk forecasting within plantation forestry.
5.7. Limitations and Future Research
Several limitations should be acknowledged. First, the model was developed and evaluated within a single plantation site, and transferability to other sites, species, climatic conditions, and management systems remains to be tested. Multi-site validation will be required before broad operational deployment.
Second, while blocked spatial cross-validation reduces inflation associated with spatial autocorrelation, some predictive power may still arise from residual spatial structure not fully represented by the predictor set. Future work should investigate transferability across independent plantations and regions.
Third, the present framework represents establishment outcomes at a single stage of stand development. Incorporating repeated observations through time would allow evaluation of temporal trajectories in survival and growth and improve understanding of how early environmental conditions influence later stand performance.
Future research should therefore focus on multi-site validation, temporal modelling, integration of additional environmental datasets (including soil properties), and optimisation of treatment prescriptions. Expansion to multiple plantation species and environmental settings would further improve understanding of the generality of the observed relationships and support development of operationally deployable establishment-risk prediction systems.
5. Conclusions
This study demonstrates that plantation establishment outcomes at approximately 21 months can be predicted in advance using environmental, structural, and operational information derived entirely from pre-planting UAV observations. By combining stocking density and tree height into a composite establishment index, the analysis captures both survival and growth performance, providing a more comprehensive measure of establishment success than stocking density alone.
The ridge-regularised logistic regression model achieved strong predictive performance under blocked spatial cross-validation (AUC = 0.904 ± 0.004), indicating reliable discrimination between successful and poor establishment areas. Predictor contributions revealed that moisture availability, microsite heterogeneity, vegetation competition, and operational treatments were the dominant processes influencing establishment outcomes. The unusually dry conditions experienced during the establishment period further emphasised the importance of moisture-related controls on seedling survival and growth.
Spatial predictions identified coherent patterns of establishment risk across the plantation, demonstrating the potential for proactive management interventions, including treatment optimisation, targeted replanting, and site-preparation adjustments. Importantly, all predictors were measured before planting, allowing establishment risk to be identified well in advance of operational assessment.
Although the current study was conducted at a single site, the framework is readily transferable to other plantation environments and can be extended to incorporate additional environmental, operational, and temporal predictors. The results demonstrate that a substantial component of plantation performance is already encoded in pre-planting site conditions, providing a practical foundation for proactive establishment-risk forecasting and treatment optimisation in plantation forestry.
Author Contributions
Conceptualization, A. Finn, J. O’Hehir, B. Jenkin, and N. Winkley; methodology, A. Finn; software, A. Finn and P. Skelton; validation, A. Finn and D. Schebella.; formal analysis, A. Finn, P. Skelton; investigation, A. Finn; data curation, A. Finn and P. Skelton; writing—original draft preparation, A. Finn; writing—review and editing, P. Skelton, N. Winkley, J. O’Hehir, P. Skelton, and B. Jenkin; project administration, J. O’Hehir; funding acquisition, J. O’Hehir, B. Jenkin. All authors have read and agreed to the published version of the manuscript.
Funding
This study was funded by Forest & Wood Products Australia (FWPA) under Research Agreement: NIF199-2223, “Enhancing softwood and hardwood plantations site productivity and subsequent operational efficiency by use of an innovative clean-row establishment system”.
Data Availability Statement
Data is available on application to the corresponding author.
Acknowledgments
We are grateful to Steven Andriolo of EyeSky for conducting the drone operations in South Australia and Victoria, to Rohan Rainbow of Crop Protection Australia who provided precision forestry, engineering, and soil measurement advice to this project, and to Australian Bluegum Plantations (ABP), OneFortyOne (OFO), Midway Limited, PF Olsen (PFO), and Green Triangle Forest Products (GTFP) for assisting us with this study. The authors also thank HxGN SmartNet for providing access to their GNSS NTRIP correction services, which were utilised during data collection, free of charge for educational research purposes. During the preparation of this manuscript, the authors used ChatGPT (version 1.2026.133) to convert the graphics generated by MATLAB and themselves into a publishable form and to review this preliminary draft. The authors have reviewed and edited the output and take full responsibility for the content of this publication.
Conflicts of Interest
The authors declare no conflicts of interest. The funders had no role in the design of the study; in the collection, analyses, or interpretation of data; in the writing of the manuscript; or in the decision to publish the results.
Abbreviations
The following abbreviations are used in this manuscript:
| RDMI | Ratio dryness monitoring index |
| NRCT | Normalised relative temperature difference |
| NDVI | Normalised difference vegetation index |
| PDI | Perpendicular dryness index |
| DEM | Digital elevation model |
| HAG | Height above ground |
| PSD | Power spectral density |
| UAV | Unmanned aerial vehicle |
| AUC | Area under the ROC curve |
| ROC | Receiver operating characteristic |
| PINT | Program for identifying nursery trees |
| RGB | Red, green, and blue |
| SD | Standard deviation |
References
- Eckert, M.; et al. Short-term arthropod recovery in Eucalyptus plantations after harvesting is not affected by different residue management practices. For. Ecol. Manag. 2023, 537, 120973. [Google Scholar] [CrossRef]
- Zielonka, T.; Niklasson, M. Dynamics of dead wood and regeneration pattern in natural spruce forest in the Tatra Mountains, Poland. Ecol. Bull. 2001, 159–163. [Google Scholar]
- Franco, C.R.; Page-Dumroese, D.S.; Archuleta, J. Forest management and biochar for continued ecosystem services. J. Soil Water Conserv. 2022, 77(4), 60A–64A. [Google Scholar]
- Motta, R.; et al. Coarse woody debris, forest structure and regeneration in the Valbona Forest Reserve, Paneveggio, Italian Alps. For. Ecol. Manag. 2006, 235(1-3), 155–163. [Google Scholar] [CrossRef]
- Bače, R.; et al. Natural regeneration in Central-European subalpine spruce forests: Which logs are suitable for seedling recruitment? For. Ecol. Manag. 2012, 266, 254–262. [Google Scholar] [CrossRef]
- Becker, R.M.; Keefe, R.F. Prediction of Fuel Loading Following Mastication Treatments in Forest Stands in North Idaho, USA. Sustainability 2020, 12(17), 7025. [Google Scholar] [CrossRef]
- Jain, T.; et al. To masticate or not: Useful tips for treating forest, woodland, and shrubland vegetation; U.S. Department of Agriculture, Forest Service, Rocky Mountain Research Station, 2018. [Google Scholar]
- Ghaffariyan, M.R. Short review of collecting technologies and methods in forest harvesting residues recovery. Silva Balc. 2023, 24(1). [Google Scholar] [CrossRef]
- Yoshioka, T. Current Situation and Future Outlook of Forest Biomass Production and Its Utilization in Japan, in Biotechnological Applications of Biomass; Peixoto Basso, T., Basso, T.O., Basso, L.C., Eds.; IntechOpen: Rijeka, 2020. [Google Scholar]
- Hall, P.; et al. Processing options to increase the use of post-harvest residues on the East Coast. SCION report, 2019. [Google Scholar]
- Alberts, E.; Neibling, W.H. Influence of crop residues on water erosion; 1994. [Google Scholar]
- Daughtry, C.S. Discriminating crop residues from soil by shortwave infrared reflectance. Agron. J. 2001, 93(1), 125–131. [Google Scholar] [CrossRef]
- Janowiak, M.K.; Webster, C.R. Promoting ecological sustainability in woody biomass harvesting. J. For. 2010, 108(1), 16–23. [Google Scholar] [CrossRef]
- Udali, A.; et al. Managing harvesting residues: a systematic review of management treatments around the world. For. An. Int. J. For. Res. 2025, 98(2), 117–135. [Google Scholar]
- Lal, R. Biofuels From Crop Residues 2007. [CrossRef]
- Nambiar, E.; Sands, R. Effects of compaction and simulated root channels in the subsoil on root development, water uptake and growth of radiata pine. Tree Physiol. 1992, 10(3), 297–306. [Google Scholar] [CrossRef] [PubMed]
- Costantini, A.; Doley, D. Management of compaction during harvest of Pinus plantations in Queensland: III. Preliminary investigation of the potential for selected soil parameters to predict rut compaction. Aust. For. 2001, 64(3), 193–198. [Google Scholar] [CrossRef]
- Davis, M.B.; Shaw, R.G. Range shifts and adaptive responses to Quaternary climate change. Science 2001, 292(5517), 673–679. [Google Scholar] [CrossRef] [PubMed]
- Anderson-Teixeira, K.J.; et al. CTFS-Forest GEO: a worldwide network monitoring forests in an era of global change. Glob. Change Biol. 2015, 21(2), 528–549. [Google Scholar]
- Stevens-Rumann, C.S.; et al. Evidence for declining forest resilience to wildfires under climate change. Ecol. Lett. 2018, 21(2), 243–252. [Google Scholar] [PubMed]
- Liu, H.; et al. Habitat heterogeneity and biotic interactions mediate climate influences on seedling survival in a temperate forest. For. Ecosyst. 2023, 10, 100138. [Google Scholar] [CrossRef]
- Grossnickle, S.C. Why seedlings survive: influence of plant attributes. New For. 2012, 43(5), 711–738. [Google Scholar] [CrossRef]
- Grossnickle, S.C.; MacDonald, J.E. Why seedlings grow: influence of plant attributes. New For. 2018, 49(1), 1–34. [Google Scholar]
- Grossnickle, S.C.; MacDonald, J.E. Seedling Quality: History, Application, and Plant Attributes. Forests 2018, 9(5), 283. [Google Scholar] [CrossRef]
- Close, D.C. A review of ecophysiologically-based seedling specifications for temperate Australian eucalypt plantations. New For. 2012, 43(5), 739–753. [Google Scholar] [CrossRef]
- Curran, T.J.; Clarke, P.J.; Warwick, N.W.M. Drought survival of Australian rainforest seedlings is influenced by species evolutionary history and soil type. Aust. J. Bot. 2013, 61(1), 22–28. [Google Scholar] [CrossRef]
- Charles, L.S.; et al. Species wood density and the location of planted seedlings drive early-stage seedling survival during tropical forest restoration. J. Appl. Ecol. 2018, 55(2), 1009–1018. [Google Scholar]
- Mankur, M.; S. Shil, P. Forest Restoration and Reforestation: Best Practices and Challenges; 2023; pp. 147–179. [Google Scholar]
- Preece, N.D.; van Oosterzee, P.; Lawes, M.J. Reforestation success can be enhanced by improving tree planting methods. J. Environ. Manag. 2023, 336, 117645. [Google Scholar] [CrossRef]
- Grossnickle, S.C.; Ivetić, V. Root system development and field establishment: effect of seedling quality. New For. 2022, 53(6), 1021–1067. [Google Scholar] [CrossRef]
- Zou, C.; et al. Effects of soil air-filled porosity, soil matric potential and soil strength on primary root growth of radiata pine seedlings. Plant Soil 2001, 236(1), 105–115. [Google Scholar] [CrossRef]
- Iglhaut, J.; et al. Structure from motion photogrammetry in forestry: A review. Curr. For. Rep. 2019, 5(3), 155–168. [Google Scholar] [CrossRef]
- Torresan, C.; et al. Remote sensing technologies for assessing climate-smart criteria in mountain forests, in Climate-smart forestry in mountain regions; Springer, 2021; pp. 399–433. [Google Scholar]
- Goodbody, T.R.; et al. Unmanned aerial systems for precision forest inventory purposes: A review and case study. For. Chron. 2017, 93(1), 71–81. [Google Scholar] [CrossRef]
- Finn, A.; Kumar, P.; Peters, S.; O'Hehir, J. Unsupervised Spectral-Spatial Processing of Drone Imagery for Identification of Pine Seedlings. ISPRS J. Photogramm. Remote Sens. 2022, 183, 363–388. [Google Scholar] [CrossRef]
- Finn, A.; Skelton, P.; O'Hehir, J.; Schebella, D.; Jenkins, B. Enhancing softwood and hardwood plantations site productivity and subsequent operational efficiency by use of an innovative clean-row establishment 'system': Survival Analysis at 21 Months, in Research Agreement: NIF199-2223. 2026, NIFPI.
- Finn, A.; Skelton, P.; O'Hehir, J.; Schebella, D.; Jenkins, B. Enhancing softwood and hardwood plantations site productivity and subsequent operational efficiency by use of an innovative clean-row establishment 'system': Survival Analysis at 16 Months, in Research Agreement: NIF199-2223. 2025, NIFPI.
- Roberts, D.R.; et al. Cross-validation strategies for data with temporal, spatial, hierarchical, or phylogenetic structure. Ecography 2017, 40(8), 913–929. [Google Scholar] [CrossRef]
- Valavi, R.; et al. blockCV: An r package for generating spatially or environmentally separated folds for k-fold cross-validation of species distribution models. Biorxiv 2018, 357798. [Google Scholar]
- Whelan, A.W.; et al. Improving generalized models of forest structure in complex forest types using area- and voxel-based approaches from lidar. Remote Sens. Environ. 2023, 284, 113362. [Google Scholar]
- Skelton, P.; Finn, A.; Winkley, N.; O'Hehir, J. Final report for Project VNC619-2324 ("Operationalisation of PINT and Incorporation of Weed Identification"). 2026. [CrossRef]
- Aussenac, G. Interactions between forest stands and microclimate: ecophysiological aspects and consequences for silviculture. Ann. For. Sci. 2000, 57(3), 287–301. [Google Scholar] [CrossRef]
- Prescott, C.E. The influence of the forest canopy on nutrient cycling. Tree Physiol. 2002, 22(15-16), 1193–1200. [Google Scholar] [CrossRef] [PubMed]
- Fleming, R.L.; et al. Effects of organic matter removal, soil compaction, and vegetation control on 5-year seedling performance: a regional comparison of Long-Term Soil Productivity sites. Can. J. For. Res. 2006, 36(3), 529–550. [Google Scholar] [CrossRef]
- Walmsley, J.; Godbold, D. Stump harvesting for bioenergy–a review of the environmental impacts. Forestry 2010, 83(1), 17–38. [Google Scholar]
- Xu, H.; et al. Regionalized Life Cycle Greenhouse Gas Emissions of Forest Biomass Use for Electricity Generation in the United States. Environ. Sci. Technol. 2021, 55(21), 14806–14816. [Google Scholar] [CrossRef] [PubMed]
- Skovsgaard, J.P.; et al. Effects of Thinning Practice, High Pruning and Slash Management on Crop Tree and Stand Growth in Young Even-Aged Stands of Planted Silver Birch (Betula pendula Roth). Forests 2021, 12(2), 225. [Google Scholar] [CrossRef]
- Littlefield, C.E. Topography and post-fire climatic conditions shape spatio-temporal patterns of conifer establishment and growth. Fire Ecol. 2019, 15(1), 34.
- Dandois, J.P.; Ellis, E.C. High spatial resolution three-dimensional mapping of vegetation spectral dynamics using computer vision. Remote Sens. Environ. 2013, 136, 259–276. [Google Scholar] [CrossRef]
- Guimarães, N.; et al. Forestry Remote Sensing from Unmanned Aerial Vehicles: A Review Focusing on the Data, Processing and Potentialities. Remote Sens. 2020, 12(6), 1046. [Google Scholar] [CrossRef]
- Finn, A.; Younger, J.; Peters, S.; O’Hehir, J.; Lucieer, A.; Turner, D. Geospatial Positioning & Fusion: is real-time sub-metre, accuracy operationally feasible in forestry environments? Milestone 6: 3D Point Cloud Fusion Using Aerial and Terrestrial Laser Scanning; Forest & Wood Products Association, 2024; p. 97. [Google Scholar]
- Finn, A.; Younger, J.; Peters, S.; O’Hehir, J.; Lucieer, A.; Turner, D. Geospatial Positioning & Fusion: is real-time sub-metre, accuracy operationally feasible in forestry environments? Recommendations for Field Testing GNSS Receivers in Forests; Forest & Wood Products Association, 2025; p. 11. [Google Scholar]
- Valavi, R.; et al. block CV: An r package for generating spatially or environmentally separated folds for k-fold cross-validation of species distribution models. Methods Ecol. Evol. 2019, 10(2), 225–232. [Google Scholar]
- Landis, T.D.; et al. The container tree nursery manual: seedling processing, storage, and outplanting; US Department of Agriculture, Forest Service, 1990. [Google Scholar]
- Grossnickle, S.C. Importance of root growth in overcoming planting stress. New For. 2005, 30(2), 273–294. [Google Scholar] [CrossRef]
- Harris, L.B.; Woodall, C.W.; D'Amato, A.W. Increasing the utility of tree regeneration inventories: Linking seedling abundance to sapling recruitment. Ecol. Indic. 2022, 145, 109654. [Google Scholar] [CrossRef]
- Finn, A.; O'Hehir, J.; Schebella, D.; Jenkins, B. Enhancing softwood and hardwood plantations site productivity and subsequent operational efficiency by use of an innovative clean-row establishment 'system': Milestone 2C: Multispectral Assessment of Treatments for Tillage and Forestry Harvesting Residues, in Research Agreement: NIF199-2223. 2024, NIFPI.
Figure 1.
Location of sites involved in the broader cleanstrips project in the Green Triangle near South Australian and Victorian border. Blue markers indicate hardwood sites, green markers softwood sites. Mount Graham (red circle) is a softwood site at which cleanstrip treatments B, C, D, E, G, and H were applied.
Figure 1.
Location of sites involved in the broader cleanstrips project in the Green Triangle near South Australian and Victorian border. Blue markers indicate hardwood sites, green markers softwood sites. Mount Graham (red circle) is a softwood site at which cleanstrip treatments B, C, D, E, G, and H were applied.
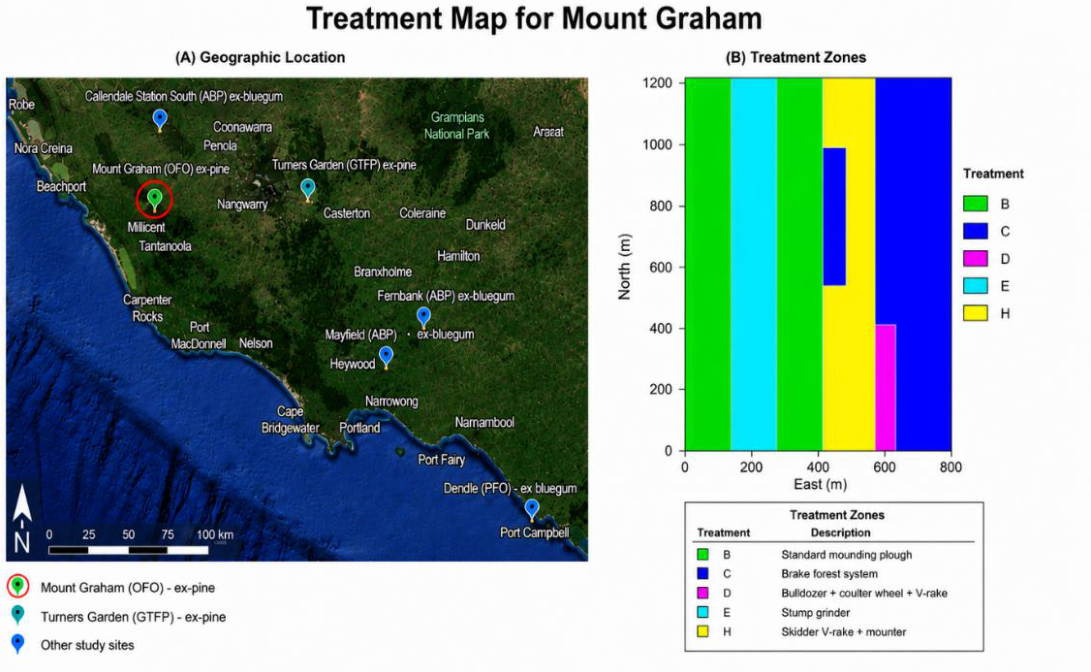
Figure 2.
Rainfall during early plantation establishment.
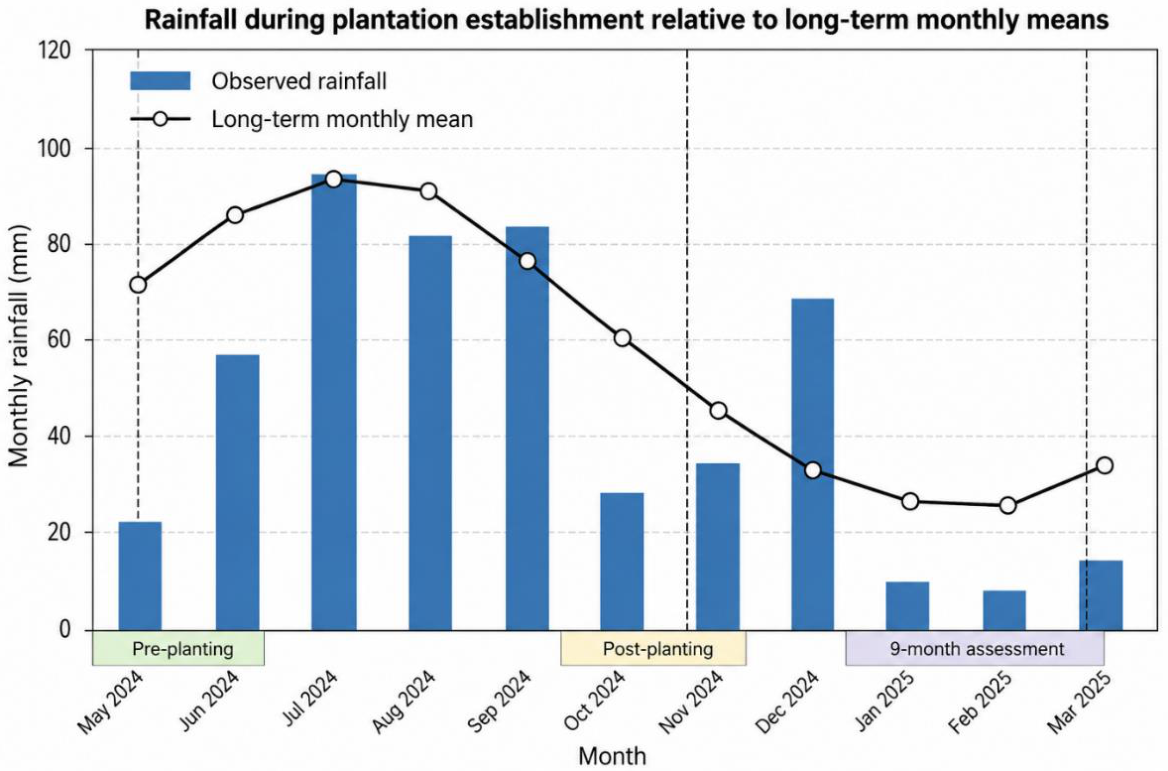
Figure 3.
(A) Tree and (B) weed detection performance of PINT on test sites (from [41]).
Figure 3.
(A) Tree and (B) weed detection performance of PINT on test sites (from [41]).
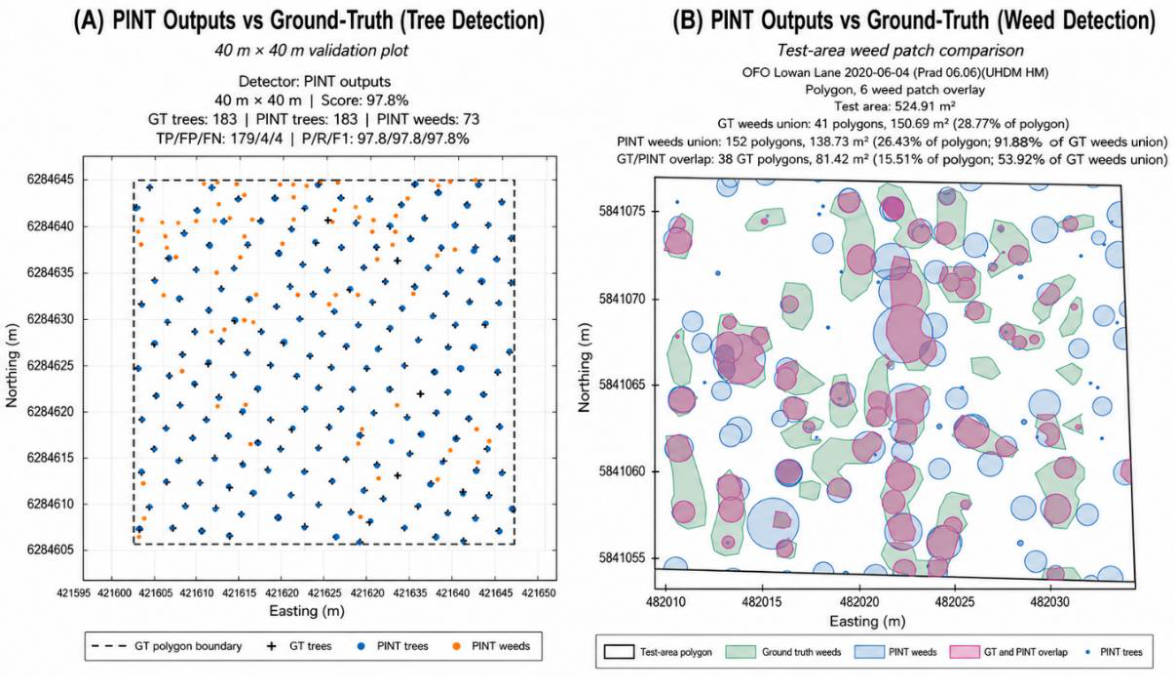
Figure 4.
Predictor correlation matrix showing pairwise Pearson correlation coefficients among the principal environmental, vegetation, terrain, and operational predictors used in the plantation establishment model.
Figure 4.
Predictor correlation matrix showing pairwise Pearson correlation coefficients among the principal environmental, vegetation, terrain, and operational predictors used in the plantation establishment model.
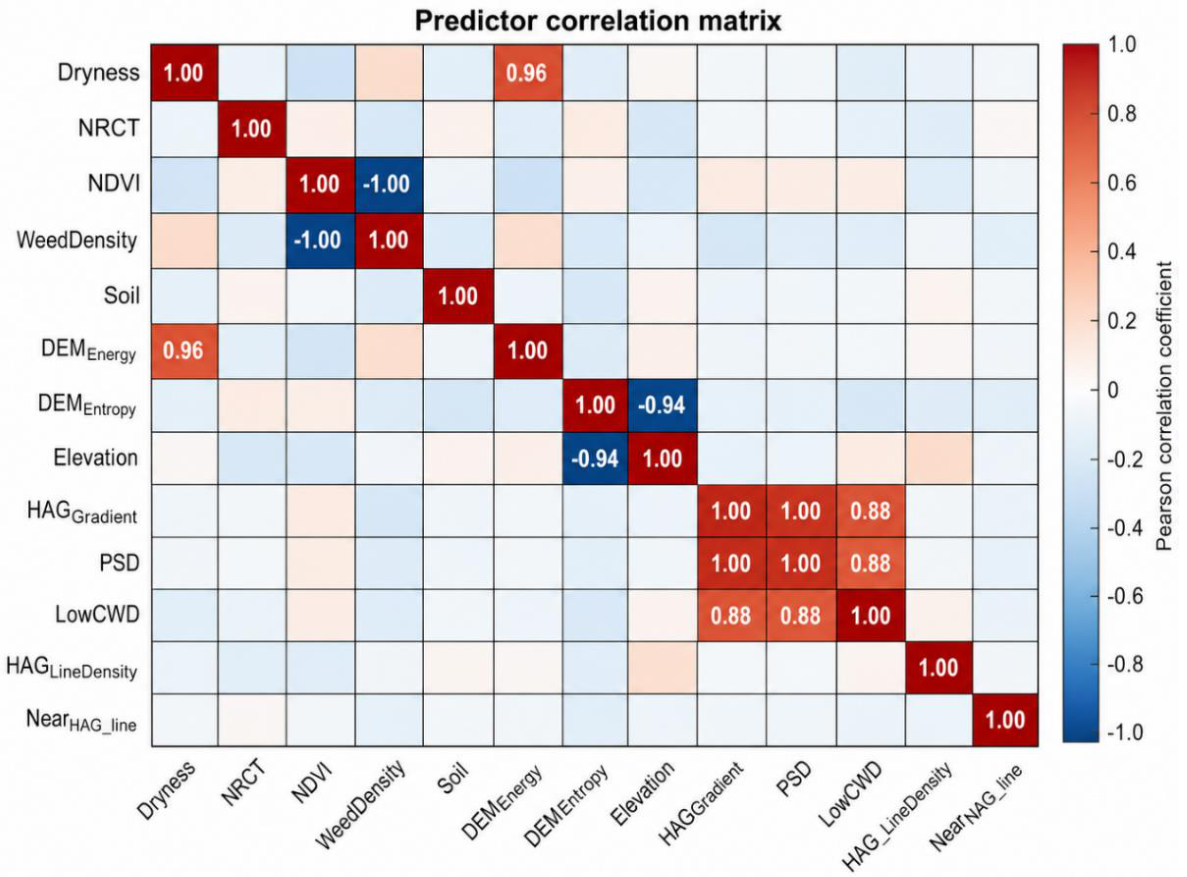
Figure 5.
Schematic representation of blocked spatial cross-validation used for model evaluation. The modelling domain was partitioned into five geographically contiguous folds. During each iteration, one-fold was withheld for validation while the remaining folds were used for model training.
Figure 5.
Schematic representation of blocked spatial cross-validation used for model evaluation. The modelling domain was partitioned into five geographically contiguous folds. During each iteration, one-fold was withheld for validation while the remaining folds were used for model training.
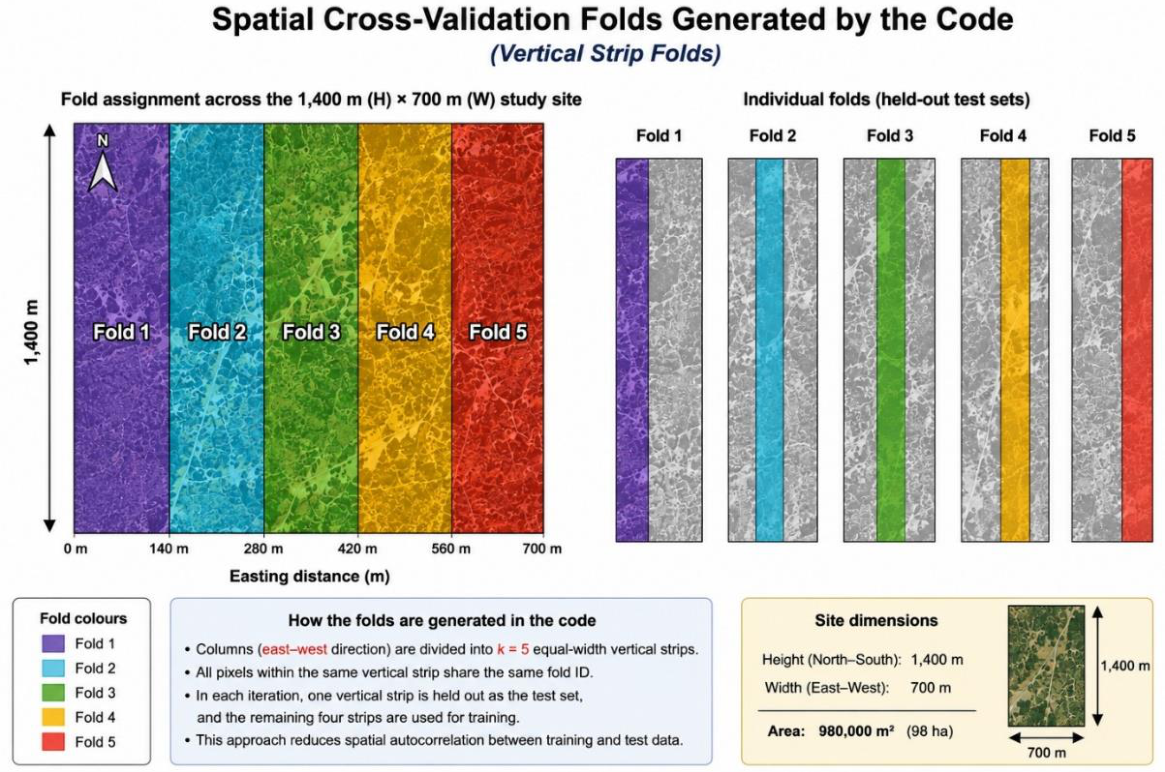
Figure 6.
Workflow of the spatial plantation establishment modelling framework developed in this study.
Figure 6.
Workflow of the spatial plantation establishment modelling framework developed in this study.
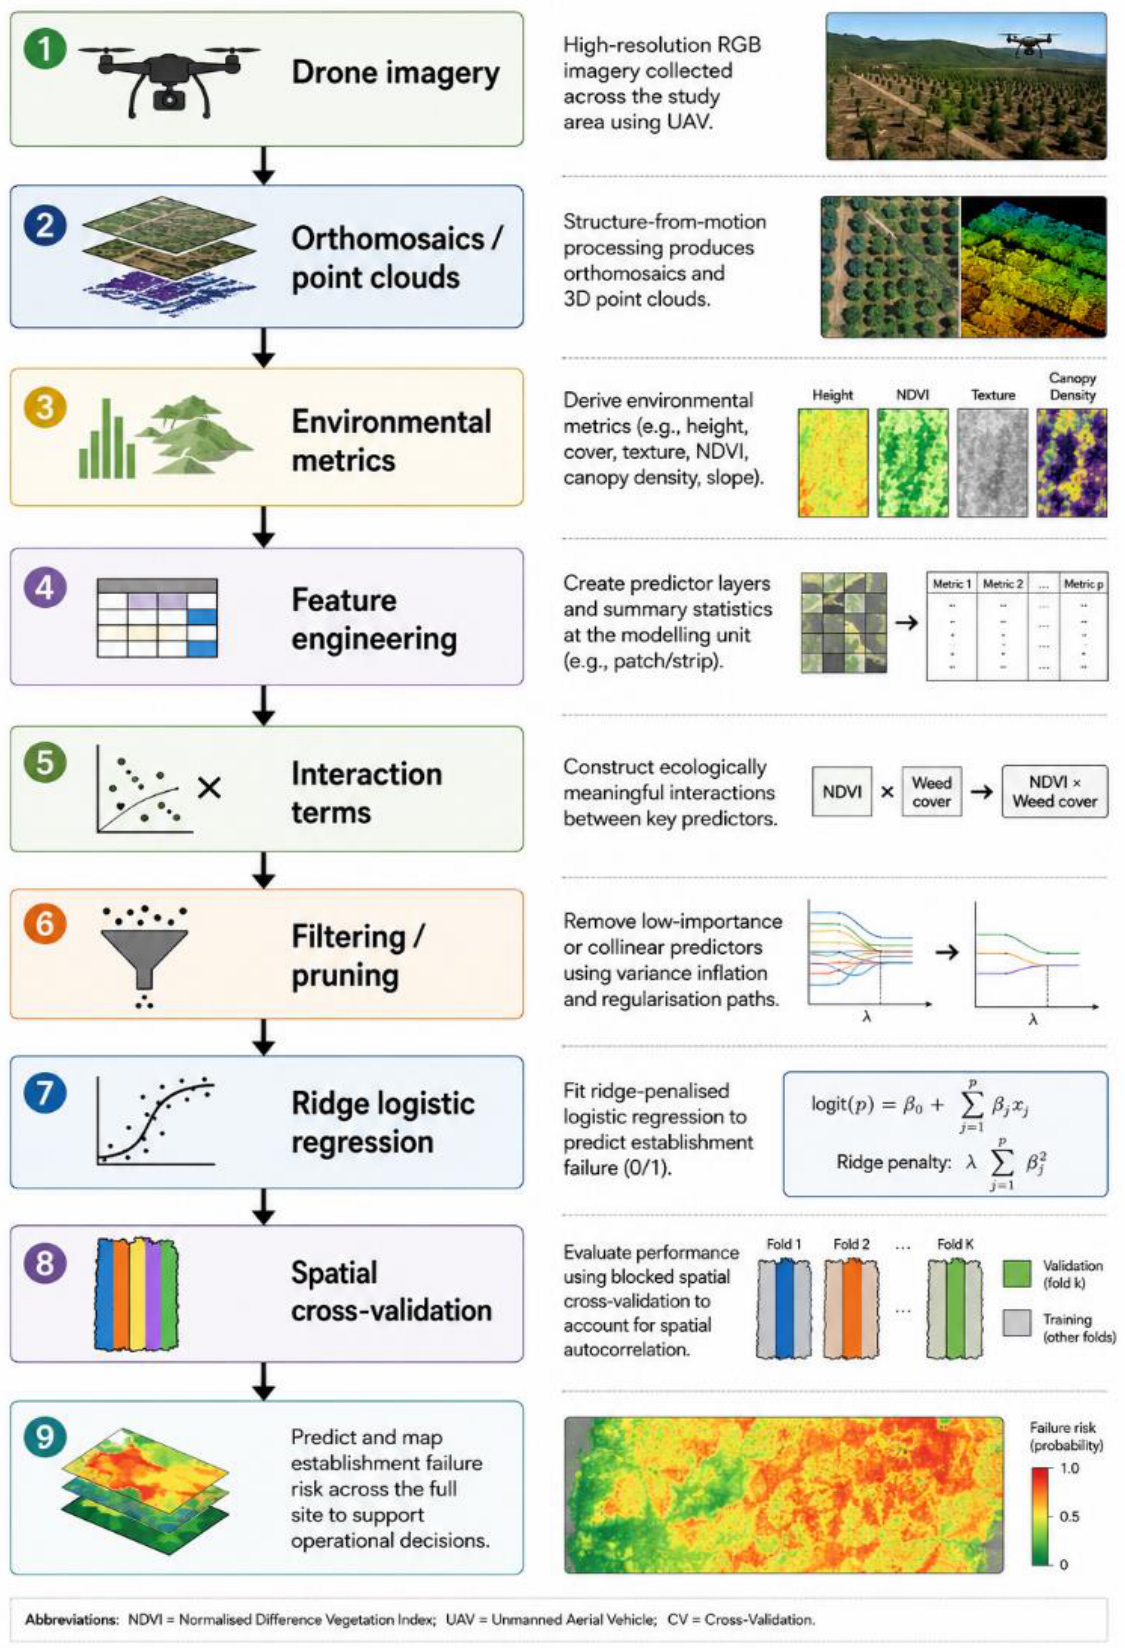
Figure 7.
Tree density (left) and tree height at Mount Graham, derived from the March 2026 campaign.
Figure 7.
Tree density (left) and tree height at Mount Graham, derived from the March 2026 campaign.
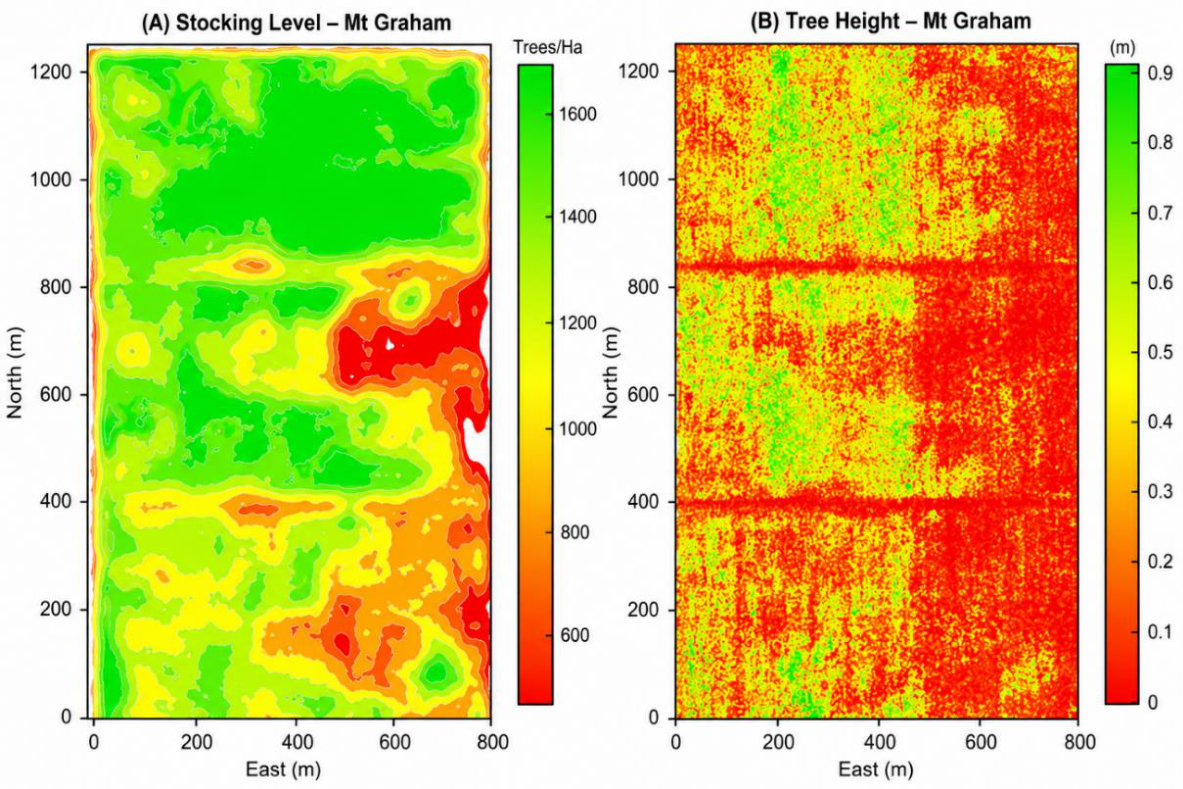
Figure 8.
Predicted establishment-failure probability (left) and establishment index (right) for Mount Graham site. Elevated failure probabilities correspond closely with areas exhibiting reduced establishment-index values.
Figure 8.
Predicted establishment-failure probability (left) and establishment index (right) for Mount Graham site. Elevated failure probabilities correspond closely with areas exhibiting reduced establishment-index values.
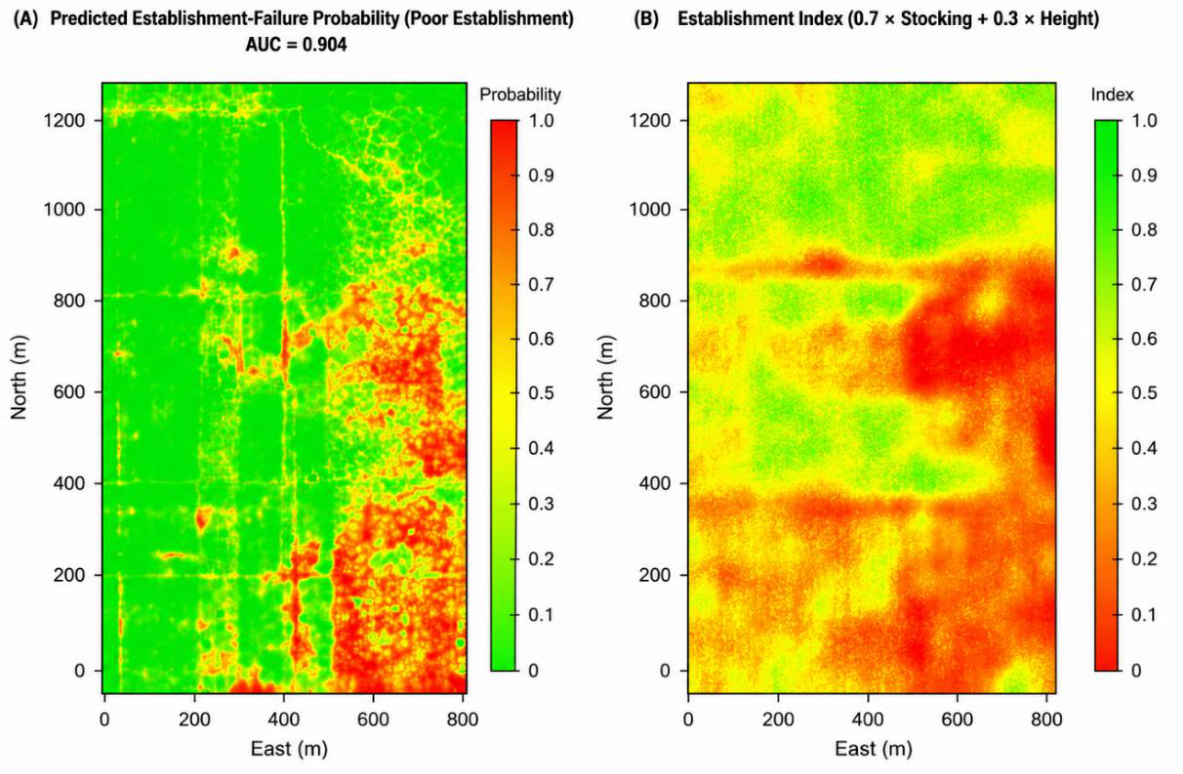
Figure 9.
Poor establishment risk classification map. Predicted probabilities were converted into ordinal risk classes based on quantiles: low (≤25th percentile), moderate (25–50th), high (50–75th), and very high (>75th).
Figure 9.
Poor establishment risk classification map. Predicted probabilities were converted into ordinal risk classes based on quantiles: low (≤25th percentile), moderate (25–50th), high (50–75th), and very high (>75th).
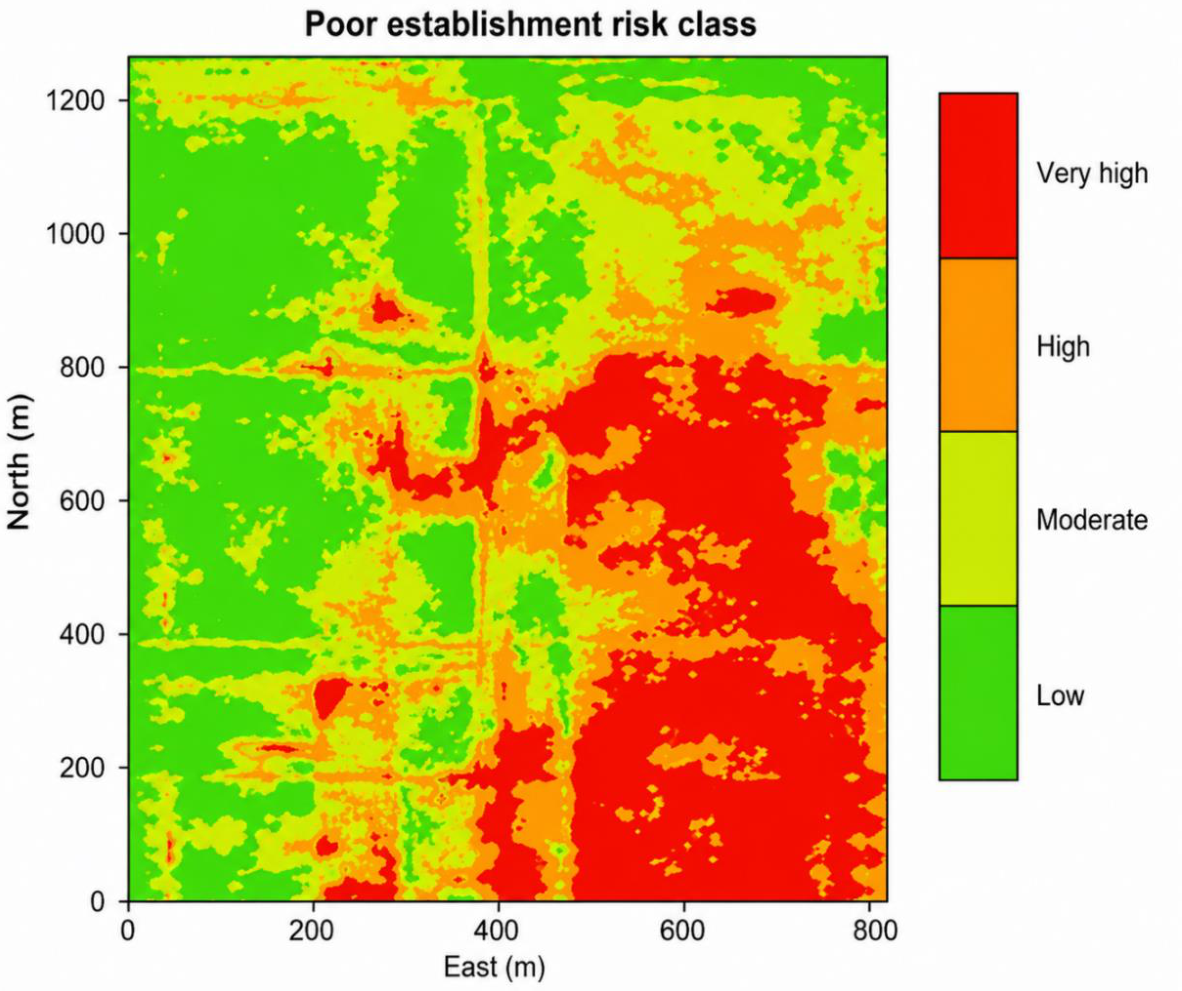
Figure 10.
Calibration curve (left) and Receiver Operating Characteristic (ROC) curve (right). The Brier score quantifies the mean squared difference between predicted probabilities and observed outcomes. The ROC curve shows the predictive performance of the ridge-regularised establishment-failure model under blocked spatial CV.
Figure 10.
Calibration curve (left) and Receiver Operating Characteristic (ROC) curve (right). The Brier score quantifies the mean squared difference between predicted probabilities and observed outcomes. The ROC curve shows the predictive performance of the ridge-regularised establishment-failure model under blocked spatial CV.
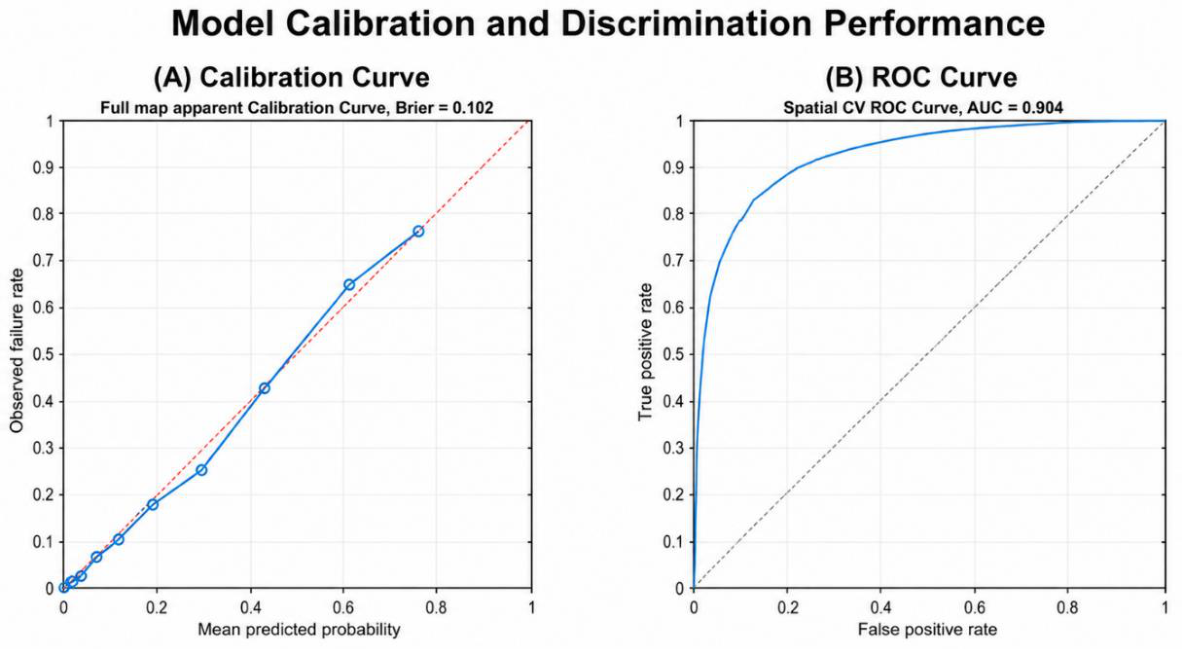
Figure 11.
Spatial uncertainty in predicted establishment-failure probability, calculated as the standard deviation of pixel-level predictions across the five blocked spatial CV models. Lower values indicate stronger agreement, while higher values indicate areas where predictions were more sensitive to training-fold composition.
Figure 11.
Spatial uncertainty in predicted establishment-failure probability, calculated as the standard deviation of pixel-level predictions across the five blocked spatial CV models. Lower values indicate stronger agreement, while higher values indicate areas where predictions were more sensitive to training-fold composition.
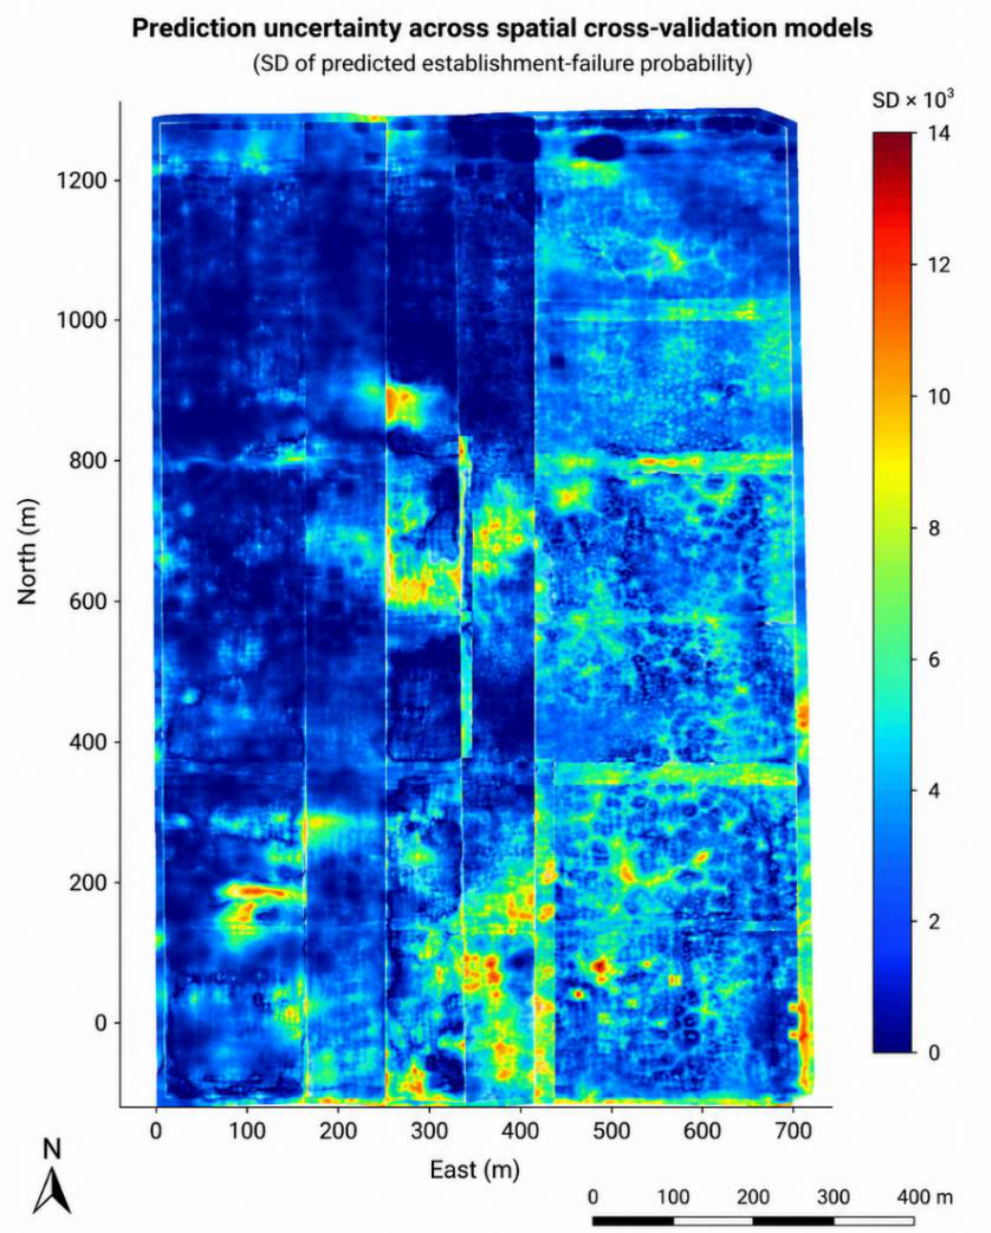
Figure 12.
Relative contribution of ecological and operational process groups to establishment-failure prediction. Predictor contributions were aggregated into moisture, vegetation, structural, operational, and interaction categories.
Figure 12.
Relative contribution of ecological and operational process groups to establishment-failure prediction. Predictor contributions were aggregated into moisture, vegetation, structural, operational, and interaction categories.
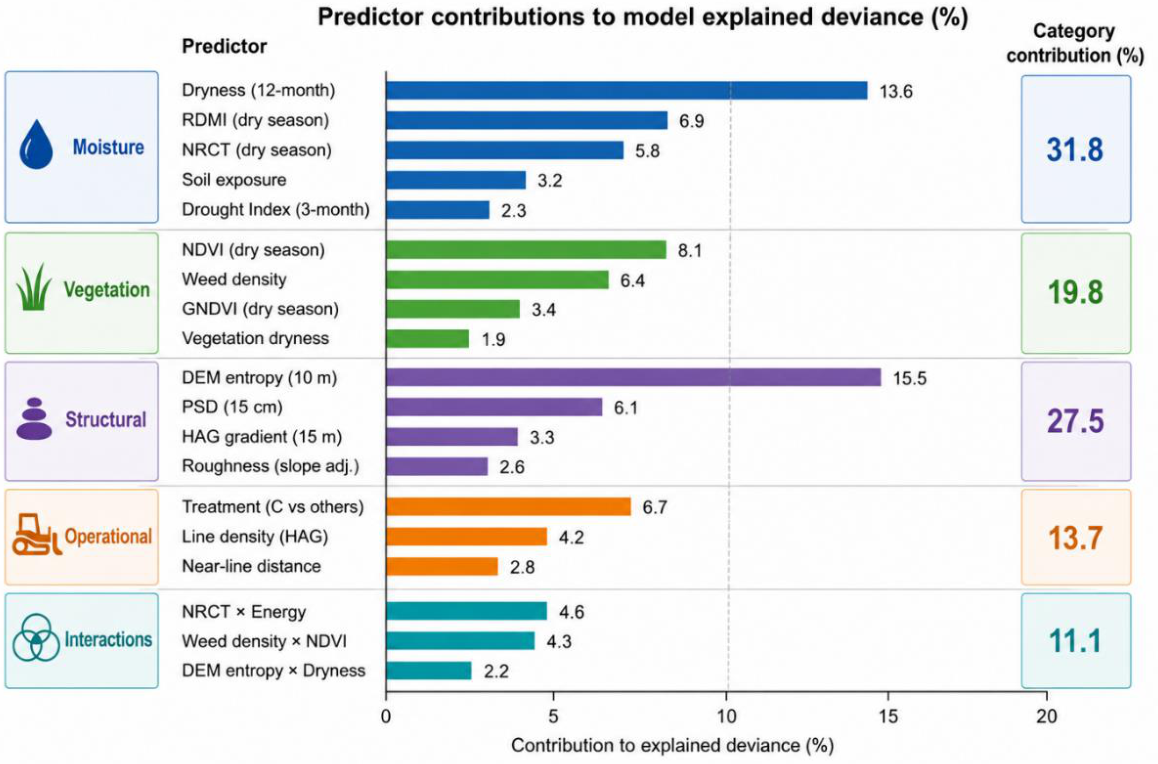
Figure 13.
Boxplot of establishment index by soil group. MB = Mount Burr Sand, MM = Mount Muir Sand, YS = Young Sand, and HS = Hindmarsh Sandy Loam. Red Basaltic was not represented within the analysed raster area.
Figure 13.
Boxplot of establishment index by soil group. MB = Mount Burr Sand, MM = Mount Muir Sand, YS = Young Sand, and HS = Hindmarsh Sandy Loam. Red Basaltic was not represented within the analysed raster area.
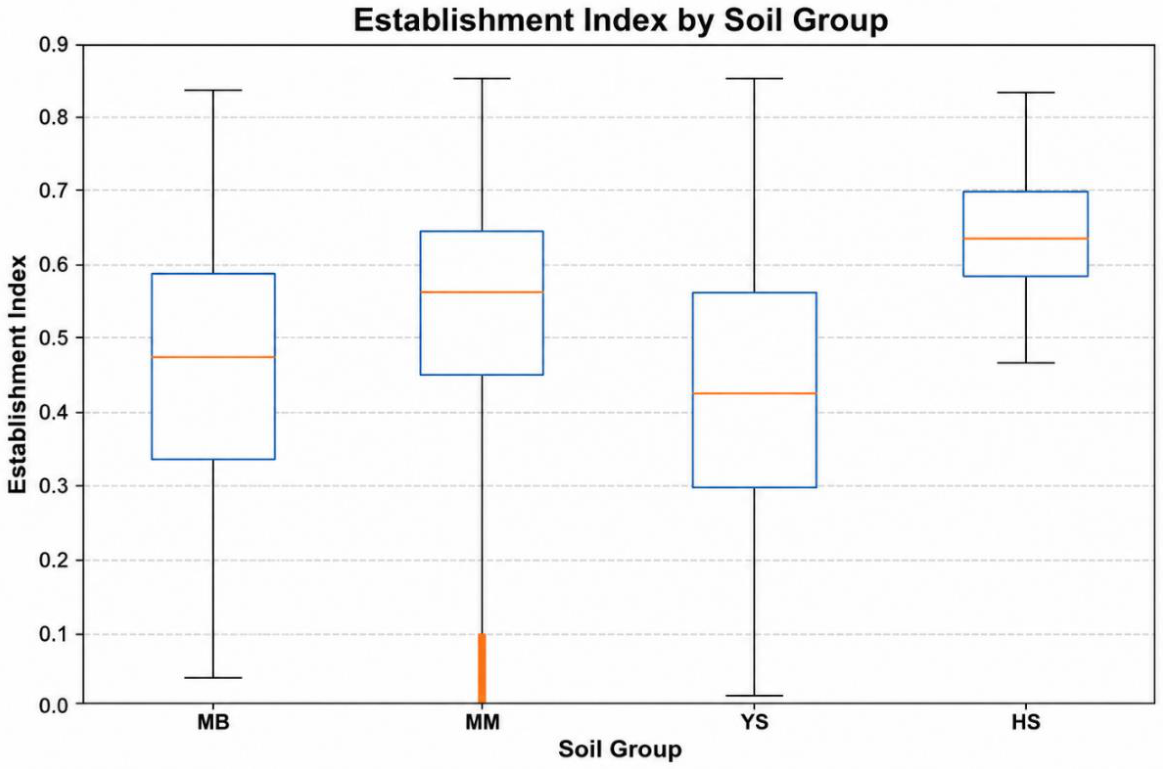
Figure 14.
Comparison of mean predicted failure probabilities.
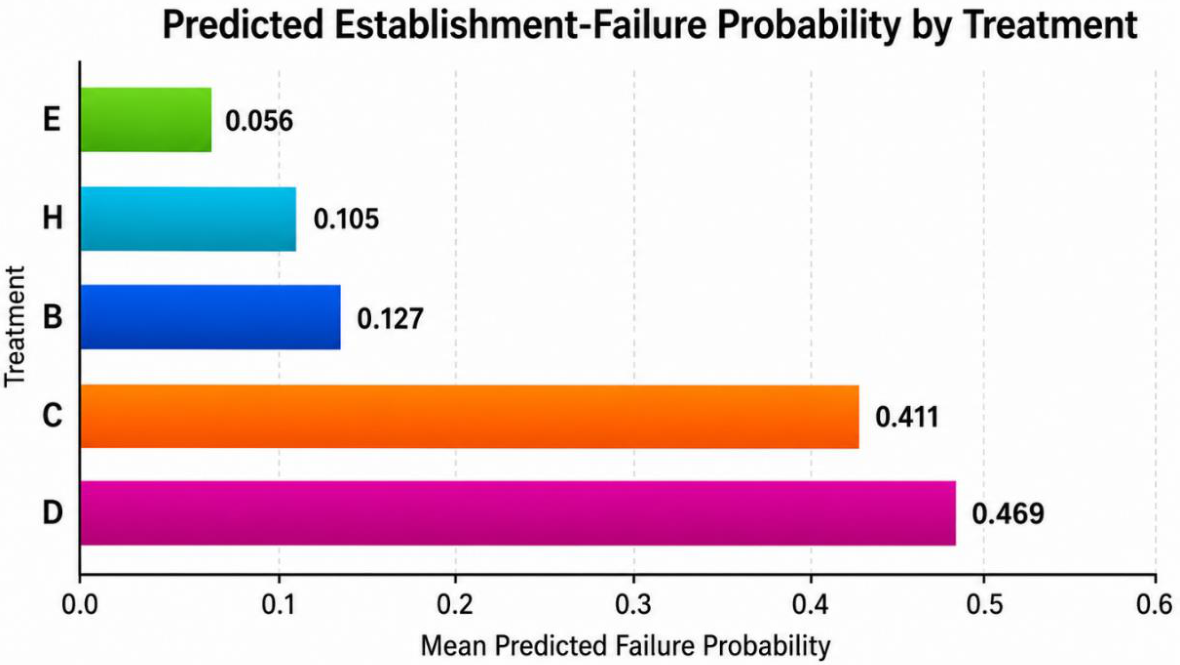
Figure 15.
Comparison of treatment zones and predicted poor-establishment risk classes across the Mount Graham study area. Dashed lines indicate treatment boundaries.
Figure 15.
Comparison of treatment zones and predicted poor-establishment risk classes across the Mount Graham study area. Dashed lines indicate treatment boundaries.
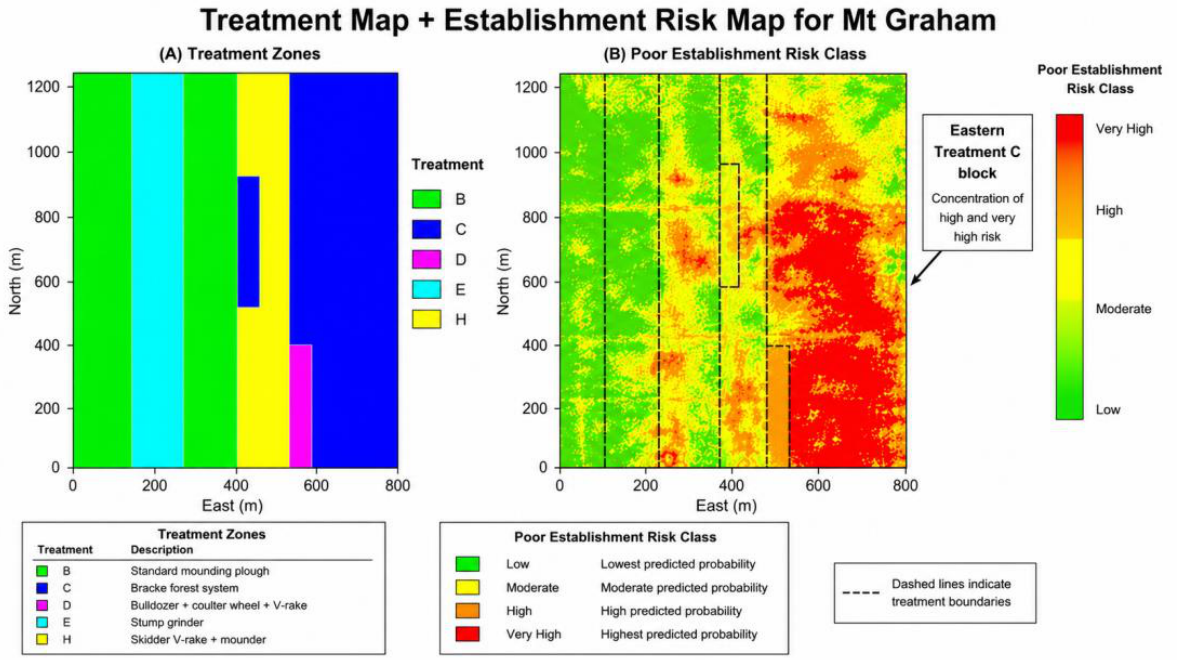
Table 1.
Description of treatments and variants. Treatments A, F, and G were not applied at the Mount Graham site used in this study.
Table 1.
Description of treatments and variants. Treatments A, F, and G were not applied at the Mount Graham site used in this study.
| Implement | Description | Treatments | |||||||
| Non-clean strip | Clean-strip systems | ||||||||
| A | B | C | D | E | F | G | H | ||
| Chopper roller | A standard method of harvest residue management (control treatment: single or double roller) | X | X | X | |||||
| Standard mounding plough | After chopper rolling and where there are site issues requiring amelioration, e.g. poor drainage (control treatment: mounding system after chopper rolling.) | X | |||||||
| Bracke Forest system | Mattock wheel mounding or disc wheel scarification (control treatment: with or without chopper rolling.) | X | |||||||
| Bulldozer: coulter wheel and V-rake | V-blade shears off eucalyptus coppice and high stumps, then a coulter wheel crosscuts the larger harvest residues prior to sweeping them aside with V rakes. | X | X | ||||||
| Stump grinder | The stumps are ground to below the ground surface to reduce the risk of machine snagging and allow re-setting of row spacing. | X | X | ||||||
| Skidder: V-rake and mounder | For lighter harvest residues sites, v-rake residues aside and then mound the clean-row | X | X | X | |||||
Table 3.
Distribution of plantation risk.
| Risk class | Approximate proportion of site |
| Low risk | ~34% |
| Moderate risk | ~23% |
| High risk | ~21% |
| Very high risk | ~22% |
Table 4.
AUC obtained for each fold during five-fold blocked spatial cross-validation. Consistently high performance across geographically independent validation folds indicates stable model transferability and limited inflation of predictive accuracy due to spatial autocorrelation.
Table 4.
AUC obtained for each fold during five-fold blocked spatial cross-validation. Consistently high performance across geographically independent validation folds indicates stable model transferability and limited inflation of predictive accuracy due to spatial autocorrelation.
| Fold | AUC |
| 1 | 0.909 |
| 2 | 0.901 |
| 3 | 0.907 |
| 4 | 0.903 |
| 5 | 0.901 |
| Mean ± SD | 0.904 ± 0.004 |
Table 5.
Predicted establishment-failure probability by soil group.
| Soil group | Mean failure probability | SD |
| Hindmarsh Sandy Loam (HS) | 0.021 | 0.020 |
| Mount Muir Sand (MM) | 0.112 | 0.168 |
| Mount Burr Sand (MB) | 0.260 | 0.295 |
| Young Sand (YS) | 0.312 | 0.269 |
| Red Basaltic (RB) | Not Present | – |
Disclaimer/Publisher’s Note: The statements, opinions and data contained in all publications are solely those of the individual author(s) and contributor(s) and not of MDPI and/or the editor(s). MDPI and/or the editor(s) disclaim responsibility for any injury to people or property resulting from any ideas, methods, instructions or products referred to in the content. |
© 2026 by the authors. Licensee MDPI, Basel, Switzerland. This article is an open access article distributed under the terms and conditions of the Creative Commons Attribution (CC BY) license (http://creativecommons.org/licenses/by/4.0/).
Copyright: This open access article is published under a Creative Commons CC BY 4.0 license, which permit the free download, distribution, and reuse, provided that the author and preprint are cited in any reuse.


