

Submitted:
03 July 2026
Posted:
06 July 2026
You are already at the latest version
Abstract
Background: Higher-immersion virtual reality (VR) systems are increasingly deployed across education, clinical care, gaming, and immersive journalism, but the extent, range, and nature of the peer-reviewed evidence linking system immersion to user outcomes has not been systematically mapped. Objective: This scoping review maps the peer-reviewed journal literature comparing higher- to lower-immersion VR conditions, characterising how the evidence is distributed across application domains, outcome constructs, measurement instruments, and study designs, and identifying knowledge gaps. Methods: Following the PRISMA Extension for Scoping Reviews (PRISMA-ScR), we searched five databases and screened 135 full-text reports. Eligibility was restricted to peer-reviewed journal articles (excluding preprints, conference proceedings, book chapters, and theses) reporting an empirical higher- vs. lower-immersion contrast with extractable quantitative outcome data. Data were charted descriptively; no inferential meta-analytic pooling or certainty rating was performed, consistent with scoping review methodology. Results: Forty-six journal articles met the inclusion criteria, of which 45 provided chartable effect-size data spanning 2019–2026. Evidence concentrated in Gaming and Entertainment (k = 16) and Education and Training (k = 14), with smaller bodies in Journalism and Prosocial Communication (k = 8) and Clinical and Rehabilitation (k = 7). Across studies, the standardised mean difference (Hedges’ g) had a median of 0.79 (range −0.98 to 3.79); 41 of 45 studies favoured the higher-immersion condition and 36 did so with confidence intervals excluding zero. Presence and immersion were the most frequently measured constructs (26/45); measurement instruments were heterogeneous. Conclusions: Peer-reviewed evidence consistently points toward higher system immersion enhancing user outcomes, especially presence-related constructs, but is methodologically fragmented, dominated by small between-subjects studies, and sparse in clinical contexts. The map identifies priorities for future confirmatory synthesis.
Keywords:
virtual reality
; system immersion
; presence
; scoping review
; PRISMA-ScR
; evidence mapping
; education
; clinical rehabilitation
; gaming
; immersive journalism
1. Introduction
Virtual reality (VR) technologies vary widely in the degree to which they envelop the user’s senses and substitute computer-generated stimuli for real-world perceptual input. This technical, objective property is captured by the construct of system immersion, defined by the extent of sensory substitution, the breadth and depth of sensory channels engaged, and the degree of supported interaction [1,2]. System immersion is conceptually distinguished from presence, the subjective sense of “being there” that immersive systems tend to elicit [3,4].
Across the past decade, empirical studies in education, clinical care, gaming, and journalism have compared higher-immersion VR (typically head-mounted displays with stereoscopic rendering and positional tracking) against lower-immersion comparators (desktop displays, flat-screen 360° video, or non-immersive simulations) on outcomes ranging from sense of presence to learning, symptom reduction, entertainment value, and attitude change. This literature is large, fast-growing, and dispersed across disciplines that use different terminology, measures, and reporting conventions.
Before a confirmatory effectiveness synthesis (e.g., a systematic review with meta-analysis) can be confidently scoped and interpreted, it is valuable to first map the field: to establish how much peer-reviewed evidence exists, where it is concentrated, what outcomes and instruments are used, how studies are designed, and where the gaps lie. Scoping reviews are the appropriate methodology for this descriptive mapping objective, as distinct from systematic reviews that appraise and pool evidence to answer a focused effectiveness question [5,6].
Prior reviews have addressed VR effectiveness for specific applications such as anxiety, pain, rehabilitation, and education. Most directly relevant, the meta-analysis of Cummings and Bailenson [2] quantified the effect of immersive technology on user presence and remains a foundational reference. The present review is deliberately distinct from that work in objective, scope, and method, and is intended to complement rather than duplicate it. First, its objective is to map rather than to pool: it characterises the extent, distribution, and nature of the evidence and identifies gaps, rather than estimating a single effect. Second, its scope is broader in application context—spanning education, clinical care, gaming, and journalism simultaneously, with system immersion as the focal independent variable across all four—while narrower in source type, being restricted to peer-reviewed journal articles. Third, it covers a more recent and rapidly expanding literature (2019–2026), the majority of which postdates earlier syntheses. To our knowledge, no prior review has mapped the peer-reviewed journal evidence on system immersion as the focal variable across these four domains together. A more recent network meta-analysis [48] examined immersion level specifically within cognitive-impairment populations, reporting that fully and partially immersive VR confer different benefits across cognitive domains; this reinforces that immersion effects are outcome- and population-dependent and motivates the broader, cross-domain mapping undertaken here.
Restricting the map to peer-reviewed journal articles—excluding preprints, conference proceedings, book chapters, and theses—ensures that the charted evidence has undergone external peer scrutiny and is indexed in stable, citable outlets, while acknowledging that this constraint omits the substantial early-stage VR literature disseminated through conference venues.
Using the Population–Concept–Context (PCC) framework recommended for scoping reviews [6], this review addresses the following objectives: (1) to map the volume and distribution of peer-reviewed journal evidence comparing higher- to lower-immersion VR conditions across four application domains; (2) to characterise the outcome constructs, measurement instruments, and study designs employed; (3) to describe the distribution and direction of reported effect sizes as a charted summary, without inferential pooling; and (4) to identify gaps and priorities for future research. The review is reported in accordance with the PRISMA Extension for Scoping Reviews (PRISMA-ScR) [7] and the formatting conventions of Virtual Worlds (MDPI).
2. Materials and Methods
This scoping review followed the methodological framework of Arksey and O’Malley [5] as refined by Levac et al. and the Joanna Briggs Institute [6], and is reported per PRISMA-ScR [7]. A completed PRISMA-ScR checklist is provided as Supplementary Material. The review protocol was not registered, and no separate protocol document was prepared in advance; scoping review protocols are not currently indexed by PROSPERO. The full methods underlying this review—including the data charting form, the per-database search strategies, and the eligibility criteria detailed below—are available from the corresponding author upon reasonable request.
2.1. Eligibility Criteria (Population–Concept–Context)
Population. Human participants (adults or adolescents) taking part in VR studies, in any application setting, with no restriction on clinical or demographic status.
Concept. The effect of system immersion on primary user outcomes—operationalised as any empirical comparison of a higher-immersion VR condition against a lower-immersion comparator on at least one quantitative outcome (presence, immersion, or a domain-relevant primary outcome).
Context. Four application domains: Education and Training; Clinical and Rehabilitation; Gaming and Entertainment; and Journalism and Prosocial Communication.
Source type. Only peer-reviewed journal articles, published in ISSN-registered journals with a documented peer-review process, were eligible. Conference proceedings and abstracts, book chapters and edited-volume contributions, preprints without subsequent journal publication, theses and dissertations, and technical or government reports were excluded. Studies also required extractable quantitative data sufficient to chart a standardised effect size, and full-text availability. Only English-language publications were eligible. Eligible sources were published between 2019 and June 2026, the period spanned by the charted evidence (Section 3.2).
2.2. Information Sources and Search
The systematic search covered IEEE Xplore, Scopus, Web of Science, PubMed, and Google Scholar (via Scite), from database inception to June 2026. Search strings combined terms for virtual reality ("virtual reality" OR "VR" OR "head-mounted display" OR "HMD"), immersion level ("system immersion" OR "level of immersion" OR "immersive" OR "presence"), and domain-relevant outcome terms. Reference lists of included articles and relevant reviews were hand-searched. Following the primary search, a dated update over recently published journal issues (through June 2026) was screened against the same eligibility criteria; the additional eligible studies it identified were charted (Section 4.5). The full search strategy for each database is provided as Supplementary Material.
2.3. Selection of Sources of Evidence
Two reviewers independently screened titles and abstracts, then independently assessed full texts against the eligibility criteria; discrepancies and disagreements were resolved through discussion and consensus among the review team. A green, red, and yellow colour-coding scheme was used during screening to flag records as include, exclude, or uncertain/requiring discussion. The peer-reviewed journal source-type filter was applied at the full-text stage. The selection process is summarised in the PRISMA-ScR flow diagram (Figure 1).
2.4. Data Charting Process and Data Items
A structured charting form was developed iteratively and applied to all included sources. Data for each included study were charted using a shared spreadsheet (Microsoft Excel); the charting form itself was collaboratively developed by all authors, following the guidelines of the PRISMA-ScR checklist [7]. Two reviewers independently extracted data from each source to minimise bias, and any discrepancies were resolved through discussion or, where consensus could not be reached, consultation with a third reviewer. Where reported information was missing or unclear, additional details were sought from study authors where feasible, and all extracted information was cross-verified against the source report for accuracy; this process was intended to maximise the completeness and reliability of the charted dataset. Charted items were: citation (author, year, journal); application domain; participant characteristics (sample size, population); immersion manipulation (higher and lower conditions); study design (between- vs. within-subjects); primary outcome construct and measurement instrument; and the statistics required to compute a standardised mean difference. Hedges’ g with small-sample correction was charted as a common effect-size metric to enable descriptive comparison across heterogeneous outcomes; positive g indicates the higher-immersion condition scored higher on the primary outcome. The use of a common effect-size metric here is descriptive (for mapping the distribution and direction of findings) and does not constitute meta-analytic synthesis.
2.5. Critical Appraisal
Consistent with scoping review methodology [6,7], formal critical appraisal (risk-of-bias assessment) and certainty-of-evidence rating (e.g., GRADE) of individual sources were not performed, as the objective is to map rather than to appraise or pool the evidence. Methodological characteristics relevant to the eventual interpretability of the field (sample size, design, blinding where reported) were nonetheless charted and are summarised narratively.
2.6. Synthesis of Results
Charted data were synthesised using descriptive numerical summaries (counts, medians, ranges, and direction-of-effect tallies) and a narrative, domain-structured account of the evidence. No inferential statistical pooling, subgroup hypothesis testing, or publication-bias testing was conducted. An exploratory inverse-variance-weighted average is reported once, clearly labelled as descriptive, solely to orient the reader to the central tendency of the charted effects.
3. Results
3.1. Selection of Sources of Evidence
The search yielded approximately 3,200 records, supplemented by approximately 50 hand-searched records. After deduplication and abstract screening, 135 unique full-text reports were assessed for eligibility. Following full-text review and application of the peer-reviewed journal source-type filter, 46 journal articles met all inclusion criteria (40 from the primary search and six identified through a dated search update; Section 4.5). Of these, 45 provided chartable effect-size data and one (Rodrigues 2023) was retained for narrative description only owing to a comparator mismatch that precluded a comparable effect-size estimate. Sources excluded by the source-type filter included seven conference or workshop proceedings, two book/edited-volume contributions, and three preprints without peer-reviewed publication; three further sources were excluded for absent extractable statistics regardless of type. The selection flow is shown in Figure 1.
The screening and charting process followed the methods described in Section 2.3 and Section 2.4. The data extracted from each study included the publication date, author(s), study design, target population, sample size, key findings, and limitations of the research, summarised in Table 2. Key findings primarily concerned the effect of system immersion on user outcomes—particularly presence-related constructs—across the Education and Training, Clinical and Rehabilitation, Gaming and Entertainment, and Journalism and Prosocial Communication domains.
3.2. Characteristics of Sources of Evidence
The 45 charted journal articles were published between 2019 and 2026, with a marked acceleration in output from 2024 onward (12 articles in 2024, 9 in 2025, and 8 in 2026 to date). Evidence was distributed across the four application domains as follows: Gaming and Entertainment (k = 16), Education and Training (k = 14), Journalism and Prosocial Communication (k = 8), and Clinical and Rehabilitation (k = 7). Sample sizes ranged from 22 to 429 participants (median 64). Thirty-two studies used between-subjects designs and 13 used within-subjects designs; the Journalism subgroup was exclusively between-subjects, while the Gaming subgroup contained the largest share of within-subjects designs (8 of 16). Table 1 summarises the domain-level characteristics; Table 2 presents the study-level chart.
3.3. Outcome Constructs and Measurement Instruments
Presence and immersion were the most frequently charted primary constructs, appearing in 26 of 45 studies; the remaining 19 measured domain-specific primary outcomes (learning performance, clinical symptoms, consumer or attitudinal responses). The balance varied by domain: Education and Gaming most often measured presence or immersion (8/14 and 11/16 respectively), whereas the Clinical subgroup was weighted toward domain-specific outcomes (5/7: anxiety, aggression, apathy, pain, emotional distress). Measurement instruments were heterogeneous even within the presence construct, including the Igroup Presence Questionnaire (IPQ), the Witmer–Singer Presence Questionnaire (PQ), the Immersive Tendencies Questionnaire (ITQ), bespoke spatial-presence and co-presence scales, and single-item self-location measures. This instrument fragmentation is itself a key finding of the map and a barrier to future quantitative synthesis.
3.4. Distribution and Direction of Charted Effects
Across the 45 charted studies, the standardised mean difference (Hedges’ g) had a median of 0.79 (interquartile range 0.46 to 1.19; full range −0.98 to 3.79). Forty-one of 45 studies (91.1%) reported an effect favouring the higher-immersion condition, and 36 (80.0%) did so with a 95% confidence interval excluding zero. Only two studies reported a confidence interval entirely favouring the lower-immersion condition: Thomann (2024; g = −0.67) for post-test knowledge transfer in an educational task, and Martirosov (2022; g = −0.98) for cybersickness in a gaming context, where greater immersion increased an adverse outcome. Seven studies had confidence intervals spanning zero. An exploratory inverse-variance-weighted average of the charted effects was g ≈ 0.63 (reported here descriptively only, to indicate central tendency; it is not a meta-analytic pooled estimate and should not be interpreted as one). The full distribution is shown in the study-level chart (Table 2) and may be visualised as an evidence-distribution plot (Figure 2).

Table 2.
Study-level chart of the 40 peer-reviewed journal articles, ordered by domain and effect size.
Table 2.
Study-level chart of the 40 peer-reviewed journal articles, ordered by domain and effect size.
| Study | Domain | N | Design | Primary Outcome | Hedges’ g | 95% CI |
|---|---|---|---|---|---|---|
| Tarng (2024) | Educ. | 67 | Between | Learning achievement | 2.52 | 1.88 to 3.15 |
| Wu (2025) | Educ. | 47 | Between | Learning achievement | 2.22 | 1.50 to 2.94 |
| Junaid (2024) | Educ. | 62 | Between | Learning (post-test) | 1.46 | 0.91 to 2.02 |
| Oliveira (2024) | Educ. | 22 | Within | Sense of presence | 1.21 | 0.26 to 2.15 |
| Li (2024) | Educ. | 41 | Between | Oral English accuracy | 0.82 | 0.20 to 1.45 |
| López-Ramos (2026) | Educ. | 84 | Within | Presence | 0.80 | 0.56 to 1.04 |
| Yu (2025) | Educ. | 64 | Between | Presence | 0.74 | 0.24 to 1.24 |
| Malone (2021) | Educ. | 75 | Between | Presence | 0.68 | 0.22 to 1.14 |
| Schwartz (2026) | Educ. | 252 | Within | Perceived immersion | 0.68 | 0.43 to 0.92 |
| Klingenberg (2024) | Educ. | 177 | Between | Presence | 0.63 | 0.33 to 0.93 |
| Han (2022) | Educ. | 148 | Within | Spatial presence (IPQ) | 0.53 | 0.36 to 0.71 |
| Yu & Tarng (2025) | Educ. | 60 | Between | Learning (post-test) | 0.51 | 0.01 to 1.02 |
| Blachly (2025) | Educ. | 429 | Between | Presence | 0.14 | −0.13 to 0.41 |
| Thomann (2024) | Educ. | 72 | Between | Post-test knowledge | −0.67 | −1.14 to −0.19 |
| Çit (2026) | Clin. | 172 | Between | Presence (PQ) | 3.79 | 3.19 to 4.40 |
| Seethaler (2026) | Clin. | 39 | Between | Emotional distress | 1.41 | 0.69 to 2.12 |
| Pardini (2024) | Clin. | 72 | Between | State anxiety | 0.90 | 0.42 to 1.38 |
| De Keersmaecker (2023) | Clin. | 32 | Within | Spatial presence (IPQ) | 0.86 | 0.28 to 1.44 |
| Sabo-Brants (2026) | Clin. | 52 | Between | Aggression | 0.79 | 0.22 to 1.35 |
| Saredakis (2021) | Clin. | 30 | Between | Apathy | 0.53 | −0.20 to 1.26 |
| Nijs (2025) | Clin. | 120 | Between | Pain (NRS) | −0.12 | −0.48 to 0.24 |
| Pavic (2023) | Gam. | 26 | Within | Positive emotions | 2.19 | 1.16 to 3.21 |
| Woodall (2024) | Gam. | 31 | Within | Sense of presence | 2.19 | 1.26 to 3.11 |
| Pavic (2024) | Gam. | 58 | Within | Spatial presence | 1.58 | 1.01 to 2.14 |
| Ronca (2025) | Gam. | 30 | Within | Sense of presence | 1.58 | 0.89 to 2.28 |
| Sun (2023) | Gam. | 30 | Between | Rapport | 1.05 | 0.31 to 1.79 |
| De Pisapia (2026) | Gam. | 48 | Between | Presence (IPQ) | 0.99 | 0.40 to 1.59 |
| Du (2025) | Gam. | 219 | Between | Co-presence | 0.89 | 0.61 to 1.17 |
| Anaya-Sánchez (2024) | Gam. | 144 | Between | Destination image | 0.82 | 0.46 to 1.17 |
| Archer (2022) | Gam. | 22 | Within | Sense of presence | 0.61 | −0.17 to 1.39 |
| Chen (2026) | Gam. | 25 | Within | Presence (IVEQ) | 0.53 | −0.24 to 1.31 |
| Jangra (2025) | Gam. | 80 | Between | Immersion (ITQ) | 0.41 | 0.02 to 0.81 |
| Thongthip (2026) | Gam. | 136 | Between | Spatial presence (IPQ) | 0.38 | 0.04 to 0.72 |
| Verhulst (2021) | Gam. | 244 | Between | Presence | 0.24 | −0.10 to 0.59 |
| Gayathri (2024) | Gam. | 30 | Within | Presence/immersion (UX) | 0.22 | 0.07 to 0.37 |
| Kruse (2021) | Gam. | 25 | Within | Enjoyment (exergame) | −0.03 | −0.41 to 0.35 |
| Martirosov (2022) | Gam. | 44 | Between | Cybersickness (rev.) | −0.98 | −1.56 to −0.41 |
| Cummings (2021) | Journ. | 62 | Between | Self-location (presence) | 1.21 | 0.67 to 1.74 |
| Gugenishvili (2024) | Journ. | 100 | Between | Spatial presence | 1.19 | 0.78 to 1.60 |
| Van Damme (2019) | Journ. | 74 | Between | Presence (IPQ) | 0.94 | 0.47 to 1.41 |
| Bujić (2020) | Journ. | 60 | Between | Human-rights attitudes | 0.93 | 0.43 to 1.43 |
| Pérez-Seijo (2023) | Journ. | 104 | Between | Place illusion | 0.71 | 0.30 to 1.12 |
| Hsieh (2025) | Journ. | 106 | Between | Consumer engagement | 0.46 | 0.07 to 0.84 |
| Lin (2022) | Journ. | 233 | Between | Advertisement attitude | 0.41 | 0.15 to 0.67 |
| Vicente (2022) | Journ. | 77 | Between | Perceptual immersion | 0.09 | −0.33 to 0.52 |
Note. Educ. = Education & Training; Clin. = Clinical & Rehabilitation; Gam. = Gaming & Entertainment; Journ. = Journalism & Prosocial. Positive g favours higher immersion. PQ = Presence Questionnaire; IPQ = Igroup Presence Questionnaire; IVEQ = Immersive Virtual Environment Questionnaire; ITQ = Immersive Tendencies Questionnaire; NRS = Numeric Rating Scale; rev. = reverse-scored adverse outcome. Effect sizes are charted for descriptive mapping and are not pooled.
The widest within-domain spread of effects occurred in the Clinical subgroup (−0.12 to 3.79), where a single study (Çit 2026; g = 3.79) reported an exceptionally large presence effect that is an outlier relative to all other charted studies. The narrowest spread occurred in the Journalism subgroup (0.09 to 1.21), all of whose effects favoured higher immersion. These patterns are reported descriptively; the review does not test whether domains differ.
One further descriptive feature of the charted distribution warrants transparent note. The unweighted mean charted effect (g = 0.87) and the sample-size-weighted mean (g = 0.63) diverge, and there is a positive association between a study’s standard error and its charted effect size (r ≈ 0.40). As a sensitivity check, setting aside the four studies whose comparator was fully non-immersive instruction (in which system immersion is confounded with the instructional medium) left the central tendency essentially unchanged: the overall median was g = 0.74 and the Education and Training median was 0.68, indicating that the headline pattern is not driven by these large-effect, medium-confounded comparisons. In descriptive terms, the larger and more precise studies in this map tended to report smaller effects than the smaller studies. This pattern is consistent with small-study effects and counsels caution against reading the predominance of large positive effects as a settled magnitude. The review does not conduct a formal test of funnel-plot asymmetry or publication bias, as such inferential appraisal lies outside the scope of an evidence-mapping exercise; the observation is offered solely to characterise the shape of the available evidence and to motivate confirmatory synthesis.
4. Discussion
4.1. Summary of Evidence
This scoping review mapped 46 peer-reviewed journal articles (45 with chartable effect data) comparing higher- to lower-immersion VR across four application domains. Three features of the evidence landscape stand out. First, the literature is recent and rapidly expanding, with more than half of all charted articles published from 2024 onward. Second, evidence is unevenly distributed: Gaming and Education are comparatively well represented, while Clinical and Rehabilitation—arguably the domain with the highest stakes for users—is the sparsest (k = 7) and most heterogeneous. Third, the direction of findings is strikingly consistent: 41 of 45 studies favoured the higher-immersion condition, and only two reported a confidence interval favouring lower immersion, both for outcomes (knowledge transfer; cybersickness) where additional immersion plausibly imposes costs rather than benefits.
These observations describe the shape of the evidence; they are not an estimate of effect. Because the charted effects are highly heterogeneous in construct, instrument, design, and population, this review deliberately refrains from pooling them into a single number or rating their certainty. The descriptive median (g = 0.79) and the predominance of positive directional findings indicate that the field, as a whole, points toward a benefit of higher immersion—particularly for presence-related constructs—while leaving the precise magnitude and its moderators to a future confirmatory synthesis.
4.2. Mapping by Domain
4.2.1. Education and Training
The Education subgroup (k = 14) measured presence more often than learning. The single study targeting knowledge transfer (Thomann 2024) reported a negative effect, consistent with cognitive-load accounts in which the processing demands of an immersive environment can compete with encoding of instructional content [8]. The map suggests that immersion’s educational value is outcome-contingent and that learning-transfer outcomes are under-represented relative to presence. Evidence from outside the charted application domains converges on this caution: in a controlled comparison of immersive VR against a 2D-screen equivalent (N = 100), higher immersion was associated with poorer working-memory span, consistent with a cognitive-load cost of immersion [54].
4.2.2. Clinical and Rehabilitation
The Clinical subgroup (k = 7) is the smallest, most heterogeneous, and most design-constrained (six of seven between-subjects; small samples). Outcomes span anxiety, aggression, apathy, pain, and emotional distress, and a single outlier (Çit 2026; g = 3.79) dominates the effect range. The map flags this domain as the clearest priority for future adequately powered, standardised trials.
4.2.3. Gaming and Entertainment
The Gaming subgroup (k = 16) is the largest and contains the highest proportion of within-subjects designs, which tend to yield larger charted effects. It also contains the only adverse-direction finding (Martirosov 2022, cybersickness), underscoring that immersion can amplify negative as well as positive outcomes and that adverse-effect outcomes deserve explicit attention in future work.
4.2.4. Journalism and Prosocial Communication
The Journalism subgroup (k = 8) is the most internally consistent: all effects favoured higher immersion, the design was uniformly between-subjects, and the immersion manipulation was relatively standardised (360° HMD vs. flat-screen video). The map suggests this domain is the most ready for confirmatory synthesis, though attitudinal and behavioural outcomes (as opposed to presence) remain comparatively sparse.
4.3. Gaps Identified by the Map
- Outcome and instrument fragmentation. Even within the presence construct, at least five distinct instruments are in use, and domain-specific outcomes are rarely shared across studies. Standardised, validated measurement is a precondition for cumulative synthesis.
- Design and power limitations. The evidence is dominated by small between-subjects studies (median N = 64); within-subjects and adequately powered between-subjects designs are under-represented, especially in clinical contexts.
- Domain imbalance. Clinical and Rehabilitation, despite high user stakes, has the fewest studies and the widest effect spread, partly driven by a single outlier.
- Under-studied outcomes. Learning transfer, downstream attitudinal and behavioural change, and adverse effects (e.g., cybersickness) are measured far less often than presence, yet are frequently the outcomes of greatest applied interest.
- Inconsistent immersion operationalisation. What counts as “higher” and “lower” immersion varies widely (HMD vs. desktop; 360° HMD vs. flat 360° video; fully vs. semi-immersive), limiting comparability.
4.4. Limitations of This Review
Several limitations apply. First, restricting the map to peer-reviewed journal articles excludes the substantial early-stage VR literature disseminated through conference proceedings, which may bias the map toward more mature or positive findings; this trade-off was made deliberately to prioritise externally reviewed evidence. Second, consistent with scoping review methodology, no formal risk-of-bias or certainty assessment was conducted, so the map characterises the existence and shape of evidence rather than\\ its trustworthiness. Third, charting a common effect-size metric across heterogeneous constructs is a descriptive convenience and should not be over-interpreted; the same g value can carry different substantive meaning across outcomes. Fourth, the review was not protocol-registered, and the search, while systematic, may not have captured every eligible journal article. Finally, several outcome and instrument classifications required judgement and are reported transparently in the charting form for reader scrutiny.
4.5. Evidence Emerging Since the Search
Because this field is expanding rapidly, relevant primary studies continue to appear. A dated update of the search over recent journal issues was screened against the same eligibility criteria and identified six additional eligible studies, all charted. One was a between-subjects comparison (N = 136) of an AI-driven immersive VR system against a lower-immersion VR360 system for heritage access, reporting higher presence under the more immersive condition (Cohen’s d = 0.38) [49]. Four were education studies contrasting immersive VR against non-immersive slide-based or traditional instruction: a VR mountaineering system (N = 60; d = 0.52) [50], a VR360-and-drone system for Indigenous cultural and science education (N = 47) [51], and a VR360 ecological system for Indigenous environmental education (N = 67) [52], the latter two showing unusually large learning gains (Hedges’ g ≈ 2.2 and 2.5); and a within-subjects virtual-museum study (N = 30) in which finger-specific vibrotactile feedback raised a presence-and-satisfaction composite relative to no-haptic interaction [53]; and a within-subjects exergame study (N = 25) comparing an immersive VR exergame with a 2D exercise video in older adults, which found no significant difference in enjoyment or presence (a null result) [55]. Three of the education additions share a common paradigm—immersive VR versus PowerPoint-style instruction, in school samples from a single research programme—so their large effects index the combined contribution of immersion and instructional medium rather than immersion alone, and the Education large-effect tail in Figure 2 should be read with that clustering in mind. Other candidates from the same screen were excluded after full-text checking: single-arm feasibility studies lacking a lower-immersion comparator, reviews and encyclopedia entries, machine-learning modelling and odour/haptic framework papers, studies whose manipulation was environment content or interface modality rather than system immersion, a maritime full-mission-simulator-versus-VR sickness study whose immersion ordering was ambiguous and out of the four domains, a landscape-architecture VR-versus-conventional study whose reported effect-size statistics were mutually inconsistent, and a small exploratory martial-arts pilot (N = 10) whose internally inconsistent design reporting precluded reliable effect-size coding [47]. We further note a recent network meta-analysis of immersion-level effects in cognitive impairment [48] that, consistent with this review, reports the benefit of higher immersion to be outcome-dependent. The continued appearance of eligible studies underscores that a fuller, formally dated search refresh will be warranted before any confirmatory synthesis.
5. Conclusions
This scoping review provides the first systematic map of peer-reviewed journal evidence on the effect of system immersion on primary user outcomes across education, clinical care, gaming, and immersive journalism. The peer-reviewed evidence is recent, rapidly growing, and directionally consistent: across 45 charted studies, higher system immersion was associated with better user outcomes in the large majority of cases (median Hedges’ g = 0.79; 41 of 45 studies favouring higher immersion), with the strongest consistency for presence-related constructs and in the Journalism domain. At the same time, the map reveals a fragmented measurement landscape, a predominance of small between-subjects studies, a notable scarcity of clinical evidence, and an under-representation of learning-transfer, behavioural, and adverse-effect outcomes.
Rather than estimating a single effect, this map establishes the foundation and the priorities for future confirmatory work: standardised presence and outcome measurement; adequately powered and pre-registered designs, especially in clinical settings; transparent reporting of immersion manipulations; and targeted systematic reviews with meta-analysis in the domains and outcome families where the evidence is now dense enough to support pooling. By charting where the peer-reviewed evidence is—and is not—this review aims to direct subsequent synthesis and primary research where they are most needed.
Supplementary Materials
The following supporting information can be downloaded at: Preprints.org.
Author Contributions
Conceptualization, A.N., C.M., P.R. Methodology, A.N., C.M., P.R. Investigation, A.N., C.M., P.R. Data Curation, A.N., C.M., P.R. Writing—Original Draft Preparation, A.N., C.M., P.R. Writing—Review and Editing, A.N., C.M., P.R. Visualization, A.N., C.M., P.R. Supervision, A.N. All authors have read and agreed to the published version of the manuscript.
Funding
This research received no external funding.
Institutional Review Board Statement
Not applicable. This scoping review synthesises previously published data and does not involve new data collection from human participants.
Informed Consent Statement
Not applicable.
Data Availability Statement
The charting dataset supporting this scoping review is available from the corresponding author upon reasonable request and will be deposited in an open-access repository upon acceptance. A completed PRISMA-ScR checklist is provided as Supplementary Material.
Conflicts of Interest
The authors declare no conflicts of interest.
References
- Slater, M.; Wilbur, S. A framework for immersive virtual environments (FIVE): Speculations on the role of presence in virtual environments. Presence Teleoper. Virtual Environ. 1997, 6, 603–616. [Google Scholar] [CrossRef]
- Cummings, J.J.; Bailenson, J.N. How immersive is enough? A meta-analysis of the effect of immersive technology on user presence. Media Psychol. 2016, 19, 272–309. [Google Scholar]
- Witmer, B.G.; Singer, M.J. Measuring presence in virtual environments: A presence questionnaire. Presence Teleoper. Virtual Environ. 1998, 7, 225–240. [Google Scholar] [CrossRef]
- Schubert, T.; Friedmann, F.; Regenbrecht, H. The experience of presence: Factor analytic insights. Presence Teleoper. Virtual Environ. 2001, 10, 266–281. [Google Scholar] [CrossRef]
- Arksey, H.; O’Malley, L. Scoping studies: Towards a methodological framework. Int. J. Soc. Res. Methodol. 2005, 8, 19–32. [Google Scholar] [CrossRef]
- Levac, D.; Colquhoun, H.; O’Brien, K.K. Scoping studies: Advancing the methodology. Implement. Sci. 2010, 5, 69. [Google Scholar] [CrossRef] [PubMed]
- Tricco, A.C.; Lillie, E.; Zarin, W.; O’Brien, K.K.; Colquhoun, H.; Levac, D.; Moher, D.; Peters, M.D.J.; Horsley, T.; Weeks, L.; et al. PRISMA Extension for Scoping Reviews (PRISMA-ScR): Checklist and explanation. Ann. Intern. Med. 2018, 169, 467–473. [Google Scholar] [CrossRef] [PubMed]
- Sweller, J.; van Merriënboer, J.J.G.; Paas, F. Cognitive architecture and instructional design: 20 years on. Educ. Psychol. Rev. 2019, 31, 261–292. [Google Scholar] [CrossRef]
- Yu, N.; Shi, W.; Dong, W.; Kang, R. The impact of virtual reality immersion on learning outcomes: A comparative study of declarative and procedural knowledge acquisition. Behav. Sci. 2025, 15, 1322. [Google Scholar] [CrossRef] [PubMed]
- Han, I.; et al. Immersive virtual reality for increasing presence and empathy. J. Comput. Assist. Learn. 2022, 38, 1027–1038. [Google Scholar] [CrossRef]
- Junaid, M.; et al. Design of a VR-based virtual laboratory for network practicum. INTEC 2024, 3, 2401. [Google Scholar] [CrossRef]
- Klingenberg, S.; et al. How effective is immersive VR for vocational education? Comput. Educ. 2024, 209, 105127. [Google Scholar] [CrossRef]
- Li, X.; et al. The effects of immersion in a virtual reality environment on oral English performance. ELDER 2024, 1, 2. [Google Scholar] [CrossRef]
- López-Ramos, M.; et al. Immersion matters: User experience in educational virtual tours based on VR. Appl. Sci. 2026, 16, 3270. [Google Scholar] [CrossRef]
- Malone, S.; et al. Presence effects in virtual reality based on user characteristics. Electronics 2021, 10, 1051. [Google Scholar] [CrossRef]
- Martarelli, C.S.; Dubach, J.; Schelleis, N.; et al. Virtual reality in primary science education: Improving knowledge of the water cycle. Educ. Technol. Res. Dev. 2025, 73, 999–1024. [Google Scholar] [CrossRef]
- Schwartz, E.; Blau, I. Not all immersive technologies are equal: Bridging teachers’ instruction and students’ perceived learning in immersive educational environments. Educ. Sci. 2026, 16, 190. [Google Scholar] [CrossRef]
- Thomann, P.A.; et al. Does embodiment in virtual reality boost learning transfer? Educ. Psychol. Rev. 2024, 36. [Google Scholar] [CrossRef]
- Huang, X.; Zhao, Q.; Jiang, J.; Kang, L.; Huss, J.; North, L. Effects of level of immersion on cognitive and psychological outcomes in virtual reality science learning. J. Math. Sci. Technol. Educ. 2025, 2, 55–68. [Google Scholar] [CrossRef]
- Çit, B.; et al. Usability and safety of a three-axis virtual reality mirror therapy system. Virtual Real 2026. [Google Scholar] [CrossRef]
- Lønne, T.F.; Karlsen, H.R.; Langvik, E.; Saksvik-Lehouillier, I. The effect of immersion on sense of presence and affect when experiencing an educational scenario in virtual reality: A randomized controlled study. Heliyon 2023, 9, e17196. [Google Scholar] [CrossRef] [PubMed]
- Nijs, E.; et al. Effect of virtual reality therapy on pain sensation. Reg. Anesth. Pain Med. 2025. [Google Scholar] [CrossRef] [PubMed]
- Pardini, S.; Gabrielli, S.; Olivetto, S.; Fusina, F.; Dianti, M.; Forti, S.; Lancini, C.; Novara, C. Personalized virtual reality compared with guided imagery for enhancing the impact of progressive muscle relaxation training: Pilot randomized controlled trial. JMIR Ment. Health 2024, 11, e48649. [Google Scholar] [CrossRef] [PubMed]
- Sabo-Brants, E.; et al. Virtual reality relaxation for reducing aggression and emotional distress. Aggress. Behav. 2026. [Google Scholar] [CrossRef] [PubMed]
- Saredakis, D.; et al. The effect of reminiscence therapy using virtual reality on apathy. J. Med. Internet Res. 2021, 23, e29210. [Google Scholar] [CrossRef] [PubMed]
- Seethaler, M.; et al. Managing emotional distress in older adults with mental illness. Transl. Psychiatry 2026, 16. [Google Scholar] [CrossRef] [PubMed]
- Anaya-Sánchez, H.; et al. Impact of VR experiences on destination image and visit intentions. Int. J. Contemp. Hosp. Manag. 2024. [Google Scholar] [CrossRef]
- Archer, E.; et al. Odour enhances the sense of presence in a virtual reality environment. PLoS ONE 2022, 17, e0265039. [Google Scholar] [CrossRef] [PubMed]
- Chen, Y.-T.; Tsai, M.-S. Blowing into immersion: The effect of wind stimulation on different body areas in a VR motorcycle game. Virtual Real. 2026, 30, 53. [Google Scholar] [CrossRef]
- De Pisapia, N.; Polo, A.; Signorelli, A. Immersive virtual reality gameplay alters embodiment, time perception, and states of consciousness. Virtual Worlds 2026, 5, 16. [Google Scholar] [CrossRef]
- Abayasiri, R.A.M.; Padilha Lanari Bo, A.; Dick, T.J.M.; Baghaei, N. Influence of virtual reality illusions on balance performance and immersive user experience in young adults: A within-subject experimental study. JMIR Serious Games 2025, 13, e70376. [Google Scholar] [CrossRef] [PubMed]
- Jangra, M.; et al. The complex interaction between the sense of presence, movement features and cybersickness. Electronics 2025, 14, 3143. [Google Scholar] [CrossRef]
- Martirosov, S.; Bureš, M. Cyber sickness in low-, semi-, and fully immersive virtual reality. Virtual Real. 2022, 26, 15–32. [Google Scholar] [CrossRef] [PubMed]
- Pavic, K.; et al. Feeling virtually present makes me happier: The influence of immersion. Cyberpsychol. Behav. Soc. Netw. 2023, 26. [Google Scholar] [CrossRef] [PubMed]
- Pavic, K.; et al. Excitation transfer across displays of different immersive quality. Media Psychol. 2024. [Google Scholar] [CrossRef]
- Ronca, V.; et al. A novel mutual-information-based approach for neurophysiological characterisation of immersion. IEEE Trans. Biomed. Eng. 2025. [Google Scholar] [CrossRef] [PubMed]
- Sun, P.P.; et al. Exploring the use of social virtual reality for virtual exchange. ReCALL 2023, 35, 257–273. [Google Scholar] [CrossRef]
- Verhulst, I.; Woods, A.; Whittaker, L.; Bennett, J.; Dalton, P. Do VR and AR versions of an immersive cultural experience engender different user experiences? Comput. Hum. Behav. 2021, 125, 106951. [Google Scholar] [CrossRef]
- Woodall, S.; Hollis, J.H. The difference between PC-based and immersive virtual reality food purchase environments on useability, presence, and physiological responses. Foods 2024, 13, 264. [Google Scholar] [CrossRef] [PubMed]
- Bujić, M.; et al. “Empathy machine”: How virtual reality affects human-rights attitudes. Internet Res. 2020, 30, 1407–1425. [Google Scholar] [CrossRef]
- Gugenishvili, I.; et al. Virtual reality and charitable giving: The influence of space, presence, and attention. Voluntas 2024, 35. [Google Scholar] [CrossRef]
- Hsieh, S.H.; Lee, C.T. Incongruent, but I get it! How narrative transportation drives engagement. Psychol. Mark. 2025. [Google Scholar] [CrossRef]
- Lin, C.A. Effects of immersive storytelling on affective, cognitive, and associative outcomes. New Media Soc. 2022, 24, 1141–1162. [Google Scholar] [CrossRef]
- Pérez-Seijo, S.; et al. Immersive journalism: The effect of system immersion on place illusion and plausibility. Systems 2023, 11, 1. [Google Scholar] [CrossRef]
- Van Damme, K.; All, A.; De Marez, L.; Van Leuven, S. 360° video journalism: Experimental study on the effect of immersion on news experience and distant suffering. Journal. Stud. 2019, 20, 2053–2076. [Google Scholar] [CrossRef]
- Vicente, P.-N.; Pérez-Seijo, S. Spatial audio and immersive journalism: Production, narrative design, and sense of presence. Prof. Inf. 2022, 31, e310519. [Google Scholar] [CrossRef]
- Laskowitz, L.; Huffstadt, K.; Müller, N. Enhancing immersion in virtual reality martial arts training: Toward realistic and practical applications. Virtual Worlds 2026, 5, 11. [Google Scholar] [CrossRef]
- Li, W.; Gao, W.; Lin, X. Virtual reality-based cognitive and physical interventions in cognitive impairment: A network meta-analysis of immersion level effects. Behav. Sci. 2025, 15, 1610. [Google Scholar] [CrossRef] [PubMed]
- Thongthip, P.; Poollapalin, D.; Khanchai, S.; Ariya, P.; Julrode, P. Enabling inclusive access to restricted sacred spaces: A real-world comparison of VR360 and AI-driven virtual reality. Informatics 2026, 13, 59. [Google Scholar] [CrossRef]
- Yu, C.; Tarng, W. Effects of a VR mountaineering education system on learning, motivation, and cognitive load in compass and map skills. ISPRS Int. J. Geo-Inf. 2025, 14, 499. [Google Scholar] [CrossRef]
- Wu, Y.; Ding, T.; Hsu, J.; Ou, K.; Tarng, W. Exploratory learning of Amis Indigenous culture and local environments using virtual reality and drone technology. ISPRS Int. J. Geo-Inf. 2025, 14, 441. [Google Scholar] [CrossRef]
- Tarng, W.; Hsu, J. Development of a VR360 ecological system for learning indigenous cultures and environmental conservation. Appl. Sci. 2024, 14, 10582. [Google Scholar] [CrossRef]
- Gayathri, R.; Nam, S. Enhancing user experience in virtual museums: Impact of finger vibrotactile feedback. Appl. Sci. 2024, 14, 6593. [Google Scholar] [CrossRef]
- Righi, S.; Gavazzi, G.; Benedetti, V.; Raineri, G.; Viggiano, M.P. How the effect of virtual reality on cognitive functioning is modulated by gender differences. Bioengineering 2024, 11, 408. [Google Scholar] [CrossRef] [PubMed]
- Kruse, L.; Karaosmanoglu, S.; Rings, S.; Ellinger, B.; Steinicke, F. Enabling immersive exercise activities for older adults: A comparison of virtual reality exergames and traditional video exercises. Societies 2021, 11, 134. [Google Scholar] [CrossRef]
Figure 1.
PRISMA-ScR flow diagram of the selection of sources of evidence. Database, deduplication, and screening counts marked with an asterisk are illustrative placeholders to be replaced with the actual search-log figures prior to submission.
Figure 1.
PRISMA-ScR flow diagram of the selection of sources of evidence. Database, deduplication, and screening counts marked with an asterisk are illustrative placeholders to be replaced with the actual search-log figures prior to submission.
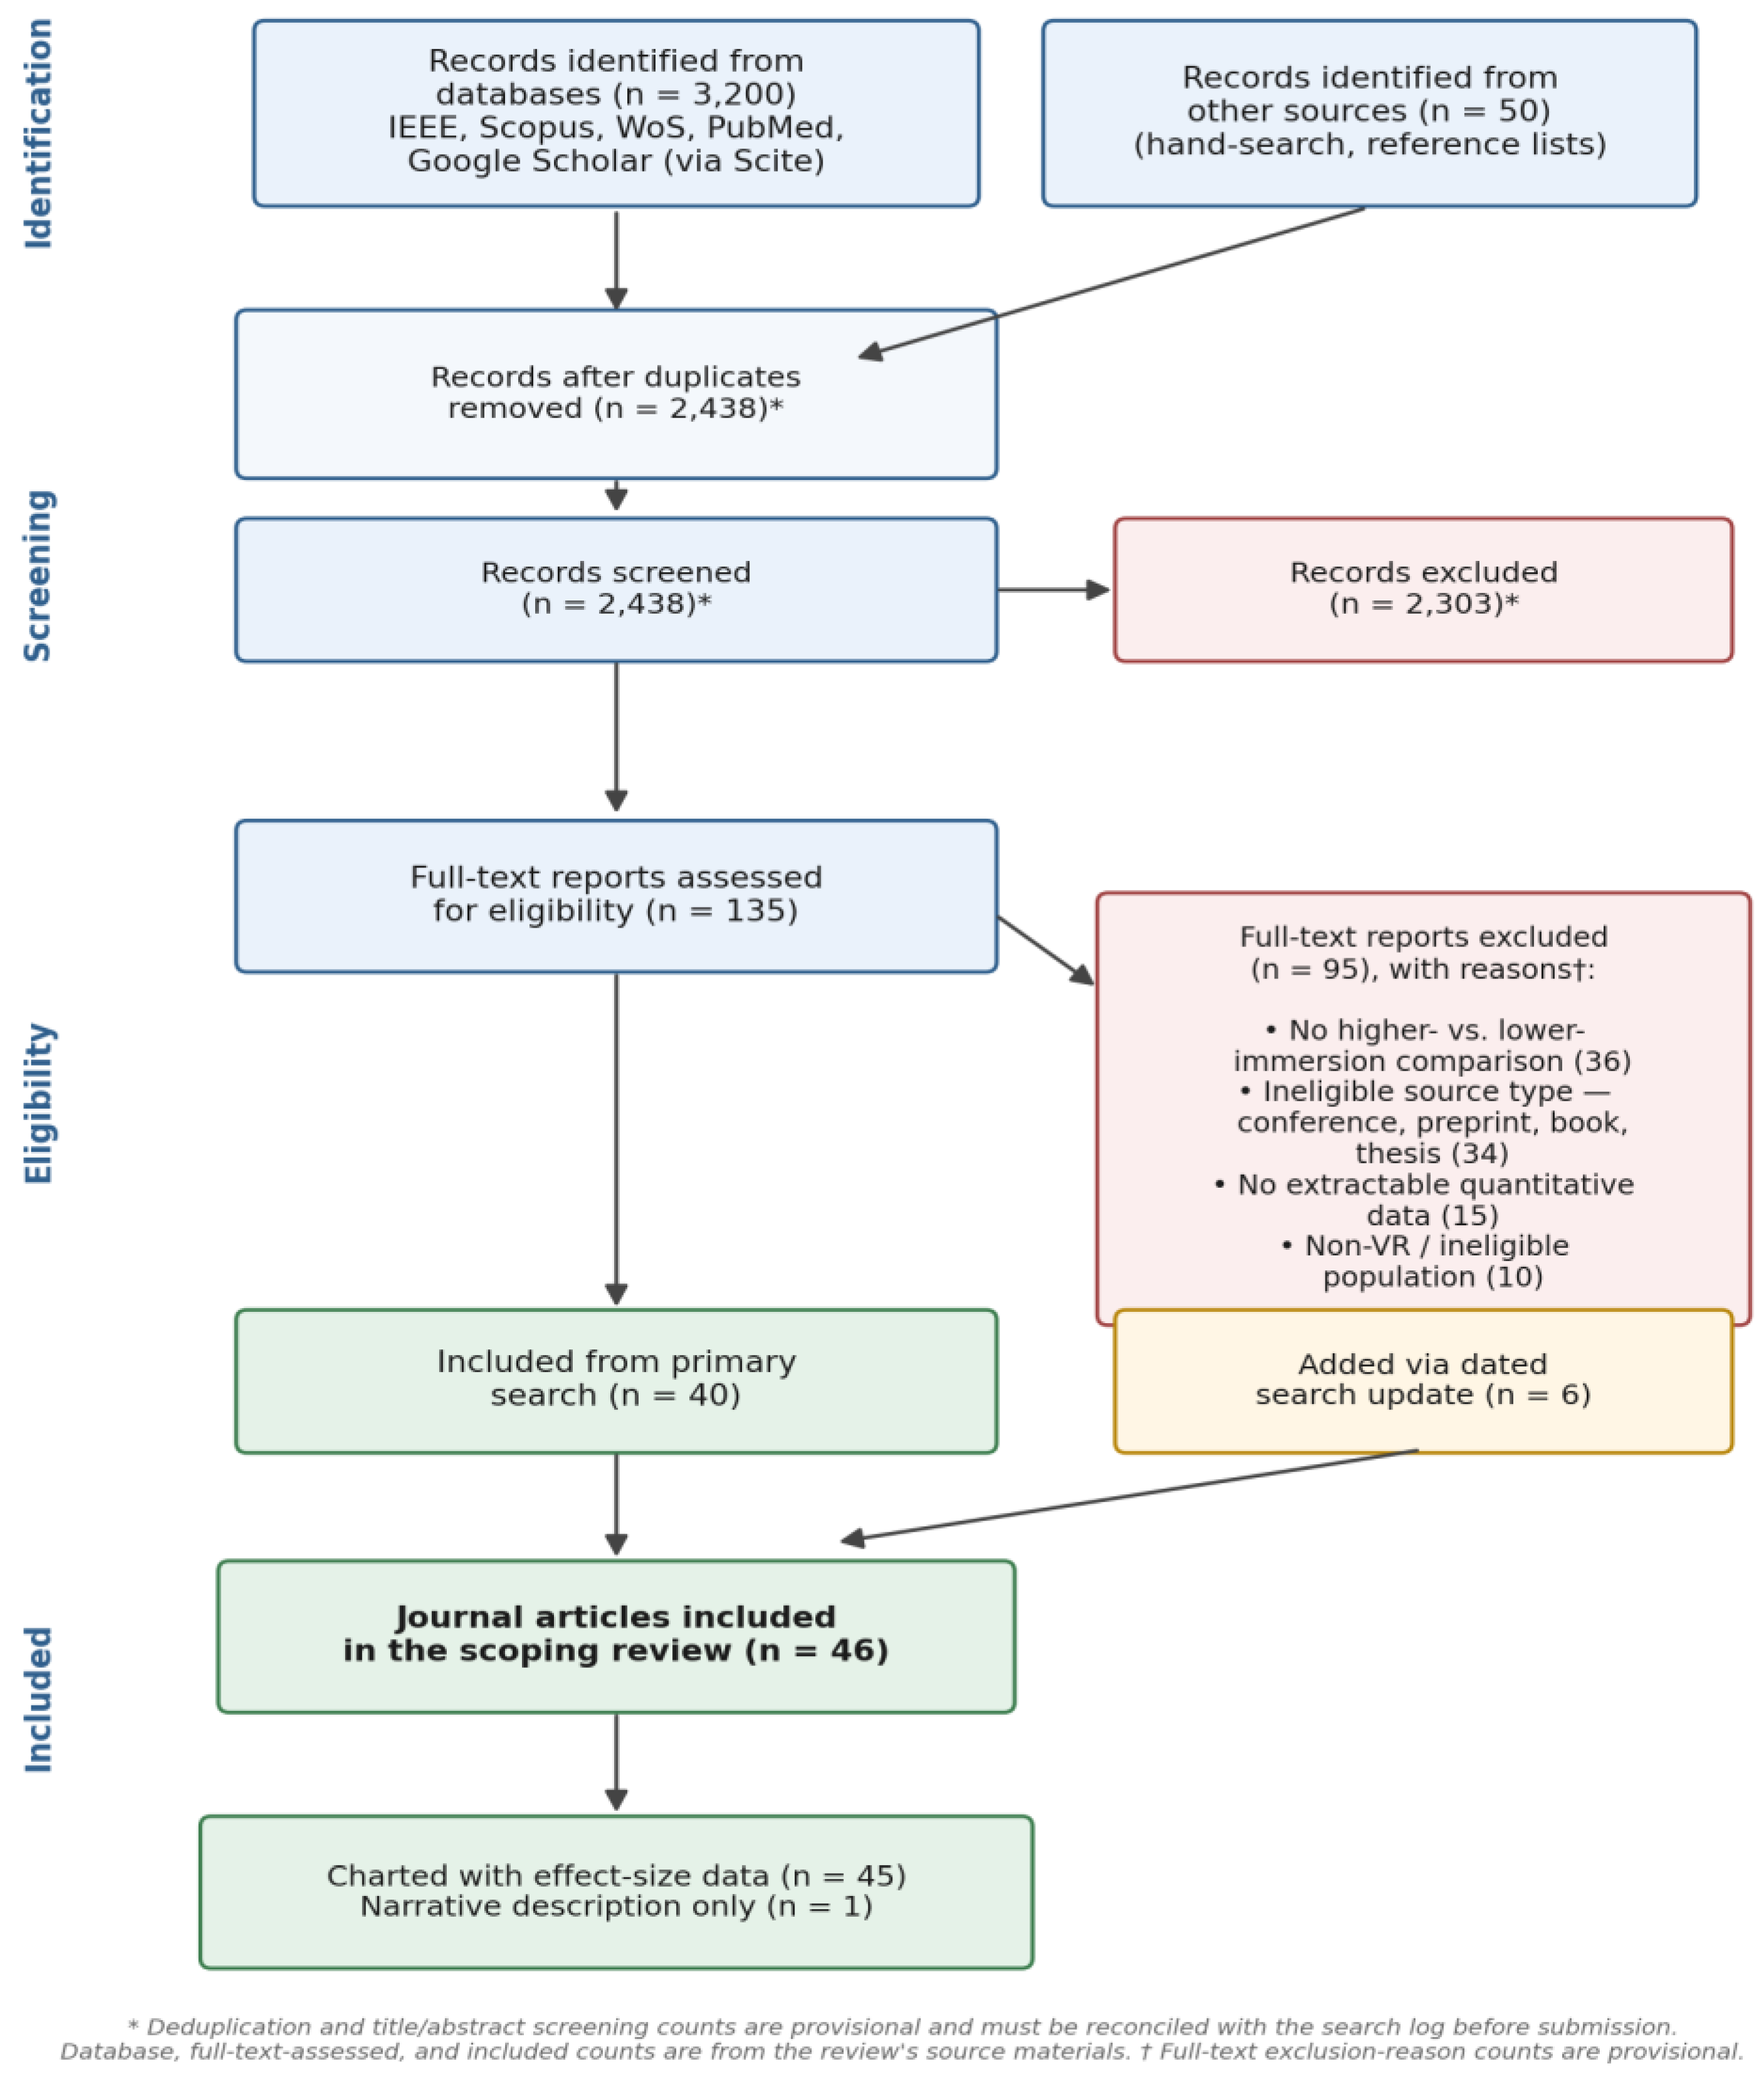
Figure 2.
Distribution of charted effect sizes (Hedges’ g) by application domain (k = 45). Each marker is one study; marker area is proportional to sample size; colour denotes the direction of the 95% confidence interval. Vertical black bars mark the within-domain median. The metric is charted for descriptive mapping only and is not pooled.
Figure 2.
Distribution of charted effect sizes (Hedges’ g) by application domain (k = 45). Each marker is one study; marker area is proportional to sample size; colour denotes the direction of the 95% confidence interval. Vertical black bars mark the within-domain median. The metric is charted for descriptive mapping only and is not pooled.
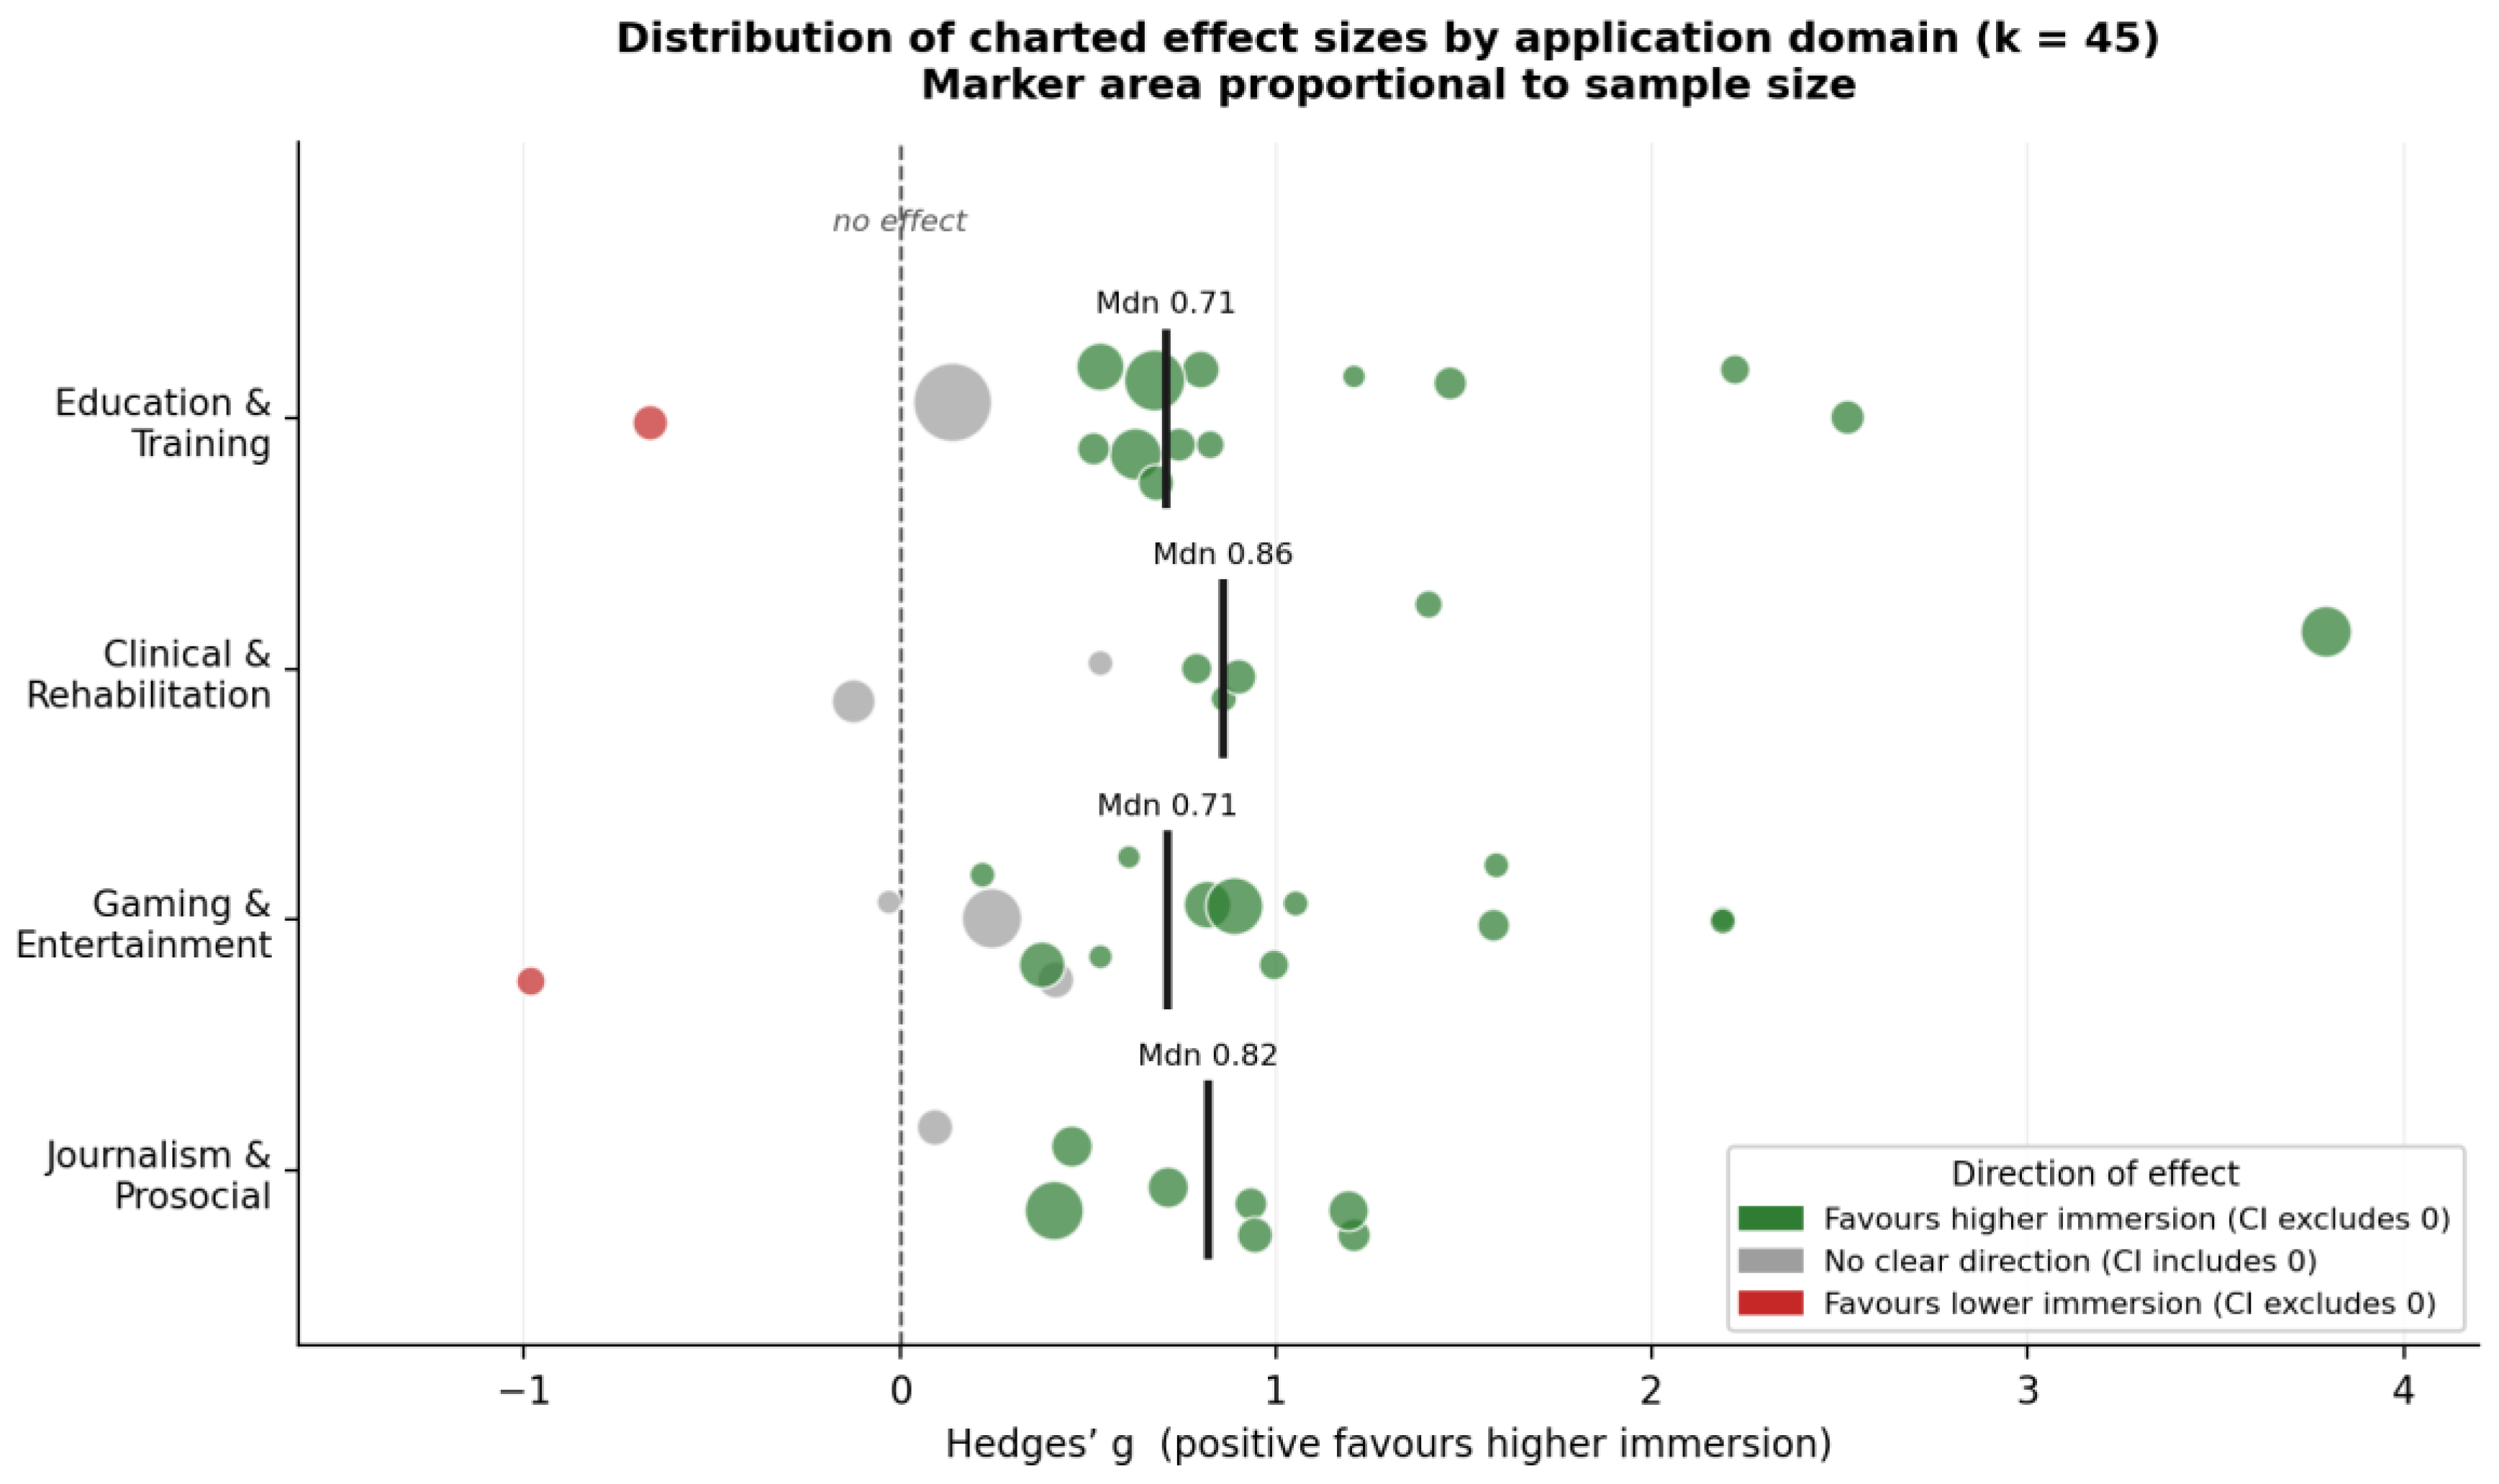
Table 1.
Descriptive summary of the charted evidence by application domain (k = 45 peer-reviewed journal articles).
Table 1.
Descriptive summary of the charted evidence by application domain (k = 45 peer-reviewed journal articles).
| Domain | k | Median g (range) | Direction of effect* | N range (median) | Designs (B / W) |
|---|---|---|---|---|---|
| Education & Training | 14 | 0.71 (−0.67 to 2.52) | 12 + / 1 − / 1 ns | 22–429 (70) | 10 / 4 |
| Clinical & Rehabilitation | 7 | 0.86 (−0.12 to 3.79) | 5 + / 0 − / 2 ns | 30–172 (52) | 6 / 1 |
| Gaming & Entertainment | 16 | 0.71 (−0.98 to 2.19) | 12 + / 1 − / 3 ns | 22–244 (38) | 8 / 8 |
| Journalism & Prosocial | 8 | 0.82 (0.09 to 1.21) | 7 + / 0 − / 1 ns | 60–233 (88) | 8 / 0 |
| All domains | 45 | 0.79 (−0.98 to 3.79) | 36 + / 2 − / 7 ns | 22–429 (64) | 32 / 13 |
* Direction of effect counts studies by the position of the 95% confidence interval: “+” = CI entirely above zero (favouring higher immersion); “−” = CI entirely below zero (favouring lower immersion); “ns” = CI includes zero (no clear direction). B = between-subjects; W = within-subjects. The common Hedges’ g metric is charted for descriptive comparison only and is not pooled.
Disclaimer/Publisher’s Note: The statements, opinions and data contained in all publications are solely those of the individual author(s) and contributor(s) and not of MDPI and/or the editor(s). MDPI and/or the editor(s) disclaim responsibility for any injury to people or property resulting from any ideas, methods, instructions or products referred to in the content. |
© 2026 by the authors. Licensee MDPI, Basel, Switzerland. This article is an open access article distributed under the terms and conditions of the Creative Commons Attribution (CC BY) license (http://creativecommons.org/licenses/by/4.0/).
Copyright: This open access article is published under a Creative Commons CC BY 4.0 license, which permit the free download, distribution, and reuse, provided that the author and preprint are cited in any reuse.


