

Submitted:
03 July 2026
Posted:
06 July 2026
You are already at the latest version
Abstract
Coastal dune ecosystems play an essential role in shoreline stabilization, biodiversity conservation, and carbon storage, but they are increasingly threatened by human activities and climate-related disturbances. This study assessed long-term forest vegetation dynamics in restored coastal dune ecosystems in northwestern Tunisia, integrating a 30-year Landsat dataset (1994–2024) with Random Forest classification. We quantified changes in forest and shrubland cover, evaluated the effectiveness of dune stabilization reforestation (Pinus pinea and Acacia spp.), and assessed the impact of the 2023 wildfire on forest biomass and carbon stocks. The findings demonstrate that reforestation efforts reduced mobile sand areas by 42.9% over three decades, with 78% of the sand loss attributable to vegetation stabilization. When infrastructure-affected areas were excluded, sand decreased by 64.7%, confirming genuine forest restoration success. The 2023 wildfire caused substantial forest biomass losses in the reforested pine stands (264.19 t·ha⁻¹) and carbon reductions (124.17 t·ha⁻¹). These losses reflect the high vulnerability of Mediterranean coastal forests to wildfire disturbances under recurrent summer drought and increasing temperatures. The study emphasizes the importance of long-term remote sensing time-series for coastal forest management and restoration planning in Mediterranean ecosystems.
Keywords:
forest vegetation dynamics
; coastal dune restoration
; Landsat time-series
; wildfire
; biomass loss
; carbon stocks
; Random Forest
; Mediterranean forest
; GIS
; reforestation effectiveness
1. Introduction
Coastal dunes play a vital role in how shorelines respond to storm surges and wave impacts, especially in low-lying coastal regions. Vegetation is a key factor influencing dune formation and their ability to buffer storms. It stabilizes existing sand, encourages the accumulation of new sediment, and contributes to increasing both the height and mass of dune crests. The dynamic interaction between plants and sediment is particularly noticeable as vegetation attempts to grow faster than the accumulating sand layers [1]. Many of these activities have caused severe degradation of dune ecosystems, leading to the loss of valuable ecological services [2]. According to UNCED [3], over 50% of the global population lives within 60 kilometers of the coast, intensifying pressure on these natural features. In the Mediterranean, dune habitats have undergone significant decline in recent decades, mainly due to expanding urban areas that reshape dune contours and fragment native vegetation communities [4,5]. However, restoration projects have proven effective in strengthening shorelines, preventing erosion during storm events, facilitating the reestablishment of dune structures, and improving coastal plant diversity [6,7,8]. Dunes also serve as vital ecosystems and natural defenses. In regions experiencing high tourism, they often suffer from degradation caused by trampling and overuse, which diminishes their ecological and protective functions. Restoration actions have helped foster vegetation regrowth and mitigate further deterioration [9,10].
Successful dune rehabilitation has resulted in the emergence of embryonic dunes and an overall upward trend in sediment accumulation. Native vegetation patterns have largely reestablished, though the presence of non-native or opportunistic species still reflects ongoing anthropogenic influence [11,12]. Progressive physical and biological degradation of coastal environments disrupts natural processes and coastal dynamics, flattens topographical features, fragments or destroys habitats, reduces biodiversity, and places pressure on endemic species [13,14]. In Spain, research on the deterioration of coastal dunes dates back to the 1970s [15,16]. Approaches to rehabilitating disturbed coastal areas vary depending on initial site conditions, the extent of degradation, and the time elapsed since the cessation of disruptive human activity [17,18]. In Catalonia (northwestern Mediterranean), recent studies of coastal dune changes indicate that completely vanished dunes were predominantly located in low-lying, unprotected coastal zones. The remaining dune formations, while often smaller in size, tend to be situated within protected areas or adjacent to rocky coastlines [19]. These coastal zones not only serve as key habitats but also play a vital role in providing ecosystem services and supporting the tourism economy. Yet their sensitivity to coastal erosion poses a serious threat. To restore ecological function and enhance the benefits provided by these ecosystems, restoration strategies should prioritize the protection and rehabilitation of coastal dune systems as an essential part of managing natural coastal resources [20,21]. Sandy coasts and dune systems exist across a wide range of latitudes and are estimated to comprise roughly 34% of the world’s coastlines [22]. These ecosystems deliver critical services such as storm buffering, erosion control, water filtration, habitat provision, carbon sequestration, and opportunities for tourism, leisure, and scientific research [23,24,25].
Located at the intersection of land and sea, coastal dunes represent dynamic and complex landscapes with high levels of ecological richness. The plant communities found within these systems display specialized adaptations, forming characteristic zones that stretch from the seaward foredunes to more sheltered inland areas [26,27]. Unfortunately, these ecosystems have experienced extensive degradation due to anthropogenic pressures, resulting in a marked decline in their ecological functions and services [2]. Despite their fragility, dune systems remain essential in mitigating wave impacts, capturing sediment, and lowering the risks of coastal flooding [28,29]. Coastal dunes, occurring in transitional areas where marine and terrestrial systems converge, encompass some of the planet’s most ecologically diverse and visually striking landscapes [30,31,32,33]. Their biodiversity stems from both environmental heterogeneity and variations in species assemblages [34,35,36]. Nevertheless, these systems are among the most vulnerable natural habitats [14,27,31,32,37]. Mediterranean coastal dunes in particular have undergone substantial decline over the past few decades [27,38,39]. Globally, dune habitats harbor a wealth of plant species, many of which are considered vulnerable and in need of protection [40].
In Tunisia, the northern coastal region features several dune massifs formed by the inland progression of significant marine sand deposits driven by prevailing northwesterly winds. These dune systems, unless naturally limited by wadis, cultivated areas, or spontaneous vegetation, pose a serious risk of encroachment onto agricultural and inhabited lands [41]. The extreme northern coast of Tunisia, recognized for its ecological fragility, remained largely outside the socio-economic development process until the late 1990s [42]. Despite extensive dune stabilization efforts – initiated during the colonial period and continued through reforestation, soil and water conservation measures – the achieved stability remains tenuous in high-erosion-risk zones. Persistent pressures from local communities, such as land clearing and fire, along with informal tourism activities, continue to degrade the natural environment. These anthropogenic influences, compounded in recent years by growing interest from economic developers, threaten the region’s ecological integrity. Notably, the Zouaraa-Nefza dunes have been the focus of earlier dune stabilization and forest restoration initiatives [43].
Recent studies underscore the dynamic interplay between physical forces (e.g., wind and sand transport) and biological processes (e.g., vegetation colonization and soil development) that govern dune stability in Tunisia. Vegetation plays a crucial role by acting as a natural windbreak, thereby limiting aeolian sand movement and promoting dune consolidation [44,45]. Moreover, morphological and ecological transformations observed in Tunisian coastal dunes indicate that restoration interventions have led to increased vegetation cover and improved dune stability. These outcomes highlight the effectiveness of revegetation techniques in protecting and maintaining coastal dune systems [46]. The restoration activities initiated in the early 1960s by the Tunisian Forest Services aimed to control the movement of approximately 50,000 hectares of shifting sands that posed a threat to spontaneous forest stands, pastoral vegetation, as well as to nearby human settlements and economic activities in the Ouechtata region [41,47,48]. This large-scale stabilization strategy involved a two-phase process: initial physical fixation of the dunes, followed by biological stabilization through vegetation planting [41]. According to the regional forestry administration, the Zouaraa coastal dunes have since followed a largely natural trajectory, with minimal human disturbance post-restoration, resulting in sustained ecosystem stability [47].
However, a critical knowledge gap persists. Despite decades of forest restoration efforts, the long-term effectiveness of these interventions has never been systematically quantified using spatially explicit methods. Most previous assessments rely on localized field observations or administrative records, which are difficult to scale across the landscape and cannot capture gradual land cover transitions. Furthermore, the impact of recurrent fires on restored dune vegetation remains poorly understood. Fire not only reduces above-ground biomass but may also destabilize previously fixed dunes by removing protective plant cover, potentially reversing years of ecological gains. To date, no integrated assessment has linked restoration outcomes, fire-induced vegetation loss, and associated carbon dynamics within a single analytical framework for Tunisian coastal dunes.
This study directly addresses these gaps. Assessing the long-term effectiveness of forest restoration efforts across extensive coastal sites through field surveys is time-consuming and costly. Remote sensing (RS) can expedite and simplify this process by providing repeatable, spatially explicit observations. Multispectral imagery with a resolution of 10–250 m, particularly bands in the red and infrared spectra, is commonly used for vegetation monitoring due to its high informational value [49,50]. To classify different land cover types within such imagery, machine learning methods are employed to categorize pixels into predefined classes [51,52]. This approach is more cost-effective than ground-based surveys and enables rapid assessment and analysis of land cover changes over time.
Fire strongly affects forest biomass and the structural composition of vegetation communities [53,54]. The ecological effects of fire vary according to its intensity and severity. Pourreza [55] reported that low-intensity fires may enhance plant diversity, whereas severe fires generally produce negative ecological consequences. Changes in fire frequency and severity can therefore significantly alter forest ecosystem functioning. Understory vegetation plays a key role in maintaining forest biodiversity [56,57,58]. However, disturbances such as fire and timber harvesting are among the major factors influencing the composition and dynamics of forest understory communities [59,60]. In the context of restored coastal dunes, however, fire effects remain critically understudied.
The hypotheses of our study are: (i) The forest restoration efforts undertaken since the 1960s have significantly contributed to the stabilization of coastal dunes, with a noticeable improvement in vegetation cover in the treated areas. (ii) Spatio-temporal analysis of satellite data reveals a gradual reduction in mobile sand areas in favor of fixed or semi-fixed surfaces, indicating a positive evolution of land cover due to restoration and anthropogenic expansion. The relative contribution of each process will be quantified to avoid overestimating restoration success. (iii) Fire has significant negative effects reforested pine stands, leading to measurable biomass and carbon loss.
The primary aim of this study is to evaluate the effectiveness of coastal forest restoration efforts and to quantify land cover changes over time using RS and Geographic Information System (GIS) tools. Additionally, the study seeks to assess the spatio-temporal dynamics of forest cover within the coastal area through these technologies. Finally, it aims to investigate the effects of fire on ecosystem restoration, as well as biomass and carbon loss.
2. Materials and Methods
2.1. Study Area
The Zouarâa area (Figure 1) is largely located on coastal dunes established for sand stabilization and belongs to the Nefza delegation, Béja Governorate, northern Tunisia. It is part of the Tabarka–Nefza dune system. Most of the forest area lies on moderately uneven terrain, with slopes ranging between 15 and 40%, while the remaining perimeter is characterized by gentle slopes not exceeding 10%. The forest has an average altitude of approximately 100 m and a north-western exposure [61]. The climate is Mediterranean with mild winters and long summer dry periods lasting between five and six months. Mean annual temperature is 18.8 °C. Average annual rainfall is 934 mm [62]. According to bioclimatic classification, the area belongs to the lower humid bioclimatic zone with a mild winter variant. Winds are particularly strong in the region, predominantly from the north-west, and occur mainly from December to late March. Soils within the dune forest consist primarily of sandy aeolian deposits or clay-silt alluvial deposits. Forest Plantations dominated by stone pine (Pinus pinea), maritime pine (Pinus pinaster), and Acacia species were carried out between 1950 and 1975. Stone pine occupies approximately 418 ha in pure or mixed stands. The most significant stone pine plantations were established in recent years to restore vacant areas [61].
2.2. Data
The study spans a 30-year period (1994-2024). Multispectral images from Landsat 5, 7, 8, and 9 were acquired at two-year intervals, resulting in a total of 17 images. These images were obtained using the Google Earth Engine (GEE) platform. During periods when multiple Landsat satellites were operational simultaneously, preference was given to newer missions. However, between 2003 and 2013, Landsat 7 images contained gaps due to the Scan Line Corrector (SLC) failure, so Landsat 5 data were used to compensate for missing bands.
To obtain cloud-free composites, Level-2 processed images with atmospheric correction from the spring months (March–May) were selected. Cloud masking was applied using GEE’s maskL457sr (for Landsat 5 and 7) maskL8sr (for Landsat 8 and 9) algorithms. After atmospheric correction, the panchromatic band (B8) was excluded from Landsat 5 and 7 datasets, while the cirrus (B9) and thermal infrared (B11) bands were excluded from Landsat 8 and 9 datasets. A median composite image was generated for the entire study period and exported as a GeoTIFF file with 30 m resolution, with each spectral band stored as a separate layer.

Table 1.
Satellite imagery dataset.
| Satellite | Years | Bands |
| Landsat 5 TM | 1994, 1996, 1998, 2000, 2004, 2006, 2008, 2010 | B1 – Blue B2 – Green B3 – Red B4 – Near Infrared (NIR) B5 – SWIR1 B6 – Thermal Infrared B7 – SWIR2 |
| Landsat 7 ETM+ | 2002, 2008, 2012 | |
| Landsat 8 OLI | 2014, 2016, 2018, 2020 | B1 – Coastal aerosol B2 – Blue B3 – Green B4 – Red B5 – NIR B6 – SWIR1 B7 – SWIR2 B10 – Thermal Infrared |
| Landsat 9 OLI-2 | 2022, 2024 |
2.3. Vegetation Indices
To enhance classification accuracy, widely used vegetation indices were calculated from the spectral bands [49,63]. These indices combine multiple spectral bands to improve land cover discrimination.
Normalised Difference Vegetation Index (NDVI, [64]) is used for vegetation identification:
Normalized Difference Water Index (NDWI, [65]) designed to detect open water and distinguish it from vegetation and soil:
Normalized Difference Built-up Index (NDBI, [66]) utilizes the reflectance features of built-up areas to distinguish them from land cover:
Normalized Differential Sand Areas Index (NDSAI, [67]) used to detect sandy regions with low moisture content compared to other classes:
Normalized Differential Sand Dune Index (NDSDI, [68]) Aids in distinguishing sand dunes from other soil types:
2.4. Research Methods
Based on the land cover distribution in the study area, seven classes were selected as the most representative: Water, Sand, Urban, Forest, Shrubs, Agriculture, and Bare Soil. The Urban class encompasses all anthropogenic structures, primarily buildings and roads. The Shrubs class includes low, sparse vegetation within forests and mechanical dune stabilization plants along the coast. Bare soil refers to exposed soil surfaces devoid of vegetation. The Burned class was also added to the set to identify burned trees in the 2023 forest fire.
To disentangle ecological restoration from infrastructure-driven land conversion, we defined a set of anthropogenic masks: (i) the Sidi El Barrak Dam reservoir, delineated from the Water class and verified against historical construction records (1990–2000); (ii) the Tabarka–Ain Draham International Airport (240 ha, inaugurated 1992), digitized from VHR imagery; and (iii) all pixels classified as Water and Urban. Pixels falling within these masks were excluded from the "natural stabilization" analysis. Sand-to-vegetation transitions occurring outside these masks were attributed to restoration and natural succession, while sand-to-water and sand-to-urban transitions were classified as anthropogenic. This approach allowed us to quantify the relative contribution of each driver to the observed sand decline.
Satellite image classification was performed using Random Forest machine learning method from the Python scikit-learn library, which has demonstrated robust performance in similar studies [49,52,69]. The model was configured with 500 trees, while other parameters retained their default values. Classification quality was assessed using overall accuracy, precision, recall, and F1-score, calculated at each step of a 10-fold cross-validation process. The final metrics were derived as the mean values across all iterations. Feature importance was evaluated using the Random Forest’s built-in feature importances method.
A different training sample was created for each year of the study period. Manual labeling was performed in QGIS by delineating polygons for each class on the satellite imagery. The primary reference data were very-high-resolution (VHR) images from Google Earth, with a spatial resolution of ≤ 0.5 m, acquired as close as possible to the corresponding Landsat overpass date. For years without VHR coverage, the closest available date (±1 year) was used, and land cover stability was visually verified using temporal series of false-color composites. On average, 250 polygons were annotated per year, with a minimum of 30 polygons per class to capture spectral heterogeneity.
2.5. Biomass and Carbon Losses Caused by Fire in Restored Ecosystems
To estimate fire-induced biomass losses, we conducted a field survey in May 2021, approximately two years before the 2023 wildfire, within the area that would subsequently be affected by the fire. A total of 31 permanent plots (20 m × 20 m each) were established using a stratified random design to capture the variability in tree density, diameter classes, and micro-topography. All plots were georeferenced using WGS 1984 decimal degree coordinates. Within each plot, we recorded total number of trees, diameter at breast height (DBH, 1.3 m) for all individuals with DBH ≥ 5 cm, and total tree height.
Aboveground biomass (AGB) per tree was estimated using the species-specific allometric equation developed by [70,71,72,73,74] for Pinus pinea:
AGB = a × DBHb × Hc
Plot-level AGB (t ⋅ ha−1) was calculated as the sum of individual tree biomass divided by plot area, then converted to carbon using a locally derived conversion factor of 0.472 [75,76]. To extrapolate plot measurements to the entire study area, we trained a Random Forest regression model using the 31 field plots as ground truth, with Landsat 9 spectral bands and vegetation indices as predictors. The trained model was applied to cloud-free Landsat 9 composites from 2022 (pre-fire) and 2024 (post-fire) to produce continuous biomass maps. Carbon maps were derived by multiplying biomass maps by 0.472. The difference between 2022 and 2024 maps provided spatially explicit estimates of biomass and carbon losses attributable to the fire.
3. Results
3.1. Evaluation of Accuracy and Feature Importance
The classification achieved high performance metrics: Average accuracy=98.03%, Precision=0.9456, Recall=0.9262, F1-score=0.9802. Feature importance analysis (Table 2) revealed that vegetation indices contributed minimally to the model. The NDSDI index was the least influential in both Landsat datasets (5&7 and 8&9). Excluding vegetation indices resulted in marginally lower performance (accuracy = 97.81%, F1 = 0.9779). The most important spectral bands were NIR, SWIR1, and Green, with the Green band ranking second in Landsat 5&7 and third in Landsat 8&9. Among vegetation indices, the NDWI (water index) exhibited the highest importance in both datasets.
3.2. Land Area Changes by Categories
The spatio-temporal analysis of land-cover changes revealed substantial landscape transformations over the 30-year study period (Table 3; Figure 2), highlighted by a 42.9% net reduction in coastal sand dunes from 2,209 ha to 1,262 ha. We observed a significant expansion of the urban area within the study zone, which increased from 50 ha in 1994 to 325 ha in 2024, which is 550% increase and indicates strong anthropogenic pressure on the coastal zone. Water bodies increased by +18.5% due to the construction of dams in the region. Bare soil and agricultural land also expanded considerably (+44.9% and +36.8%, respectively). In general, the area of agricultural land shows trends of decreasing or increasing depending on rainfall, as most agricultural practices are seasonal and rely heavily on precipitation, particularly cereal cropping and market gardening. Shrub cover, an important component of dune vegetation, declined by a quarter (–25.7%), while forest areas increased slightly from 10,639 ha in 1994 to 11,078 ha in 2024 (+4%).
3.3. Dune Stabilization Results
The dynamic of dune area reduction is driven by two distinct opposing forces: active ecological restoration through vegetation expansion and direct anthropogenic modifications.
Environmental restoration efforts emerged as the dominant driver of sand dune contraction, transforming 54% (Table 3) of the initial sand landscape into stabilized green infrastructure (Forest and Shrub classes). A total of 996 ha (45.1%) of moving sand dunes successfully transitioned into shrubland. An additional 196 ha (8.9%) developed into permanent forest cover, validating the long-term success of intentional tree-planting initiatives, particularly plantations of stone pine (Pinus pinea) and Acacia cyclops, which were established in the region. This represents the primary stabilizing pathway, indicating effective sand-fixation projects and natural ecological succession. A minor fraction of 14 ha (0.6%) was converted to agricultural lands.
Beyond biological restoration, physical engineering and urban sprawl directly altered the dune topography, accounting for 14.6% of direct sand area loss. Within the study area, the Sidi El Barrak Dam represents a major water retention structure that created a large reservoir in the region. Its construction began in the 1990s and was completed in the early 2000s, which explains the increase in water areas observed since 2000. Due to the establishment of the dam, 291 ha (13.2%) of previous coastal sand dunes were physically submerged, contributing to a massive net growth of the total water surface area from 10,159 ha to 12,043 ha. Urban and infrastructure development directly paved over 32 ha (1.45%) of the sand matrix, marking an irreversible artificial footprint on the dune boundaries.
Despite a heavy net loss, the sand category received secondary inputs totaling 593 ha from surrounding landscapes. A significant 463 ha of shrubland degraded back to exposed moving sand, serving as a key indicator of post-fire ecosystem vulnerability or intense drought impacts. This increase is mainly due to illegal logging, forest fires, anthropogenic pressures, and tree mortality affecting dune-fixing species, particularly Acacia species, which generally have a relatively short lifespan of 15 to 25 years. Combined conversions from degraded farmland (65 ha) and bare soil (42 ha) highlighted active localized land degradation risks.
To isolate the effect of active restoration from confounding infrastructure development, we analysed a subset of the study area where no major infrastructure was built between 1994 and 2024. In this 'stabilization-only zone' (Table 4), sand decreased from 1,902 ha to 672 ha (–64.7%), while Forest increased from 1516 ha to 2038 ha (+34.4%) and Shrubland from 2,305 ha to 2,519 ha (+9.3%). These changes occurred in the absence of dam or airport footprints, providing strong evidence that restoration interventions effectively stabilized mobile dunes. The magnitude of sand reduction in this zone (–64.7%) was substantially higher than in the area overall (–42.9%), confirming that large-scale infrastructure partly masks the true success of ecological restoration.
Figure 3 illustrates the relative proportions of the four dominant classes (Water, Sand, Forest, and Shrub) revealing a notable reduction in sandy areas concurrent with expansions in forested, shrubland, and water zones.
Figure 4 displays the land cover classification maps for the initial (1994) and final (2024) years of the study period, highlighting spatial and temporal transformations. Figure 3 and Figure 4 show that the construction of the Sidi El Barrak Dam in 2000 on sand dune areas required substantial reforestation efforts around the reservoir. These interventions aimed to stabilize the dam banks, increase the dam’s lifespan, and prevent siltation caused by sediment accumulation. The main tree species used for reforestation to protect the dam and surrounding forest areas were stone pine (Pinus pinea) and maritime pine (Pinus pinaster), while shrub species included Acacia cyclops and Acacia cyanophylla. We also observed a marked expansion of urban areas, particularly following the construction of the airport.
The Tabarka-Aïn Draham International Airport, located in the northwest of our study area (Figure 4), was inaugurated in 1992 and covers an area of 240 ha. It was established within forested areas, including reforested zones and stabilized dunes. We observed that urban areas have developed all around the airport, driven by tourism activities and the creation of employment in the region. Many agricultural lands have been converted for residential construction by the local population, contributing to the expansion of urban zones surrounding the airport.
Figure 5 illustrates the installation of the dam on sand dune areas. This process lasted approximately ten years, from 1990 to 2000. The dam occupied a substantial portion of the sand dune system, and reforestation activities were intensified to stabilize the surrounding dunes. These interventions were mainly implemented around the dam, within depression areas, and along the hydrographic network that channels rainfall runoff toward the reservoir. The primary objective was to reduce sand encroachment and sedimentation within the dam.
Figure 6 and Figure 7 presents the dynamics of sand and vegetation cover from 1994 to 2024, analyzing changes in both the coastal fragment and the entire study area. Loss is the transition from the target class to another class, growth is the transition from other classes to the target class, and stable state is the persistence of the original land cover class.
Figure 6 and Figure 7 show that a significant portion of the lost dunes now corresponds to the area occupied by the dam, which was constructed between 1990 and 2000. The figures also indicate that vegetation loss occurs primarily around urban areas, which can be explained by the expansion of urban zones into other land types, including uncultivated land, agricultural fields, and forested areas.
Stable vegetation consists of dune-fixation plantations established since the 1960s, as part of reforestation efforts carried out after independence in 1956, when the region experienced severe sand encroachment on homes and successive road closures. Vegetation growth refers to both naturally regenerated vegetation and reforestation associated with dam construction, mainly composed of pine and Acacia species.
3.4. Dynamics of the Urban and Agriculture
Between 1994 and 2024, urban expansion occurred primarily at the expense of shrubland, agriculture, and sand cover, while forest loss was negligible (Table 5). We observed that the construction and expansion of houses by the local population occurred largely on sand dunes, where residents cleared dune-stabilizing plantations to build their homes. Urban expansion has also affected the shrubland stratum, particularly after 2010, a period marked by political instability, weak law enforcement, and numerous infractions. Peak shrubland losses amounted to 59.51 ha (2016–2018) and 61.88 ha (2020–2022). Compared to the first year of the simulation, shrubland conversion to urban uses 135.53 hectares, making it the primary source of urban expansion.
Agriculture emerged as the second-largest contributor, with accelerating losses in recent intervals: from 30.00 ha in 2016–2018 to 43.07 ha in 2018–2020, 36.18 ha in 2020–2022, and peaking at 48.09 ha in 2022–2024, indicating growing pressure from urban sprawl on agricultural land. Over the past two decades, droughts have forced many farmers to convert their fields into construction plots. Since 2010, the study area has also seen the development of guesthouses and tourism-related facilities, given its proximity to the tourist zone of Tabarka. As a result, many local residents have built residences to accommodate tourists. Sand areas were also consistently converted to urban uses, with losses increasing markedly after 2010, peaking at 34.03 ha in 2014–2016 and remaining high (22–26 ha) in subsequent periods. In contrast, forest contributed minimally to urban expansion throughout the study period, with most intervals showing negligible or zero loss (0–0.14 ha), and only a single interval (2018–2020) recording 1.79 ha. These results confirm that urbanization has directly reduced ecologically valuable shrubland and sand dune surfaces, partially offsetting restoration gains. Overall, the table demonstrates that urban expansion in the study area has primarily been realized through the conversion of shrubland, agricultural land, and sand-covered surfaces, with the intensity of conversion accelerating notably after 2010. It is also notable that, following the political changes at the end of 2010, urban expansion became significant due to weak state control, with a peak in urban growth observed between 2014 and 2016.
Table 6 and Figure 8 show the expansion of agricultural land at the expense of other land cover classes. The data reveal that shrubland was by far the dominant source of agricultural expansion throughout the entire study period (1994–2024). Shrubland conversion peaked in two distinct intervals: 1998–2002 (2,365.26 ha) and 2010–2012 (2,219.74 ha), with consistently high values exceeding 556 ha in all intervals, indicating a sustained and massive transformation of shrub-dominated ecosystems into cropland.
Forest also played a substantial role, with notable peaks in 1994–1998 (201.29 ha), 2010–2012 (213.78 ha), 2018–2020 (399.49 ha), and 2020–2022 (395.05 ha). The acceleration of forest conversion after 2018 is particularly striking, suggesting increased pressure on wooded areas during the most recent decade. Sand contributed the least overall, but a remarkable peak occurred in 2014–2016 (263.17 ha), indicating a temporary but intense episode of dune conversion to agriculture.
We observed that agriculture in the region still depends largely on rainfall. During rainy years, agricultural activity intensifies, particularly for market gardening and vegetable crops. Agricultural expansion also occurs within the shrubland stratum, as the local population has established orchards, especially olive groves, driven by the high international demand for olive oil.
Sand contributed the least overall, but a remarkable peak occurred in 2014–2016 (263.17 ha), indicating a temporary but intense episode of dune conversion to agriculture. Bare soil showed moderate contributions, with the highest values in 2012–2014 (344.58 ha) and 2014–2016 (744.94 ha), the latter representing the single largest contribution from this class.
The temporal pattern reveals two phases of particularly intense agricultural expansion: the early period (1994–2002) driven primarily by shrubland and forest, and the period after 2010, characterized by renewed high pressure on shrubland and forest, alongside significant contributions from sand and bare soil. Overall, agricultural encroachment has been a major driver of landscape change, disproportionately affecting shrubland ecosystems while also making substantial inroads into forest and, at times, coastal sand deposits.
3.5. Post-Fire Carbon and Biomass Loss
The July 2023 wildfire affected approximately 120 ha of restored coastal dune vegetation. This event provided a rare opportunity to quantify fire-induced biomass and carbon losses in a non-pyrogenic ecosystem. The impact of fire on the restored coastal dune ecosystem is documented in Figure 9, which presents a visual comparison of the study area before and after the fire event, showing extensive burning of forest and shrubland. Figure 10 provides a quantitative estimate of the immediate ecological losses, indicating that biomass losses reached 264.19 t ⋅ ha−1, while carbon losses amounted to 124.17 t ⋅ ha−1.
Table 7 complements these findings by detailing land cover changes between 2022 (pre-fire) and 2024 (post-fire). Before the fire, the area was characterized by 171 ha of forest and 239 ha of shrubland, with only 20 ha of bare soil. Following the fire, forest cover dramatically decreased to 69 ha (a loss of 102 ha), and shrubland declined to 197 ha (a loss of 42 ha). Concurrently, bare soil expanded from 20 ha to 131 ha, representing an increase of 111 ha, which directly corresponds to the area where vegetation was completely removed by fire. Additionally, 63 ha were classified as burned in 2024, indicating areas that remain visibly affected but not yet converted to bare soil.
Overall, these results demonstrate that a single fire event severely reversed decades of restoration gains, converting established forest and shrubland into bare soil and burned landscapes, with substantial associated losses of biomass and carbon stocks.
4. Discussion
4.1. Assessment of Coastal Forest Ecosystem Restoration
Our results show that vegetation in dune systems (grasses, shrubs, and trees) plays a fundamental role in stabilizing dunes and reducing wind-driven sand transport. This finding is consistent with [44], who demonstrated that dense vegetation on foredunes not only limits erosion but also promotes organic matter accumulation and pedogenesis processes, thereby strengthening coastal ecosystem stability. Furthermore, the evolution observed in our study area highlights an overall improvement in ecosystem stability following restoration actions. This positive trend, marked by increased stabilization over the last decade, is consistent with Motte [41], who emphasized the importance of reforestation efforts initiated in the 1960s to ensure long-term sand fixation while also generating significant economic and social benefits, particularly in terms of timber production and employment.
However, despite these improvements, our observations still indicate a persistent anthropogenic influence, particularly through dam construction and the presence of an airport within restored areas. On one hand, sand cover decreased substantially by 42.9% between 1994 and 2024, indicating effective reduction of mobile sand surfaces – a primary goal of the stabilization interventions initiated by the Tunisian Forest Services [47]. On the other hand, shrubland declined by 25.8%, suggesting that agricultural encroachment and fire have negatively impacted shrub communities. Thus, restoration has succeeded in stabilizing sand but has not fully reversed the loss of native shrub vegetation. This situation aligns with the findings of Calafat [11], who showed that even after restoration, dune systems may retain an ecological signature linked to past human disturbances. The building of the Sidi El Barrak dam on forested and agricultural areas has modified the natural functioning of the system, in agreement with Kassouk [44], who reported that dam development in coastal zones disturbs river dynamics and reduces sediment transfer toward the cape, resulting in sediment buildup along the shoreline.
Moreover, the dynamics observed at our site, characterized by a transition toward aggradation processes and a partial recovery of the typical dune vegetation composition, reflect the partial success of restoration efforts. However, this positive trend must be interpreted with caution. Table 5 reveals that urbanization directly consumed sand areas (e.g., 34.03 ha in 2014–2016), meaning that part of the sand reduction is attributable to land take rather than ecological stabilization. Nevertheless, the overall trajectory remains consistent with successful long-term dune fixation. As highlighted by Montoni [17], the degree of recovery strongly depends on the initial state of the site, the level of degradation, and the time elapsed since the cessation of anthropogenic activities, which explains the spatial and temporal variability observed in our study area. In this context, our findings confirm that ecological restoration cannot be fully effective without sustainable and continuous coastal management. Indeed, Della Bella [2] emphasize the urgent need to implement sustainable management measures to address increasing pressures on coastal ecosystems, particularly climate change and human activities. Finally, our results also confirm that geomorphological and ecological characteristics strongly control dune dynamics and their regeneration capacity. This is consistent with Pinna [4], who show that the presence, typology, and development of dunes are closely dependent on these environmental factors. Moreover, Prisco [40] highlight the importance of guiding coastal dune management toward the conservation of threatened habitats characterized by high biodiversity, in order to ensure their long-term preservation.
4.2. Assessment of Biomass Production in Stone Pine (Pinus Pinea) Coastal Dunes in Tunisia
Based on dendrometric measurements from the study plots and using pre-established allometric models, the biomass production of stone pine (Pinus pinea) in our study area was estimated at an average of 264 t ⋅ ha−1. In this context, Rapp and Cabanettes [77] in the study “Biomass and Productivity of a Pinus pinea L. stand”, the biomass of the site was estimated at 178.8 t ⋅ ha−1. These values can be compared with those reported by Rodin and Bazilevich [78], who indicated that for a 33-year-old Pinus sylvestris stand, a 22-year-old Pinus nigra stand, and a 32-year-old Picea abies stand, the aboveground biomass values were 140, 142, and 169 t ⋅ ha−1, respectively. Rapp [79] estimated the aboveground biomass of a 60-year-old Pinus halepensis plantation at 157 t ⋅ ha−1. According to Gonçalves [80], in a 45 m × 45 m plot (2025 m2) of Pinus pinea, the mean aboveground biomass per plot was 11,792.6 kg. According to Correia [81], in a study based on 101 Pinus pinea plots used for inventory and biomass calculations, the aboveground biomass of stone pine ranges between 7 and 194 t ⋅ ha−1. According to Cutini [72], in a study of biomass of stone pine (Pinus pinea L.) in Italian coastal stands, aboveground biomass varies between 108.7 and 236 t ⋅ ha−1.
The relatively high biomass (264 t ⋅ ha−1) recorded in our study area, may be attributed to: (i) the older age and higher density of our Pinus pinea stands, (ii) the favourable Mediterranean climate (934 mm annual rainfall) which supports rapid growth, and (iii) the low-intensity management history of the coastal forest, allowing continuous biomass accumulation. These findings have important implications for forest management: the substantial carbon stocks stored in restored coastal forests highlight their role in climate change mitigation, while the high fuel accumulation also increases wildfire risk, underscoring the need for integrated fire prevention strategies in coastal forest restoration planning.
4.3. Fire Effects on Carbon Losses
The wildfire that occurred in July 2023 in the Zouaraa study area was included in analysis due to its exceptional nature in this coastal dune ecosystem, which is generally characterized by low fire susceptibility. This event affected approximately 120 ha of natural vegetation cover, leading to a significant disturbance of ecosystem structure. The fire was brought under control following intervention by civil protection services within a relatively short period, according to available reports. Its inclusion is justified by its direct impact on carbon loss estimates and post-fire recovery dynamics. Indeed, excluding this event would result in an overestimation of carbon stocks and a biased interpretation of remote sensing-derived results. Furthermore, this wildfire provides a rare opportunity to assess the response of a non-pyrogenic coastal ecosystem to an acute disturbance. It also improves our understanding of the vulnerability of Mediterranean dune systems to extreme stress events. Integrating this fire therefore strengthens the robustness of the carbon loss assessment. Finally, it contributes to a more realistic interpretation of post-disturbance ecological restoration trajectories.
Our results revealed substantial biomass and carbon losses in Pinus pinea stands following fire disturbance, with biomass losses reaching 264.19 t ⋅ ha−1 and carbon losses estimated at 124.17 t ⋅ ha−1. These findings highlight the major ecological consequences of wildfires on Mediterranean forest ecosystems, particularly in coastal pine forests where vegetation recovery may require long periods under increasing climatic stress. In Tunisia, Belhadj-Khedher [82] reported that wildfires affect an average of 1799 ha annually. The highest burned areas were concentrated in the humid and sub-humid northern coastal regions dominated by evergreen Quercus spp. ecosystems and associated shrublands. These ecosystems are characterized by abundant fuel availability, recurrent summer drought lasting approximately two months, and high summer temperatures, which together increase fire susceptibility and intensity.
Despite these recurrent disturbances, Tunisia remains within the lower range of burned areas across the Mediterranean Basin compared with other Mediterranean countries [82,83]. The carbon losses observed in the present study are consistent with previous estimates reported for Mediterranean pine forests. Rezgui [84] showed that total carbon stocks in Pinus halepensis forests in Tunisia ranged from 29.05 to 92.47 t ⋅ ha−1, while aboveground biomass varied between 46.02 and 148.08 t ⋅ ha−1. These values are comparable to those reported for other Pinus species in Tunisia and other Mediterranean regions, including Portugal and Spain.
The relatively high biomass losses recorded in our study may therefore reflect both the large fuel accumulation within Pinus pinea stands and the high fire severity affecting restored coastal ecosystems. Similar patterns have been documented in other Mediterranean and temperate forests. Lilian Vallet [85] demonstrated that the exceptional 2022 fire season in France resulted in unprecedented biomass losses, particularly in Atlantic pine and temperate forests. In Atlantic pine forests, biomass losses were mainly associated with a dramatic increase in burned area, while in temperate forests both burned area expansion and high pre-fire biomass contributed to severe carbon losses. Total biomass loss in French forests during the 2022 fire season reached approximately 2.553 Mt, representing a 17 % increase relative to the average natural mortality of forests.
Furthermore, the observed biomass and carbon loss (have implications beyond local ecology. Coastal dunes are recognized as important carbon sinks [7,86], and their destruction by fire releases stored carbon into the atmosphere, contributing to greenhouse gas emissions. In regions where fire frequency may increase due to climate change or human activity, the long-term viability of dune restoration as a nature-based solution for coastal protection could be compromised. Post-fire recovery of Mediterranean pine forests typically requires 15–30 years for aboveground biomass to return to pre-fire levels [87]. However, in dune ecosystems, recovery may be slower due to water stress and the loss of soil organic matter. The 63 ha classified as 'burned' in 2024 (Table 7) represent an intermediate state; their trajectory will depend on seed bank viability, post-fire management (e.g., soil stabilization, planting), and rainfall patterns. Without active intervention, these areas may remain degraded and revert to bare sand, reversing restoration gains.
These observations confirm that fire-induced carbon emissions are becoming a major ecological issue under changing climate conditions. Overall, our findings emphasize that wildfire represents a critical driver of carbon stock reduction and ecosystem degradation in Mediterranean coastal forests. Increasing fire frequency and severity under climate change may considerably reduce the carbon sequestration capacity of restored forest ecosystems, threatening both biodiversity conservation and long-term ecosystem resilience. Future restoration strategies should explicitly incorporate fire prevention and post-fire rehabilitation measures, particularly in areas where restored vegetation has created continuous fuel loads.
5. Conclusions
This study demonstrates the value of long-term remote sensing time-series for tracking forest dynamics in Mediterranean coastal dunes. Our results demonstrate that ecological restoration interventions, initiated in the 1960s and reinforced after the construction of the Sidi El Barrak Dam, have contributed significantly to dune stabilization and vegetation recovery. Over the 30-year study period (1994–2024), mobile sand areas declined by 42.9% across the entire study region, with 78% of sand reduction due to vegetation restoration.
Several limitations should be acknowledged. First, our biomass estimates are based on aboveground measurements only, belowground carbon pools were not quantified, which may underestimate total carbon stocks. Second, the 31 field plots, while representative, limited the complexity of the Random Forest model, larger sample sizes would improve spatial predictions. Third, the analysis of fire effects is based on a single fire event, which limits generalizability. Long-term monitoring of post-fire recovery is needed to assess resilience.
Our findings have direct implications for coastal forest management and restoration planning. The success of dune reforestation with Pinus pinea and Acacia species demonstrates the effectiveness of nature-based solutions for coastal forest restoration. However, the substantial biomass losses caused by wildfire (264.19 t·ha−1) highlight the vulnerability of Mediterranean coastal forests to climate-driven disturbances. We recommend integrating fire prevention measures into restoration strategies, particularly in areas where continuous fuel loads have developed. The spatially explicit, multi-temporal framework presented here provides a replicable methodology for assessing forest vegetation dynamics and restoration outcomes in other Mediterranean coastal regions facing similar challenges.
Author Contributions
Conceptualization, Z.S., W.J., A.P. and H.A.; methodology, A.P., W.J., Z.S., M.A., H.A., K.M. and M.M.; software, A.P. and Z.S.; validation, Z.S., A.P., W.J. and K.M.; resources, W.J., A.P. and K.M.; data curation, Z.S., A.P., W.J., M.A., H.A., K.M. and M.M.; writing—review and editing, Z.S., A.P., W.J., M.A., H.A., K.M. and M.M.; visualization, Z.S., A.P., W.J., M.A., K.M. and M.M.; supervision, A.P. and W.J. All authors have read and agreed to the published version of the manuscript.
Funding
This research received no external funding.
Acknowledgments
We acknowledge Princess Nourah bint Abdulrahman University Researchers Supporting Project number (PNURSP2026R84), Princess Nourah bint Abdulrahman University, Riyadh, Saudi Arabia for support.
Conflicts of Interest
The authors declare no conflicts of interest. The funders had no role in the design of the study; in the collection, analyses, or interpretation of data; in the writing of the manuscript; or in the decision to publish the results.
References
- Jackson, D.W.T.; Costas, S.; González-Villanueva, R.; Cooper, A. A Global ‘Greening’ of Coastal Dunes: An Integrated Consequence of Climate Change? Glob. Planet. Chang. 2019, 182, 103026. [Google Scholar] [CrossRef]
- Della Bella, A.; Del Vecchio, S.; Fantinato, E.; Buffa, G. Coastal Dune Restoration: A Checklist Approach to Site Selection. Land 2024, 13, 135. [Google Scholar] [CrossRef]
- UNCED Agenda 21—Chapter 17: Protection of the Oceans, All Kinds of Seas, Including Enclosed and Semi-Enclosed Seas, and Coastal Areas and the Protection, Rational Use and Development of Their Living Resources. In United Nations Division for Sustainable Development; New York, NY, USA, 1992.
- Pinna, M.S.; Cogoni, D.; Bacchetta, G. Assessing the Potential for Restoring Mediterranean Coastal Dunes under Pressure from Tourism. J. Coast. Conserv 2022, 26, 15. [Google Scholar] [CrossRef]
- Curr, R.H.F.; Koh, A.; Edwards, E.; Williams, A.T.; Daves, P. Assessing Anthropogenic Impact on Mediterranean Sand Dunes from Aerial Digital Photography. J. Coast. Conserv 2000, 6, 15–22. [Google Scholar] [CrossRef]
- Sedrati, M.; Dalour, L.; Bulot, G.; Metge, N. Nature-Based Solutions for Coastal Dune Restoration: The Case Study of AlgoBox in South Brittany, France. Ecol. Eng. 2025, 210, 107440. [Google Scholar]
- Jay, K.R.; Hacker, S.D.; Hagen, C.J. Quantifying the Relative Importance of Sand Deposition and Dune Grasses to Carbon Storage in US Central Atlantic Coast Dunes. Estuaries Coasts 2025, 48, 60. [Google Scholar] [CrossRef]
- Nordstrom, K.F. Beach and Dune Restoration; Cambridge University Press: Cambridge, UK, 2008. [Google Scholar]
- Ferreira, Ó. The Effectiveness of Elevated Boardwalks in Restoring Coastal Dunes. J. Environ. Manag. 2023, 345, 118759. [Google Scholar] [CrossRef] [PubMed]
- Gallego-Fernández, J.B.; Sánchez, I.A.; Ley, C. Restoration of Isolated and Small Coastal Sand Dunes on the Rocky Coast of Northern Spain. Ecol. Eng. 2011, 37, 1822–1832. [Google Scholar] [CrossRef]
- Calafat, A.; Vírseda, S.; Lovera, R.; Lucena, J.R.; Bladé, C.; Rivero, L.; Ninot, J.M. Assessment of the Restoration of the Remolar Dune System (Viladecans, Barcelona): The Resilience of a Coastal Dune System. J. Mar. Sci. Eng. 2021, 9, 113. [Google Scholar] [CrossRef]
- Burke, A.; Newton, R.; Boyce, D.; Kolberg, H.; Brunner, I. Reestablishing a Keystone Species in an Arid Coastal Environment: Saltbush (Salsola Nollothensis) in Namibia. Ecol. Restor. 2011, 29, 25–34. [Google Scholar] [CrossRef]
- Lithgow, D.; Martínez, M.L.; Gallego-Fernández, J.B.; Hesp, P.A.; Flores, P.; Gachuz, S.; Rodríguez-Revelo, N.; Jiménez-Orocio, O.; Mendoza-González, G.; Álvarez-Molina, L.L. Linking Restoration Ecology with Coastal Dune Restoration. Geomorphology 2013, 199, 214–224. [Google Scholar] [CrossRef]
- van der Meulen, F.; Salman, A. Management of Mediterranean Coastal Dunes. Ocean Coast. Manag. 1996, 30, 177–195. [Google Scholar] [CrossRef]
- Sanjaume, E.; Pardo, J.E. Degradación de Sistemas Dunares. Las Dunas En. España 2011, 24, 439–460. [Google Scholar]
- Morales, J.A. The Spanish Coastal System. Dynamic Processes, Sediments and Management; J.A., Ed.; Springer International Publishing: Morales, 2019. [Google Scholar]
- Montoni, M.V.F.; Honaine, M.F.; Del Río, J.L. An Assessment of Spontaneous Vegetation Recovery in Aggregate Quarries in Coastal Sand Dunes in Buenos Aires Province, Argentina. Environ. Manag. 2014, 54, 180–193. [Google Scholar] [CrossRef]
- Martínez, M.L.; Hesp, P.A.; Gallego-Fernández, J.B. Coastal Dunes: Human Impact and Need for Restoration. Environ. Probl. Solving 2013, 1, 1–14. [Google Scholar] [CrossRef]
- Garcia-Lozano, C.; Pintó, J.; Daunis-i-Estadella, P. Changes in Coastal Dune Systems on the Catalan Shoreline (Spain, NW Mediterranean Sea): Comparing Dune Landscapes between 1890 and 1960 with Their Current Status. Estuar. Coast. Shelf Sci. 2018, 208, 235–247. [Google Scholar] [CrossRef]
- You, S.; Kim, M.; Lee, J.; Chon, J. Coastal Landscape Planning for Improving the Value of Ecosystem Services in Coastal Areas: Using System Dynamics Model. Env. Pollut. 2018, 242, 2040–2050. [Google Scholar] [CrossRef] [PubMed]
- Gómez-Pina, G.; Muñoz-Pérez, J.J.; Ramírez, J.L.; Ley, C. Sand Dune Management Problems and Techniques, Spain. J. Coast. Res. 2002, 36, 325–332. [Google Scholar] [CrossRef]
- Hardisty, J. Beach and Nearshore Sediment Transport. In Sediment Transport and Depositional Processes; Pye, K., Ed.; Blackwell: London, UK, 1994; pp. 216–255. [Google Scholar]
- Barbier, E.B.; Hacker, S.D.; Kennedy, C.; Koch, E.W.; Stier, A.C. The Value of Estuarine and Coastal Ecosystem Services. Ecol. Monogr. 2011, 81, 169–193. [Google Scholar] [CrossRef]
- Everard, M.; Jones, L.; Watts, B. Have We Neglected the Societal Importance of Sand Dunes? - An Ecosystem Services Perspective. Aquat. Conserv. Mar. Freshw. Ecosyst. 2010, 20, 476–487. [Google Scholar] [CrossRef]
- Martínez, M.L.; Gallego-Fernández, J.B.; Hesp, P.A. Restoration of Coastal Dunes; Springer-Verlag: Berlin/Heidelberg, Germany, 2013. [Google Scholar]
- Doing, H. Coastal Fore-Dune Zonation and Succession in Various Parts of the World. Vegetatio 1985, 61, 65–75. [Google Scholar] [CrossRef]
- Feola, S.; Carranza, M.L.; Schaminée, J.H.J.; Janssen, J.A.M.; Acosta, A.T.R. EU Habitats of Interest: An Insight into Atlantic and Mediterranean Beach and Foredunes. Biodivers. Conserv 2011, 20, 1457–1468. [Google Scholar] [CrossRef]
- Johnston, K.K.; Dugan, J.E.; Hubbard, D.M.; Emery, K.A.; Grubbs, M.W. Using Dune Restoration on an Urban Beach as a Coastal Resilience Approach. Front. Mar. Sci. 2023, 10, 1187488. [Google Scholar] [CrossRef]
- Roig-Munar, F.X.; Martín-Prieto, J.Á.; Rodríguez-Perea, A.; Batista, Ó.O. Environmental Analysis and Classification of Coastal Sandy Systems of the Dominican Republic. In Beach Management Tools—Concepts, Methodologies and Case Studies; Botero, C., Cervantes, O., Finkl, C., Eds.; Springer: Cham, Switzerland, 2018; Vol. 24, pp. 59–74. [Google Scholar]
- Carranza, M.L.; Acosta, A.; Stanisci, A.; Pirone, G.; Ciaschetti, G. Ecosystem Classification and EU Habitat Distribution Assessment in Sandy Coastal Environments. Environ. Monit. Assess. 2008, 140, 99–107. [Google Scholar] [CrossRef] [PubMed]
- Carboni, M.; Carranza, M.L.; Acosta, A. Assessing Conservation Status on Coastal Dunes: A Multiscale Approach. Landsc. Urban Plan 2009, 91, 17–25. [Google Scholar] [CrossRef]
- Fenu, G.; Carboni, M.; Acosta, A.; Bacchetta, G. Environmental Factors Influencing Coastal Vegetation Pattern: New Insights from the Mediterranean Basin. Folia Geobot. 2013, 48, 493–508. [Google Scholar]
- Malavasi, M.; Bartak, V.; Carranza, M.L.; Simova, P.; Acosta, A.T.R. Landscape Pattern and Plant Biodiversity in Mediterranean Coastal Dune Ecosystems: Do Habitat Loss and Fragmentation Really Matter? J. Biogeogr 2018, 45, 1367–1377. [Google Scholar] [CrossRef]
- van der Maarel, E. Some Remarks on the Functions of European Coastal Ecosystems. Phytocoenologia 2003, 33, 187–202. [Google Scholar] [CrossRef]
- Martínez, M.; Psuty, N. Coastal Dunes: Ecology and Conservation; Springer-Verlag: Martínez, M.L, 2004. [Google Scholar]
- Acosta, A.; Carranza, M.L.; Izzi, C.F. Are There Habitats That Contribute Best to Plant Species Diversity in Coastal Dunes? Biodivers. Conserv 2009, 18, 1087–1098. [Google Scholar] [CrossRef]
- Fenu, G.; Cogoni, D.; Ferrara, C.; Pinna, M.S.; Bacchetta, G. Relationships between Coastal Sand Dune Properties and Plant Community Distribution: The Case of Is Arenas (Sardinia. Plant Biosyst. 2012, 146, 586–602. [Google Scholar] [CrossRef]
- Delbosc, P.; Lagrange, I.; Rozo, C.; Bensettiti, F.; Bouzillé, J.B.; Evans, D.; Lalanne, A.; Rapinel, S.; Bioret, F. Assessing the Conservation Status of Coastal Habitats under Article 17 of the EU Habitats Directive. Biol. Conserv 2021, 254, 108935. [Google Scholar] [CrossRef]
- Prisco, I.; Acosta, A.T.; Stanisci, A. A Bridge between Tourism and Nature Conservation: Boardwalks Effects on Coastal Dune Vegetation. J. Coast. Conserv 2021, 25, 14. [Google Scholar] [CrossRef]
- Prisco, I.; Carboni, M.; Acosta, A.T.R. The Fate of Threatened Coastal Dune Habitats in Italy under Climate Change Scenarios. PLoS ONE 2013, 8, 68850. [Google Scholar] [CrossRef] [PubMed]
- Motte, M. Fixation et Reboisement Des Dunes Maritimes En Tunisie et plus Spécialement Dans La Région de Bizerte. Rev. For. Fr. 1963, 5, 449–458. [Google Scholar] [CrossRef]
- Ben Jelloul, M.; Jaziri, B. La Zone Sensible de l’extrême Nord Tunisien. Quel Modèle de Développement Local Dans Un Contexte de Durabilité ? Cah. FTDES 2022, 6, 58–84. [Google Scholar]
- Khabthani, M.A.; Touhami, I.; Mannai-Tayech, B.; Khaldi, A. Étude Diachronique de La Restauration Des Dunes Littorales de Zouaraa (Ouechtata-Nefza): Approche Par Télédétection et SIG. In Proceedings of the Proceedings of the Soixantième anniversaire de la Recherche Forestière en Tunisie, Hammamet, Tunisia, 2017. [Google Scholar]
- Kassouk, Z.; Ayari, E.; Deffontaines, B.; Ouaja, M. Monitoring Coastal Evolution and Geomorphological Processes Using Time-Series Remote Sensing and Geospatial Analysis: Application between Cape Serrat and Kef Abbed, Northern Tunisia. Remote Sens. 2024, 16, 3895. [Google Scholar] [CrossRef]
- Sanromualdo-Collado, A.; Hernández-Cordero, A.I.; Viera-Pérez, M.; Gallego-Fernández, J.B.; Hernández-Calvento, L. Coastal Dune Restoration in El Inglés Beach (Gran Canaria, Spain): A Trial Study. Rev. Estud. Andal. 2021, 41, 187–204. [Google Scholar] [CrossRef]
- Touhami, I.; Aouinti, H.; Khabthani, M.A.; Bergaoui, K.; Chirino, E.; Rzigui, T.; Bellot, J.; Khaldi, A.; Khouja, M.L.; Mannaï-Tayech, B. Monitoring Land-Cover Changes in Mediterranean Coastal Dunes, Northwest Tunisia, Using Remote Sensing Data. Not. Bot. Horti Agrobot. Cluj.-Napoca 2022, 50, 12794. [Google Scholar] [CrossRef]
- Forêts, D.G.F.-D.G. Deuxième Inventaire Forestier et Pastoral National, Résultats Sur l’échelon de Jendouba; DGF: Tunis, 1996. [Google Scholar]
- Farnole, P. Une Réserve Littorale Pour Le Tell Septentrional Tunisien. In Proceedings of the Proceedings of the Journées Nationales Génie Civil/Génie Côtier, Caen, France, 2000. [Google Scholar]
- Xie, Z.; Chen, Y.; Lu, D.; Li, G.; Chen, E. Classification of Land Cover, Forest, and Tree Species Classes with ZiYuan-3 Multispectral and Stereo Data. Remote Sens. 2019, 11, 164. [Google Scholar] [CrossRef]
- Seyam, M.M.H.; Haque, M.R.; Rahman, M.M. Identifying the Land Use Land Cover (LULC) Changes Using Remote Sensing and GIS Approach: A Case Study at Bhaluka in Mymensingh Bangladesh. Case Stud. Chem. Environ. Eng. 2023, 7, 100293. [Google Scholar] [CrossRef]
- Lin, Y.; Zhang, T.; Ye, Q.; Cai, J.; Wu, C.; Khirni Syed, A.; Li, J. Long-Term Remote Sensing Monitoring on LUCC around Chaohu Lake with New Information of Algal Bloom and Flood Submerging. Int. J. Appl. Earth Obs. Geoinf. 2021, 102, 102413. [Google Scholar] [CrossRef]
- Popova, A. Improving the Accuracy of Tree Species Mapping by Sentinel-2 Images Using Auxiliary Data – A Case Study of Slyudyanskoye Forestry Area near Lake Baikal. Forests 2025, 16, 487. [Google Scholar] [CrossRef]
- Higgins, S.I.; Bond, W.J.; February, E.C.; Bronn, A.; Euston-Brown, D.I.; Enslin, B. Effects of Four Decades of Fire Manipulation on Woody Vegetation Structure in Savanna. Ecology 2007, 88, 1119–1125. [Google Scholar] [CrossRef] [PubMed]
- Sapkota, R.P.; Dhital, N.B.; Rijal, K. Fire-Mediated Biomass Loss of Woody Species Seedlings Causing Demographic Bottleneck in the Terai Forests of Central Nepal. Glob. Ecol. Conserv 2023, 48, 2705. [Google Scholar] [CrossRef]
- Pourreza, M.; Hosseini, S.M.; Sinegani, A.A.S.; Matinizadeh, M.; Alavai, S.J. Herbaceous Species Diversity in Relation to Fire Severity in Zagros Oak Forests. Iran. J. For. Res. 2014, 25, 113–120. [Google Scholar] [CrossRef]
- Barbier, S.; Gosselin, F.; Balandier, P. Influence of Tree Species on Understory Vegetation Diversity and Mechanisms Involved - a Critical Review for Temperate and Boreal Forests. For. Ecol. Manag. 2008, 254, 1–15. [Google Scholar] [CrossRef]
- Gilliam, F.S. The Ecological Significance of the Herbaceous Layer in Temperate Forest Ecosystems. Bioscience 2007, 57, 845–858. [Google Scholar] [CrossRef]
- Roberts, M.R. Response of the Herbaceous Layer to Natural Disturbance in North American Forests. Can. J. Bot. 2004, 82, 1273–1283. [Google Scholar] [CrossRef]
- Halpern, C.B.; Lutz, J.A. Canoyear Closure Exerts Weak Controls on Understory Dynamics: A 30-Year Study of Overstory-Understory Interactions. Ecol. Monogr. 2013, 83, 221–237. [Google Scholar]
- Selmants, P.C.; Knight, D.H. Understory Plant Species Composition 30–50 Years after Clearcutting in Southeastern Wyoming Coniferous Forests. For. Ecol. Manag. 2003, 185, 275–289. [Google Scholar] [CrossRef]
- Adili, B. Croissance, Fructification et Régénération Naturelle Des Peuplements Artificiels de Pin Pignon (Pinus Pinea L.) Au Nord de La Tunisie. 2012. [Google Scholar]
- Adili, B.; El Aouni, M.H.; Balandier, P. Influence of Stand and Tree Attributes and Silviculture on Cone and Seed Productions in Forests of Pinus Pinea L. in Northern Tunisia. In Mediterranean Stone Pine for Agroforestry; Mutke, S., Piqué, M., Calama, R., Eds.; CIHEAM/FAO/INIA/IRTA/CESEFOR/CTFC: Zaragoza, 2013; Vol. 105, pp. 9–14. [Google Scholar]
- Gao, S. Assessment of Remote-Sensed Vegetation Indices for Estimating Forest Chlorophyll Concentration. Ecol. Indic. 2024, 162, 112001. [Google Scholar] [CrossRef]
- Tucker, C.J. Red and Photographic Infrared Linear Combinations for Monitoring Vegetation. Remote Sens. Environ. 1979, 8, 127–150. [Google Scholar] [CrossRef]
- McFeeters, S.K. The Use of the Normalized Difference Water Index (NDWI) in the Delineation of Open Water Features. Int. J. Remote Sens. 1996, 17, 1425–1432. [Google Scholar] [CrossRef]
- Zha, Y.; Gao, J.; Ni, S. Use of Normalized Difference Built-up Index in Automatically Mapping Urban Areas from TM Imagery. Int. J. Remote Sens. 2003, 24, 583–594. [Google Scholar] [CrossRef]
- Sahar, A.A. Mapping Sandy Areas and Their Changes Using Remote Sensing. A Case Study at North-East Al-Muthanna Province, South of Iraq. Rev. Teledetec. 2021, 58, 39–52. [Google Scholar]
- Fadhil, A.M. Land Degradation Detection Using Geo-Information Technology for Some Sites in Iraq. Al-Nahrain J. Sci. 2009, 12, 94–108. [Google Scholar] [CrossRef]
- You, H.; Huang, Y.; Qin, Z.; Chen, J.; Liu, Y. Forest Tree Species Classification Based on Sentinel-2 Images and Auxiliary Data. Forests 2022, 13, 1416. [Google Scholar] [CrossRef]
- Ruiz-Peinado, R.; Rio, M.; Montero, G. New Models for Estimating the Carbon Sink Capacity of Spanish Softwood Species. For. Syst. 2011, 20, 176–188. [Google Scholar] [CrossRef]
- Correia, A.C.; Faias, S.P.; Ruiz-Peinado, R.; Chianucci, F.; Cutini, A.; Fontes, L.; Manetti, M.C.; Montero, G.; Soares, P.; Tomé, M. Generalized Biomass Equations for Stone Pine (Pinus Pinea L.) across the Mediterranean Basin. For. Ecol. Manag. 2018, 429, 425–436. [Google Scholar] [CrossRef]
- Cutini, A.; Chianucci, F.; Manetti, M.C. Allometric Relationships for Volume and Biomass for Stone Pine (Pinus Pinea L.) in Italian Coastal Stands. iForest 2013, 6, 331–337. [Google Scholar] [CrossRef]
- Medeiros, T.C.C.; Sampaio, E. Allometry of Aboveground Biomasses in Mangrove Species in Itamaracá, Pernambuco, Brazil. Wetl. Ecol. Manag. 2008, 16, 323–330. [Google Scholar]
- Shaiek, O.; Loustau, D.; Garchi, S.; Bachtobji, B.; El Aouni, M.H. Estimation Allométrique de La Biomasse Du Pin Maritime En Dune Littorale: Cas de La Forêt de Rimel (Tunisie. Forêt Méditerranéenne 2010, 31, 231–242. [Google Scholar]
- IPCC Good Practice Guidance for Land Use, Land-Use Change and Forestry; IPCC National Greenhouse Gas Inventories Programme 2003.
- Ruíz-Peinado, R.; Bravo-Oviedo, A.; Montero, G.; Río, M. Carbon Stocks in a Scots Pine Afforestation under Different Thinning Intensities Management. Mitig. Adapt. Strateg. Glob. Chang. 2014, 21, 1059–1072. [Google Scholar] [CrossRef]
- Rapp, M.; Cabanettes, A. BIOMASS AND PRODUCTIVITY OF A PINUS PINEA L. STAND. Components Product. Mediterr. Reg.-Basic A R D. Asp. 1981, 131–132. [Google Scholar]
- Rodin, L.E.; Bazilevich, N.I. Production and Mineral Cycling in Terrestrial Vegetation; Oliver, Boyd, Eds.; 1967. [Google Scholar]
- Rapp, M. Le Cycle Biogéochimique Dans Un Bois de Pins d’Alep. In Écologie Forestière; Pesson, P., Ed.; Gauthier-Villars: Paris, France, 1974; pp. 75–97. [Google Scholar]
- Gonçalves, A.C.; Sousa, A.M.O.; Silva, J.R.M. Pinus Pinea above Ground Biomass Estimation with Very High Spatial Resolution Satellite Images. In Mediterranean Pine Nuts from Forests and Plantations; Carrasquinho, I., Correia, A.C., Mutke, S., Eds.; CIHEAM: Zaragoza, 2017; Vol. 122, pp. 49–54. [Google Scholar]
- Correia, A.C.; Tomé, M.; Carlos, P.; Faias, S.; Dias, A.; Freire, J.; Carvalho, P.O.; Pereira, J.S. Biomass Allometry and Carbon Factors for a Mediterranean Pine (Pinus Pinea L.) in Portugal. For. Syst. 2010, 19, 418–433. [Google Scholar] [CrossRef]
- Belhadj-Khedher, C.; Koutsias, N.; Karamitsou, A.; El-Melki, T.; Ouelhazi, B.; Hamdi, A.; Nouri, H.; Mouillot, F. A Revised Historical Fire Regime Analysis in Tunisia (1985–2010) from a Critical Analysis of the National Fire Database and Remote Sensing. Forests 2018, 9, 59. [Google Scholar] [CrossRef]
- Turquety, S.; Menut, L.; Bessagnet, B.; Anav, A.; Viovy, N.; Maignan, F.; Wooster, M. APIFLAME v1.0: High-Resolution Fire Emission Model and Application to the Euro-Mediterranean Region. Geosci. Model Dev. 2014, 7, 587–612. [Google Scholar]
- Rezgui, F.; Mouillot, F.; Semmar, N.; Zribi, L.; Khaldi, A.; Nasr, Z.; Gharbi, F. Assessment of Pinus Halepensis Forests’ Vulnerability Using the Temporal Dynamics of Carbon Stocks and Fire Traits in Tunisia. Fire 1981, 7, 204. [Google Scholar] [CrossRef]
- Vallet, L.; Schwartz, M.; Ciais, P.; Wees, D.; Truchis, A.; Mouillot, F. High-Resolution Data Reveal a Surge of Biomass Loss from Temperate and Atlantic Pine Forests, Contextualizing the 2022 Fire Season Distinctiveness in France. Biogeosciences 2023, 20, 3803–3825. [Google Scholar] [CrossRef]
- Drius, M.; Carranza, M.L.; Stanisci, A.; Jones, L. The Role of Italian Coastal Dunes as Carbon Sinks and Diversity Sources: A Multi-Service Perspective. Appl. Geogr. 2016, 75, 127–136. [Google Scholar] [CrossRef]
- Retana, J.; Maria Espelta, J.; Habrouk, A.; Luis OrdoÑEz, J.; de Solà-Morales, F. Regeneration Patterns of Three Mediterranean Pines and Forest Changes after a Large Wildfire in Northeastern Spain. Écoscience 2016, 9, 89–97. [Google Scholar] [CrossRef]
Figure 1.
Study area Zouaraa Region in Tunisia.
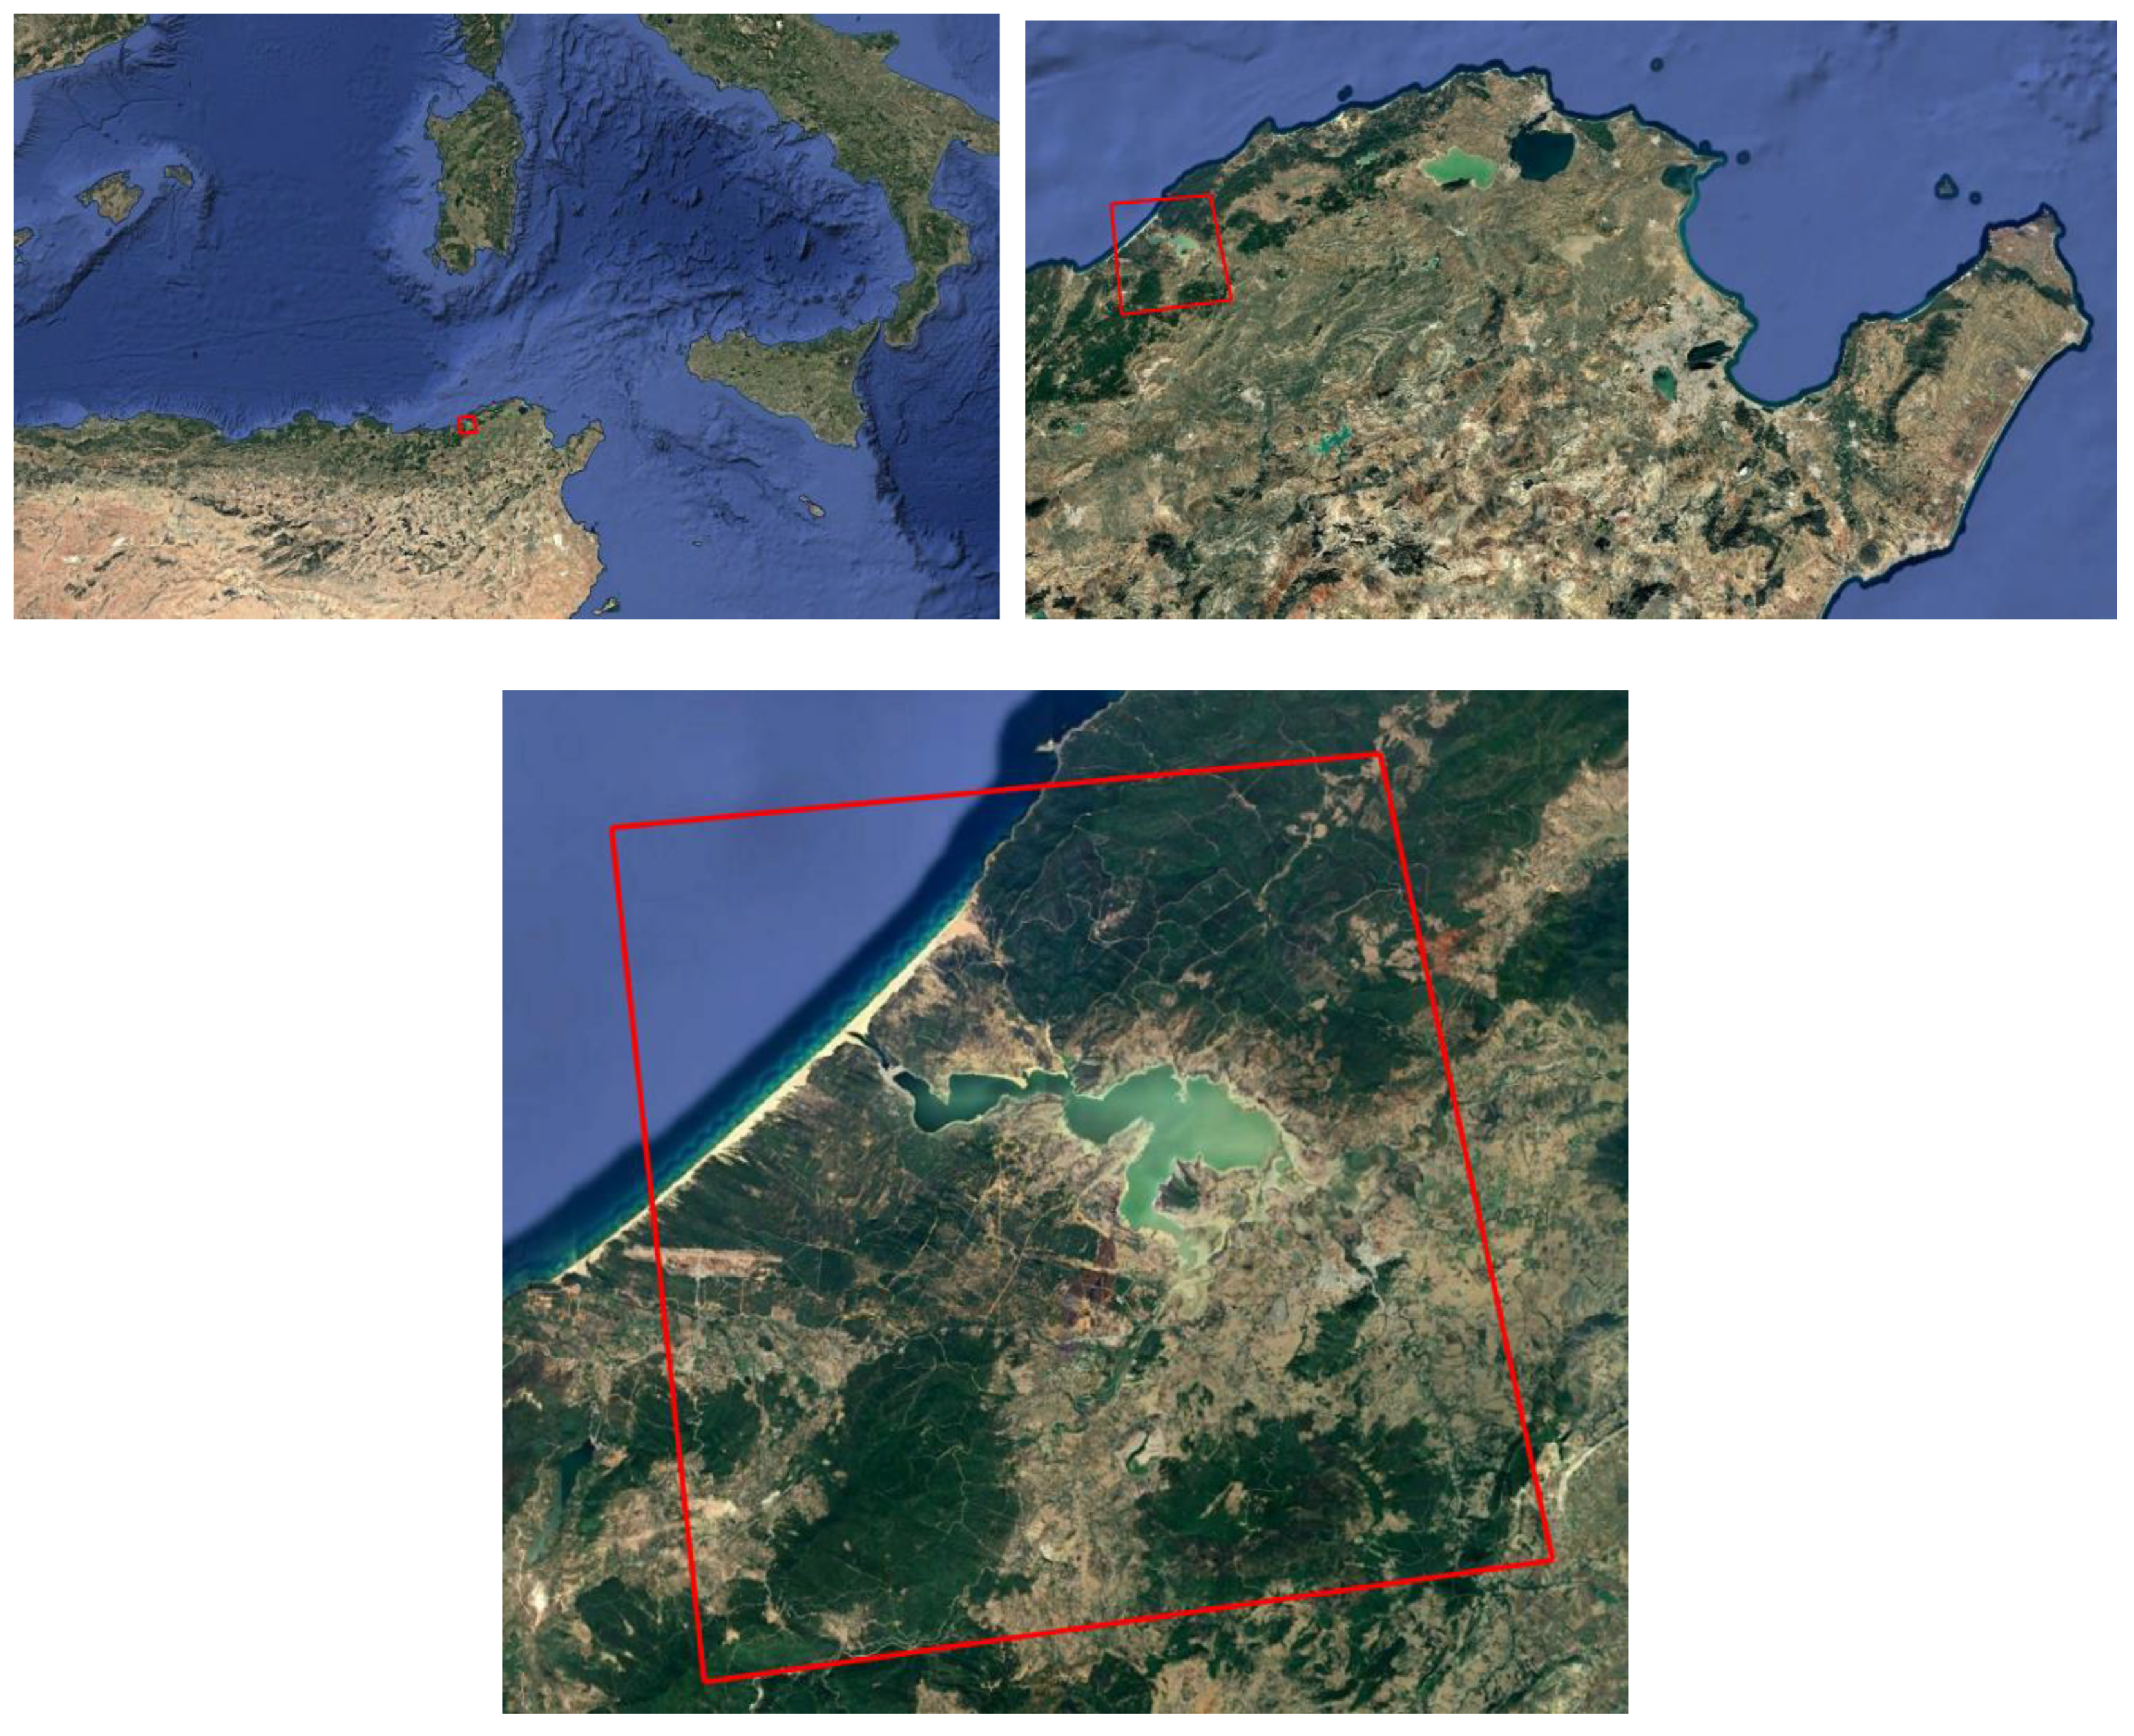
Figure 2.
Temporal changes in land area by category.
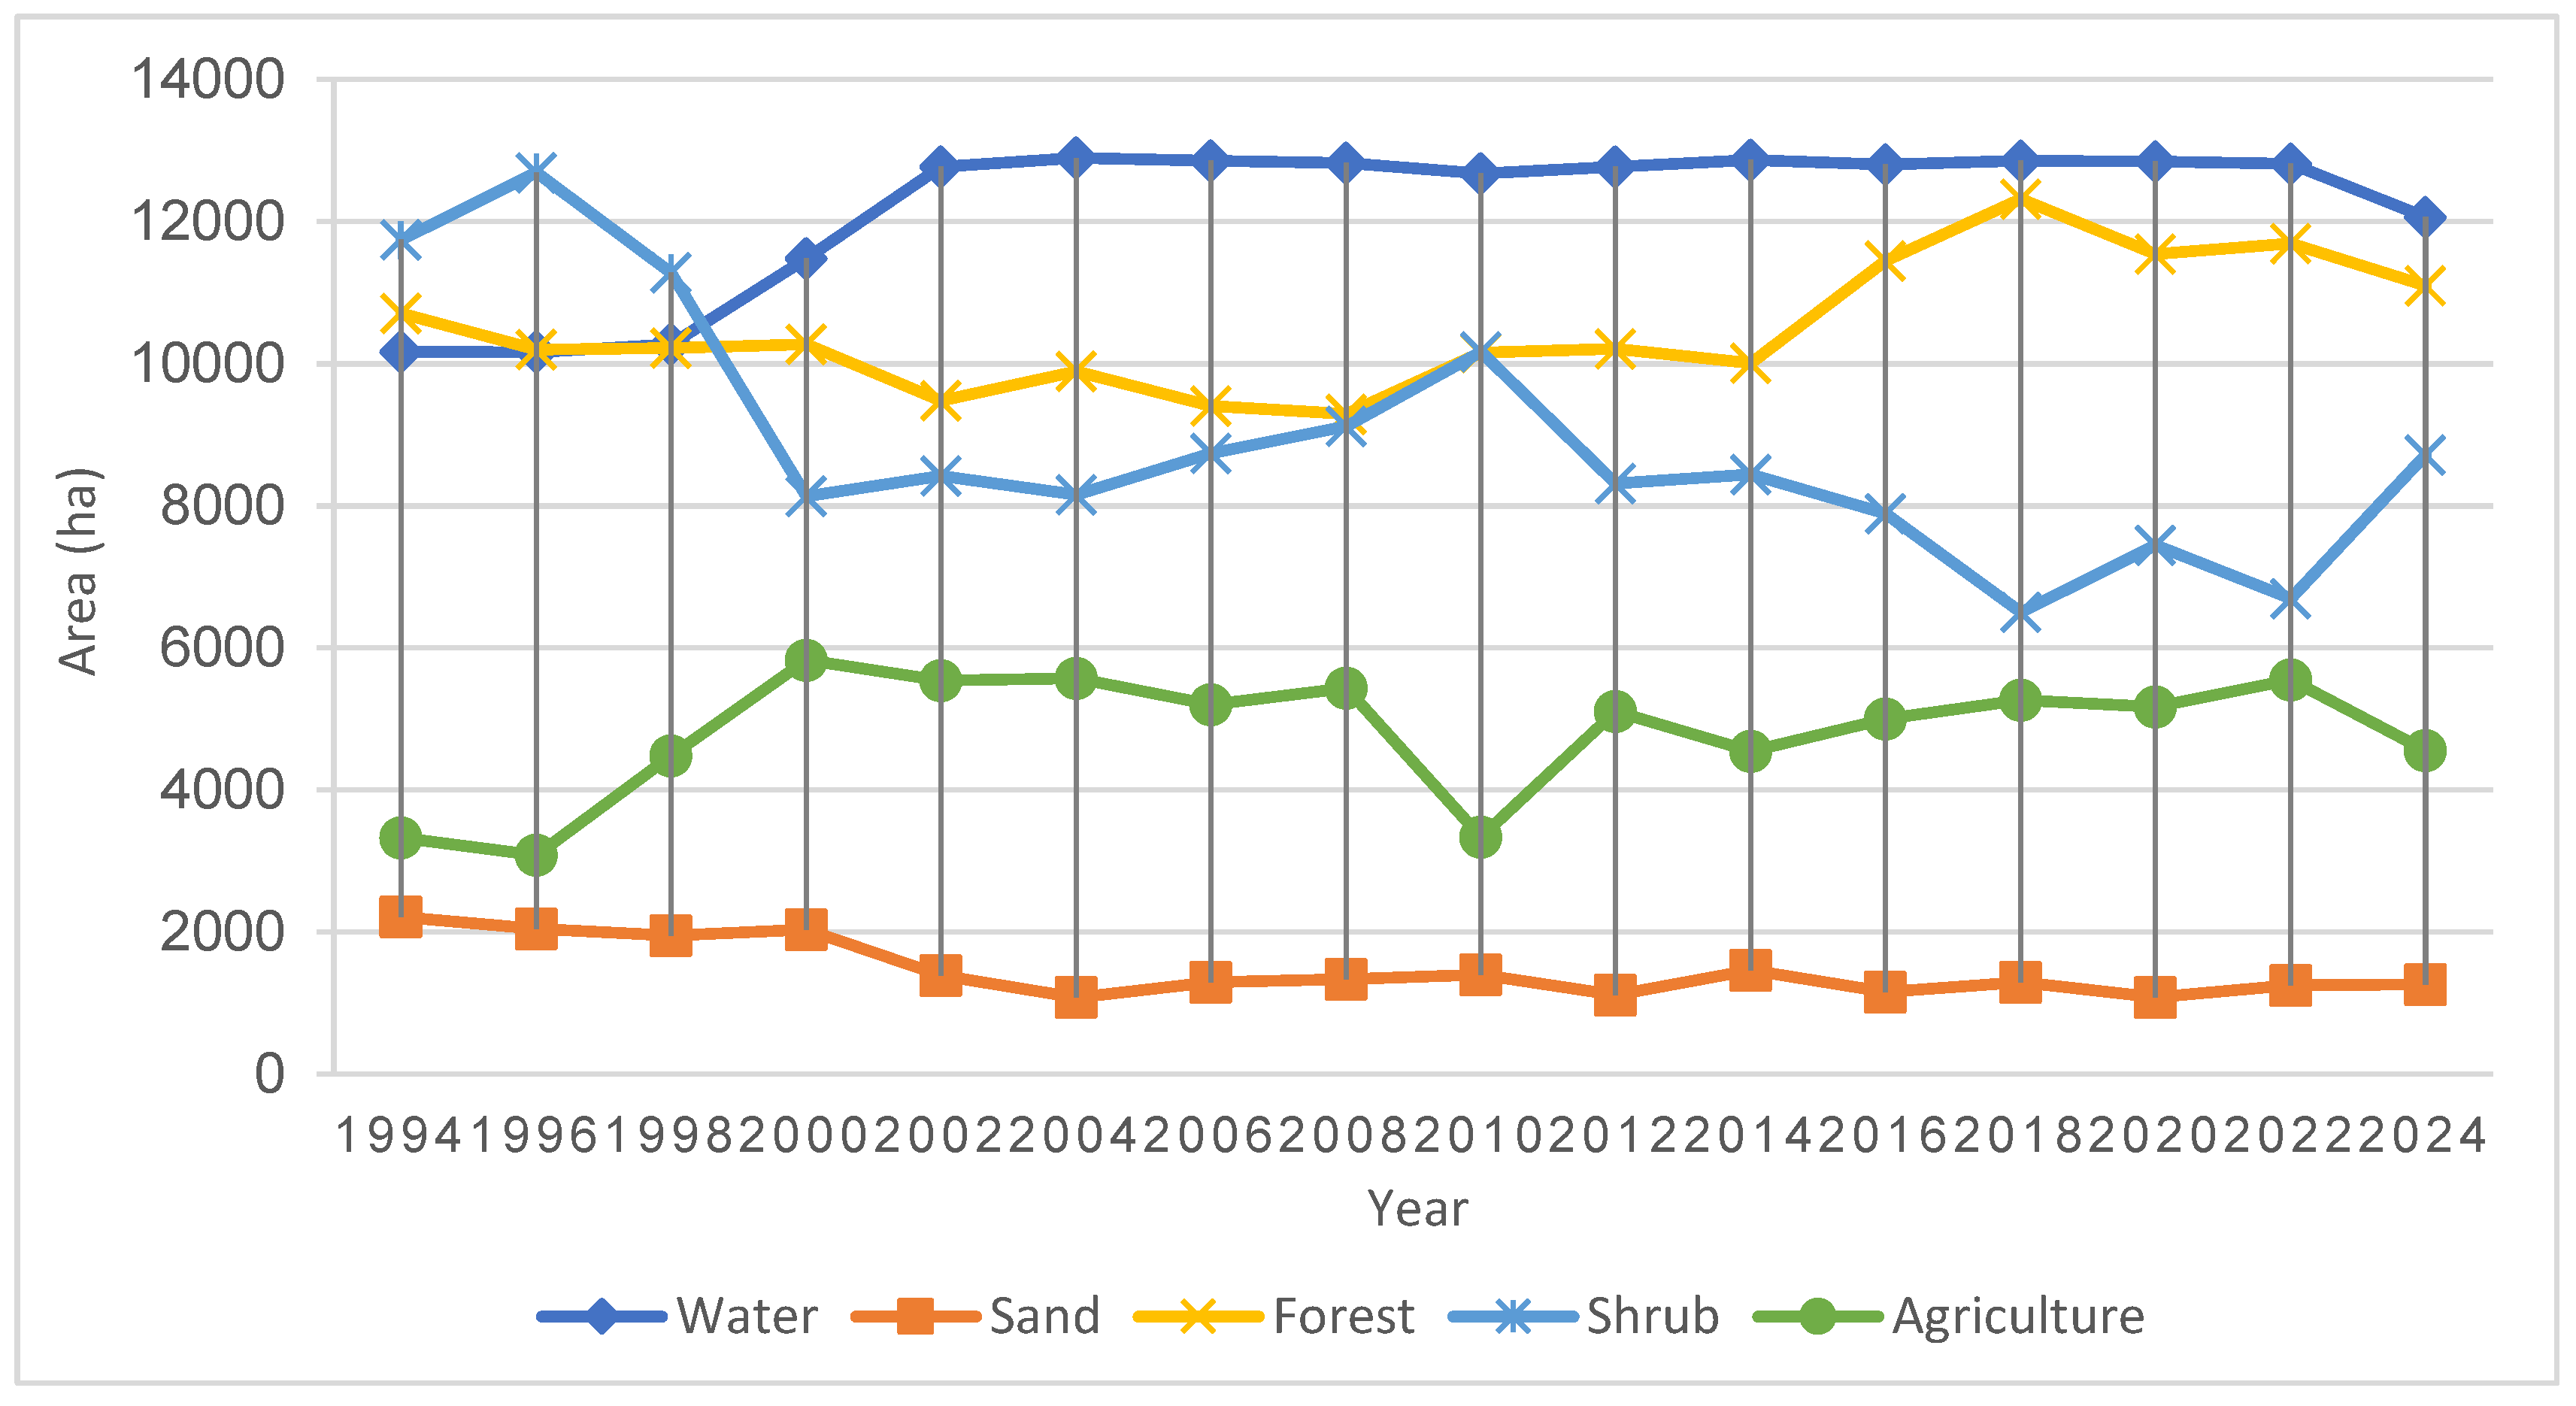
Figure 3.
Diagram of relative area ratio.
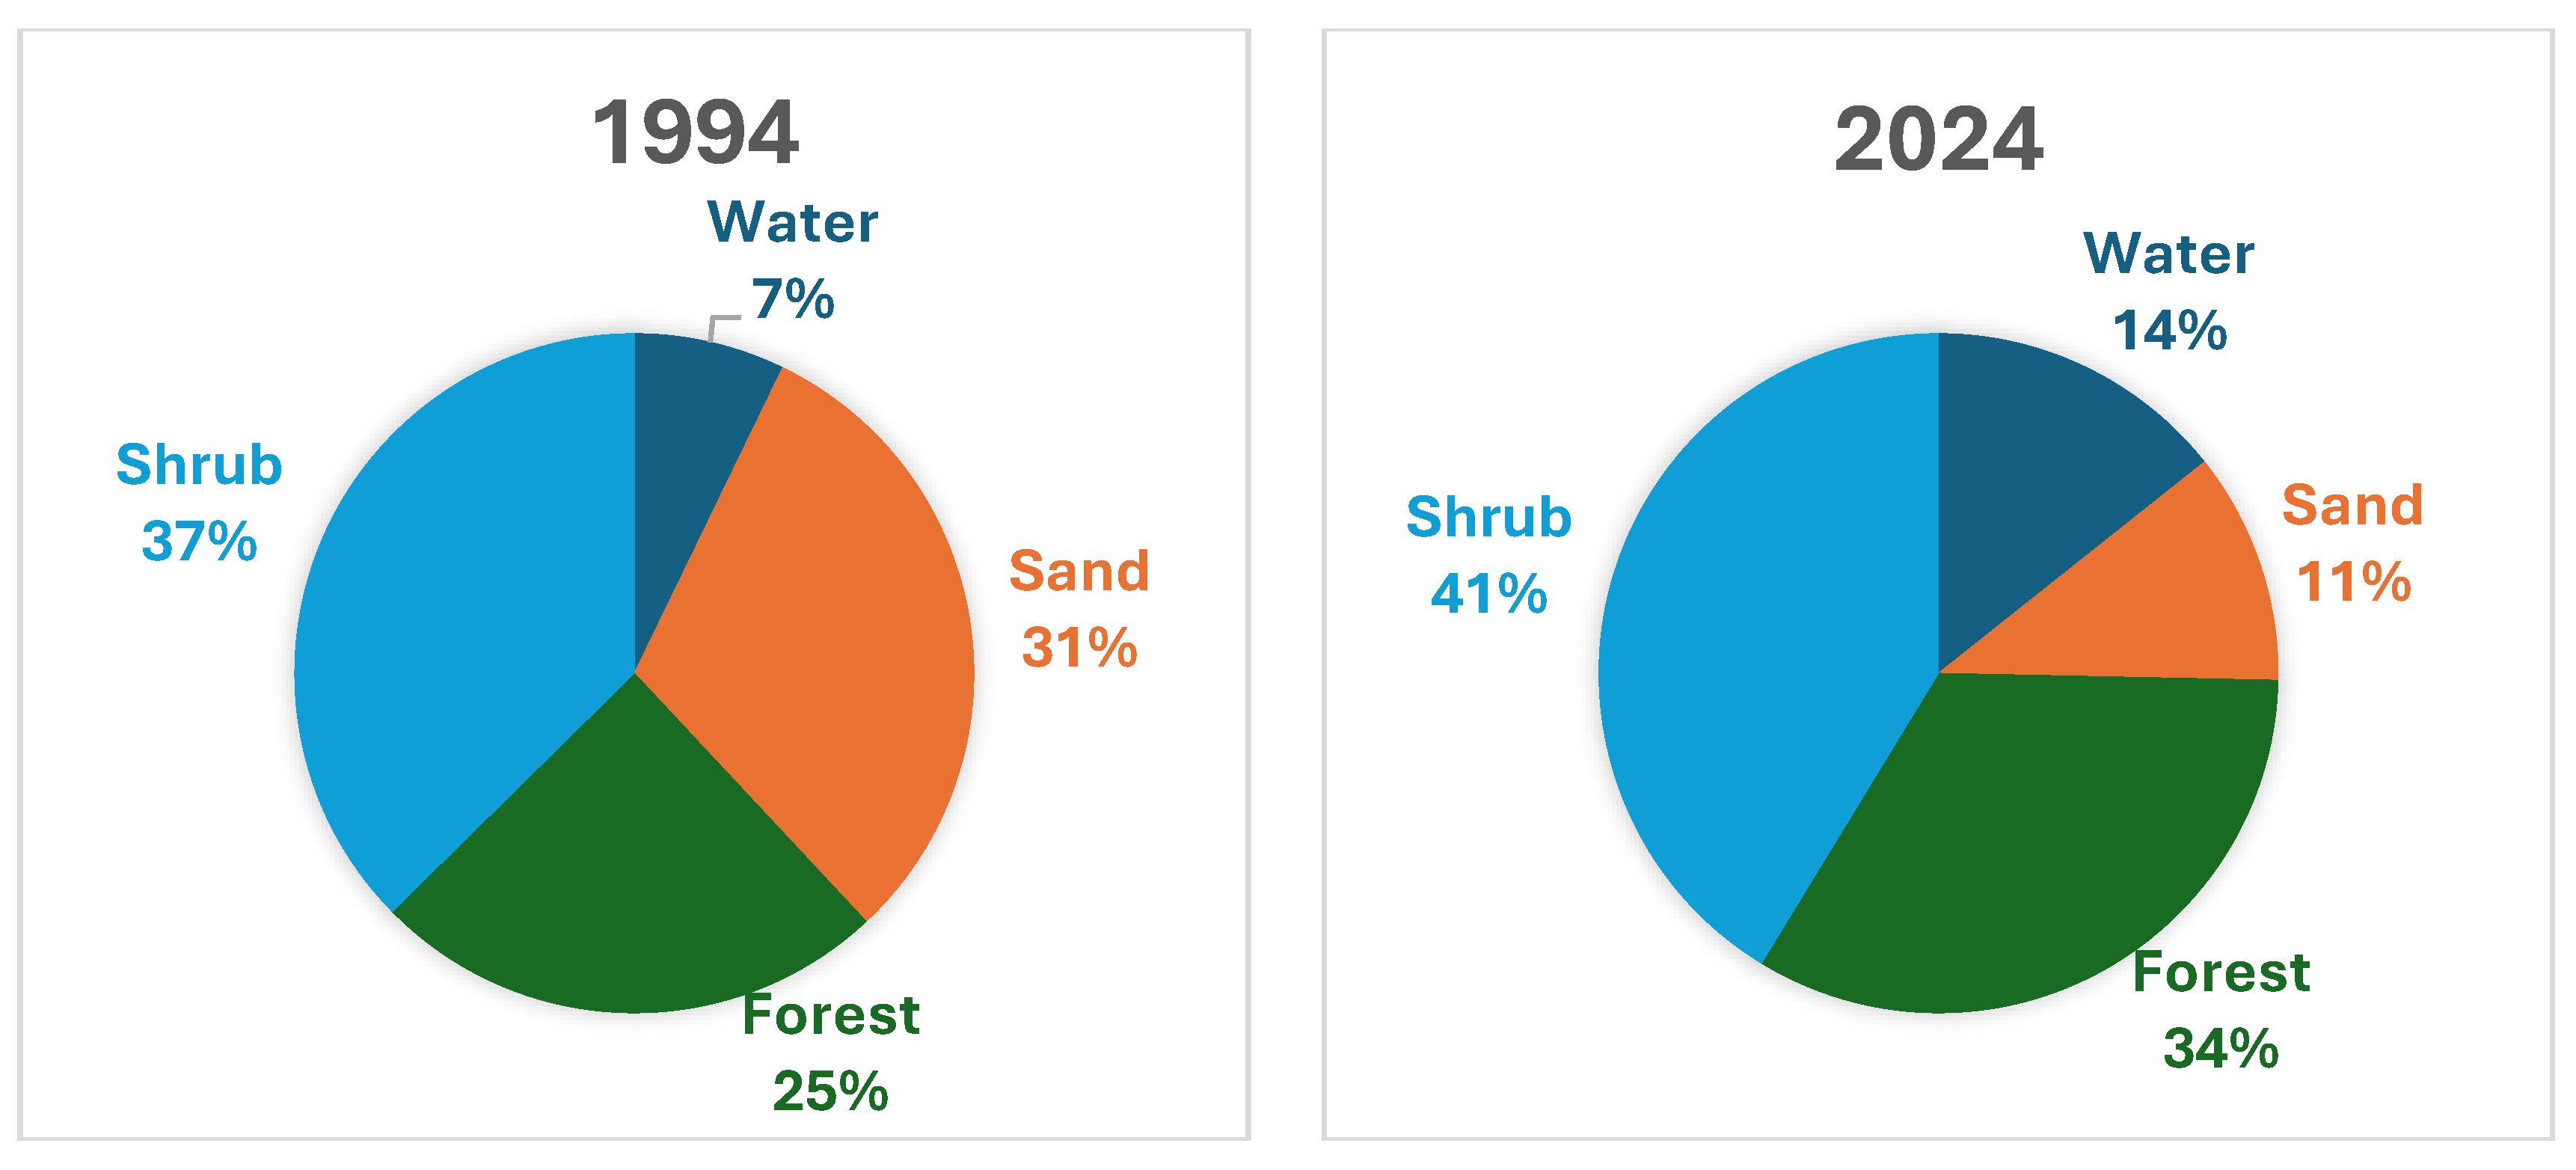
Figure 4.
Land cover classification results for the entire study area.
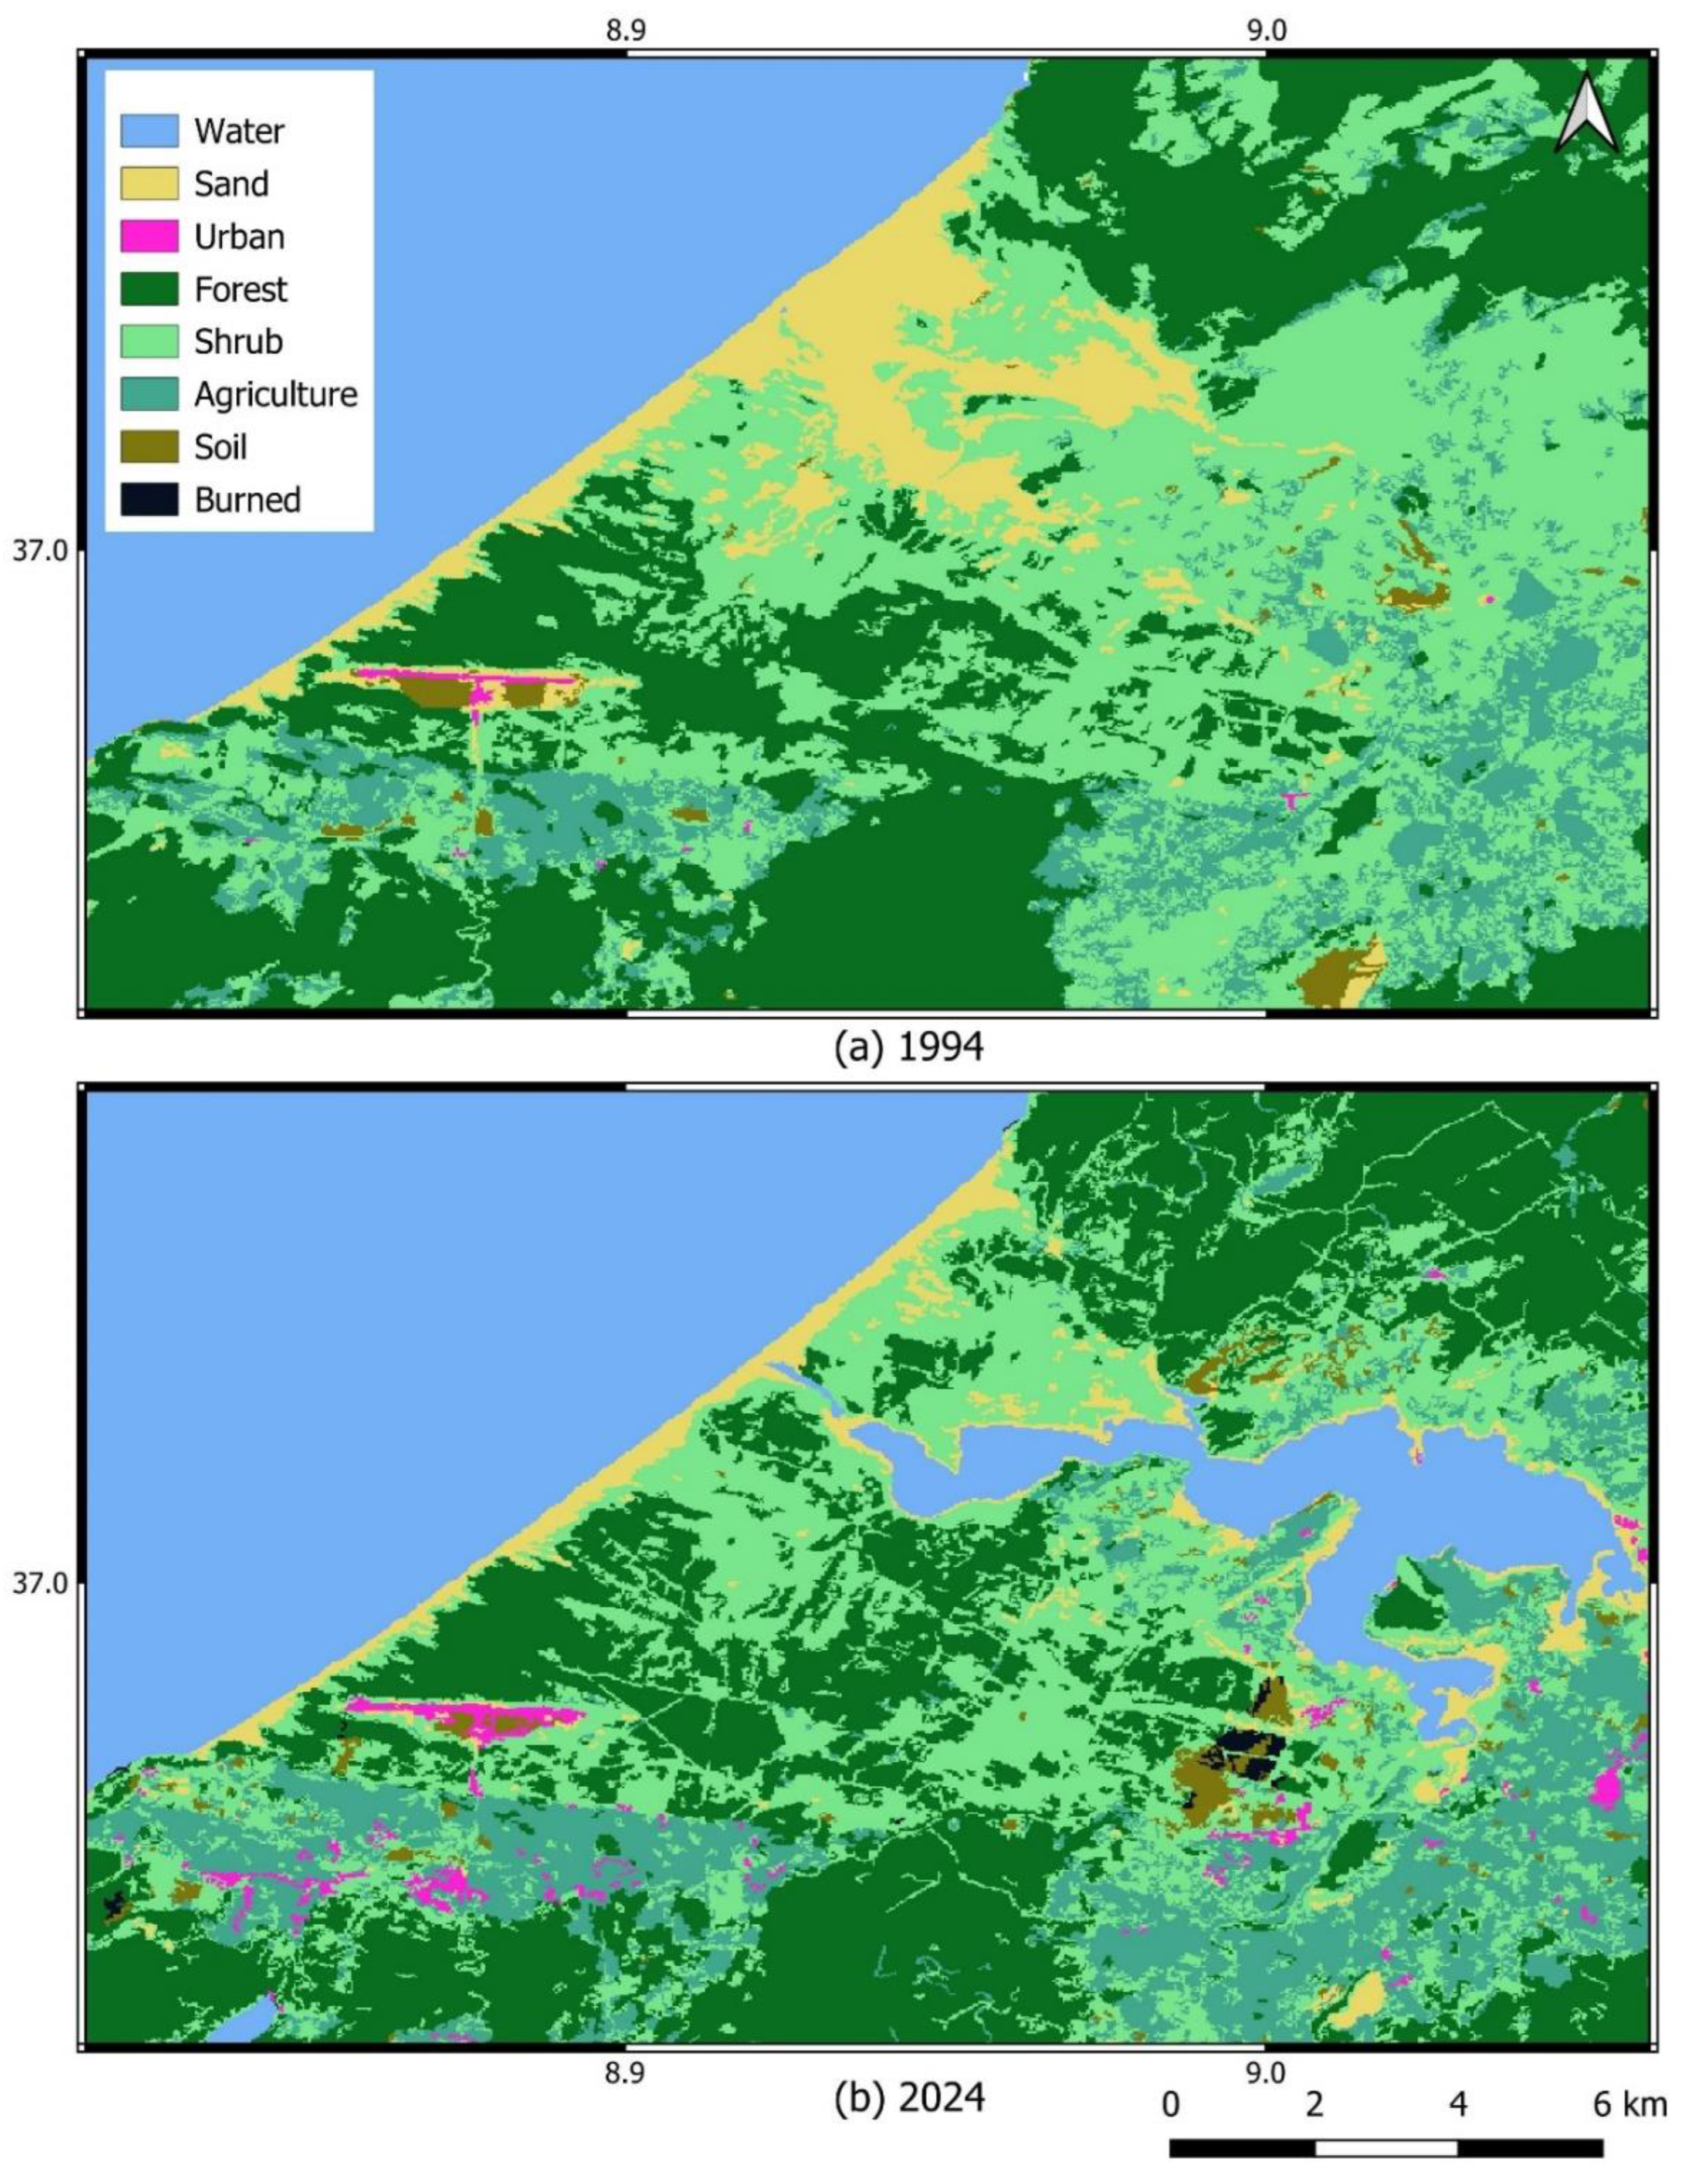
Figure 5.
Classification results of the coastal fragment dynamics.
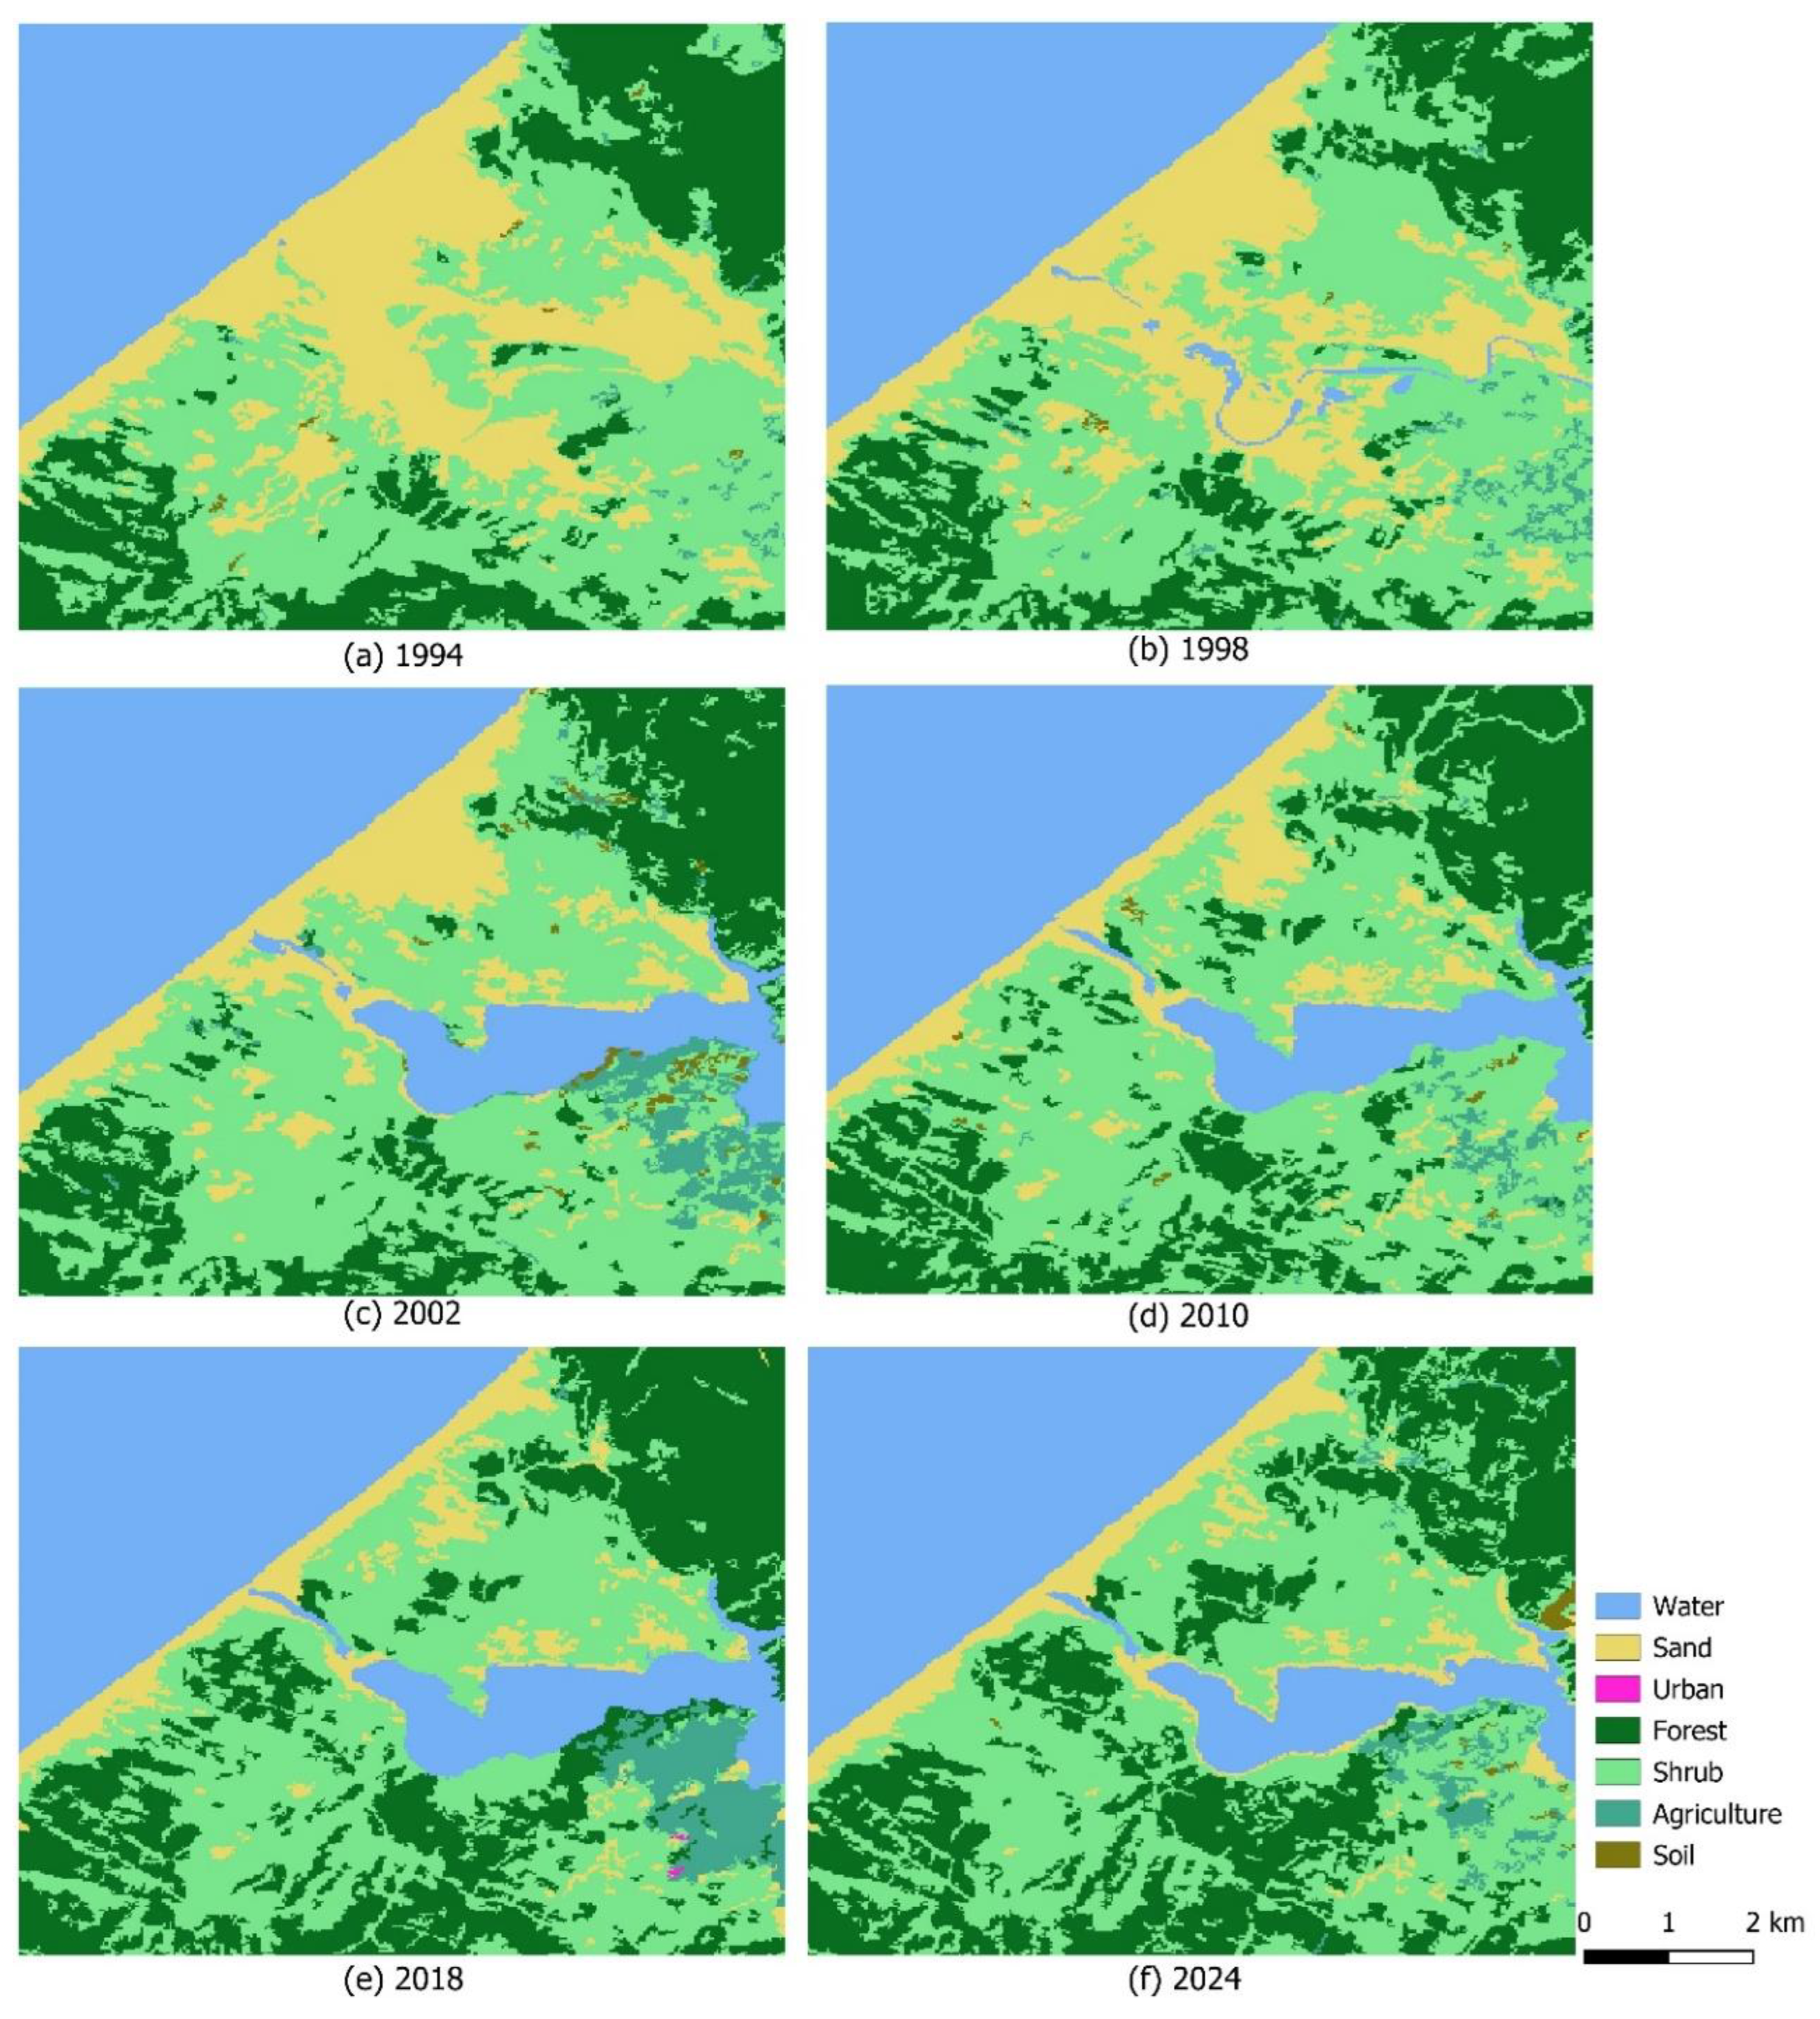
Figure 6.
Sand and vegetation cover dynamics from 1994 to 2024 in the coastal fragment.
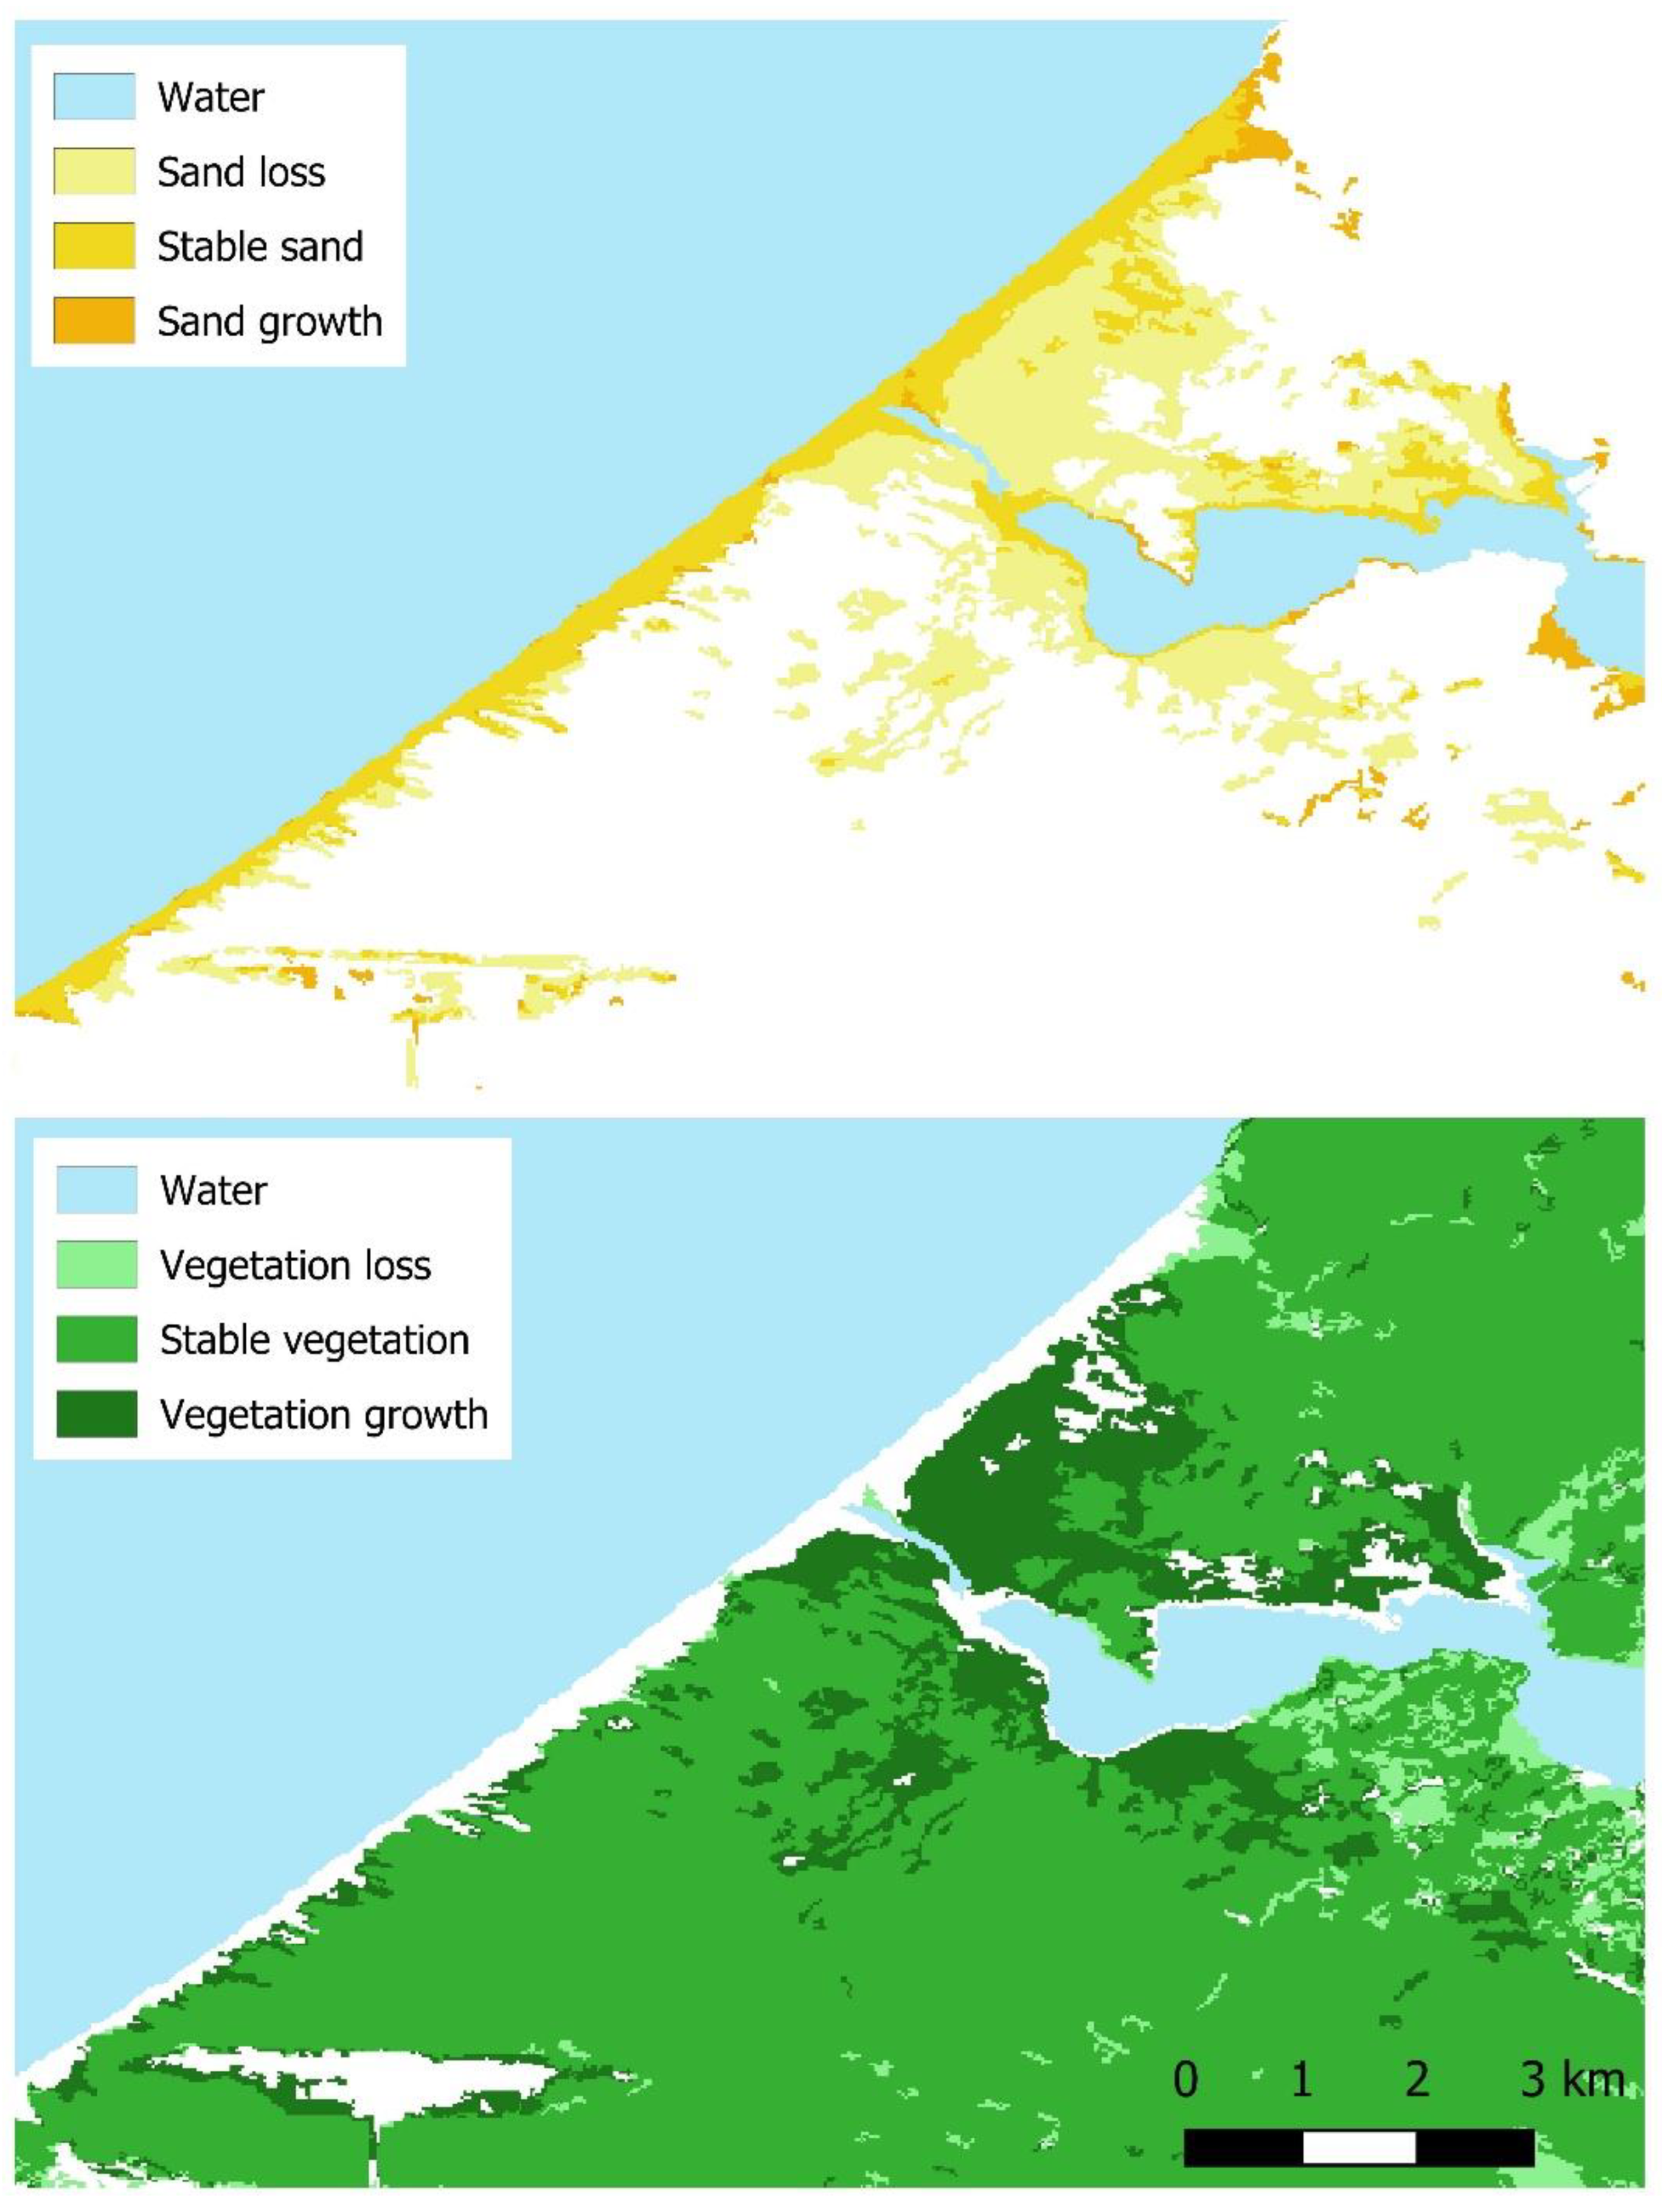
Figure 7.
Vegetation cover dynamics from 1994 to 2024 for the entire study area.
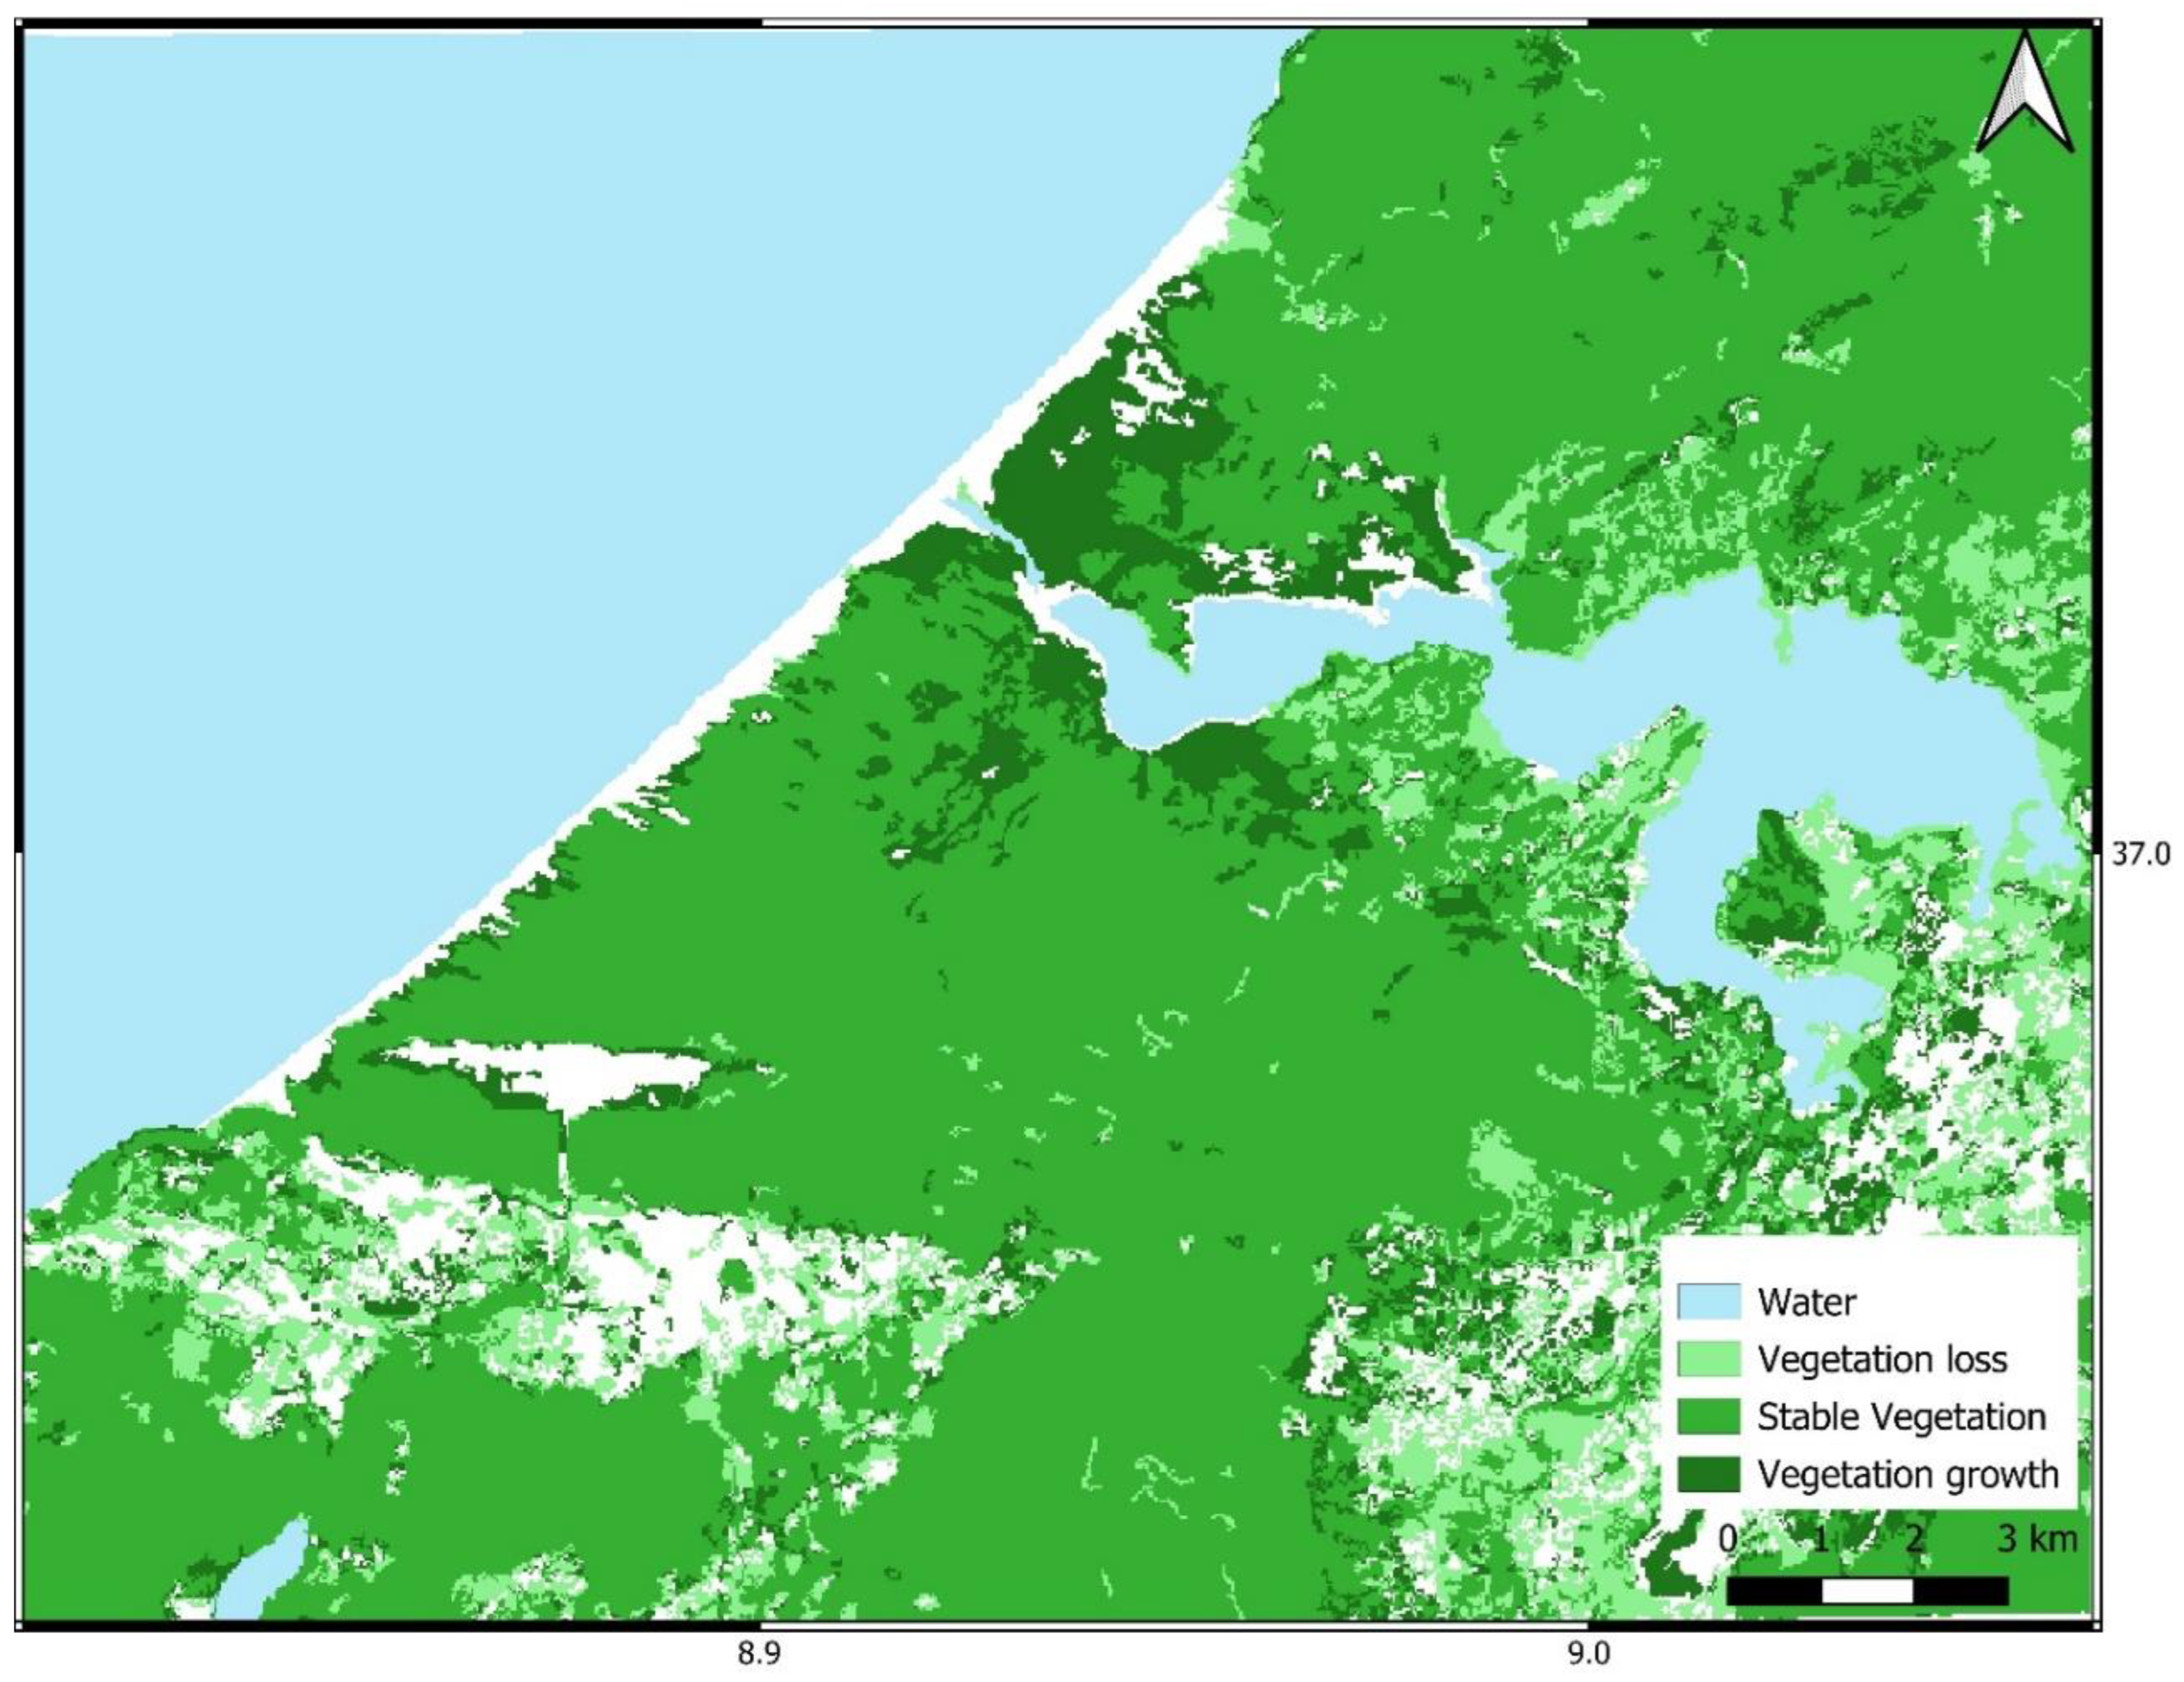
Figure 8.
Increase in Agriculture at the expense of other classes.
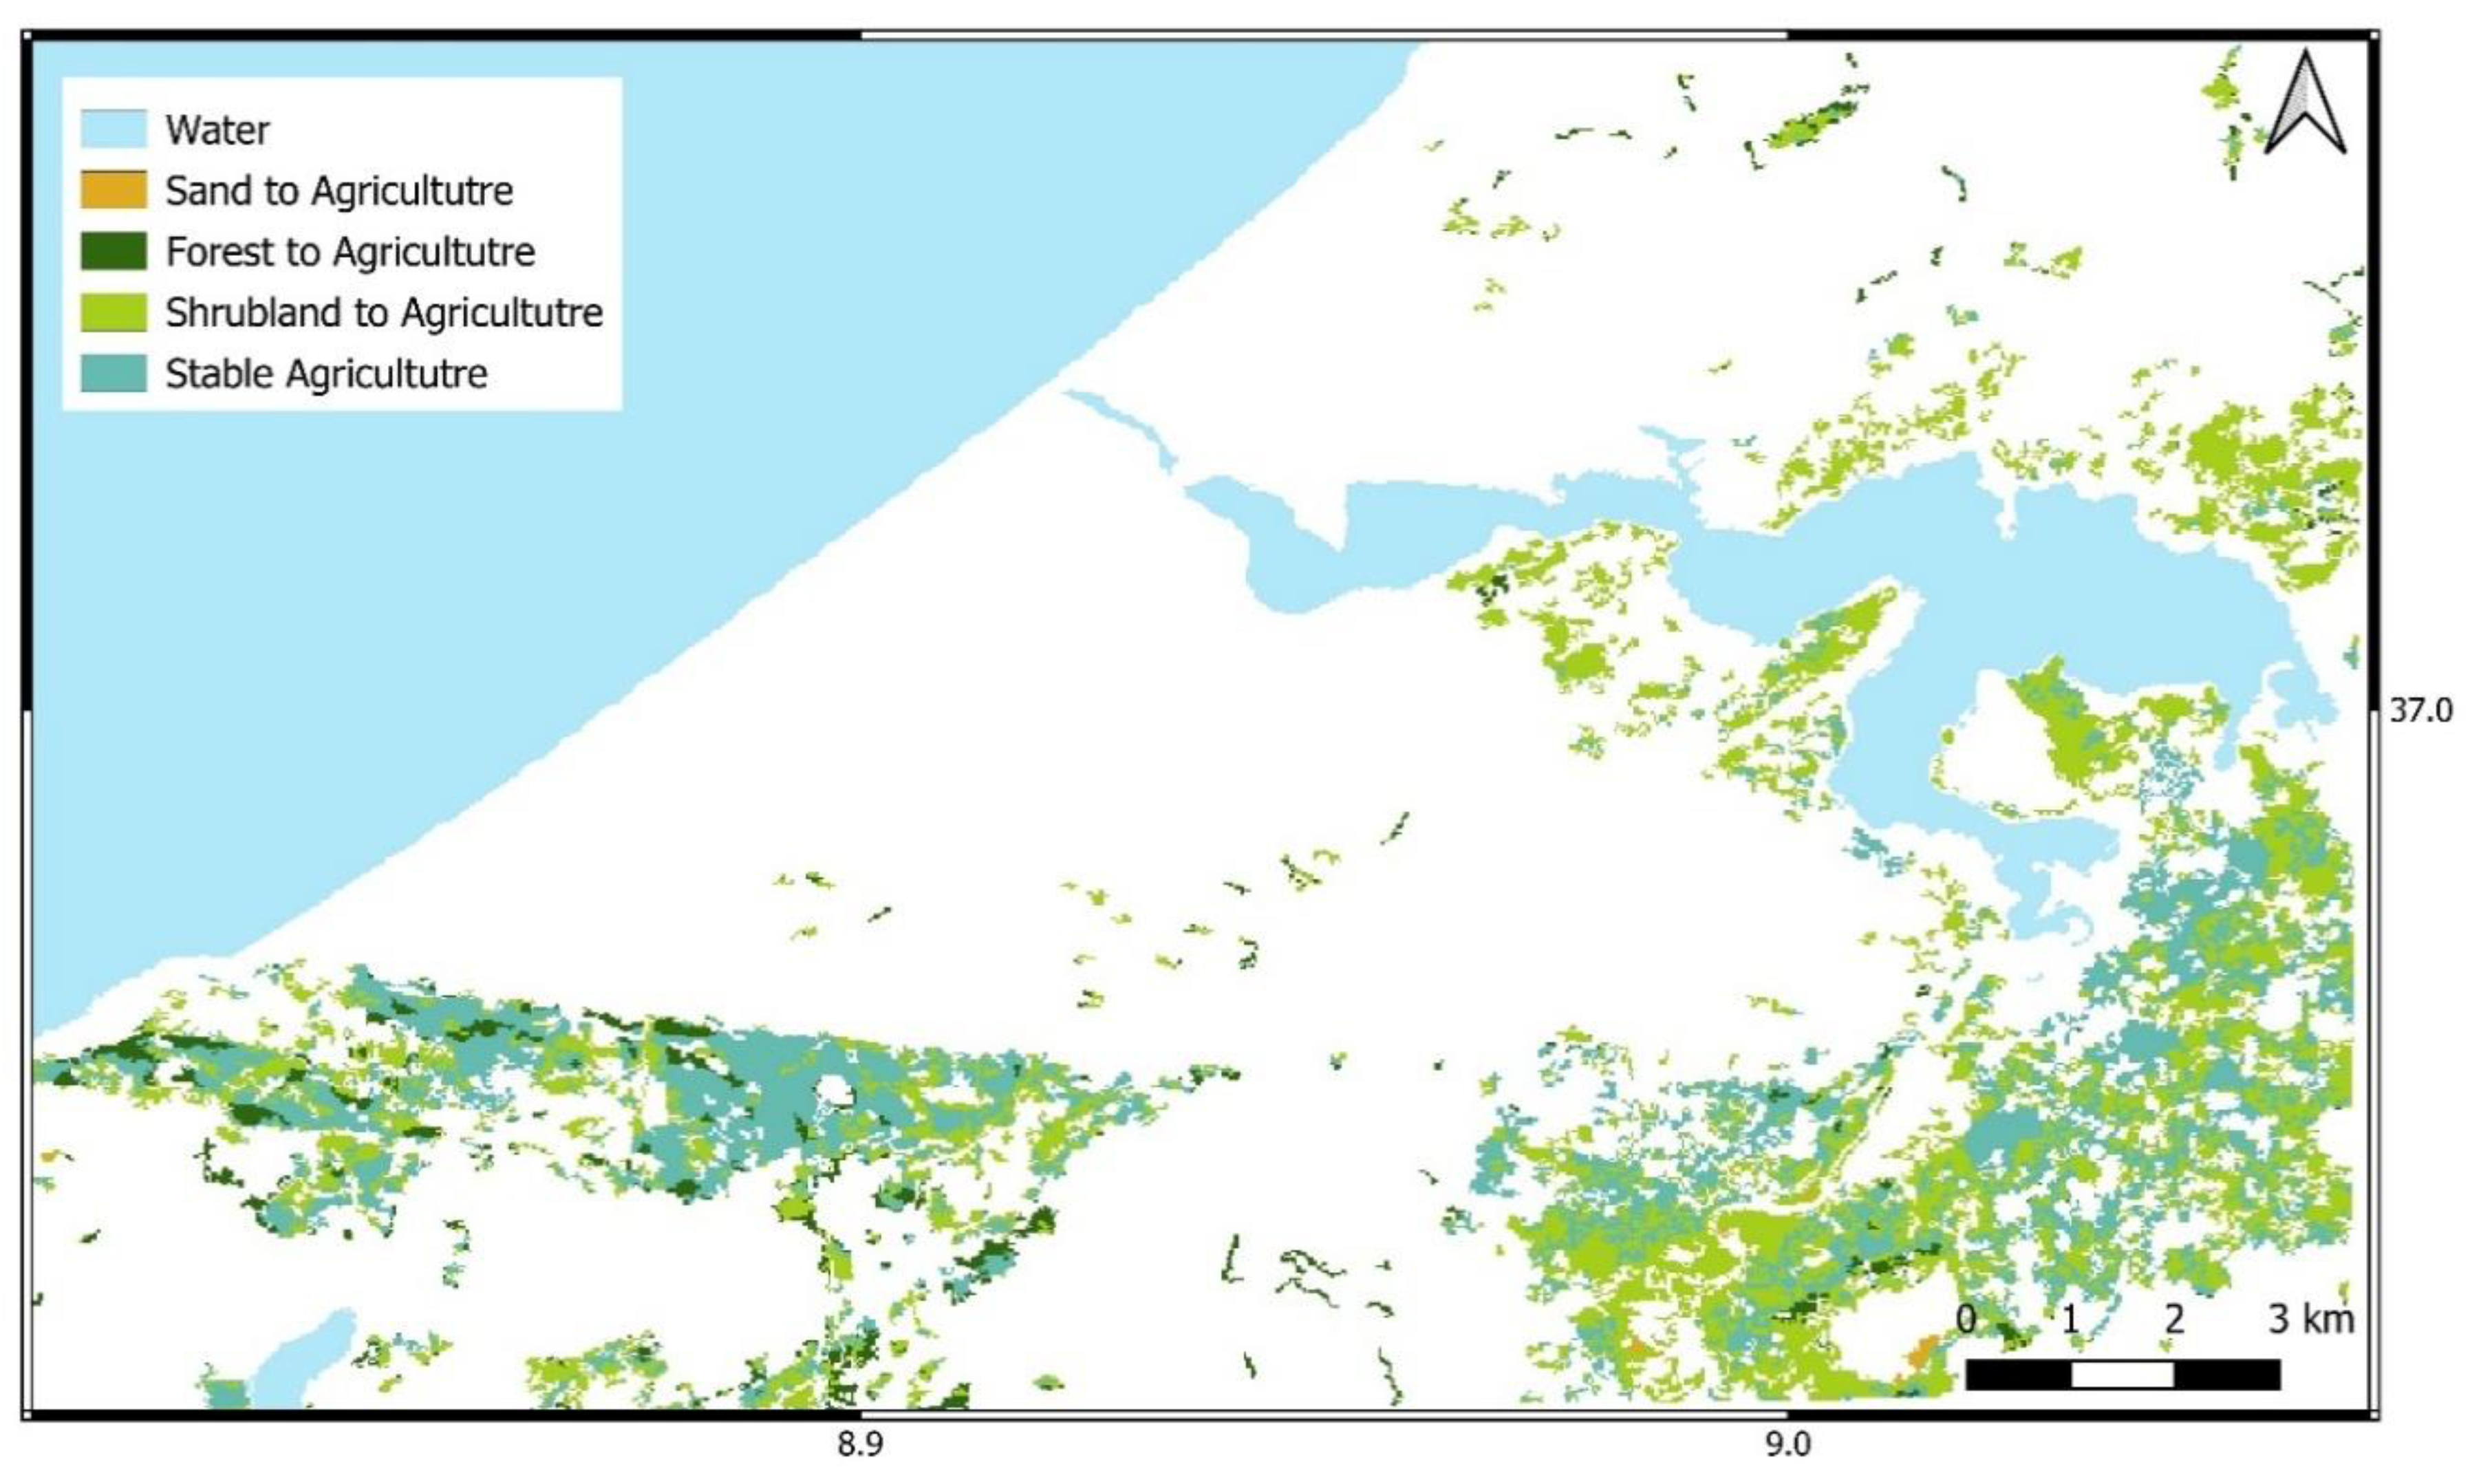
Figure 9.
Maps of the site (a) before and (b) after the fire.
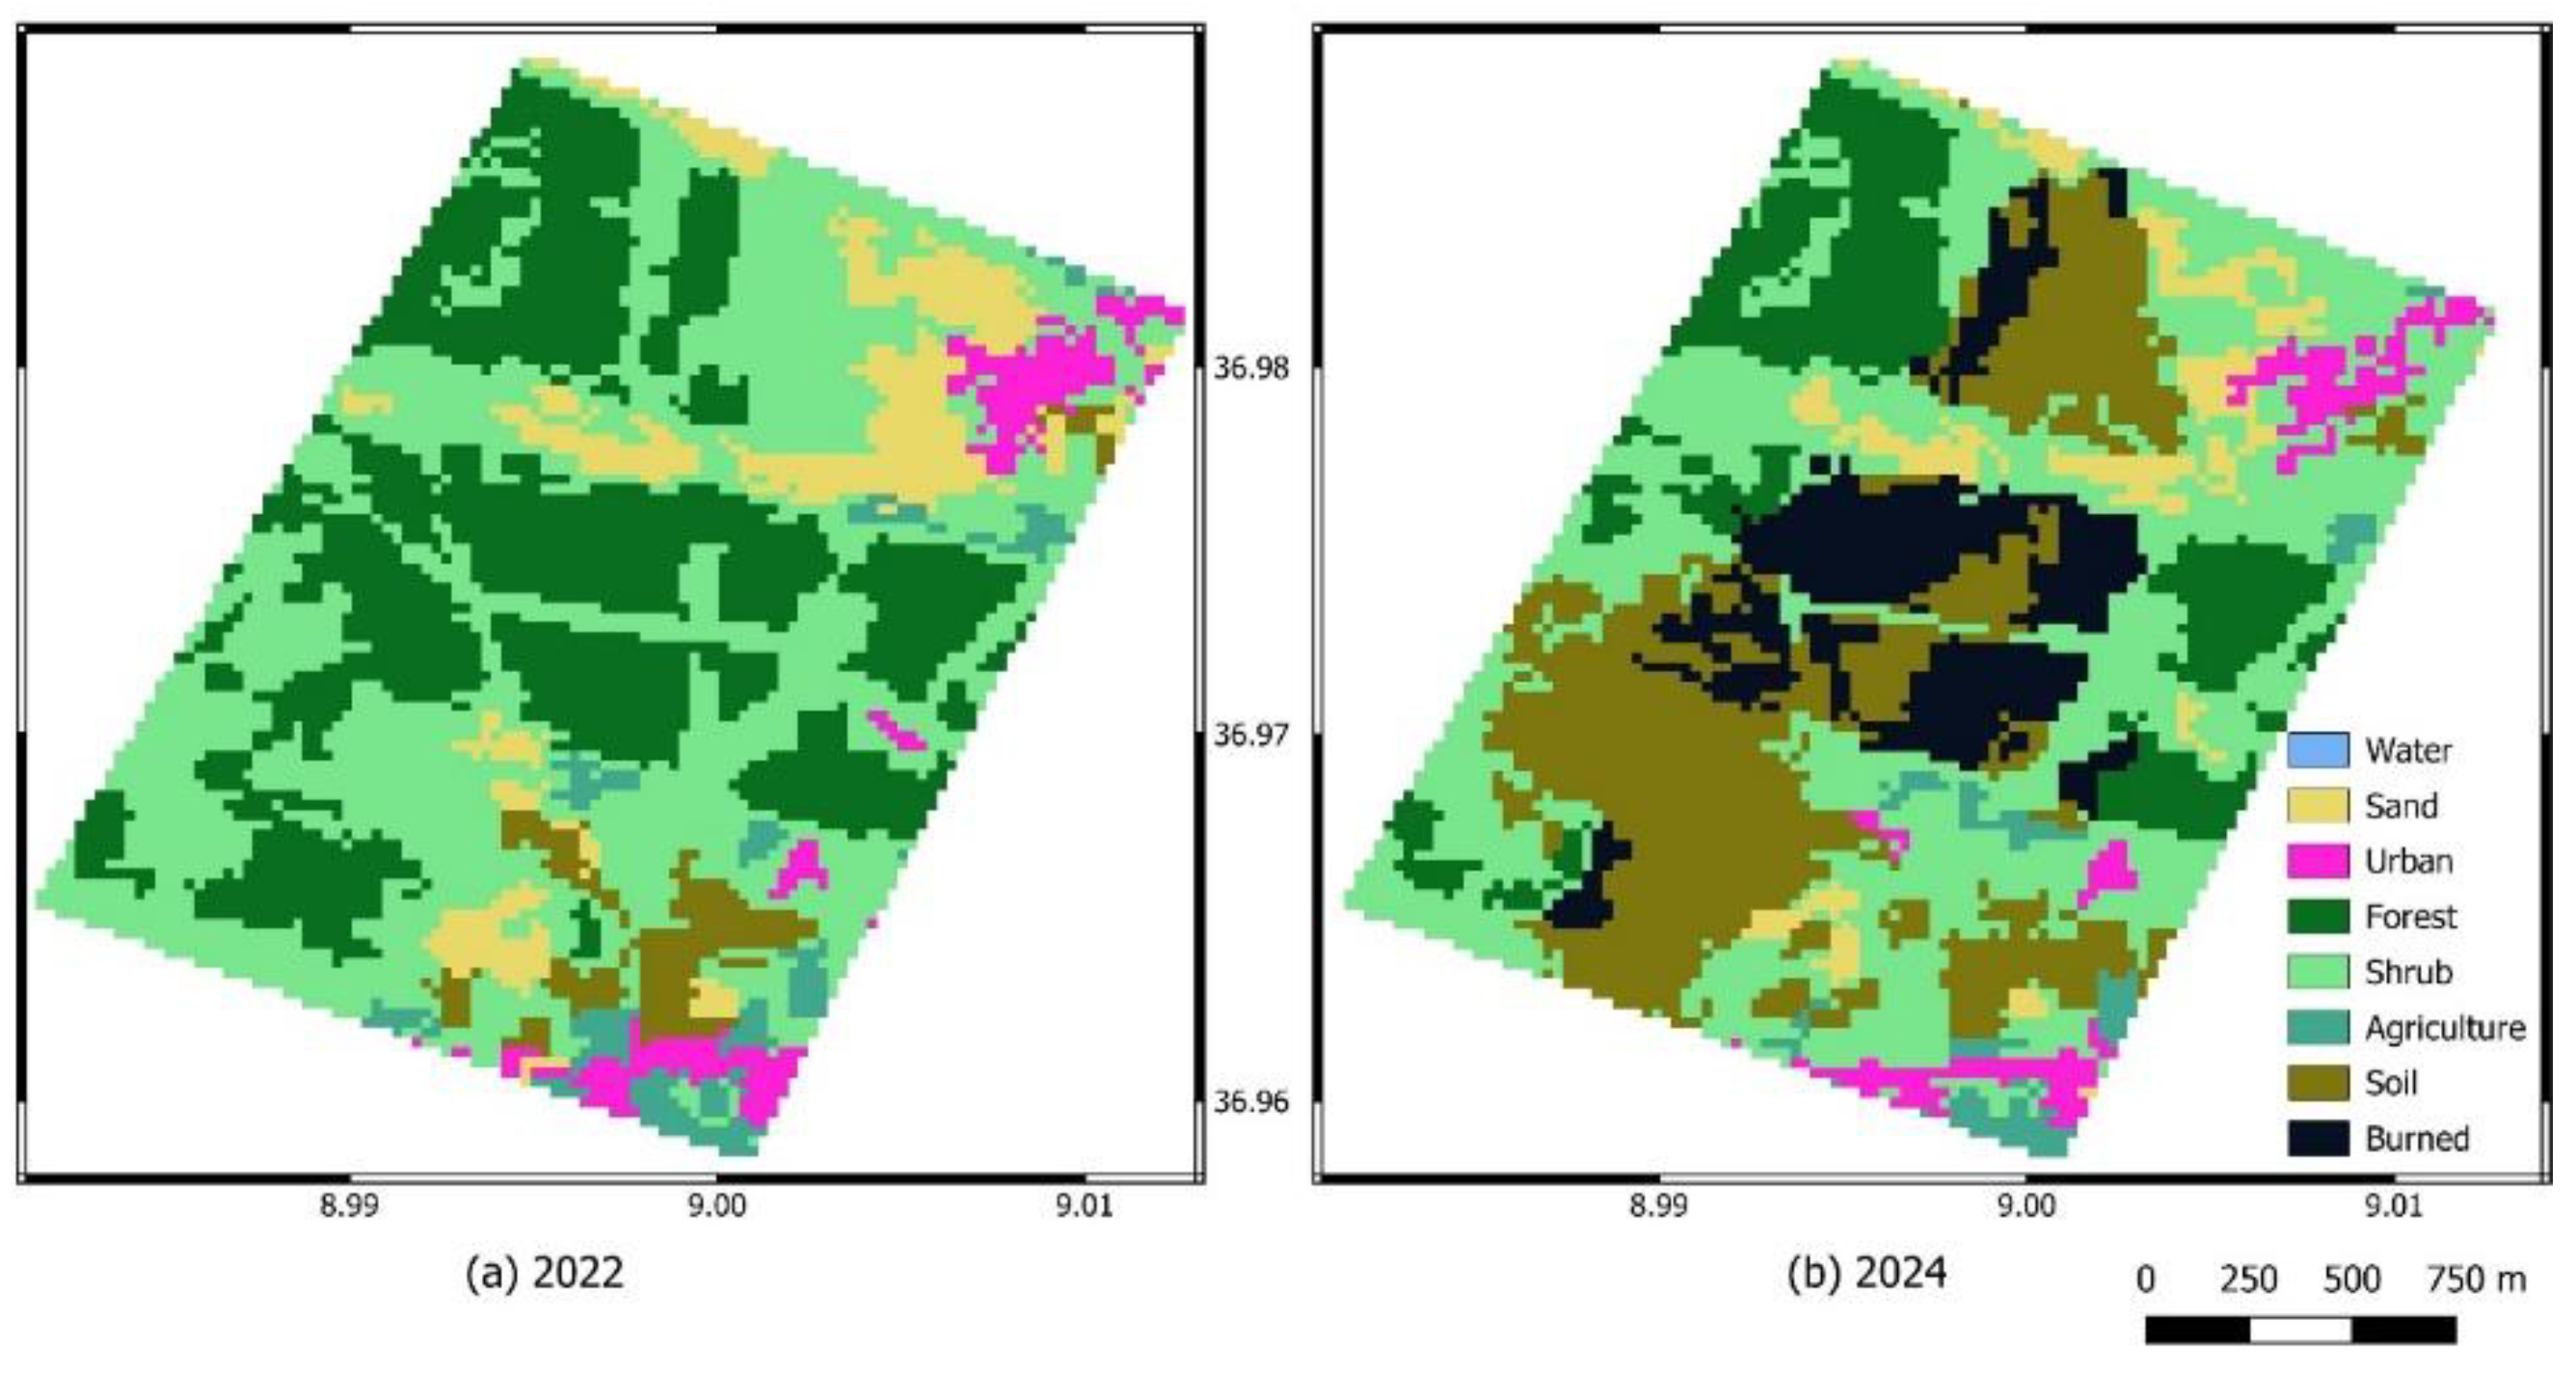
Figure 10.
Maps of (a) biomass loss, t/ha, and (b) carbon loss, t/ha.
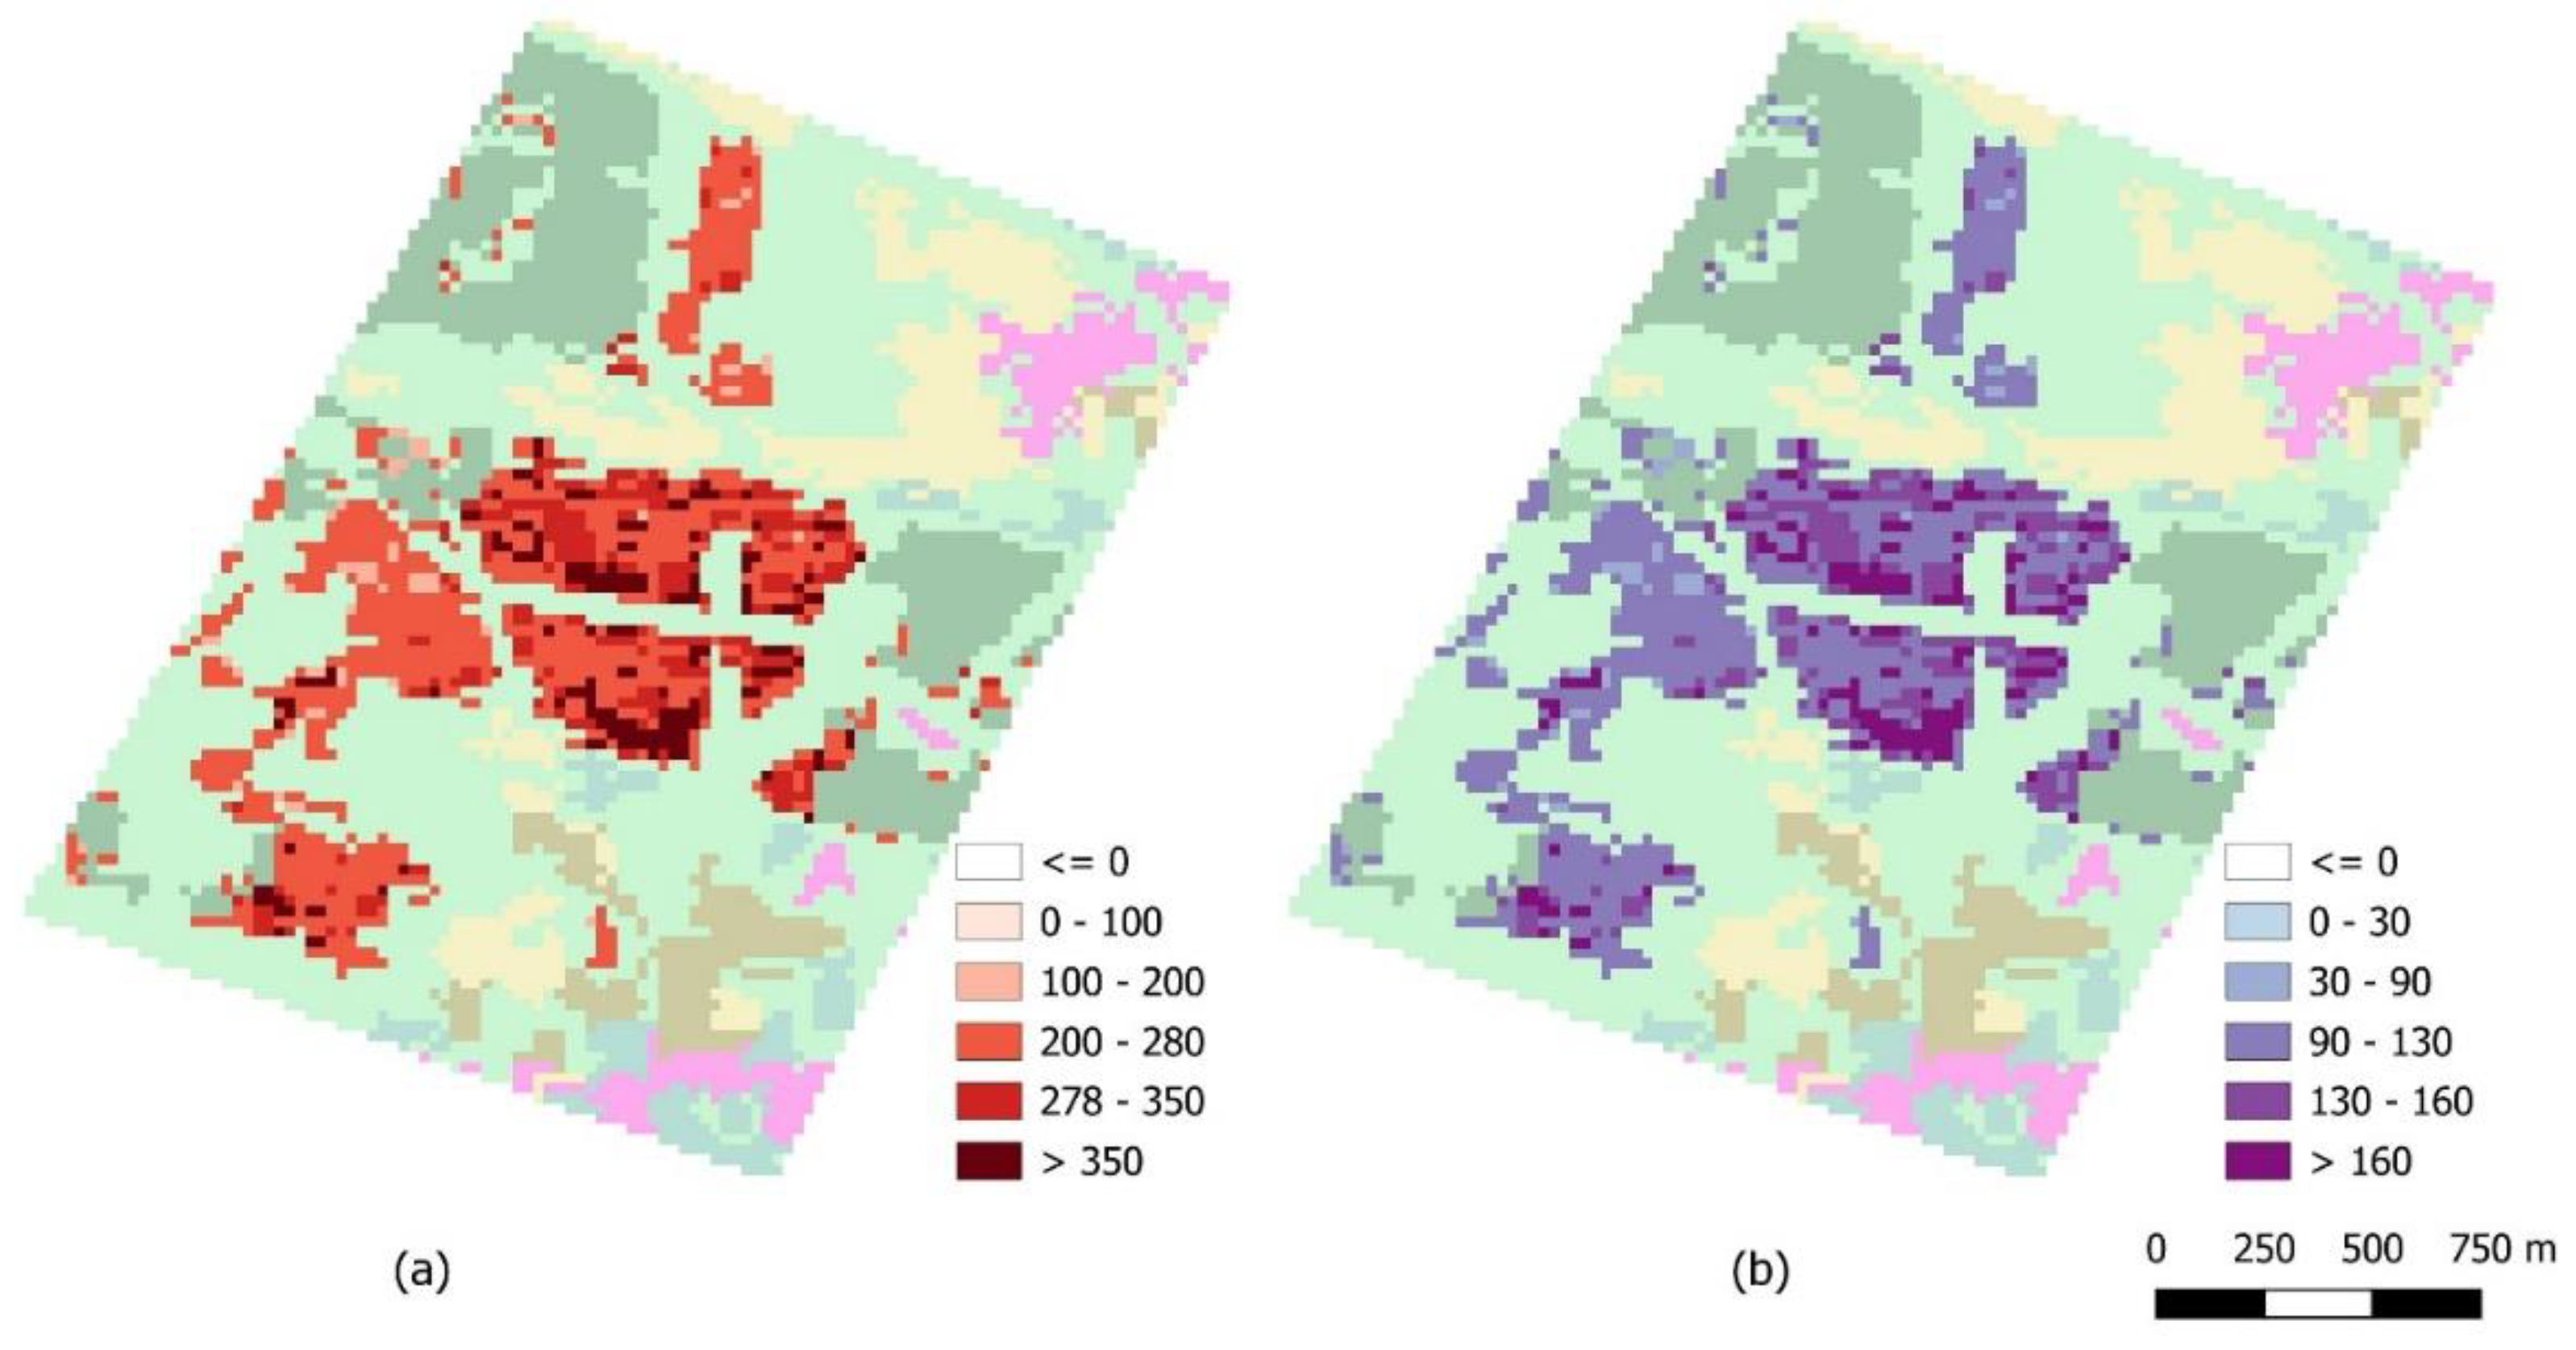
Table 2.
Feature Importance values.
| Landsat 5&7 | Landsat 8&9 | ||
| Feature | Importance score | Feature | Importance score |
| B4 NIR | 0.1334 | B5 NIR | 0.1272 |
| B2 Green | 0.1099 | B6 SWIR1 | 0.1075 |
| B5 SWIR1 | 0.1079 | B3 Green | 0.1032 |
| B1 Blue | 0.1042 | B10 TIRS | 0.0916 |
| B3 Red | 0.0904 | B2 Blue | 0.0888 |
| B7 SWIR2 | 0.0879 | B7 SWIR2 | 0.0862 |
| NDWI | 0.0719 | B4 Red | 0.0811 |
| B6 TIRS | 0.0637 | NDWI | 0.0772 |
| NDSAI | 0.0619 | B1 Coast | 0.0694 |
| NDBI | 0.0589 | NDVI | 0.0480 |
| NDVI | 0.0561 | NDBI | 0.0455 |
| NDSDI | 0.0533 | NDSAI | 0.0436 |
| NDSDI | 0.0307 | ||
Table 3.
Land-cover transition matrix (1994-2024) in hectares and percentages (%).
| 1994 | Land class | 2024 | |||||||
| Water | Sand | Urban | Forest | Shrub | Agriculture | Bare soil | Total area | ||
| Water | 10,154 (99.9%) |
3 (<0.1%) |
0(0%) | 0(0%) | 2 (<0.1%) |
0(0%) | 0(0%) | 10,159 | |
| Sand | 291 (13.2%) |
669 (30.3%) |
32 (1.4%) |
196 (8.9%) |
996 (45.1%) |
14 (0.6%) |
11 (0.5%) |
2,209 | |
| Urban | 0(0.0%) | 3 (6.1%) |
41 (83.7%) |
0(0%) | 3 (6.1%) |
2 (2.4%) |
1 (2.0%) |
50 | |
| Forest | 67 (0.6%) |
16 (0.2%) |
5 (<0.1%) |
8,543 (80.3%) |
1,596 (15.0%) |
319 (3.0%) |
92 (0.9%) |
10,639 | |
| Shrub | 1,343 (11.5%) |
463 (4.0%) |
158 (1.3%) |
2,000 (17.1%) |
5,145 (44.0%) |
2,344 (20.0%) |
254 (2.2%) |
11,707 | |
| Agriculture | 185 (5.6%) |
65 (2.0%) |
69 (2.1%) |
303 (9.1%) |
833 (25.1%) |
1,839 (55.3%) |
33 (1.0%) |
3,326 | |
| Bare soil | 4 (1.4%) |
42 (14.3%) |
20 (6.8%) |
36 (12.2%) |
125 (42.5%) |
33 (11.2%) |
34 (11.6%) |
294 | |
| Total area | 12,043 | 1,262 | 325 | 11,078 | 8,700 | 4,551 | 426 | ||
Values in parentheses indicate row percentages. Row sums may not equal 100% due to rounding.
Table 4.
Land area by category at the coastal stabilization site (hectares).
| Year | Water | Sand | Forest | Shrub | Agriculture | Bare soil |
| 1994 | 443.58 | 1902.58 | 1516.51 | 2305.46 | 19.17 | 10.41 |
| 2024 | 873.73 | 672.00 | 2038.84 | 2519.45 | 65.76 | 27.93 |
Table 5.
Increase of the Urban by reducing other classes (hectares).
| Sand | Forest | Shrubland | Agriculture | |
| 1994-1998 | 10.27 | 0.07 | 16.22 | 3.16 |
| 1998-2002 | 6.53 | 0.14 | 14.14 | 17.44 |
| 2002-2006 | 12.20 | 0 | 21.54 | 11.56 |
| 2006-2010 | 17.44 | 0 | 16.87 | 18.88 |
| 2010-2012 | 17.44 | 0 | 29.22 | 4.74 |
| 2012-2014 | 14.14 | 0.14 | 20.10 | 29.58 |
| 2014-2016 | 34.03 | 0.072 | 15.29 | 6.53 |
| 2016-2018 | 9.26 | 0.14 | 59.51 | 30.00 |
| 2018-2020 | 22.47 | 1.79 | 18.52 | 43.07 |
| 2020-2022 | 26.35 | 0.65 | 61.88 | 36.18 |
| 2022-2024 | 24.05 | 0.36 | 23.90 | 48.09 |
| 1994-2024 | 30.44 | 4.52 | 135.53 | 68.49 |
Table 6.
Increase of Agriculture by reducing other classes (hectares).
| Sand | Forest | Shrubland | Soil | |
| 1994-1998 | 0.29 | 201.29 | 2189.52 | 5.59 |
| 1998-2002 | 4.74 | 107.89 | 2365.26 | 43.07 |
| 2002-2006 | 9.26 | 82.05 | 923.04 | 207.82 |
| 2006-2010 | 4.16 | 43.72 | 694.62 | 93.11 |
| 2010-2012 | 49.25 | 213.78 | 2219.74 | 222.54 |
| 2012-2014 | 36.97 | 156.86 | 1077.67 | 344.58 |
| 2014-2016 | 263.17 | 151.47 | 1016.79 | 744.94 |
| 2016-2018 | 70.71 | 172.36 | 810.62 | 17.30 |
| 2018-2020 | 63.17 | 399.49 | 556.49 | 52.84 |
| 2020-2022 | 42.49 | 395.05 | 1039.69 | 63.17 |
| 2022-2024 | 81.62 | 92.18 | 689.23 | 41.56 |
Table 7.
Areas by classes before and after the fire (hectares).
| Year | Forest | Shrub | Bare soil | Burned |
| 2022 | 171 | 239 | 20 | |
| 2024 | 69 | 197 | 131 | 63 |
| Losses 2022-2024 | 102 | 42 | 111 |
Disclaimer/Publisher’s Note: The statements, opinions and data contained in all publications are solely those of the individual author(s) and contributor(s) and not of MDPI and/or the editor(s). MDPI and/or the editor(s) disclaim responsibility for any injury to people or property resulting from any ideas, methods, instructions or products referred to in the content. |
© 2026 by the authors. Licensee MDPI, Basel, Switzerland. This article is an open access article distributed under the terms and conditions of the Creative Commons Attribution (CC BY) license (http://creativecommons.org/licenses/by/4.0/).
Copyright: This open access article is published under a Creative Commons CC BY 4.0 license, which permit the free download, distribution, and reuse, provided that the author and preprint are cited in any reuse.


