

Submitted:
02 July 2026
Posted:
03 July 2026
You are already at the latest version
Abstract
In addition to soluble biochemical factors, biophysical cues from the extracellular matrix (ECM) can play an integral role in regulating cell behavior. Previous work has demonstrated that varying ECM dimensionality (3D vs. 2D) and structure (fibrillar vs. non-fibrillar) can produce distinct cell phenotypes; however, the transcriptional changes underlying how cells sense and respond to these different environments are not well understood. Here, we used bulk RNA sequencing to compare the gene expression profiles of primary rabbit corneal keratocytes cultured on collagen-coated substrates and on top of or embedded within fibrillar collagen matrices under serum-free conditions. Differential expression and functional analyses revealed distinct transcriptional profiles across the culture conditions and identified differentially expressed genes and enriched signaling pathways primarily related to the ECM, cell-matrix interactions, cell mechanics, and proliferation. Cells cultured in 3D fibrillar conditions exhibited gene expression patterns that better reflected a quiescent in vivo keratocyte phenotype, including broad suppression of proliferation and ECM synthesis-related genes. In contrast, cells cultured on 2D substrates showed higher expression of genes associated with an activated phenotype. Overall, these findings demonstrate the strong influence of biophysical cues from the ECM on keratocyte gene expression and highlight the importance of selecting physiologically relevant in vitro models for studies of corneal cell biology, wound healing, and regenerative therapies.
Keywords:
cornea
; stroma
; keratocyte
; 3D cell culture
; bulk RNA-seq
; ECM
1. Introduction
In vitro cell culture is a foundational tool in cell biology, tissue engineering, and therapeutic testing. Traditionally, cells are grown as two-dimensional (2D) monolayers on flat, rigid substrates such as plastic or glass; however, most cells exist in a more complex extracellular environment in vivo. Three-dimensional (3D) culture systems are believed to better approximate an extracellular matrix (ECM) structure that is similar to what cells experience in vivo, by allowing cells to grow within natural (collagen or other ECM analogues) or synthetic matrices or as scaffold-free spheroid systems [1,2,3]. Previous studies have shown that ECM dimensionality can have profound effects on cell-cell and cell-matrix interactions, nutrient and oxygen gradients, mechanical cues, and morphological constraints, which in turn influence cell phenotype and behavior [1,4,5,6,7].
2D culture models remain popular because of their simplicity, reproducibility, and ease of access for microscopy, biochemical assays (e.g., Western Blot and qPCR), and high-throughput techniques (e.g., RNA sequencing). However, 2D culture imposes artificial constraints, as cells are forced to adopt flattened morphologies, and the absence of 3D ECM limits cell-matrix interactions and signaling [8]. 3D culture models are believed to better recapitulate certain in vivo-like conditions because they allow for more physiological cell-cell and cell-matrix interactions and allow for mechanical feedback from the ECM [9].
Numerous studies have demonstrated that cells cultured in 3D show distinct phenotypes relative to their 2D counterparts. For example, cancer cells in 3D exhibit altered morphology, migratory behavior, proliferation kinetics, and drug resistance compared to 2D cultures [8,9,10,11,12,13]. Despite these previous observations of phenotypic and functional differences, few studies have carried out comprehensive gene expression profiling comparing 2D and 3D culture. Comparative studies in cancer and other cell types have used RNA sequencing (RNA-seq) and microarrays to demonstrate that 3D culture, primarily using spheroids or synthetic matrices, can shift transcriptomes toward more in vivo-like gene expression signatures related to ECM, hypoxia, metabolism, and signal transduction [1,8,9,10,14,15,16,17]. However, transcriptional information on cells interacting with native fibrillar collagen matrices is limited. Furthermore, similar transcriptional comparisons for corneal keratocytes in 2D and 3D culture are lacking, as previous studies have focused primarily on phenotypic differences (e.g., morphology, ECM deposition, motility) [18,19,20]. This lack of transcriptional profiling limits our understanding of how biophysical cues from 2D and 3D environments modulate gene regulatory networks and keratocyte fate, and the mechanisms through which keratocytes sense and respond to changes in their extracellular environment.
Corneal stromal cells, or keratocytes, play a critical role in maintaining corneal transparency and mediating the stromal wound healing response following injury or surgery. In their quiescent state, keratocytes secrete and organize normal stromal collagens and proteoglycans to maintain the ECM composition and structure required for corneal transparency and mechanical stability [21,22]. After stromal injury or surgery, the release of pro-inflammatory cytokines and growth factors results in the activation of quiescent keratocytes towards a migratory fibroblast and/or fibrotic myofibroblast phenotype [23,24]. These activated stromal cells repopulate the wound and deposit new ECM [25,26]. In physiological conditions, this ECM is remodeled to restore corneal transparency. However, in pathological conditions, dysregulated or protracted cellular responses to wound healing cues can lead to corneal fibrosis and scarring, which are leading causes of blindness worldwide [27]. Recently, our lab and others have investigated the transcriptional profiles of cultured corneal keratocytes, fibroblasts, and myofibroblasts; however, these experiments were performed using only 2D substrates [28,29,30]. In the present study, we compare the global gene expression profiles of rabbit corneal keratocytes cultured in 2D and 3D environments under identical biochemical conditions, using both collagen-coated substrates and fibrillar collagen matrices. By applying bulk RNA-seq and downstream bioinformatic analyses, we identify genes and enriched signaling pathways that are differentially regulated in 2D and 3D culture. We relate these transcriptional changes to previously observed differences in keratocyte phenotype, such as ECM deposition, matrix remodeling, and cell mechanics.
2. Materials and Methods
2.1. Isolation of Primary Rabbit Corneal Keratocytes
Normal rabbit keratocytes (NRKs) were isolated from New Zealand white rabbit eyes (Pel-Freez Biologicals, Rogers, AR, USA) and maintained in serum-free (SF) media according to previously described protocols [31]. To summarize, Pel-Freez eyes were placed in RPMI-1640 Medium (Sigma, St. Louis, MO, USA) supplemented with 1% antibiotic antimycotic solution (Sigma) prior to corneal dissection. The epithelium was removed by swabbing with an alcohol pad and scraping with a surgical blade (no. 11; Sigma). Corneal buttons were excised, placed in fresh RPMI solution, and the endothelium was removed by gently scraping with a disposable scalpel (no. 15; Fisher Scientific, Waltham, MA, USA). The corneal buttons were incubated overnight at 37 °C in digestion media consisting of 1X MEM (Gibco, Grand Island, NY, USA) with 2.0 mg/mL collagenase (Gibco), 0.5 mg/mL hyaluronidase (Worthington Biochemical Corporation, Lakewood, NJ, USA), and 2% antibiotic antimycotic solution. Isolated keratocytes were centrifuge-pelleted (4 min at 1500 rpm), resuspended in SF media, and plated in 25 cm2 tissue culture flasks. Defined SF media contained Dulbecco’s modified Eagle’s medium (DMEM; Sigma) supplemented with 100 μM non-essential amino acids (Gibco), 100 μg/mL ascorbic acid (Sigma), 1% RPMI vitamins solution (Sigma), and 1% antibiotic antimycotic solution [32]. Cells were maintained in SF media for five days prior to use in experiments.
2.2. 2D and 3D Cell Culture
In all experiments, first passage NRKs were plated with SF media (day 0) and cultured for six days before isolating RNA or fixing samples for fluorescence microscopy. SF media was replenished on days 2 and 5. For 2D culture, NRKs were plated on the surface of collagen-coated substrates or fibrillar collagen matrices, and for 3D culture NRKs were embedded within fibrillar collagen matrices. For 2D collagen-coated conditions (2DC), MatTek dishes (MatTek, Ashland, MA, USA) were covered with a neutralized solution of 50 μg/mL type I collagen, incubated for 30 min at 37 °C, then rinsed twice with DMEM before plating NRKs at a density of 50,000 cells/mL (~15,000 cells/cm2). For the 2D fibrillar collagen condition (2DF), 300 μL of neutralized collagen solution (1.5 mg/mL) was allowed to polymerize for 90 min at 37 °C before plating NRKs at a density of 50,000 cells/mL (~15,000 cells/cm2). For the 3D fibrillar collagen condition, 300 μL of neutralized collagen solution (1.5 mg/mL) containing 100,000 cells/matrix (3DF) was allowed to polymerize for 90 min at 37 °C before adding SF media [33]. To assess the effects of cell density, matrices containing 50,000 cells/matrix (3DF_50) were also plated. For all fibrillar collagen matrices, the 300 μL aliquots of collagen solution were spread over the 20 mm diameter microwells of the Mattek dishes. Neutralized collagen solution was prepared by mixing type I bovine collagen (Advanced BioMatrix, Carlsbad, CA, USA) with 10X MEM, 0.1 N NaOH, and DMEM (with cells for 3D conditions only) to obtain the final concentrations of 50 μg/mL (for 2DC) or 1.5 mg/mL (for 2DF, 3DF, and 3DF_50).
2.3. Total RNA Isolation and Sequencing
Total RNA was collected for five different experimental conditions using the Aurum Total RNA Mini Kit (Bio-Rad, Hercules, CA, USA). First, all samples were rinsed twice with sterile phosphate-buffered saline (PBS). For all conditions with fibrillar collagen matrices (2DF, 3DF, and 3DF_50), matrices were first lifted from the culture dishes using a small spatula and placed in sterile 2 mL microcentrifuge tubes (3-6 matrices per tube). To isolate the NRKs from the collagen matrix, 1 mL of digestion media was added to each tube and incubated on a rocker for 15 min at 37 °C. The cells were then centrifuge pelleted (4 min at 1500 rpm), rinsed once with PBS, then resuspended in lysis buffer. For the 2D collagen-coated condition (2DC), culture dishes were incubated with digestion media for 15 min at 37 °C. The dishes were then rinsed with PBS, followed by the addition of lysis buffer. To assess the effects of the digestion media incubation, lysis buffer was added directly to the culture dish (without digestion media) in another group (2DC_L). For all conditions, lysates were collected in sterile 1.5 mL microcentrifuge tubes, then mixed with RNase-Free 70% ethanol. RNA isolation steps proceeded according to the manufacturer’s protocol, and total RNA was eluted from the Aurum RNA-Binding Mini Columns using molecular biology grade water. To collect a sufficient amount of RNA for bulk RNA-seq, 5-6 dishes were pooled for collagen-coated conditions, and a minimum of 11 matrices were pooled for fibrillar collagen conditions.
RNA concentration and integrity were evaluated using a Thermo Scientific NanoDrop OneC. For each condition, three experimental replicates were sent to Novogene Co. (Sacramento, CA, USA) for bulk RNA-seq. Novogene Co. carried out sample quality control (Agilent 5400) followed by library preparation, quality control, and sequencing using the NovaSeq 6000 platform (Illumina, San Diego, CA, USA). After data quality control, sequencing reads were aligned to the oryCun2 reference genome (HISAT2 version 2.0.5) and gene expression level analysis was conducted (featureCounts version 1.5.0-p3).
2.4. Principal Component, Differential Expression, and Enrichment Analyses
Additional bioinformatics analysis was conducted using NovoMagic, a free Novogene platform for data analysis. Principal component analysis (PCA) was performed on the normalized gene expression values (FPKM) of all samples to evaluate differences between the five experimental conditions (2DC, 2DC_L, 2DF, 3DF and 3DF_50). Differential expression analysis was performed for pairwise comparisons of both the three primary conditions (2DC, 2DF, 3DF) and all five conditions (2DC, 2DC_L, 2DF, 3DF, 3DF_50) (DESeq2 version 1.20.0). The screening criteria for differentially expressed genes (DEGs) was set to a |log2[fold change]| ≥ 1 and an adjusted P value ≤ 0.05. The original data presented in this study are openly available in NCBI’s Gene Expression Omnibus via the GEO series accession number (will be provided prior to publication). KEGG (Kyoto Encyclopedia of Genes and Genomes) enrichment analysis was also carried out for each differential gene set to determine which biological functions and signaling pathways were significantly associated with DEGs (clusterProfiler version 3.8.1). KEGG pathways with an adjusted P value < 0.05 were considered significant.
All bar plots, volcano plots, and heatmaps displaying results from differential expression and pathway analyses were created using GraphPad Prism. Heatmaps used normalized, log2-transformed FPKM values (log2[FPKM+1]) to display relative expression levels across samples (columns) for sets of differentially expressed genes (rows). Hierarchical clustering was carried out on the gene sets so genes and samples with similar expression patterns would be gathered together.
2.5. Fluorescence Microscopy
Additional samples from each experimental condition were stained with phalloidin to visualize cell morphology and F-actin organization. Briefly, cells were fixed with 3% paraformaldehyde for 15 min, washed in PBS (3 times, 10 min each), then permeabilized with 0.5% Triton X-100 for 15 min. For F-actin labeling, cells were incubated with Alexa Fluor 633 Phalloidin (Invitrogen, Eugene, OR, USA) for 2 hr at 37 °C, then washed in PBS (3 times, 20 min each). To label cell nuclei, cells were incubated with DAPI (Invitrogen) for 20 min at room temperature, then rinsed twice. Fluorescence images were acquired using a laser confocal microscope (Leica SP8, Heidelberg, Germany) and a 25× water immersion objective. A stack of optical sections (z-series) was acquired for each image using a step size of 2 μm. Image processing was carried out using ImageJ. Summed voxel projections were made for each channel, then combined using the merge channels function.
3. Results
3.1. Keratocyte Morphology and Transcriptional Profiles in 2D and 3D Culture
Keratocytes cultured in 2D and 3D environments developed different morphologies while being maintained in serum-free media (Figure 1A). While cells in all ECM conditions developed a stellate morphology that is characteristic of quiescent keratocytes [34], cells on 2D collagen-coated substrates (2DC) had broader cell bodies and thicker extensions, whereas cells on top of (2DF) or embedded within (3DF) fibrillar collagen matrices had thinner cell extensions with more branching and punctate F-actin labeling. Due to the lower effective cell density in the 3D conditions, cells in 2D exhibited greater numbers of cell-cell contacts.
To investigate the impact of different ECM environments at the transcriptional level, three samples of total RNA were collected for each experimental condition and submitted for bulk RNA-seq. The RNA isolation method optimized for this study yielded a suitable quantity (>200 ng) and quality (RIN > 9.0) of RNA from cells cultured in 2D and 3D environments. Principal component analysis (PCA) was performed to evaluate differences in the overall gene expression profiles of each of these samples (Figure 1B). The PCA plot showed clear separation between the 2D collagen-coated (2DC), 2D fibrillar collagen (2DF), and 3D fibrillar collagen (3DF) conditions, while samples within each condition were clustered together.
Differential expression analysis revealed that comparing cells in 3D fibrillar collagen to those on 2D collagen-coated substrates resulted in the highest number of significant DEGs (1,153; Figure 1C). This was followed by the comparisons of 2D fibrillar collagen vs. 2D collagen-coated (795 DEGs), then 3D vs. 2D fibrillar collagen (605 DEGs). The combined differential gene set from these three comparisons contained 1,655 DEGs. The relative expression heatmap for this differential gene set showed several groups of genes with distinct patterns of expression across the three experimental conditions (Figure 1D). A large set of genes had high expression in the 2D collagen-coated condition (2DC) relative to both fibrillar collagen conditions (2DF, 3DF), while another set showed high expression in fibrillar collagen relative to collagen-coated. Gene sets with high relative expression in 2D (2DC, 2DF) compared to 3D, or with high expression in 3D relative to 2D, were also identified in this heatmap. A gene set with high relative expression in 2DF further distinguished this condition from the others. Thus, both ECM dimensionality (3D vs. 2D) and structure (fibrillar vs. non-fibrillar) impacted the pattern of keratocyte gene expression.
Similar observations were made regarding the principal component and differential expression analyses when performed for all five conditions (Figure 2). Changing the cell density or omitting the digestion media incubation had the smallest effects on differential gene expression. In the PCA plot, the two 3D conditions clustered together (3DF, 3DF_50) and the two collagen-coated conditions clustered together (2DC, 2DC_L) indicating similar gene expression profiles (Figure 2A). From the differential expression analysis, 3DF vs. 3DF_50 had only 203 DEGs, many of which were related to cell-ECM interactions, and 2DC vs. 2DC_L had only 50 DEGs, which were mainly associated with the early cellular response to external stimuli and the regulation of cell stress response (Figure 2B, S1). The differential gene set generated from all ten pairwise comparisons consisted of 2,876 genes. The corresponding relative expression heatmap showed several sets of genes with distinct patterns of expression across the five conditions, once again distinguishing 3D conditions from 2D, and fibrillar from non-fibrillar (Figure S2). Given the small difference in gene expression between 2DC vs. 2DC_L, and 3DF vs. 3DF_50, we continued to focus our analysis on three of the five experimental conditions: 2DC, 2DF, and 3DF, so that we could more directly compare the effects of ECM structure and dimensionality.
3.2. Expression of Common Markers for Quiescent and Activated Cells
NRKs cultured in 2DC, 2DF, and 3DF conditions showed similarly high levels of expression for genes that are commonly associated with quiescent keratocytes. Genes encoding native stromal proteoglycans such as keratocan (KERA), lumican (LUM), decorin (DCN), and mimecan (OGN), as well as the corneal crystallins aldehyde dehydrogenase 1 family member A1 (ALDH1A1) and transketolase (TKT), did not show significant differential expression in the comparisons of these three conditions (Figure 3A,B) [22,35]. However, these genes tended to have the highest expression levels for cells in 3D relative to the 2D conditions. In contrast, genes encoding type I and type V collagens, the primary fibrillar collagens that make up the corneal stroma [22,36], had the lowest expression levels in the 3D condition (Figure 3C). Gene expression for collagen type I alpha 1 chain (COL1A1) was significantly downregulated in 3DF as compared to 2DC, and collagen type V alpha 3 chain (COL5A3) was significantly downregulated in both 2DF and 3DF compared to 2DC. Collagen type V alpha 1 chain (COL5A1) was not significantly differentially expressed, however, it followed a similar pattern with 2DC having the highest expression levels, followed by 2DF, then 3DF.
Several genes that are commonly associated with activated stromal cells or fibrosis were differentially expressed when comparing NRKs cultured in 2D and 3D environments. Marker of proliferation Ki-67 (MKI67) and proliferating cell nuclear antigen (PCNA), two genes involved in cell proliferation [37,38,39,40], both showed lower expression in 2DF and 3DF relative to 2DC (Figure 3D). Genes encoding ECM components associated with fibrosis and wound healing, such as type III collagen (COL3A1) [41,42], tenascin C (TNC) [43,44,45], biglycan (BGN) [41,46], and fibronectin (FN1) [42,47], were significantly downregulated in 3D as compared to both 2D conditions (Figure 3E). COL3A1 and TNC also showed significant differential expression when comparing the two 2D conditions, with expression levels being downregulated in 2DF relative to 2DC. Genes encoding cytoskeletal components that typically show increased expression in activated stromal cells, including alpha-smooth muscle actin (α-SMA; ACTA2) [32,48], integrin subunit alpha 5 (ITGA5) [41,49,50], beta actin (ACTB) [49,51], and vimentin (VIM) [52], showed a similar trend where 2DC had the highest expression and 3DF had the lowest (Figure 3F). As expected for serum-free culture, ACTA2 expression levels were very low for all three conditions, however, its expression was significantly downregulated in both 2DF and 3DF as compared to 2DC. Overall, the gene expression levels for these common markers of quiescent keratocytes and activated stromal cells appear to point toward a more quiescent transcriptional profile for cells cultured in 3D fibrillar collagen.
3.3. Pathway Enrichment Analysis
KEGG enrichment analysis was performed for the comparisons of 3DF vs. 2DC, 2DF vs. 2DC, and 3DF vs. 2DF to identify significantly enriched biological functions and signal transduction pathways associated with DEGs (Figure 4). Overall, pathways related to cell-ECM interactions, ECM maintenance, cell adhesion, motility, proliferation, and metabolism were significantly enriched for these comparisons. For example, the ECM-receptor interaction, focal adhesion, and protein digestion and absorption pathways were significantly enriched in all three comparisons. This suggests that shifting from a 3D to a 2D culture system, or from a fibrillar to non-fibrillar ECM, significantly altered the expression of genes involved in cell adhesion, ECM synthesis, and remodeling. The cell cycle and PI3K-Akt signaling pathways were significantly enriched for the comparisons of 3DF vs. 2DC and 2DF vs. 2DC. Genes in these pathways were primarily downregulated in these comparisons, indicating that cells in fibrillar collagen conditions may be less proliferative compared to those on collagen-coated substrates.
3.4. Differentially Expressed Genes of Interest
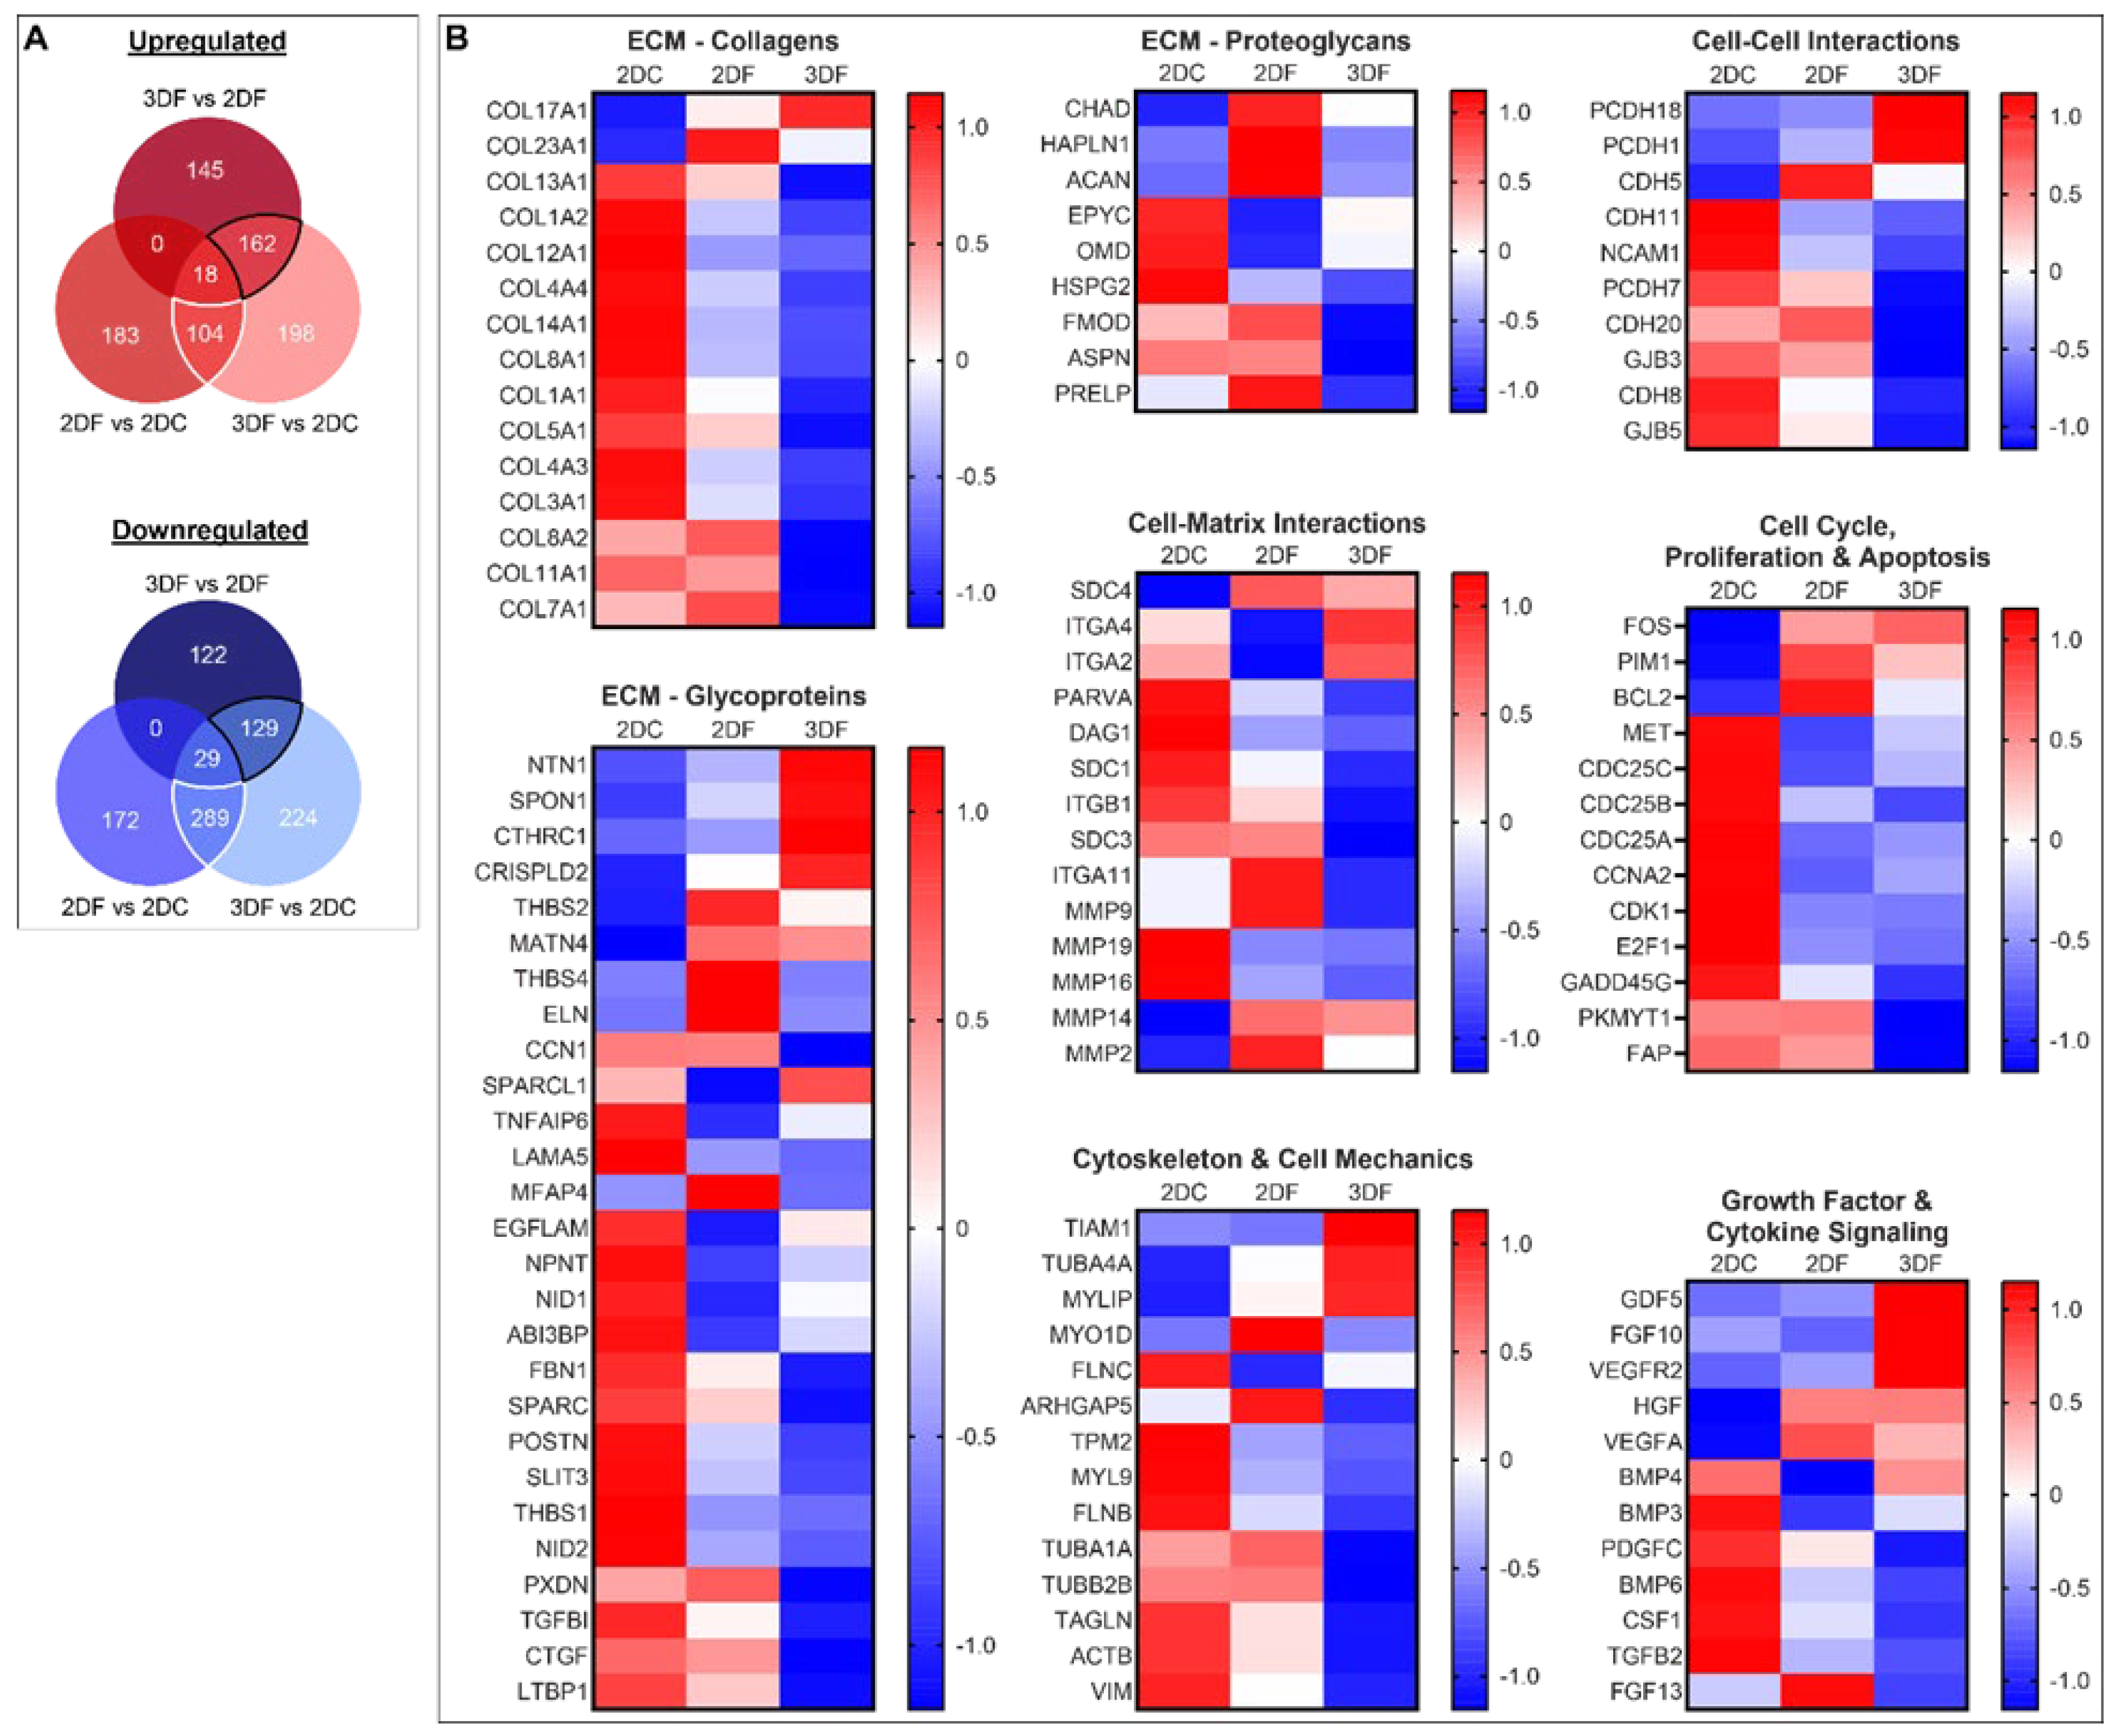
Differential expression analysis for 3DF vs. 2DC, 2DF vs. 2DC, and 3DF vs. 2DF identified many genes that were significantly differentially expressed in more than one comparison. Venn diagrams were created to visualize overlaps in the differential gene sets for these three comparisons, as well as to identify DEGs that were unique to each comparison (Figure 5A). For example, 3DF vs. 2DF had 145 upregulated and 122 downregulated genes that were only differentially expressed in this comparison. The overlapping areas for 3DF vs. 2DF and 3DF vs. 2DC (black outlines in Figure 5A) highlight sets of upregulated (162) and downregulated (129) genes that were likely differentially expressed due to the difference in ECM dimensionality. Sets of genes that were likely differentially expressed due to the presence or absence of fibrillar collagen are highlighted by the overlapping areas for 2DF vs. 2DC and 3DF vs. 2DC (104 upregulated, 289 downregulated, white outlines in Figure 5A).
A subset of significant DEGs of interest were selected from the differential expression and KEGG pathway analyses and were organized into several categories based on their primary roles/functions and the types of proteins they encode. The most prominent categories were ECM, cell-matrix interactions, cell-cell interactions, cytoskeleton and cell mechanics, cell cycle, proliferation and apoptosis, and growth factor and cytokine signaling (Figure 5B). The relative expression heatmaps for these gene sets help to further highlight the overall trends in differential expression and to identify DEGs that distinguish cells in 3D culture from those in 2D, as well as fibrillar from non-fibrillar.
In general, cells in the 2DC condition exhibited the highest levels of expression for ECM related genes, including an abundance of collagens, glycoproteins, and proteoglycans. Interestingly, genes encoding basement membrane collagens (COL4A1, COL4A3, COL4A4, COL7A1, COL8A1, COL8A2) [53] showed higher expression in 2D compared to 3D. Perlecan (HSPG2), a proteoglycan that is another major ECM component of basement membranes [53,54], was also highly expressed in 2DC compared to both 2DF and 3DF. Several glycoproteins and proteoglycans associated with the regulation of TGFβ activity also had higher expression in 2D conditions, including asporin (ASPN), fibrillin 1 (FBN1), and fibromodulin (FMOD) [55]. Genes that showed higher expression in 3D included two transmembrane collagens (COL17A1, COL23A1) and several glycoproteins (NTN1, SPON1, THBS2) that play a role in cell adhesion [56]. Additional genes encoding glycoproteins involved in tissue development and remodeling that were highly expressed in 3D included SPON1, CTHRC1, CRISPLD2, and MATN4.
Two notable genes involved in cell-matrix interactions that were upregulated in fibrillar collagen conditions were the matrix metalloproteinases MMP2 and MMP14. These MMPs are involved in the breakdown of ECM in normal physiological processes such as development and tissue remodeling, and MMP14 has been shown to be especially important for cell migration and invasion in 3D matrices [57]. In contrast, MMPs that have been linked to wound healing and fibrosis (MMP9, 19, and 16) were more highly expressed in 2D. Genes involved in cell-cell interactions were primarily downregulated in 3D compared to 2D, indicating that there may be fewer cell-cell contacts. This included several genes encoding cadherins (CDH11, CDH20, CDH8) and gap junctions (GJB3, GJB5). Genes involved in cell-cell interactions that were more highly expressed in 3D included protocadherins 1 and 18 (PCDH1, PCDH18), as well as cadherin 5 (CDH5), which was highly expressed in both fibrillar collagen conditions.
Many of the genes related to the cytoskeleton and cell mechanics also tended to be more highly expressed in the 2DC condition. This included several genes involved in the regulation of the actin cytoskeleton (FLNC, TPM2, FLNB, TAGLN), which help to support cell shape, contractility, and migration [58]. Genes that showed higher expression in 3D and may contribute to the regulation of cell shape and motility in this condition included TIAM1, TUBA4A, and MYLIP.
In the cell cycle, proliferation and apoptosis category, genes that were more highly expressed in fibrillar conditions were primarily related to the promotion of cell survival (FOS, PIM1, and BCL2) [59,60]. Key cell cycle regulators, such as cyclins, CDKs, checkpoints and phosphatases, were more highly expressed in the 2DC condition. Many genes related to growth factor and cytokine signaling were also differentially expressed between 2D and 3D conditions. Genes involved in regenerative and developmental signaling were found to be more highly expressed in 3D, while genes with roles in fibrotic and inflammatory signaling were more highly expressed in 2D.
4. Discussion
The phenotypic responses of corneal keratocytes to their extracellular environment have been extensively studied in vitro. These previous studies primarily used 2D culture systems, despite keratocytes residing in a complex 3D fibrillar matrix in vivo. ECM dimensionality (3D vs. 2D) and structure (fibrillar vs. non-fibrillar) have been shown to significantly impact cellular morphology, cytoskeletal organization, and cell mechanics; however, the underlying transcriptional changes are not well understood [61,62,63]. In this study, we compared bulk RNA-seq profiles of keratocytes cultured under three conditions: 2D collagen-coated substrates (2DC), 2D fibrillar collagen (2DF), and 3D fibrillar collagen (3DF) to identify transcriptional changes driven by ECM dimensionality and structure.
In serum-free culture, normal rabbit keratocytes (NRKs) are known to express common keratocyte markers and are typically characterized as being mechanically quiescent. In this study, we were able to capture significant differences in gene expression between NRKs cultured in SF media on rigid 2D collagen-coated substrates, on 2D fibrillar collagen matrices, and within 3D fibrillar collagen matrices. These results suggest that even in the “quiescent” state that is characteristic of serum-free culture and normal in vivo conditions, these cells are still actively sensing and responding to biophysical cues from the extracellular environment on a transcriptional level.
By comparing cells in a 3D fibrillar collagen environment to those on a rigid collagen-coated surface (3DF vs. 2DC), we were able to capture the mixed effects of ECM dimensionality, structure, and stiffness on keratocyte gene expression. Comparing cells in 3D to those on top of fibrillar collagen matrices (3DF vs. 2DF) helped to further isolate dimensionality-driven transcriptional changes because the cells were exposed to the same fibrillar collagen cues (i.e., matrix structure and stiffness is matched), leaving dimensionality as the main variable. Lastly, the comparison of cells cultured on top of fibrillar collagen matrices to those on collagen-coated surfaces (2DF vs. 2DC) helped isolate the effects of matrix structure by comparing a 2D fibrillar collagen environment to a non-fibrillar collagen coating.
From these comparisons, two principal gene-expression signatures emerged: dimensionality-dependent (3D vs. 2D) and structure-dependent (fibrillar vs. non-fibrillar). Dimensionality-dependent transcriptional regulation was defined by genes consistently differentially expressed in both 3DF vs. 2DC and 3DF vs. 2DF. Upregulated genes in these comparisons were primarily involved in ECM remodeling, metabolic adaptation, and stress/survival signaling. In contrast, downregulated genes encompassed many core cell-cycle regulators (cyclins, CDKs, MCMs, checkpoint genes), and genes related to the cytoskeleton, cell contractility, cell-cell interactions, and ECM synthesis. Together with their related signaling pathways, these DEGs indicate that embedding keratocytes in 3D broadly reinforces a quiescent, non-proliferative transcriptional state. Dimensionality driven changes in cell phenotype have previously been demonstrated in studies of corneal keratocytes [33]. Previous work has shown that keratocytes maintain a more native morphology and pattern of ECM deposition when cultured in 3D matrices. For example, Thompson et al. observed that rabbit corneal keratocytes in 3D collagen matrices downregulate wound-healing related responses compared to cells on 2D surfaces [20]. In addition, human corneal stromal stem cells grown in 3D scaffolds showed upregulation of keratocyte marker genes (KERA, LUM, ALDH3A1, etc.) relative to 2D conditions [64].
Structure-dependent regulation was defined by genes consistently differentially expressed in both 3DF vs. 2DC and 2DF vs. 2DC, highlighting transcriptional responses to fibrillar ECM regardless of if the cells were in a 2D or 3D environment. Upregulated genes pointed to altered cell-ECM interactions (integrin subunits and syndecans) and survival signaling (HGF, VEGFA, BCL2). Genes that appeared to be downregulated in response to fibrillar ECM included basement membrane collagens (COL4A1-5), laminins, fibronectin (FN1), tenascin-C (TNC), and proliferation-associated growth factors (FGF1, PDGFB, IGF1). Across both 2DF and 3DF conditions, keratocytes also consistently downregulated nearly all core cell cycle drivers, including cyclins (CCNA2, CCNB1/2, CCNE2), CDK1, replication factors (MCMs, CDC6, CDC45), and spindle checkpoint regulators (BUB1, BUB1B, CDC20, ESPL1) as compared to the 2DC condition. This pattern suggests that fibrillar ECM is the primary signal involved in the suppression of cell cycle gene expression, while 3D culture further reinforces this quiescent transcriptional profile. This finding aligns with the physiological behavior of corneal keratocytes, which are non-proliferative in the uninjured cornea [37]. Overall, these observed trends in differential gene expression suggest that cells exposed to fibrillar ECM suppress proliferation and ECM synthesis pathways while reinforcing cell adhesion and survival signaling.
In general, the transcriptional changes in 3D and fibrillar contexts compared to rigid 2D culture appear to align well with the quiescent state of stromal keratocytes observed in vivo. Across all conditions, classical markers of quiescent keratocytes (KERA, LUM, ALDH1A1) remained robustly expressed, with the highest relative expression levels often seen in the 3DF condition. In contrast, markers of stromal cell activation (ACTA2, POSTN, TAGLN, FN1) exhibited the lowest levels in 3DF, reinforcing that embedding keratocytes in 3D fibrillar ECM produces a transcriptional profile that reflects a more quiescent phenotype. These observations are consistent with prior studies of corneal keratocyte behavior that showed reduced activation when cells were cultured in more biomimetic matrices [65]. These patterns of gene expression also align well with recent single-cell RNA-seq (scRNA-seq) findings from our lab [66]. Many of the genes that were upregulated in 3D culture appear to coincide with genes that were highly expressed in scRNA-seq clusters of quiescent keratocytes from normal rabbit corneas, whereas genes that were downregulated in 3D corresponded to those that had higher expression in scRNA-seq clusters of migratory and proliferative fibroblasts from corneas undergoing wound repair.
Although several markers of stromal cell activation and fibrosis were observed to be differentially expressed across our ECM conditions, these genes showed low levels of expression overall due to this study being limited to serum-free culture. Future experiments incorporating common pro-inflammatory growth factors such as PDGF and TGFβ could be used to determine the extent to which 3D and fibrillar ECM is able to suppress the expression of these markers. Exploring transcriptional differences due to fibrillar ECM using the 2DF and 2DC conditions also presents a potential limitation of the current study, as these results may be confounded by the difference in stiffness between these two conditions. However, previous studies have demonstrated that NRKs in SF culture are mechanically quiescent and do not show significant phenotypic differences when cultured on 2D substrates of different stiffnesses [67].
5. Conclusions
This research provides new insights into the transcriptional differences underlying changes in phenotype observed between keratocytes in 2D and 3D culture. In general, 3D and fibrillar ECM environments appear to impose transcriptional changes that lead to widespread suppression of proliferation and ECM synthesis, while enhancing adhesion, mechanosensory, and survival signaling. The results of this study may help inform in vitro model selection when studying cell response to additional biochemical and biophysical cues, or when testing therapeutics, as cell response is likely to differ in 2D and 3D culture.
Supplementary Materials
The following supporting information can be downloaded at: https://www.mdpi.com/article/doi/s1, Figure S1; Figure S2.
Author Contributions
Conceptualization, K.P.A., M.M.-M. and W.M.P.; methodology, K.P.A., M.M.-M. and W.M.P.; validation, K.P.A.; formal analysis, K.P.A. and W.M.P.; investigation, K.P.A.; data curation, K.P.A.; writing—original draft preparation, K.P.A.; writing—review and editing, K.P.A. and W.M.P.; visualization, K.P.A.; supervision, W.M.P.; project administration, W.M.P.; funding acquisition, W.M.P. All authors have read and agreed to the published version of the manuscript.
Funding
This research was funded by the National Institutes of Health, grant numbers R01 EY013322 and P30 EY030413, and a Challenge Grant from Research to Prevent Blindness.
Institutional Review Board Statement
Not applicable.
Informed Consent Statement
Not applicable.
Data Availability Statement
The original data presented in this study are openly available in NCBI’s Gene Expression Omnibus via the GEO series accession number (will be provided prior to publication).
Conflicts of Interest
The authors declare no conflicts of interest.
Abbreviations
The following abbreviations are used in this manuscript:
| 2D | Two-dimensional |
| 3D | Three-dimensional |
| ECM | Extracellular matrix |
| RNA-seq | RNA sequencing |
| NRK | Normal rabbit keratocyte |
| SF | Serum-free |
| DMEM | Dulbecco’s modified eagle’s medium |
| 2DC | 2D collagen-coated |
| 2DF | 2D fibrillar collagen |
| 3DF | 3D fibrillar collagen |
| PBS | Phosphate-buffered saline |
| PCA | Principal component analysis |
| FPKM | Fragments per kilobase of transcript per million fragments mapped |
| DEG | Differentially expressed gene |
| KEGG | Kyoto encyclopedia of genes and genomes |
References
- Duval, K.; Grover, H.; Han, L.-H.; Mou, Y.; Pegoraro, A.F.; Fredberg, J.; Chen, Z. Modeling Physiological Events in 2D vs. 3D Cell Culture. Physiology 2017, 32, 266–277. [Google Scholar] [CrossRef] [PubMed]
- Burkel, B.; et al. Preparation of 3D Collagen Gels and Microchannels for the Study of 3D Interactions In Vivo. J. Vis. Exp. 2016, 111. [Google Scholar]
- Fennema, E.; Rivron, N.; Rouwkema, J.; van Blitterswijk, C.; de Boer, J. Spheroid culture as a tool for creating 3D complex tissues. Trends Biotechnol. 2013, 31, 108–115. [Google Scholar] [CrossRef] [PubMed]
- Jensen, C.; Teng, Y. Is It Time to Start Transitioning From 2D to 3D Cell Culture? Front. Mol. Biosci. 2020, 7, 33. [Google Scholar] [CrossRef] [PubMed]
- Baker, B.M.; Chen, C.S. Deconstructing the third dimension – how 3D culture microenvironments alter cellular cues. J. Cell Sci. 2012, 125, 3015–3024. [Google Scholar] [CrossRef] [PubMed]
- Cukierman, E.; Pankov, R.; Yamada, K.M. Cell interactions with three-dimensional matrices. Curr. Opin. Cell Biol. 2002, 14, 633–640. [Google Scholar] [CrossRef] [PubMed]
- Petroll, W.M.; Miron-Mendoza, M. Mechanical interactions and crosstalk between corneal keratocytes and the extracellular matrix. Exp. Eye Res. 2015, 133, 49–57. [Google Scholar] [CrossRef] [PubMed]
- Kapałczyńska, M.; Kolenda, T.; Przybyła, W.; Zajączkowska, M.; Teresiak, A.; Filas, V.; Ibbs, M.; Bliźniak, R.; Łuczewski, L.; Lamperska, K. 2D and 3D cell cultures—A comparison of different types of cancer cell cultures. Arch. Med. Sci. 2018, 14, 910–919. [Google Scholar] [CrossRef] [PubMed]
- Fontoura, J.C.; Viezzer, C.; dos Santos, F.G.; Ligabue, R.A.; Weinlich, R.; Puga, R.D.; Antonow, D.; Severino, P.; Bonorino, C. Comparison of 2D and 3D cell culture models for cell growth, gene expression and drug resistance. Mater. Sci. Eng. C 2020, 107, 110264. [Google Scholar] [CrossRef] [PubMed]
- Abbas, Z.N.; Al-Saffar, A.Z.; Jasim, S.M.; Sulaiman, G.M. Comparative analysis between 2D and 3D colorectal cancer culture models for insights into cellular morphological and transcriptomic variations. Sci. Rep. 2023, 13, 1–16. [Google Scholar] [CrossRef] [PubMed]
- Chambers, K.F.; Mosaad, E.M.O.; Russell, P.J.; Clements, J.A.; Doran, M.R. 3D Cultures of Prostate Cancer Cells Cultured in a Novel High-Throughput Culture Platform Are More Resistant to Chemotherapeutics Compared to Cells Cultured in Monolayer. PLoS ONE 2014, 9, e111029–e111029. [Google Scholar] [CrossRef] [PubMed]
- Breslin, S.; O’dRiscoll, L. Three-dimensional cell culture: the missing link in drug discovery. Drug Discov. Today 2013, 18, 240–249. [Google Scholar] [CrossRef] [PubMed]
- Chitcholtan, K.; Asselin, E.; Parent, S.; Sykes, P.H.; Evans, J.J. Differences in growth properties of endometrial cancer in three dimensional (3D) culture and 2D cell monolayer. Exp. Cell Res. 2013, 319, 75–87. [Google Scholar] [CrossRef] [PubMed]
- Barbone, D.; Van Dam, L.; Follo, C.; Jithesh, P.V.; Zhang, S.-D.; Richards, W.G.; Bueno, R.; Fennell, D.A.; Broaddus, V.C. Analysis of Gene Expression in 3D Spheroids Highlights a Survival Role for ASS1 in Mesothelioma. PLoS ONE 2016, 11, e0150044. [Google Scholar] [CrossRef] [PubMed]
- Arutyunyan, I.V.; et al. Gene Expression Profile of 3D Spheroids in Comparison with 2D Cell Cultures and Tissue Strains of Diffuse High-Grade Gliomas. Bull. Exp. Biol. Med. 2023, 175(4), 576–584. [Google Scholar] [CrossRef] [PubMed]
- Birgersdotter, A.; Sandberg, R.; Ernberg, I. Gene expression perturbation in vitro—A growing case for three-dimensional (3D) culture systems. Semin. Cancer Biol. 2005, 15, 405–412. [Google Scholar] [CrossRef] [PubMed]
- Jia, W.; et al. Effects of three-dimensional collagen scaffolds on the expression profiles and biological functions of glioma cells. Int. J. Oncol. 2018, 52(6), 1787–1800. [Google Scholar] [CrossRef] [PubMed]
- Shiju, T.M.; de Oliveira, R.C.; Wilson, S.E. 3D in vitro corneal models: A review of current technologies. Exp. Eye Res. 2020, 200, 108213–108213. [Google Scholar] [CrossRef] [PubMed]
- Prittinen, J.; Zhou, X.; Bano, F.; Backman, L.; Danielson, P. Microstructured collagen films for 3D corneal stroma modelling. Connect. Tissue Res. 2021, 63, 443–452. [Google Scholar] [CrossRef] [PubMed]
- Thompson, R.E.; Boraas, L.C.; Sowder, M.; Bechtel, M.K.; Orwin, E.J. Three-Dimensional Cell Culture Environment Promotes Partial Recovery of the Native Corneal Keratocyte Phenotype from a Subcultured Population. Tissue Eng. Part A 2013, 19, 1564–1572. [Google Scholar] [CrossRef] [PubMed]
- Fini, M. Keratocyte and fibroblast phenotypes in the repairing cornea. Prog. Retin. Eye Res. 1999, 18, 529–551. [Google Scholar] [CrossRef] [PubMed]
- Meek, K.M. Corneal collagen—its role in maintaining corneal shape and transparency. Biophys. Rev. 2009, 1, 83–93. [Google Scholar] [CrossRef] [PubMed]
- Imanishi, J.; Kamiyama, K.; Iguchi, I.; Kita, M.; Sotozono, C.; Kinoshita, S. Growth factors: importance in wound healing and maintenance of transparency of the cornea. Prog. Retin. Eye Res. 2000, 19, 113–129. [Google Scholar] [CrossRef] [PubMed]
- Wilson, S.E.; et al. The corneal wound healing response: cytokine-mediated interaction of the epithelium, stroma, and inflammatory cells. Prog. Retin Eye Res. 2001, 20(5), 625–37. [Google Scholar] [PubMed]
- Petroll, W.M.; Kivanany, P.B.; Hagenasr, D.; Graham, E.K. Corneal Fibroblast Migration Patterns During Intrastromal Wound Healing Correlate With ECM Structure and Alignment. Investig. Opthalmology Vis. Sci. 2015, 56, 7352–7361. [Google Scholar] [CrossRef] [PubMed]
- Myrna, K.E.; Pot, S.A.; Murphy, C.J. Meet the corneal myofibroblast: the role of myofibroblast transformation in corneal wound healing and pathology. Vet. Ophthalmol. 2009, 12 Suppl 1(Suppl 1), 25–7. [Google Scholar] [CrossRef] [PubMed]
- Wilson, S.E. Corneal myofibroblast biology and pathobiology: Generation, persistence, and transparency. Exp. Eye Res. 2012, 99, 78–88. [Google Scholar] [CrossRef] [PubMed]
- Poole, K.; Iyer, K.S.; Schmidtke, D.W.; Petroll, W.M.; Varner, V.D. Corneal Keratocytes, Fibroblasts, and Myofibroblasts Exhibit Distinct Transcriptional Profiles In Vitro. Investig. Opthalmology Vis. Sci. 2025, 66, 28. [Google Scholar] [CrossRef] [PubMed]
- Kumar, R.; Tripathi, R.; Sinha, N.R.; Mohan, R.R. Transcriptomic landscape of quiescent and proliferating human corneal stromal fibroblasts. Exp. Eye Res. 2024, 248, 110073–110073. [Google Scholar] [CrossRef] [PubMed]
- Kumar, R.; Tripathi, R.; Sinha, N.R.; Mohan, R.R. RNA-Seq Analysis Unraveling Novel Genes and Pathways Influencing Corneal Wound Healing. Investig. Opthalmology Vis. Sci. 2024, 65, 13–13. [Google Scholar] [CrossRef] [PubMed]
- Maruri, D.P.; Iyer, K.S.; Schmidtke, D.W.; Petroll, W.M.; Varner, V.D. Signaling Downstream of Focal Adhesions Regulates Stiffness-Dependent Differences in the TGF-β1-Mediated Myofibroblast Differentiation of Corneal Keratocytes. Front. Cell Dev. Biol. 2022, 10, 886759. [Google Scholar] [CrossRef] [PubMed]
- Jester, J.V.; Barry-Lane, P.A.B.; Cavanagh, H.D.M.; Petroll, W.M. Induction of ??-Smooth Muscle Actin Expression and Myofibroblast Transformation in Cultured Corneal Keratocytes. Cornea 1996, 15, 505???516–16. [Google Scholar] [CrossRef]
- Lakshman, N.; Kim, A.; Petroll, W.M. Characterization of corneal keratocyte morphology and mechanical activity within 3-D collagen matrices. Exp. Eye Res. 2010, 90, 350–359. [Google Scholar] [CrossRef] [PubMed]
- Jester, J.V.; Ho-Chang, J. Modulation of cultured corneal keratocyte phenotype by growth factors/cytokines control in vitro contractility and extracellular matrix contraction. Exp. Eye Res. 2003, 77, 581–592. [Google Scholar] [CrossRef] [PubMed]
- Jester, J.V. Corneal crystallins and the development of cellular transparency. Semin. Cell Dev. Biol. 2008, 19, 82–93. [Google Scholar] [CrossRef] [PubMed]
- Meek, K.M.; Knupp, C. Corneal structure and transparency. Prog. Retin Eye Res. 2015, 49, 1–16. [Google Scholar] [CrossRef] [PubMed]
- Zieske, J.D.; Guimarães, S.R.; Hutcheon, A.E. Kinetics of Keratocyte Proliferation in Response to Epithelial Debridement. Exp. Eye Res. 2001, 72, 33–39. [Google Scholar] [CrossRef] [PubMed]
- Scholzen, T.; Gerdes, J. The Ki-67 protein: From the known and the unknown. J. Cell. Physiol. 2000, 182(3), 311–322. [Google Scholar] [CrossRef] [PubMed]
- binte M. Yusoff, N.Z.; et al. Isolation and Propagation of Human Corneal Stromal Keratocytes for Tissue Engineering and Cell Therapy. Cells 2022, 11(1), 178. [Google Scholar] [CrossRef] [PubMed]
- Gan, L.; Fagerholm, P.; Ekenbark, S. Expression of proliferating cell nuclear antigen in corneas kept in long term culture. Acta Ophthalmol. Scand. 1998, 76, 308–313. [Google Scholar] [CrossRef] [PubMed]
- Funderburgh, J.L.; Funderburgh, M.L.; Mann, M.M.; Corpuz, L.; Roth, M.R. Proteoglycan Expression during Transforming Growth Factor β-induced Keratocyte-Myofibroblast Transdifferentiation. J. Biol. Chem. 2001, 276, 44173–44178. [Google Scholar] [CrossRef] [PubMed]
- Funderburgh, J.L.; Mann, M.M.; Funderburgh, M.L. Keratocyte phenotype mediates proteoglycan structure: a role for fibroblasts in corneal fibrosis. J. Biol. Chem. 2003, 278(46), 45629–37. [Google Scholar] [PubMed]
- Sumioka, T.; Matsumoto, K.-I.; Reinach, P.S.; Saika, S. Tenascins and osteopontin in biological response in cornea. Ocul. Surf. 2023, 29, 131–149. [Google Scholar] [CrossRef] [PubMed]
- Kamil, S.; Mohan, R.R. Corneal stromal wound healing: Major regulators and therapeutic targets. Ocul. Surf. 2020, 19, 290–306. [Google Scholar] [CrossRef] [PubMed]
- Saika, S.; Yamanaka, O.; Okada, Y.; Sumioka, T. Modulation of Smad signaling by non-TGFβ components in myofibroblast generation during wound healing in corneal stroma. Exp. Eye Res. 2016, 142, 40–48. [Google Scholar] [CrossRef] [PubMed]
- Massoudi, D.; Malecaze, F.; Galiacy, S.D. Collagens and proteoglycans of the cornea: importance in transparency and visual disorders. Cell Tissue Res. 2015, 363, 337–349. [Google Scholar] [CrossRef] [PubMed]
- Jester, J.V.; Petroll, W.; Cavanagh, H. Corneal stromal wound healing in refractive surgery: the role of myofibroblasts. Prog. Retin. Eye Res. 1999, 18, 311–356. [Google Scholar] [CrossRef] [PubMed]
- Jester, J.V.; Petroll, W.M.; A Barry, P.; Cavanagh, H.D. Expression of alpha-smooth muscle (alpha-SM) actin during corneal stromal wound healing. Investig. Ophthalmol. Vis. Sci. 1995, 36, 809–19. [Google Scholar]
- Jester, J.V.; A Barry, P.; Lind, G.J.; Petroll, W.M.; Garana, R.; Cavanagh, H.D. Corneal keratocytes: in situ and in vitro organization of cytoskeletal contractile proteins. 1994, 35, 730–43. [Google Scholar] [PubMed]
- Jester, J.V.; Huang, J.; Petroll, W.M.; Cavanagh, H.D. TGFβ Induced Myofibroblast Differentiation of Rabbit Keratocytes Requires Synergistic TGFβ, PDGF and Integrin Signaling. Exp. Eye Res. 2002, 75, 645–657. [Google Scholar] [CrossRef] [PubMed]
- Jester, J.; Rodrigues, M.; Herman, I. Characterization of Avascular Corneal Wound-Healing Fibroblasts - New Insights into the Myofibroblast. Am. J. Pathol. 1987, 127, 140–148. [Google Scholar] [PubMed]
- Chaurasia, S.S.; Kaur, H.; de Medeiros, F.W.; Smith, S.D.; Wilson, S.E. Dynamics of the expression of intermediate filaments vimentin and desmin during myofibroblast differentiation after corneal injury. Exp. Eye Res. 2009, 89, 133–139. [Google Scholar] [CrossRef] [PubMed]
- Wilson, S.E.; Torricelli, A.A.; Marino, G.K. Corneal epithelial basement membrane: Structure, function and regeneration. Exp. Eye Res. 2020, 194, 108002–108002. [Google Scholar] [CrossRef] [PubMed]
- Santhanam, A.; Torricelli, A.A.M.; Wu, J.; Marino, G.K.; Wilson, S.E. Differential expression of epithelial basement membrane components nidogens and perlecan in corneal stromal cells in vitro. Mol. Vis. 2015, 21, 1318–1327. [Google Scholar] [PubMed]
- Soo, C.; Hu, F.-Y.; Zhang, X.; Wang, Y.; Beanes, S.R.; Lorenz, H.P.; Hedrick, M.H.; Mackool, R.J.; Plaas, A.; Kim, S.-J.; et al. Differential Expression of Fibromodulin, a Transforming Growth Factor-β Modulator, in Fetal Skin Development and Scarless Repair. Am. J. Pathol. 2000, 157, 423–433. [Google Scholar] [CrossRef] [PubMed]
- Lahav, J. The functions of thrombospondin and its involvement in physiology and pathophysiology. Biochim. Et. Biophys. Acta (BBA) -Mol. Basis Dis. 1993, 1182, 1–14. [Google Scholar] [CrossRef] [PubMed]
- Zhou, C.; Petroll, W.M. MMP regulation of corneal keratocyte motility and mechanics in 3-D collagen matrices. Exp. Eye Res. 2014, 121, 147–160. [Google Scholar] [CrossRef] [PubMed]
- Prunotto, M.; Bruschi, M.; Gunning, P.; Gabbiani, G.; Weibel, F.; Ghiggeri, G.M.; Petretto, A.; Scaloni, A.; Bonello, T.; Schevzov, G.; et al. Stable incorporation of α-smooth muscle actin into stress fibers is dependent on specific tropomyosin isoforms. Cytoskeleton 2015, 72, 257–267. [Google Scholar] [CrossRef] [PubMed]
- Ruvolo, P.; Deng, X.; May, W. Phosphorylation of Bcl2 and regulation of apoptosis. Leukemia 2001, 15, 515–522. [Google Scholar] [CrossRef] [PubMed]
- Reed, J. Bcl-2 and the regulation of programmed cell death. J. Cell Biol. 1994, 124, 1–6. [Google Scholar] [CrossRef] [PubMed]
- Lakshman, N.; Petroll, W.M. Growth Factor Regulation of Corneal Keratocyte Mechanical Phenotypes in 3-D Collagen Matrices. Investig. Opthalmology Vis. Sci. 2012, 53, 1077–86. [Google Scholar] [CrossRef] [PubMed]
- Petroll, W.M.; Varner, V.D.; Schmidtke, D.W. Keratocyte mechanobiology. Exp. Eye Res. 2020, 200, 108228–108228. [Google Scholar] [CrossRef] [PubMed]
- Petroll, W.M.; Ma, L. Direct, dynamic assessment of cell-matrix interactions inside fibrillar collagen lattices. Cell Motil. Cytoskelet. 2003, 55, 254–264. [Google Scholar] [CrossRef] [PubMed]
- Ghezzi, C.E.; Marelli, B.; Omenetto, F.G.; Funderburgh, J.L.; Kaplan, D.L. 3D Functional Corneal Stromal Tissue Equivalent Based on Corneal Stromal Stem Cells and Multi-Layered Silk Film Architecture. PLoS ONE 2017, 12, e0169504. [Google Scholar] [CrossRef] [PubMed]
- Kim, A.; Lakshman, N.; Karamichos, D.; Petroll, W.M. Growth Factor Regulation of Corneal Keratocyte Differentiation and Migration in Compressed Collagen Matrices. Investig. Opthalmology Vis. Sci. 2010, 51, 864–875. [Google Scholar] [CrossRef] [PubMed]
- Borner, K.; Yu, Z.; Xing, C.; Petroll, W.M. Single cell RNA-seq characterization of non-fibrotic stromal wound repopulation in the rabbit. Exp. Eye Res. 2025, 264, 110816. [Google Scholar] [CrossRef] [PubMed]
- Maruri, D.P.; Miron-Mendoza, M.; Kivanany, P.B.; Hack, J.M.; Schmidtke, D.W.; Petroll, W.M.; Varner, V.D. ECM Stiffness Controls the Activation and Contractility of Corneal Keratocytes in Response to TGF-β1. Biophys. J. 2020, 119, 1865–1877. [Google Scholar] [CrossRef] [PubMed]
Figure 1.
Corneal keratocytes in serum-free culture adopted distinct morphologies and transcriptional profiles in 2D and 3D environments. (A) Representative confocal images of keratocytes cultured on top of collagen-coated substrates (2DC), on top of fibrillar collagen matrices (2DF), or embedded within fibrillar collagen matrices (3DF). Samples were fixed and labeled for F-actin (green) and DAPI (blue). Scale bar is 50 μm. (B) Principal component analysis (PCA) was performed using normalized, log2-transformed FPKM values. (C) Bar plot displaying the number of significant upregulated (red) and downregulated (blue) differentially expressed genes (DEGs) for pairwise comparisons of the three experimental conditions. DEGs with an adjusted P value ≤ 0.05 and |log2[fold change]| ≥ 1 were considered significant. (D) Heatmap showing the relative expression of each significant DEG (rows) across the three conditions (columns). Relative expression is based on normalized, log2-transformed FPKM values (log2[FPKM+1]). Red color indicates high relative expression and blue color indicates low. The differential gene set includes all DEGs from the pairwise comparisons in (C).
Figure 1.
Corneal keratocytes in serum-free culture adopted distinct morphologies and transcriptional profiles in 2D and 3D environments. (A) Representative confocal images of keratocytes cultured on top of collagen-coated substrates (2DC), on top of fibrillar collagen matrices (2DF), or embedded within fibrillar collagen matrices (3DF). Samples were fixed and labeled for F-actin (green) and DAPI (blue). Scale bar is 50 μm. (B) Principal component analysis (PCA) was performed using normalized, log2-transformed FPKM values. (C) Bar plot displaying the number of significant upregulated (red) and downregulated (blue) differentially expressed genes (DEGs) for pairwise comparisons of the three experimental conditions. DEGs with an adjusted P value ≤ 0.05 and |log2[fold change]| ≥ 1 were considered significant. (D) Heatmap showing the relative expression of each significant DEG (rows) across the three conditions (columns). Relative expression is based on normalized, log2-transformed FPKM values (log2[FPKM+1]). Red color indicates high relative expression and blue color indicates low. The differential gene set includes all DEGs from the pairwise comparisons in (C).
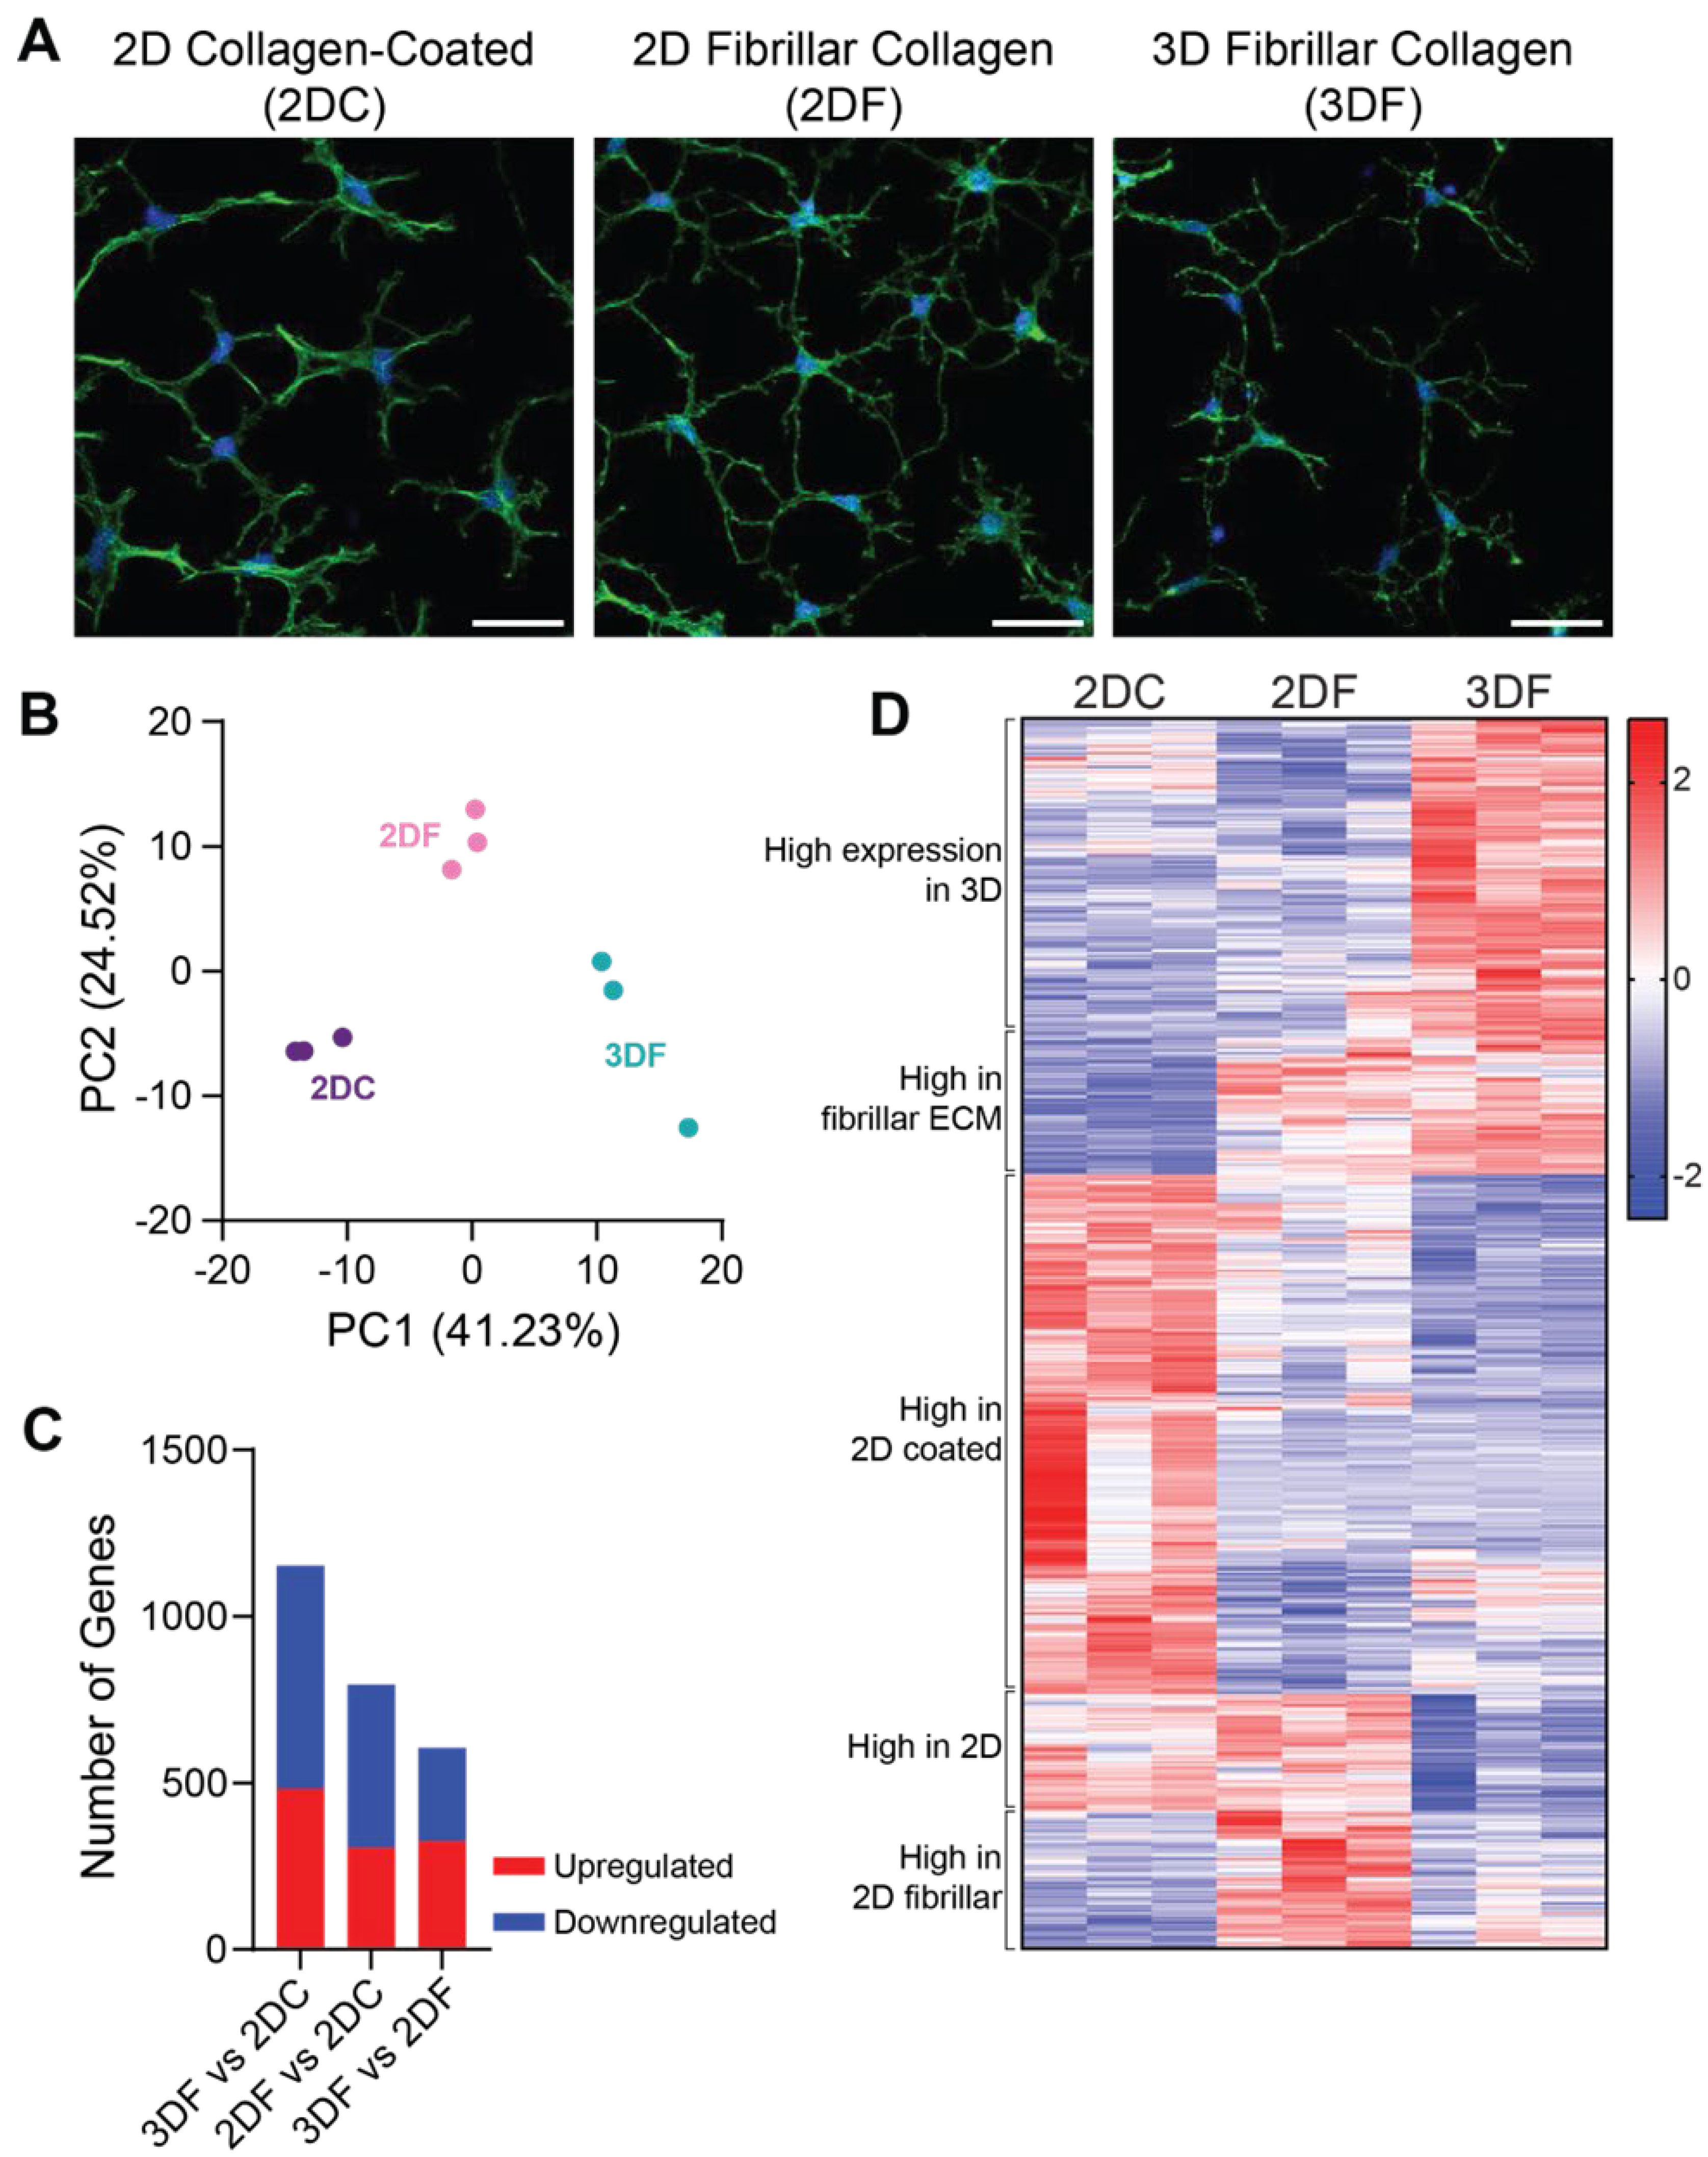
Figure 2.
(A) Principal component analysis (PCA) was performed for all five experimental conditions using normalized, log2-transformed FPKM values. (B) Bar plot displaying the number of significant upregulated (red) and downregulated (blue) differentially expressed genes (DEGs) for each pairwise comparison. DEGs with an adjusted P value ≤ 0.05 and |log2[fold change]| ≥ 1 were considered significant.
Figure 2.
(A) Principal component analysis (PCA) was performed for all five experimental conditions using normalized, log2-transformed FPKM values. (B) Bar plot displaying the number of significant upregulated (red) and downregulated (blue) differentially expressed genes (DEGs) for each pairwise comparison. DEGs with an adjusted P value ≤ 0.05 and |log2[fold change]| ≥ 1 were considered significant.
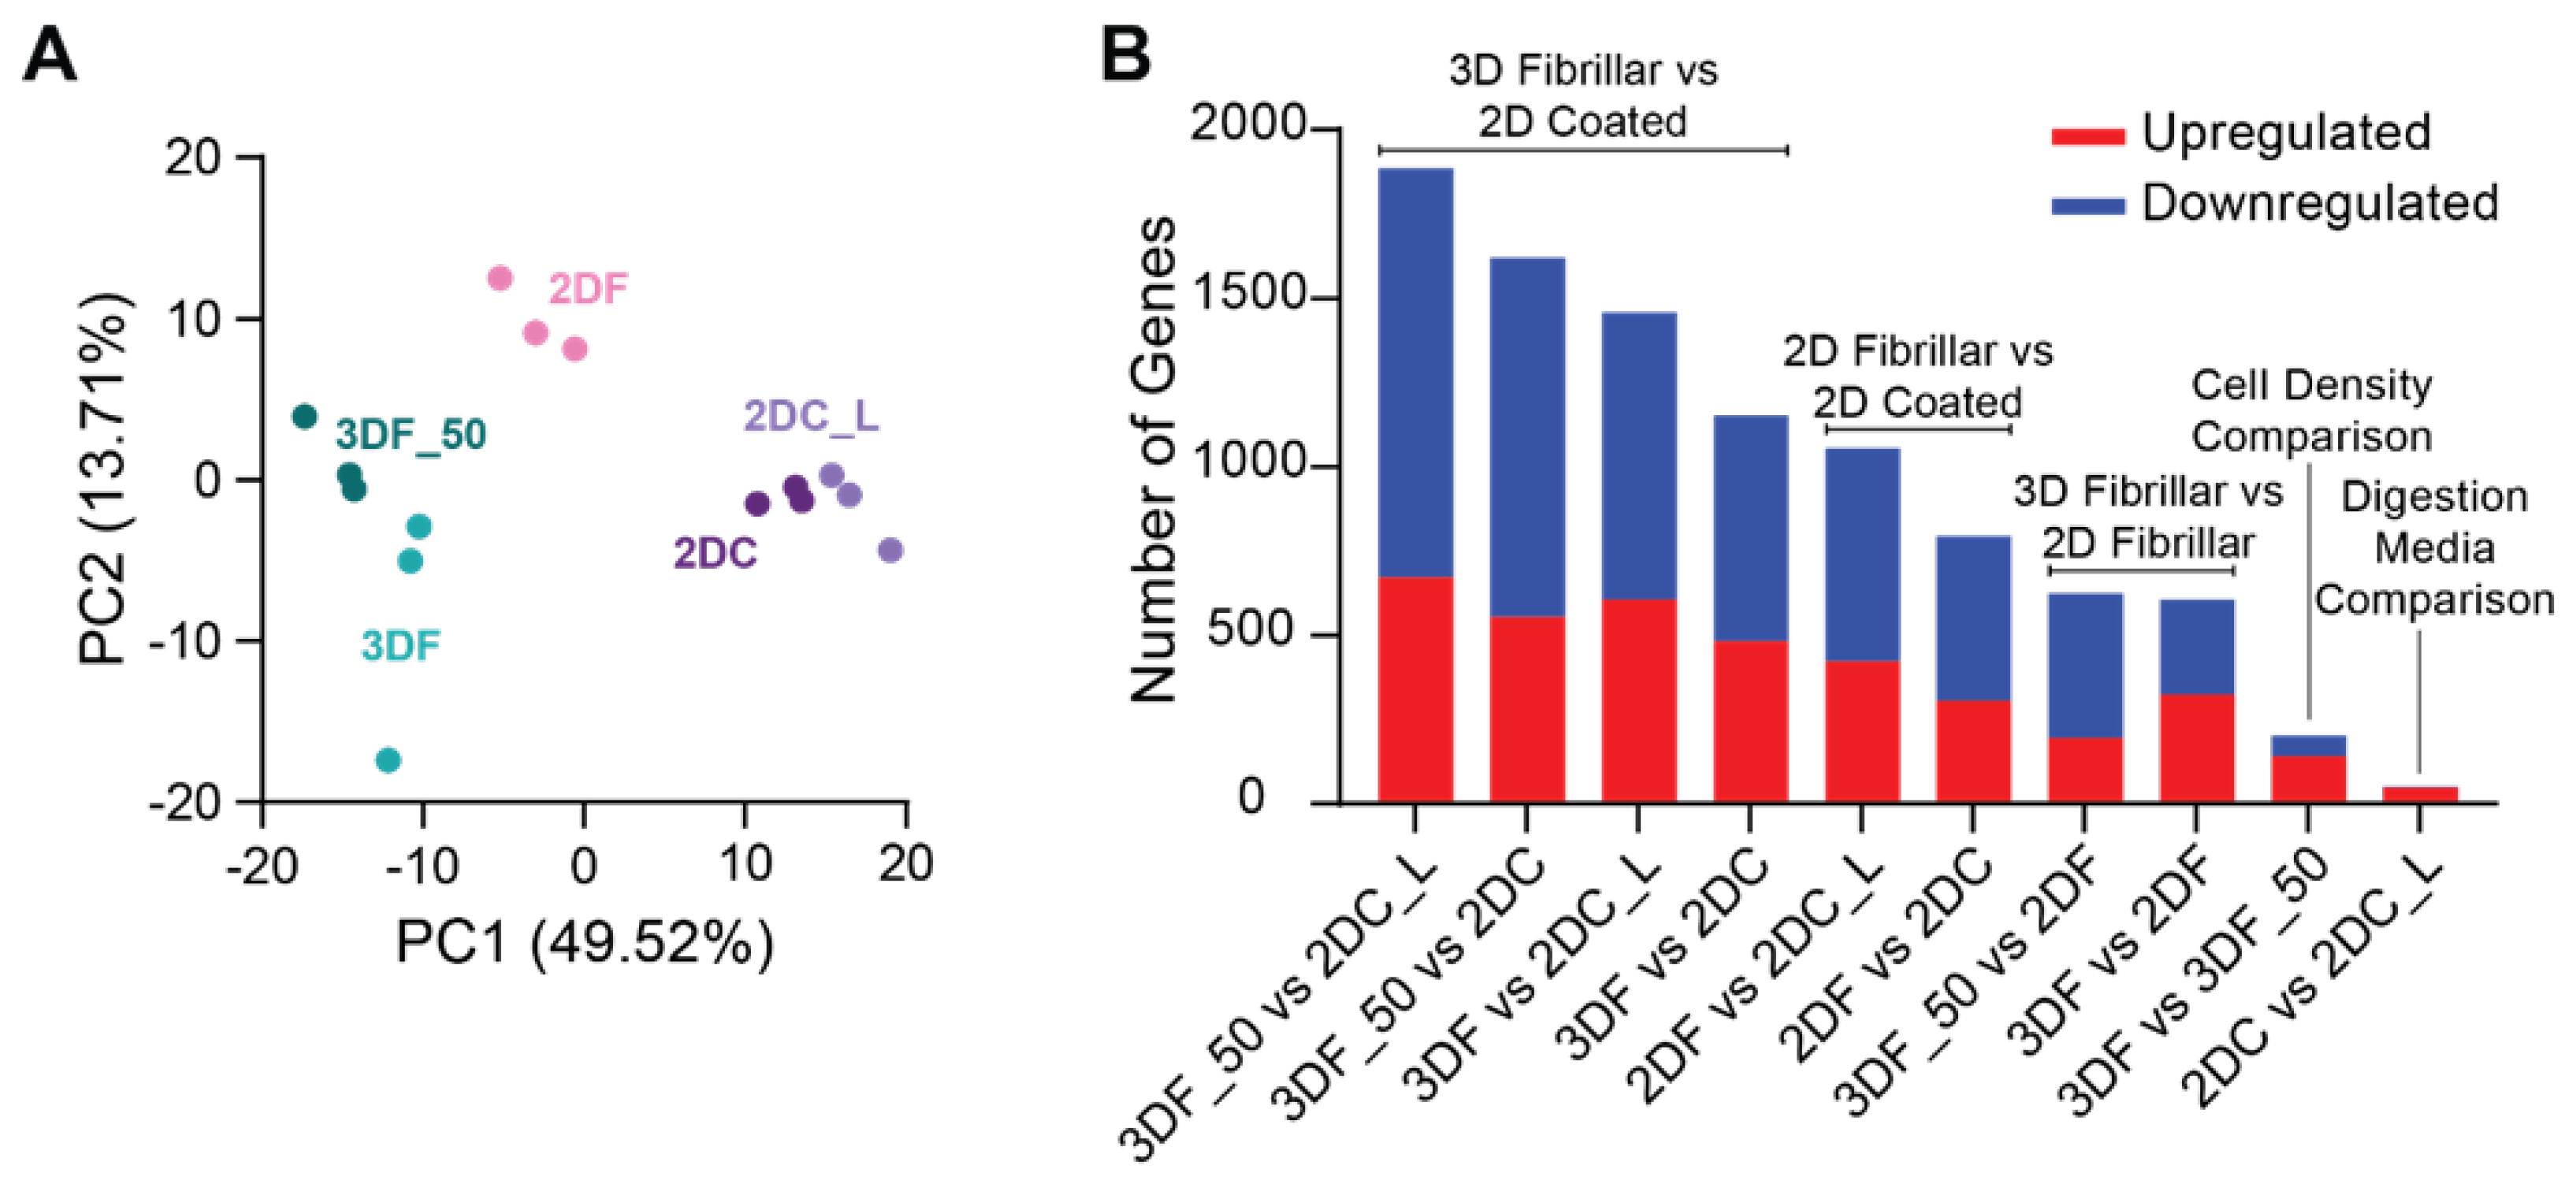
Figure 3.
Gene expression levels in 2DC, 2DF, and 3DF conditions for common markers of quiescent keratocytes (A-C) and activated stromal cells (D-F). Bar plots of average FPKM values for genes encoding (A) proteoglycans, (B) crystallins, and (C) collagens present in the native corneal stroma. (D) Genes associated with cell proliferation. (E) ECM and (F) cytoskeleton related genes that are commonly associated with activated cells and/or fibrosis. Asterisks indicate if a gene was found to be significantly differentially expressed between the two indicated conditions based on differential expression analysis (adjusted P value ≤ 0.05 and |log2[fold change]| ≥ 1).
Figure 3.
Gene expression levels in 2DC, 2DF, and 3DF conditions for common markers of quiescent keratocytes (A-C) and activated stromal cells (D-F). Bar plots of average FPKM values for genes encoding (A) proteoglycans, (B) crystallins, and (C) collagens present in the native corneal stroma. (D) Genes associated with cell proliferation. (E) ECM and (F) cytoskeleton related genes that are commonly associated with activated cells and/or fibrosis. Asterisks indicate if a gene was found to be significantly differentially expressed between the two indicated conditions based on differential expression analysis (adjusted P value ≤ 0.05 and |log2[fold change]| ≥ 1).
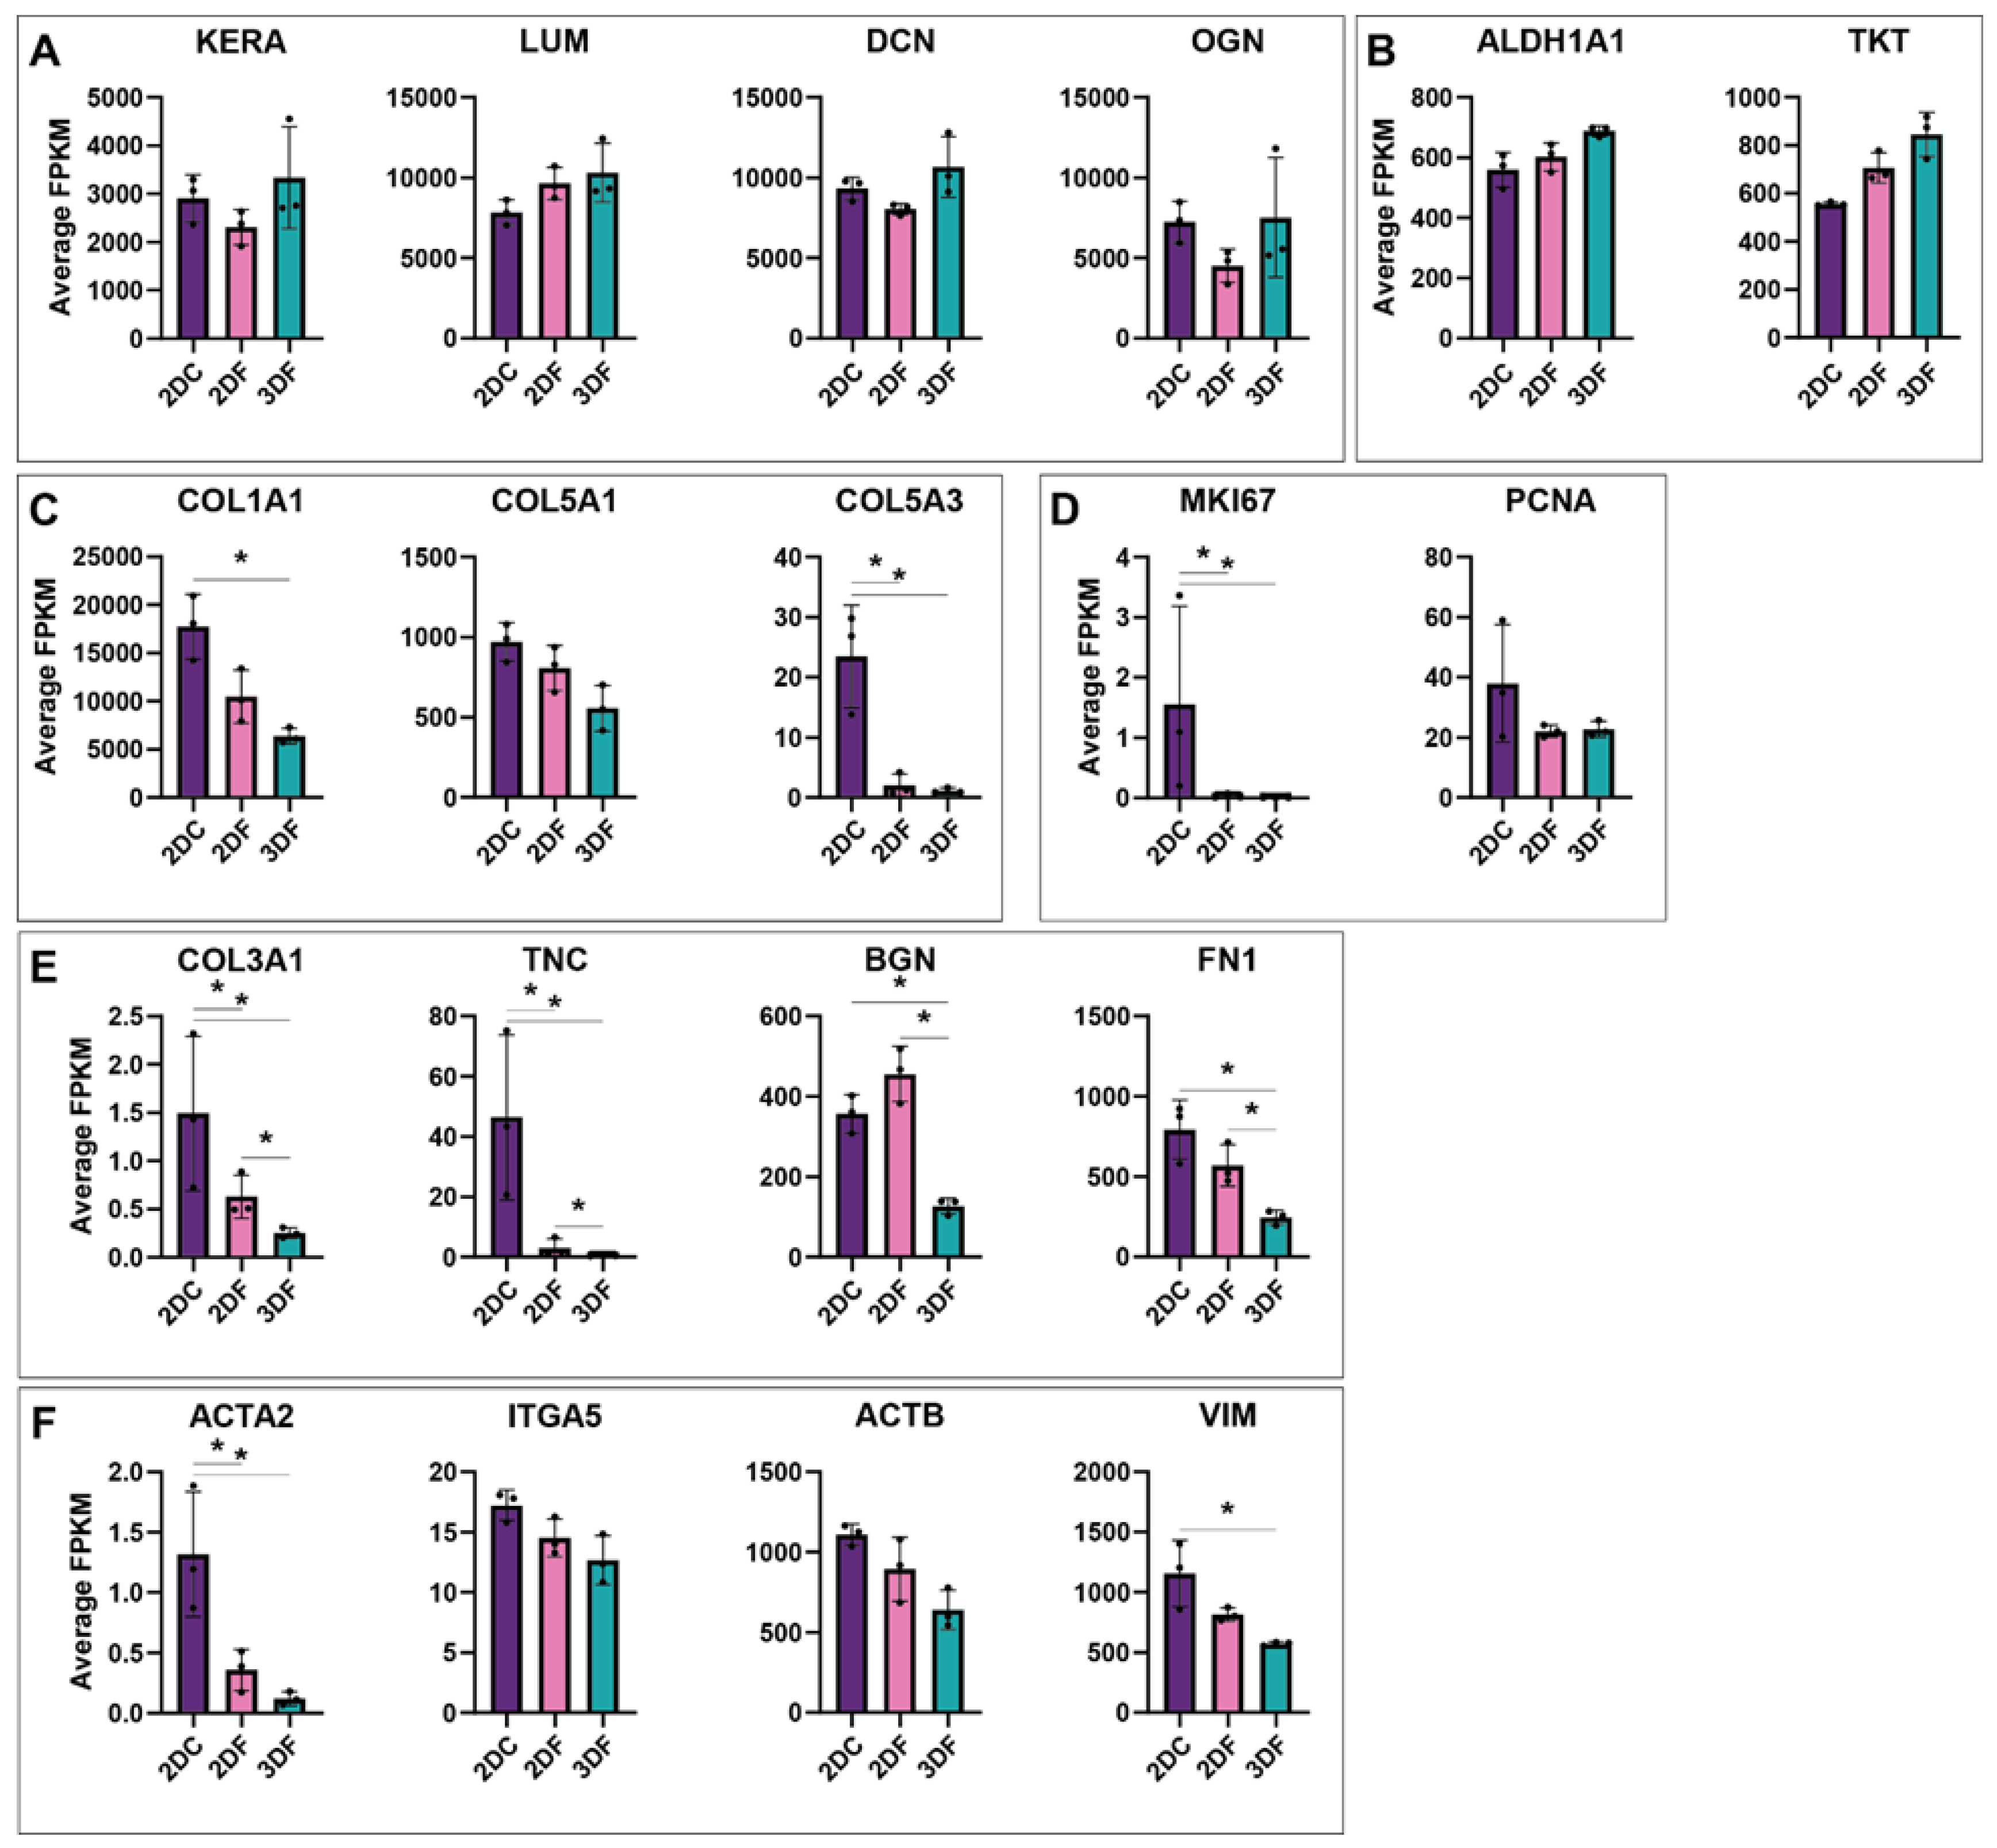
Figure 4.
KEGG enrichment analysis for 3DF vs. 2DC, 2DF vs. 2DC, and 3DF vs. 2DF. Bars represent the number of upregulated (red) or downregulated (blue) genes in each significant pathway shown (adjusted P value < 0.05). Adjusted P values for each pathway are indicated to the right of the bar.
Figure 4.
KEGG enrichment analysis for 3DF vs. 2DC, 2DF vs. 2DC, and 3DF vs. 2DF. Bars represent the number of upregulated (red) or downregulated (blue) genes in each significant pathway shown (adjusted P value < 0.05). Adjusted P values for each pathway are indicated to the right of the bar.
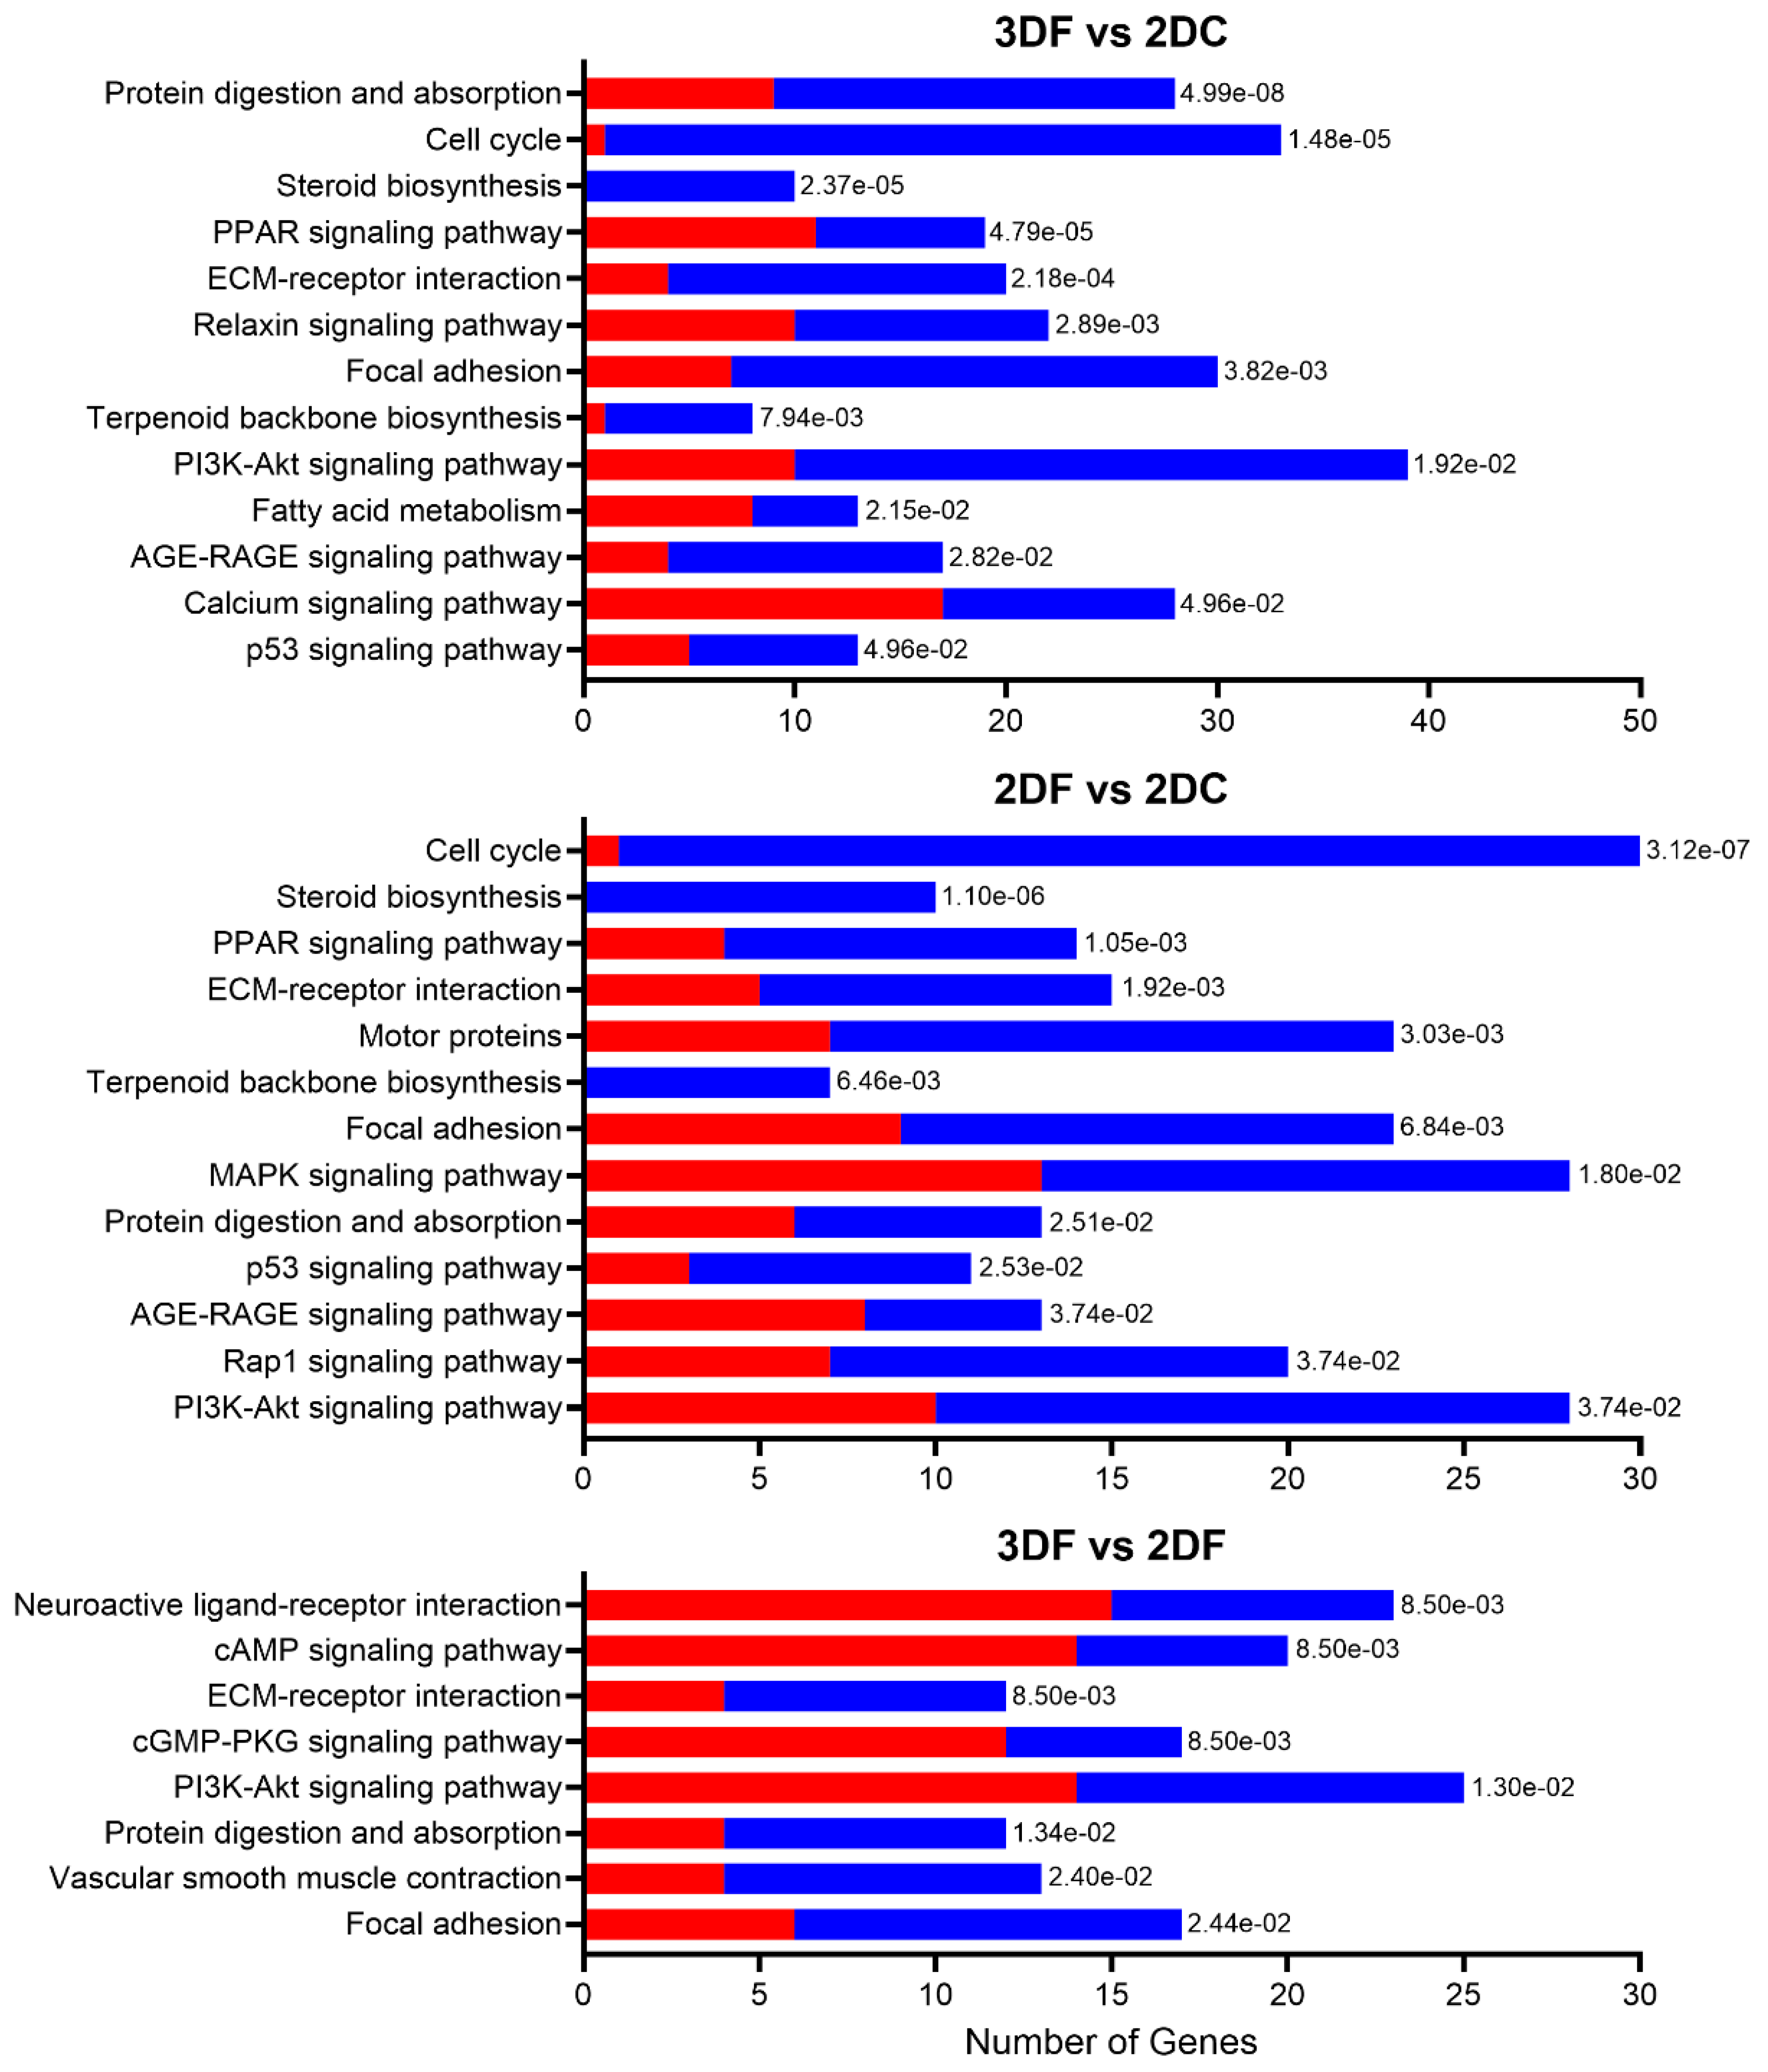
Figure 5.
(A) Venn diagrams showing the number of significant DEGs that were upregulated or downregulated in one or more comparison. Overlapping areas outlined in black represent the sets of genes that were differentially expressed in both 3D vs. 2D comparisons (3DF vs. 2DC and 3DF vs. 2DF). Overlapping areas outlined in white represent the sets of genes that were differentially expressed in both fibrillar vs. non-fibrillar comparisons (2DF vs. 2DC and 3DF vs. 2DC). (B) Heatmaps of normalized, log2-transformed FPKM values for a subset of significant DEGs selected from differential expression and KEGG analyses.
Figure 5.
(A) Venn diagrams showing the number of significant DEGs that were upregulated or downregulated in one or more comparison. Overlapping areas outlined in black represent the sets of genes that were differentially expressed in both 3D vs. 2D comparisons (3DF vs. 2DC and 3DF vs. 2DF). Overlapping areas outlined in white represent the sets of genes that were differentially expressed in both fibrillar vs. non-fibrillar comparisons (2DF vs. 2DC and 3DF vs. 2DC). (B) Heatmaps of normalized, log2-transformed FPKM values for a subset of significant DEGs selected from differential expression and KEGG analyses.
Disclaimer/Publisher’s Note: The statements, opinions and data contained in all publications are solely those of the individual author(s) and contributor(s) and not of MDPI and/or the editor(s). MDPI and/or the editor(s) disclaim responsibility for any injury to people or property resulting from any ideas, methods, instructions or products referred to in the content. |
© 2026 by the authors. Licensee MDPI, Basel, Switzerland. This article is an open access article distributed under the terms and conditions of the Creative Commons Attribution (CC BY) license.
Copyright: This open access article is published under a Creative Commons CC BY 4.0 license, which permit the free download, distribution, and reuse, provided that the author and preprint are cited in any reuse.


