

Submitted:
02 July 2026
Posted:
06 July 2026
You are already at the latest version
Abstract
Coastal regions face accelerating pressure from sea-level rise, shoreline erosion, storm surge, recurrent flooding, salinization, land-use change, and degradation of blue-carbon ecosystems. This review synthesizes literature published primarily from 2020 to 2026 on artificial intelligence (AI), machine learning (ML), deep learning, remote sensing, and geospatial applications for coastal resilience and environmental sustainability. Using a PRISMA-informed selection framework, 867 records were identified, 305 duplicate records were removed, 562 titles and abstracts were screened, 109 reports were sought for retrieval, 36 full-text reports were assessed, and 30 studies were retained in the final synthesis. The review identifies five major domains: shoreline extraction and erosion monitoring; coastal flooding, storm surge, and overtopping risk; mangrove, wetland, and ecosystem monitoring; land-cover change and coastal urbanization; and GIS-based adaptation support. Common methods include Random Forest, XGBoost, convolutional neural networks, U-Net variants, recurrent models, and explainable AI. The findings show that AI is most useful when embedded in transparent, validated, and locally interpretable geospatial workflows that include ground truth, uncertainty communication, governance safeguards, and participatory planning.
Keywords:
artificial intelligence
; machine learning
; remote sensing
; geospatial analytics
; coastal resilience
; shoreline extraction
; flood susceptibility
; mangrove monitoring
; environmental sustainability
; GIS
1. Introduction
Coastal zones are among the world’s most dynamic socio-ecological systems. They concentrate populations, ports, roads, tourism infrastructure, cultural heritage, fisheries, wetlands, mangroves, dunes, beaches, and urban development. These same zones are exposed to sea-level rise, storm surge, tropical cyclones, compound flooding, coastal erosion, saltwater intrusion, habitat loss, and climate-driven extremes. The IPCC Working Group II assessment emphasizes that climate impacts, vulnerability, and adaptation limits are now central questions for ecosystems, biodiversity, and human communities [1]. The Special Report on the Ocean and Cryosphere in a Changing Climate similarly highlights the importance of coastal risk, adaptation, and resilience in low-lying coastal areas and small islands [2].
Environmental sustainability and coastal resilience require timely, spatially explicit, and decision-relevant information. Field surveys remain essential for accurate local measurement, but they are often expensive, episodic, and difficult to scale across long coastlines or rapidly changing hazard conditions. Satellite remote sensing, UAV imagery, LiDAR, field sensors, global digital elevation models, tide gauges, and geospatial data infrastructures now provide repeated observations that can be linked with hydrological, ecological, and socioeconomic information. The challenge is no longer only data availability. It is also the capacity to convert heterogeneous observations into transparent evidence that coastal managers can interpret and use.
AI and ML provide a computational layer for extracting patterns, classifying land and water features, forecasting hydrological events, detecting change, and generating decision-support outputs from large Earth observation archives. In coastal resilience applications, AI can shorten the time between observation and response by automating shoreline extraction, rapid flood mapping, mangrove classification, damage assessment, and susceptibility modeling. It can also support scenario analysis and prioritize adaptation investments when linked with GIS, hydrodynamic modeling, exposure layers, and institutional planning processes.
The literature on AI-enabled coastal sustainability remains fragmented across remote sensing, hydrology, ecology, disaster risk reduction, civil engineering, coastal management, and environmental policy. Recent reviews address coastal boundary extraction [3], open remote sensing data for shoreline detection [4], machine learning for coastal flooding and overtopping [5], mangrove mapping and monitoring [6,7], AI tools for transitional water ecosystems [8], spatial data for coastal community resilience [9], and AI-powered GIS for disaster resilience [10]. These contributions are valuable, yet they often focus on a single method family or application domain. A cross-domain synthesis is needed to connect technical advances with implementation requirements, validation standards, governance, and equity.
This review addresses that need by synthesizing source-verified literature on AI, remote sensing, and geospatial applications for environmental sustainability and coastal resilience from 2020 to 2026, while retaining selected foundational method papers where necessary. The review asks four questions. First, which coastal resilience domains have most actively adopted AI-enabled remote sensing and geospatial analytics? Second, which data sources and model families dominate these applications? Third, what validation, explainability, and uncertainty practices strengthen publication quality and operational trust? Fourth, what research gaps limit the transition from promising case studies to reliable coastal decision-support systems?
2. Materials and Methods
2.1. Review Design and Reporting Position
This manuscript is submitted as a Review article. It uses a PRISMA 2020-informed study-selection framework to improve transparency in the identification, screening, eligibility assessment, and inclusion of sources [11]. The review does not present a quantitative meta-analysis because the included sources vary substantially in sensor type, coastal setting, spatial resolution, temporal coverage, modeling target, and validation metric. The protocol was not prospectively registered. The study-selection logic, eligibility criteria, search-concept blocks, and synthesis domains are therefore reported in the main text to support reproducibility without requiring a Supplementary File.
The review combines structured searching with source authentication. Structured searching was used to identify peer-reviewed literature and official Earth observation documentation relevant to AI-enabled coastal resilience. Source authentication was then used to confirm the bibliographic existence and metadata consistency of cited studies through DOI records, publisher pages, official agency pages, or authoritative repositories. This approach strengthens the reliability of the review while remaining consistent with a narrative and thematic synthesis design.
2.2. Information Sources and Search Strategy
The review scope covered peer-reviewed journal articles, review papers, methodologically relevant conference papers, and official mission or technical documentation for major Earth observation datasets. Searches were conducted across Scopus, Web of Science, IEEE Xplore, ScienceDirect, SpringerLink, and MDPI. The search was updated on 23 June 2026. The primary time window was 2020 to 2026 because the review focuses on recent applications of AI, remote sensing, and GIS. Foundational method papers were retained when they explained methods that remained central to the reviewed literature, such as Random Forest, XGBoost, U-Net, deep learning in remote sensing, and explainable AI.
The search strategy used four concept blocks: AI and analytics; remote sensing and geospatial data; coastal systems; and application outcomes. Searches combined these blocks with Boolean operators. Example search strings included: (“artificial intelligence” OR “machine learning” OR “deep learning” OR CNN OR “U-Net” OR “Random Forest” OR XGBoost OR “explainable AI” OR SHAP) AND (“remote sensing” OR “Earth observation” OR Sentinel-1 OR Sentinel-2 OR Landsat OR MODIS OR LiDAR OR UAV OR SAR OR “multispectral imagery”) AND (“coastal resilience” OR shoreline OR coastline OR “coastal erosion” OR mangrove OR wetland OR estuary OR “coastal flood” OR “storm surge” OR overtopping). Additional targeted searches were used for named domains, including shoreline extraction, flood susceptibility, mangrove monitoring, land-cover change, and GIS decision support.

Table 1.
Search-concept blocks used to identify candidate literature for the review.
| Concept Block | Representative Search Terms | Purpose in the Review |
| AI and analytics | artificial intelligence OR machine learning OR deep learning OR convolutional neural network OR U-Net OR Random Forest OR XGBoost OR explainable AI OR SHAP | Identified AI, ML, deep learning, and explainability methods relevant to coastal and environmental applications. |
| Remote sensing and data | remote sensing OR Earth observation OR Sentinel-1 OR Sentinel-2 OR Landsat OR MODIS OR LiDAR OR UAV OR SAR OR multispectral imagery | Captured satellite, airborne, in situ, and geospatial data sources used in coastal workflows. |
| Coastal system | coastal resilience OR shoreline OR coastline OR coastal erosion OR mangrove OR wetland OR estuary OR coastal flood OR storm surge OR overtopping | Focused the evidence base on coastal hazards, ecosystems, and resilience settings. |
| Application outcome | shoreline extraction OR flood susceptibility OR habitat mapping OR land-cover change OR disaster risk reduction OR adaptation planning OR ecosystem monitoring | Connected methods and data to usable coastal management outputs. |
2.3. Eligibility Criteria
Records were screened for topical, temporal, methodological, and source-quality relevance. The eligibility logic retained studies that directly inform AI-enabled remote sensing or geospatial analysis for coastal resilience and environmental sustainability. Studies that treated AI generically without spatial or environmental data were excluded. Studies that focused solely on terrestrial, non-coastal settings were excluded unless they provided a method that was directly transferable to coastal remote sensing or flood-risk analysis.
Table 2.
Eligibility criteria applied during screening and full-text assessment.
| Criterion | Inclusion | Exclusion |
| Time period | Mainly 2020-2026; selected foundational method papers retained where necessary. | Older empirical studies excluded unless essential for methods, policy context, or widely used AI architecture. |
| Topical relevance | AI, ML, deep learning, remote sensing, GIS, or geospatial analytics applied to coastal resilience, environmental sustainability, coastal hazards, or coastal ecosystems. | Purely terrestrial or generic AI studies with no coastal, environmental, or geospatial relevance. |
| Data relevance | Satellite, UAV, LiDAR, in situ, hydrological, climate, topographic, or GIS data. | Studies with no spatial, environmental, or observational data component. |
| Publication quality | Peer-reviewed literature, recognized proceedings, IPCC reports, and official agency documentation. | Marketing material, unverifiable reports, non-scholarly webpages, or inaccessible sources. |
| Use in synthesis | Sources contributing to methods, datasets, validation, decision support, governance, or research gaps. | Sources that could not be authenticated by title, DOI, publisher page, official source, or authoritative repository. |
2.4. Study Selection and PRISMA Reconciliation
The study-selection process identified 867 records from Scopus, Web of Science, IEEE Xplore, ScienceDirect, SpringerLink, and MDPI. After 305 duplicate records were removed, 562 records remained for title and abstract screening. Screening excluded 453 records because they were outside the topical, methodological, or coastal scope. The remaining 109 reports were sought for retrieval and preliminary full-text relevance review. Seventy-three reports were not retained at this stage because they were inaccessible, redundant, insufficiently relevant to AI-enabled coastal or geospatial applications, or outside the intended scope of the synthesis. Full-text eligibility assessment was conducted for 36 reports. Six reports were excluded with documented reasons: not coastal (n = 2), no AI/ML or geospatial component (n = 2), unverifiable or inaccessible source details (n = 1), and duplicate or strongly overlapping review content (n = 1). Thirty studies were retained for thematic synthesis. Figure 1 summarizes the reconciled selection process.
2.5. Source Authentication, Data Extraction, and Synthesis
All cited references were checked against at least one public record, including DOI resolver metadata, publisher pages, official journal pages, official agency pages, or authoritative repositories. During this pass, incomplete metadata were corrected where necessary, including article numbers, volume and issue details, publisher details, titles, and DOI records for studies on mangrove monitoring, shoreline change, flood susceptibility, GIS decision support, and sea-land segmentation.
For each included source, the extraction focused on application domain, data source, AI or ML method family, validation logic, output type, and relevance to coastal management or environmental sustainability. The source-authentication step confirmed bibliographic existence and metadata consistency; it did not independently reproduce each study’s empirical results. Scientific validity was therefore assessed through thematic synthesis, quality appraisal, and explicit discussion of validation limitations.
Because the included studies vary in methods, sensors, coastal settings, spatial resolution, temporal coverage, and validation metrics, the synthesis is thematic rather than meta-analytic. The review does not rank algorithms across unrelated tasks because accuracy, F1-score, intersection-over-union, area under the curve, root mean square error, R-squared, shoreline-distance error, and event-based flood metrics are not directly comparable unless datasets, validation designs, and operational targets are equivalent. Quality appraisal emphasized five questions: whether data provenance is clear; whether preprocessing steps are described; whether model validation accounts for spatial or temporal dependence; whether uncertainty or explainability is reported; and whether the output connects to a practical coastal management or policy decision.
3. Results and Thematic Synthesis
3.1. Evidence Base and Organizing Domains
The review process shown in Figure 1 resulted in a final evidence base of 30 studies and official documentation sources. These sources show that AI-enabled remote sensing is being applied across a wide range of coastal and environmental domains. The evidence base includes review articles, empirical remote-sensing applications, machine-learning method papers, official data-source documentation, and policy-relevant climate assessment reports. Together, these studies indicate that the field is moving from isolated image classification toward integrated, multi-sensor, and decision-oriented workflows.
Five domains organize the synthesis: shoreline extraction and erosion monitoring; coastal flooding, storm surge, overtopping, and susceptibility mapping; mangrove, wetland, and coastal ecosystem monitoring; land-cover change and coastal urbanization; and GIS-based decision support for adaptation planning. These domains overlap. For example, shoreline extraction may support erosion risk assessment, while mangrove monitoring may inform nature-based flood protection and blue-carbon policy. Figure 2 visualizes the thematic structure used to organize the synthesis.
3.2. Earth Observation Data Infrastructure
Coastal AI applications depend on a multi-sensor data ecosystem. Sentinel-1 provides C-band synthetic aperture radar observations that support day-and-night, all-weather imaging, making it valuable for flood mapping, inundation monitoring, wetland water dynamics, and storm impact assessment [12]. Sentinel-2 provides multispectral imagery across 13 spectral bands at spatial resolutions of 10 m, 20 m, and 60 m, making it central to shoreline, vegetation, water, and land-cover applications [13]. Landsat 8/9 provides a long-running, globally consistent archive through OLI/TIRS products, enabling multi-decadal coastal change analysis [14]. MODIS provides broad, frequent observations across 36 spectral channels and supports global environmental monitoring, including vegetation, land-cover, ocean, and natural hazard applications [15].
Data selection is application-specific. Sentinel-2 and Landsat are widely used for optical shoreline and land-cover mapping, but they are affected by clouds, shadows, turbidity, mixed pixels, and tidal-stage variation. Sentinel-1 SAR is useful in cloudy or storm-prone regions, but speckle, geometric distortions, and specialized preprocessing requirements can complicate interpretation. UAV imagery and LiDAR provide high-resolution validation and local detail, but their spatial coverage, cost, permitting requirements, and processing burden can limit routine application. Table 3 summarizes the main values and limitations of common Earth observation sources used in coastal AI workflows.
Data interoperability remains a major challenge. AI workflows often require co-registration of sensors with different spatial resolutions, temporal frequencies, viewing geometries, and radiometric properties. Without careful harmonization, models can learn artifacts rather than environmental patterns. Publication-quality studies should therefore report sensor products, acquisition dates, preprocessing steps, tidal controls, class definitions, training and validation splits, and uncertainty measures. These details are not secondary. They determine whether model outputs can be compared across sites, repeated by other teams, and trusted by coastal managers.
3.3. AI and Machine Learning Method Families
The reviewed literature uses three broad families of methods. The first is classical ML, including Random Forest, support vector machines, decision trees, logistic regression, and gradient boosting. Random Forest remains popular because it handles nonlinear relationships, mixed predictors, and relatively small training datasets while providing feature-importance measures [16]. XGBoost and related boosting methods are useful for structured geospatial variables and susceptibility mapping because they learn sequential corrections that improve predictive performance [17].
The second family is deep learning for imagery and time series. CNNs, U-Net, DeepLab-style architectures, residual U-Nets, recurrent models, and edge-aware models are used for semantic segmentation of shorelines, water-land boundaries, land cover, and mangrove extent. U-Net remains influential because its encoder-decoder structure preserves localization while capturing contextual information [18]. Deep learning has become central in remote sensing because it can learn spatial features directly from imagery and can exploit large satellite archives when training labels are sufficient [19]. Shamsolmoali et al. demonstrated a deep U-Net structure for sea-land segmentation in remote sensing imagery [20], and BDCN_UNet extended shoreline extraction through deep learning and edge-aware boundary logic [21].
The third family is hybrid and explainable modeling. Hybrid AI-GIS systems combine model outputs with spatial decision layers, exposure data, infrastructure networks, and planning zones. Recent domain applications include deep learning for mangrove monitoring [22], machine-learning-based shoreline change prediction [23], remote-sensing-integrated flood susceptibility mapping [24,25,26], hydrological flood prediction [27], and explainability methods such as SHAP [28]. These hybrid systems are strongest when they combine classification or prediction with external validation, domain knowledge, uncertainty communication, and decision thresholds.
Table 4.
AI methods, outputs, and validation requirements for coastal resilience applications.
| Application Domain | Common Methods | Typical Outputs | Publication-Quality Validation Needs |
| Shoreline extraction and erosion | CNN, U-Net, BDCN_UNet, residual U-Net, edge detection, Random Forest, object-based classification. | Water-land boundary, shoreline displacement, erosion/accretion rates, change maps. | Independent shoreline labels, GNSS/UAV/LiDAR validation, boundary-distance metrics, tidal-stage reporting, cross-region tests. |
| Flood susceptibility and inundation | Random Forest, XGBoost, SVM, gradient boosting, AdaBoost, deep learning, hydrological AI. | Hazard zones, susceptibility classes, inundation maps, predictor importance. | Event-based validation, independent flood inventory, AUC/F1 plus uncertainty, temporal holdout, operational thresholds. |
| Mangrove, wetland, and habitat monitoring | Random Forest, SVM, CNN, U-Net, vegetation-index fusion, time-series classification, SAR-optical fusion. | Habitat extent, change maps, health indicators, restoration progress, carbon-relevant indicators. | Field plots, UAV imagery, expert labels, class-balanced reporting, species or structure validation. |
| Land-cover and coastal urbanization | Random Forest, gradient boosting, CNNs, change detection, transformers, time-series segmentation. | Urban expansion, impervious surface, vegetation loss, land-use transition maps. | Cross-region validation, confusion matrices, class-specific precision/recall, and socioeconomic context. |
| GIS decision support | AI-GIS integration, spatial MCDA, dashboards, digital twins, scenario modeling. | Adaptation priorities, early warning products, restoration suitability, exposure-vulnerability layers. | Stakeholder validation, interpretability, uncertainty communication, update schedule, and governance documentation. |
3.4. Shoreline Extraction and Coastal Erosion Monitoring
Shoreline extraction is one of the most active coastal AI applications because shoreline position is a key indicator for erosion, accretion, storm impact, sediment dynamics, and coastal hazard exposure. Traditional methods use water indices, thresholding, edge detection, object-based image analysis, and supervised classification. These approaches can be efficient, but they are sensitive to turbidity, vegetation, foam, wet sand, shadows, tidal stage, wave runup, and image resolution. Deep learning segmentation models attempt to reduce manual rule-setting by learning features directly from training labels.
Recent reviews highlight the expansion of deep learning for coastal boundary extraction and erosion monitoring. Blais and Akhloufi synthesize advances in remote sensing and deep learning to extract coastal boundaries [3]. Christofi et al. review open remote sensing data, GIS, AI, UAV support, and ground truth for shoreline detection and erosion monitoring, emphasizing Sentinel-2 and Landsat 8/9 as core open-access datasets [4]. BDCN_UNet illustrates the shift toward specialized architecture for coastal boundaries by combining semantic segmentation and edge-aware logic [21]. Osondu et al. illustrate the growing use of machine learning for shoreline change prediction and erosion analysis in a coastal case-study setting [23].
The strongest shoreline studies go beyond single-site accuracy. They specify shoreline definitions, control or document tide and wave conditions, report boundary-distance errors, compare optical and SAR performance, and test transferability to different geomorphic settings. A model trained on sandy beaches may not transfer to mangrove shorelines, rocky coasts, tidal flats, deltas, coral islands, or urban seawalls. Publication-quality shoreline AI work should therefore report both pixel-level accuracy and boundary-location error in terms meaningful to coastal managers. For planning, a boundary error of a few meters may matter more than a high image-wide accuracy score because the shoreline itself can occupy only a small portion of the image.
A major limitation in this domain is the mismatch between image segmentation and coastal geomorphology. Many algorithms treat the shoreline as an instantaneous water-land boundary. Still, coastal management often relies on geomorphic proxies such as dune toe, vegetation line, high-water line, wet-dry boundary, cliff edge, or seawall alignment. Future shoreline AI systems should state the proxy being extracted, relate it to the management decision, and avoid treating all coastal boundaries as equivalent. This is especially important in low-slope tidal flats and wetlands, where tidal stage can shift the apparent waterline substantially between images.
3.5. Coastal Flooding, Storm Surge, Overtopping, and Hazard Susceptibility
AI contributes to coastal flooding and hazard research through susceptibility mapping, short-term prediction, event detection, and post-disaster mapping. Machine learning models commonly combine flood inventories with elevation, slope, drainage density, rainfall, soil, land cover, distance to river or coast, and SAR-derived inundation information. Such workflows can generate spatially explicit hazard layers that support planning, insurance, emergency management, and infrastructure prioritization.
Recent studies and reviews demonstrate both promise and caution. Duiker et al. review machine learning for coastal flooding and overtopping, identifying trends, data sources, and prospects [5]. Hajji et al. integrate remote sensing, machine learning, Google Earth Engine, and explainability for flood prediction [24]. Islam et al. synthesize urban flood susceptibility mapping across remote sensing, machine learning, and other modeling approaches [25]. Feizbahr et al. demonstrate flood susceptibility mapping using machine learning and the geospatial integration of Sentinel-1 SAR data to enhance early warning [26]. In hydrological forecasting, Nearing et al. show that AI can improve access to extreme flood predictions in ungauged watersheds [27].
Despite these advances, operational flood warning requires more than a high AUC. It requires near-real-time data ingestion, reliable exposure layers, threshold design, uncertainty communication, emergency protocols, institutional trust, and mechanisms for communicating warnings to vulnerable communities. Retrospective susceptibility models can be valuable for planning, but they should not be presented as operational early-warning systems unless they have been tested under real-time conditions. The review, therefore, distinguishes susceptibility mapping from operational flood forecasting. The former identifies areas likely to flood under plausible conditions; the latter must issue timely warnings as hazards evolve.
The flood domain also illustrates the need to connect AI with knowledge of physical processes. Coastal flooding often results from compound interactions among rainfall, river discharge, storm surge, astronomical tide, waves, drainage capacity, and land subsidence. Purely data-driven models may capture correlations in past events, but they can fail when future events fall outside the range of the observed training data. Hybrid systems that combine remote sensing, hydrodynamic simulation, elevation correction, and machine learning are better positioned to support decision-making under nonstationary climate conditions.
3.6. Mangrove, Wetland, and Coastal Ecosystem Monitoring
Coastal ecosystems such as mangroves, salt marshes, seagrass beds, tidal flats, and wetlands are central to environmental sustainability because they support biodiversity, fisheries, carbon storage, water quality, shoreline stabilization, and storm-surge attenuation. Remote sensing is essential for monitoring these ecosystems because field access can be difficult, spatial extent can be large, and change can occur through both natural and anthropogenic pressures.
Verified mangrove and wetland sources show the diversity of methods in this domain. Xu et al. present a deep learning model for mangrove monitoring in the Indus Delta [22]. Sunkur et al. review mangrove mapping and monitoring with remote sensing for climate-change resilience [6]. Rondon et al. provide a systematic review of remote sensing-based assessments of mangrove ecosystems in Gulf Cooperation Council countries [7]. Cazzetta et al. synthesize AI tools for ecological research and monitoring in transitional water ecosystems [8]. These sources show that AI can improve mapping consistency, but they also show that ecological interpretation requires more than spectral classification.
Mangrove and wetland mapping illustrates the need for multi-sensor approaches. Optical imagery and vegetation indices such as NDVI, EVI, SAVI, NDWI, and red-edge bands are useful. Still, mangrove signatures can be mistaken for other vegetation or obscured by tidal inundation. SAR adds structural and moisture sensitivity, while UAVs and LiDAR improve local validation and canopy-structure assessment. Field labels and local ecological knowledge remain essential because spectral separability does not automatically equal ecological validity.
For environmental sustainability, the most valuable ecosystem products are not only binary maps of presence and absence. Managers need change trajectories, restoration success indicators, degradation alerts, fragmentation measures, canopy condition, hydrological connectivity, and carbon-relevant proxies. AI can support these outputs when the training data are ecologically meaningful and when validation distinguishes between map accuracy and ecological validity. A model may accurately identify green vegetation but still fail to identify mangrove species composition, canopy age, hydrological stress, or restoration performance.
3.7. Land-Cover Change and Coastal Urbanization
Coastal urbanization changes exposure, runoff, habitat connectivity, sediment supply, and the social geography of risk. Remote sensing has long supported land-cover change analysis, but AI expands this capacity by improving classification of heterogeneous urban edges, impervious surfaces, vegetation transitions, and informal development. AI-enabled land-cover monitoring can support zoning, green infrastructure planning, wetland protection, evacuation-route assessment, and post-disaster recovery analysis.
Land-cover and urbanization applications often use multi-temporal optical imagery, SAR backscatter, vegetation indices, built-up indices, night-time lights, road networks, population layers, and administrative boundaries. Classical ML models remain useful when labels are limited, and predictor variables are tabular or raster-derived. Deep learning can improve segmentation of complex urban textures, but it requires careful labeling and external validation. In coastal regions, urban growth may be spatially adjacent to wetlands, beaches, ports, or industrial facilities, so class definitions should reflect both land-cover type and management relevance.
A recurring risk is that models treat land-cover categories as neutral technical classes. For coastal resilience, the significance of a land-cover transition depends on its location, social context, exposure, and regulatory setting. The conversion of a vacant parcel to impervious surface may have different implications depending on whether it occurs next to a drainage channel, on a barrier island, near a low-income neighborhood, or within a wetland buffer. AI outputs, therefore, require GIS context before they can support adaptation decisions. This is why land-cover change analysis should be integrated with vulnerability layers, infrastructure data, and stakeholder review rather than reported only as area statistics.
3.8. GIS Decision Support and Coastal Governance
GIS is the bridge between AI outputs and coastal decision-making. AI maps are most useful when integrated with administrative boundaries, infrastructure, evacuation routes, conservation areas, land tenure, exposure data, population vulnerability, and planning regulations. Huang et al. emphasize the managerial perspective in deploying spatial data for coastal community resilience [9]. Diehr et al. review AI and ML-powered GIS for proactive disaster resilience in a changing climate [10]. These perspectives highlight that the value of AI depends on how outputs are embedded in institutions, not only how accurately they classify pixels.
A practical coastal dashboard might integrate shoreline-change alerts, flood susceptibility layers, post-storm damage maps, wetland health indicators, and restoration-priority rankings. However, dashboards must be maintained, updated, validated, and governed. Without institutional ownership, models risk becoming one-off academic products. Without uncertainty communication, decision-makers may over-trust maps. Without stakeholder participation, models may prioritize technically measurable outcomes over community-defined resilience priorities.
Equity is therefore a central concern. Open satellite data reduces barriers, but vulnerable regions may still lack high-performance computing, training data, field validation capacity, stable internet access, or technical staff. Figure 3 summarizes a decision-support workflow that links Earth observation, context data, ground truth, preprocessing, AI modeling, validation, explainability, implementation, and equity. This workflow shows why AI-enabled coastal resilience should be designed as capacity-building infrastructure, not merely as a model-building exercise.
3.9. Evaluation Metrics and Common Reporting Pitfalls
Evaluation metrics determine how readers interpret model quality. In coastal remote sensing, a single metric rarely adequately captures performance because model outputs vary across tasks. Shoreline extraction requires geometric accuracy at a narrow boundary. Flood susceptibility mapping requires distinguishing among hazard classes and calibrating against event observations. Mangrove and wetland monitoring requires class-specific accuracy because minority classes can be ecologically important even when they occupy small areas. GIS decision-support systems require usability, update reliability, and stakeholder interpretability in addition to statistical accuracy.
A common reporting pitfall is using random pixel-level train-test splits for spatial data. Random splits can place neighboring pixels from the same scene in both the training and testing sets, inflating performance estimates because the validation data are not independent. Spatial holdout, temporal holdout, event holdout, or cross-region validation provide stronger evidence. This matters in coastal environments because neighboring pixels often share tide, illumination, geomorphology, and sensor conditions. A model that performs well on randomly split data may fail when applied to a different image date or coastline type.
Another pitfall is overreliance on overall accuracy. Overall accuracy can be high when a dominant class, such as open water or inland land cover, overwhelms a smaller but management-relevant class. For shoreline extraction, intersection-over-union may be useful for segmentation masks, but boundary-distance error may better reflect coastal management needs. For flood products, AUC can rank susceptibility but does not tell managers which threshold should trigger action. For ecosystem products, kappa or F1 scores should be accompanied by class-specific precision, recall, and independent ecological validation. Table 5 links common coastal AI outputs to stronger evaluation practices.
A municipality deciding where to prioritize erosion monitoring requires a different error statement from a researcher comparing segmentation architectures. An emergency manager needs information on lead time, threshold reliability, and uncertainty. A conservation agency needs habitat-specific accuracy and ecological interpretability. When researchers align validation design with the intended decision context, AI outputs become more credible, transparent, and less likely to be overclaimed.
The same principle applies to reproducibility. Researchers should clearly state whether validation labels were interpreted by experts, derived from spectral indices, copied from existing maps, or generated from field observations. They should also report whether the model was tested beyond the training geography. These details help editors and reviewers distinguish robust coastal AI systems from models that perform well only under narrow local conditions.
3.10. Data Governance, FAIR Workflows, and Documentation
Data governance is an implementation requirement, not merely an administrative concern. Coastal AI workflows combine satellite images, derived indicators, field observations, elevation data, infrastructure layers, hazard records, and sometimes social vulnerability data. Each input may have different licensing terms, spatial accuracy, update frequency, and sensitivity. If these differences are not documented, downstream users may misunderstand the reliability or permissible use of the resulting map. For example, an open Sentinel-derived classification can usually be shared widely, but a layer showing critical infrastructure or household-level vulnerability may require access restrictions.
FAIR principles are especially relevant to coastal AI because many studies rely on reproducible processing pipelines. Data should be findable through stable identifiers or clear source descriptions; accessible through documented repositories or official portals; interoperable through common geospatial formats, coordinate systems, and metadata; and reusable through clear licensing and processing documentation. These principles do not require every dataset to be fully public. They require researchers to explain what can be shared, what cannot be shared, and why.
Documentation should also distinguish raw data, preprocessed data, labels, model outputs, and decision products. A shoreline label created by an expert, a water mask produced by thresholding, and a final erosion-risk map are different evidence objects. Combining them without clear provenance makes it difficult to audit the workflow. Coastal AI manuscripts should therefore describe the lineage from input observation to final map. This is particularly important when cloud platforms, automated preprocessing, or AI-assisted labeling are used because reproducibility can depend on software versions, platform defaults, and hidden processing choices.
Table 6.
Data-governance elements that strengthen coastal AI workflows.
| Governance Element | Publication-Ready Reporting Expectation |
| Data lineage | Identify raw data sources, preprocessing steps, label sources, model outputs, and final decision layers. |
| Licensing and access | State whether data and outputs are open, restricted, proprietary, sensitive, or available upon request. |
| Spatial reference and scale | Report coordinate system, spatial resolution, resampling choices, and known positional uncertainty. |
| Version control | Document software platforms, model versions, processing dates, and parameter settings that affect reproducibility. |
| Sensitive information | Explain how infrastructure, community, or ecological sensitivity was handled when sharing maps or data. |
| Long-term maintenance | State whether the workflow is a one-time analysis, repeatable research pipeline, or operational system with an update schedule. |
A well-governed coastal AI workflow should be understandable to both technical reviewers and decision-makers. Technical reviewers need sufficient detail to evaluate reproducibility and methodological validity. Decision-makers need enough information to judge whether the map is appropriate for planning, emergency management, restoration prioritization, or public communication. Clear documentation reduces the risk of an AI product being used outside its intended range.
Data governance also supports equity. Communities affected by coastal risk should not only appear as variables in vulnerability layers; they should have opportunities to understand, question, and shape the outputs that may influence planning decisions. When community-level data are used, researchers should discuss safeguards, consent where relevant, and the limits of spatial precision. Responsible documentation can make AI more transparent without exposing sensitive locations or reinforcing unequal data power.
4. Discussion
4.1. Main Contributions of AI to Coastal Resilience
AI contributes to coastal resilience in four main ways. First, it automates monitoring tasks that otherwise require extensive manual interpretation, including shoreline digitization, land-cover classification, mangrove extent mapping, and flood delineation. Second, it enables multi-source fusion by combining optical imagery, SAR, elevation, hydrological variables, and GIS predictors. Third, it supports prediction and prioritization by estimating susceptibility, identifying hotspots, and ranking areas for intervention. Fourth, it can improve timeliness by reducing the delay between data acquisition and the production of actionable output.
These contributions are most defensible when AI is embedded in a transparent geospatial workflow. Model architecture alone is not enough. Coastal decision-makers need to know where training labels came from, how preprocessing handled tides or clouds, whether validation was independent, what error means in physical terms, and how uncertainty affects decisions. A model that is accurate at a regional scale may still be unusable if it misses small but critical assets such as roads, levees, restoration plots, or low-income settlements.
The synthesis also indicates that the maturity of AI applications differs by domain. Shoreline extraction and land-cover classification benefit from long-standing remote-sensing workflows and accessible imagery. Flood susceptibility mapping benefits from GIS covariates and SAR-based flood inventories, but operational forecasting remains more demanding. Ecosystem monitoring benefits from vegetation indices and high-resolution validation, but ecological interpretation remains difficult. GIS decision-support systems offer the strongest pathway to implementation, but they require institutional ownership, update schedules, and stakeholder trust.
4.2. Benchmarking, Validation, and Reproducibility
Benchmarking remains a central weakness across the reviewed literature. Many studies report high accuracy within a single case-study region, but fewer test whether the model transfers to different coastline types, sensors, seasons, tidal stages, or validation years. This limits the generalizability of reported performance. A model trained and tested within one coastline can learn local artifacts, image acquisition patterns, or class imbalances that do not persist elsewhere.
Validation should match the intended decision. Pixel accuracy may be useful for broad land-cover mapping, but it can be misleading for shoreline extraction because most pixels in an image may belong to land or water rather than the boundary. Boundary-distance metrics, Hausdorff distance, positional error, or management-relevant buffer errors may be more meaningful. Flood susceptibility models should report event-based validation, temporal holdout, and independent flood inventories when possible. Mangrove and wetland models should report class-specific accuracy and field or expert validation, not only overall accuracy.
Reproducibility also depends on reporting details that are often omitted. Publication-quality manuscripts should identify data product levels, acquisition dates, preprocessing steps, cloud masking, SAR filtering, DEM corrections, tidal controls, ground-truth sources, labeling procedures, split design, model hyperparameters, software platforms, and code or data availability. These details allow readers to distinguish methodological innovation from local data tuning.
4.3. Explainability, Uncertainty, and Trust
Explainability is particularly important in environmental management because model outputs may influence zoning, infrastructure protection, ecosystem restoration, evacuation planning, or public investment. SHAP and feature-importance methods can help identify whether elevation, rainfall, land cover, distance to water, vegetation, or SAR backscatter is driving a susceptibility model [28]. Yet explainability should be interpreted carefully. Feature attribution can reveal statistical influence, but it does not automatically prove causal mechanisms.
Uncertainty reporting should become standard. Coastal applications face uncertainty from sensor noise, cloud masking, classification labels, tide levels, DEM errors, hydrodynamic assumptions, class imbalance, and future climate conditions. Publication-quality studies should provide confidence intervals, sensitivity analysis, spatial error maps, failure cases, and recommendations for how uncertainty should be interpreted in policy contexts. When uncertainty cannot be fully quantified, researchers should describe likely sources of uncertainty and explain how they affect the intended use of the model output.
Trust also depends on communication. Visually persuasive maps can create a false impression of precision. A flood susceptibility map, shoreline erosion map, or mangrove condition map should therefore include legends, confidence classes, validation notes, and clear statements of appropriate use. Decision-makers need to know whether a map is suitable for regional screening, site-level engineering design, emergency activation, or public communication. These uses require different standards of evidence.
4.4. From Research Models to Operational Systems
The transition from research model to operational system is one of the field’s greatest challenges. A published model may run once on a carefully prepared dataset. Operational resilience systems require stable data pipelines, continuous monitoring, update schedules, maintenance responsibilities, alert thresholds, user interfaces, staff training, and governance arrangements. Coastal managers need products that answer practical questions: where erosion is accelerating, which communities are exposed, where restoration should be prioritized, and when emergency systems should be activated.
Hybrid frameworks are promising. AI can detect patterns, fill data gaps, and classify large archives of imagery, while physics-based models preserve process knowledge of waves, tides, hydrodynamics, sediment transport, and future climate extrapolation. Recent advances in data-driven weather prediction and Earth system science illustrate the value of combining learning algorithms with process understanding and physical constraints [29,30,31]. GIS can integrate model outputs with exposure and vulnerability. Digital twins may eventually integrate remote sensing, hydrodynamic simulation, infrastructure data, and scenario analysis to support dynamic adaptation planning.
Operationalization should be treated as a design requirement from the beginning of a study. Researchers should identify the intended users, update frequency, data pipeline, validation schedule, and governance responsibilities. They should also distinguish between research outputs that are ready for planning discussion and products that are ready for operational warnings. This distinction protects communities from overconfidence and protects researchers from overstating the maturity of their models.
4.5. Equity, Capacity, and Responsible AI
AI-enabled coastal resilience can either reduce or reproduce inequality. Open satellite archives and cloud platforms can expand access to monitoring tools. However, communities with limited computing resources, training data, field validation capacity, or technical staff may still be left behind. Coastal regions with high vulnerability may also lack dense sensor networks, high-resolution elevation data, or long-term ground records. If AI models are trained primarily on data from data-rich regions, they may perform poorly where resilience needs are greatest. This concern is particularly relevant in the U.S. Gulf Coast and Mississippi context, where climate risks intersect with hurricanes, sea-level rise, coastal erosion, extreme temperatures, flooding, and policy adaptation needs [32,33].
Responsible AI in coastal sustainability therefore requires capacity building. This includes open workflows, interpretable models, shared training datasets, clear documentation, local validation, participatory mapping, and training for agency staff and community organizations. It also requires attention to data governance. The location of vulnerable households, evacuation routes, critical infrastructure, culturally significant sites, and conservation areas may be sensitive. Data-sharing decisions should balance transparency, privacy, security, and community consent. Research on climate change education and environmental activism further shows that resilience tools gain public value when technical evidence is translated into institutional learning, civic engagement, and action-oriented communication [34,35].
Equity should not be treated only as a social add-on after model development. It should influence problem definition, data collection, label design, validation, interpretation, and implementation. Coastal adaptation priorities may differ between engineers, planners, residents, fishers, conservation groups, and emergency managers. Participatory approaches can help ensure that AI outputs reflect locally meaningful resilience goals rather than only the variables that are easiest to measure from space.
4.6. Research Gaps and Future Directions
The synthesis identifies several research gaps that limit the transition from promising case studies to trusted coastal resilience systems. Table 7 summarizes these gaps and links each to a practical direction for future research and implementation. The most urgent needs are open benchmarks, transferability testing, uncertainty communication, better documentation of preprocessing and validation, stronger integration with physical models, and more explicit governance planning.
A practical research agenda should prioritize three levels of integration. At the data level, studies should link optical imagery, SAR, elevation, field labels, hydrological variables, and socioeconomic exposure in documented workflows. At the model level, studies should combine interpretable ML, deep learning, physics-informed constraints, and uncertainty quantification. At the governance level, studies should connect outputs to planning instruments, restoration programs, emergency protocols, and community-defined resilience priorities. This integrated agenda would make AI-enabled coastal resilience more useful, reproducible, and accountable.
For researchers preparing manuscripts in this field, the practical implication is clear: the paper should not end with a discussion of model performance. It should explain why the coastal problem matters, why the selected sensors are appropriate, how the labels represent the coastal feature of interest, how uncertainty affects interpretation, and how the output could be used responsibly. For reviewers and editors, the key question is not only whether a model is novel but also whether the evidence supports the claimed contribution to coastal resilience.
For agencies and coastal communities, the research agenda should prioritize tools that are maintainable after publication. Many promising studies stop at a static map or one-time classification. Coastal resilience requires repeatable pipelines that can process new imagery, update indicators, preserve metadata, and communicate changes to decision-makers. Open documentation, simple reproducibility packages, and clear governance responsibilities can help translate research into sustained practice.
Table 8.
Publication-readiness checklist for AI-enabled coastal remote sensing studies.
| Checklist Item | Minimum Expectation for Publication-Ready Reporting |
| Problem definition | State the coastal management problem, the target output, and the intended user or decision context. |
| Data provenance | Report sensor/product names, dates, spatial resolution, preprocessing, tidal or hydrological context, and label sources. |
| Model documentation | Describe architecture, predictors, hyperparameters, software, training strategy, and model-selection logic. |
| Validation design | Use independent spatial, temporal, or event-based validation where possible and report class-specific or boundary-specific metrics. |
| Uncertainty and explainability | Report uncertainty, sensitivity, feature importance, failure cases, and appropriate-use boundaries. |
| Governance and implementation | Identify update schedules, responsible institutions, stakeholder validation, data ethics, and capacity needs. |
4.7. Limitations of This Review
Although this review includes a PRISMA 2020-informed flow diagram and explicit study-selection counts, several limitations remain. The review was not prospectively registered, and independent dual screening was not conducted. It should therefore be interpreted as a structured review with transparent study selection rather than a quantitative meta-analysis or a fully registered systematic review.
The included studies are heterogeneous in sensor type, spatial resolution, ecological setting, hazard focus, model architecture, and validation metric. This heterogeneity supports thematic synthesis rather than direct quantitative comparison of algorithms across domains. Future work can further strengthen the evidence base by providing a public study-extraction matrix, an exclusion log, open benchmark datasets, and protocol registration. The absence of a supplementary file in this manuscript keeps the submission compact, but it also limits the level of audit detail that can be shared.
The review also focuses on English-language and readily authenticated scholarly sources. This may underrepresent local coastal management reports, non-English case studies, community-generated datasets, and operational tools that are not indexed in major databases. Such sources can be important for coastal governance, particularly in vulnerable regions. Future reviews should examine how grey literature, local knowledge, and agency datasets can be incorporated without reducing transparency or source reliability.
5. Conclusions
AI-enabled remote sensing and geospatial analytics are reshaping research on environmental sustainability and coastal resilience. From 2020 to 2026, the literature increasingly connects open Earth observation data, machine learning, deep learning, cloud geospatial platforms, GIS, and decision-support tools. The most mature applications include shoreline extraction, flood susceptibility mapping, mangrove and wetland monitoring, land-cover change detection, and GIS-based adaptation planning.
The central conclusion is that AI should be treated as a decision-support component within broader coastal governance systems, not as a stand-alone solution. Strong coastal AI studies require verified data provenance, transparent preprocessing, independent validation, uncertainty reporting, interpretability, reproducibility, and relevance to management decisions. Open satellite data and AI can improve monitoring capacity, but equitable outcomes depend on field validation, community participation, institutional capacity, and accessible workflows.
Future research should move beyond isolated demonstrations toward benchmarked, transferable, and operationally grounded systems. Coastal resilience requires tools that can be updated, explained, maintained, and trusted. AI can contribute to that goal when it integrates remote sensing, GIS, physical-process knowledge, local expertise, and responsible governance.
Author Contributions
Conceptualization, S.A. and B.D.; methodology, B.D.; validation, S.A. and B.D.; formal analysis, B.D.; investigation, S.A. and B.D.; resources, S.A. and B.D.; data curation, B.D.; writing-original draft preparation, S.A.; writing-review and editing, S.A. and B.D.; visualization, B.D. All authors have read and agreed to the submitted version of the manuscript.
Funding
This research received no external funding.
Institutional Review Board Statement
Not applicable.
Informed Consent Statement
Not applicable.
Data Availability Statement
No new datasets were generated or analyzed in this review. The cited literature and official documentation are identified in the reference list. The study-selection counts used to create the PRISMA flow diagram are reported in the Materials and Methods section and Figure 1.
Acknowledgments
The authors acknowledge the publicly available scholarly literature and official Earth observation documentation reviewed for this manuscript.
Conflicts of Interest
The authors declare no conflict of interest.
References
- IPCC. Climate Change 2022: Impacts, Adaptation and Vulnerability. Contribution of Working Group II to the Sixth Assessment Report of the Intergovernmental Panel on Climate Change; Cambridge University Press: Cambridge, UK and New York, NY, USA, 2022. [CrossRef]
- IPCC. IPCC Special Report on the Ocean and Cryosphere in a Changing Climate; Cambridge University Press: Cambridge, UK and New York, NY, USA, 2019. [CrossRef]
- Blais, M.-A.; Akhloufi, M.A. Advances in remote sensing and deep learning in coastal boundary extraction for erosion monitoring. Geomatics 2025, 5, 9. [CrossRef]
- Christofi, D.A.D.; Mettas, C.; Evagorou, E.; Stylianou, N.; Eliades, M.; Theocharidis, C.; Chatzipavlis, A.; Hasiotis, T.; Hadjimitsis, D. A review of open remote sensing data with GIS, AI, and UAV support for shoreline detection and coastal erosion monitoring. Applied Sciences 2025, 15, 4771. [CrossRef]
- Duiker, M.L.; Ramos, V.; Taveira-Pinto, F.; Rosa-Santos, P. Predicting coastal flooding and overtopping with machine learning: Review and prospects. Journal of Marine Science and Engineering 2025, 13, 2384. [CrossRef]
- Sunkur, R.; Kantamaneni, K.; Bokhoree, C.; Rathnayake, U.; Fernando, M. Mangrove mapping and monitoring using remote sensing techniques towards climate change resilience. Scientific Reports 2024, 14, 6949. [CrossRef]
- Rondon, M.; Ewane, E.B.; Abdullah, M.M.; Watt, M.S.; Blanton, A.; Abulibdeh, A.; Burt, J.A.; Rogers, K.; Ali, T.; Reef, R.; et al. Remote sensing-based assessment of mangrove ecosystems in the Gulf Cooperation Council countries: A systematic review. Frontiers in Marine Science 2023, 10, 1241928. [CrossRef]
- Cazzetta, A.; Zangaro, F.; Marcucci, F.; Julius, O.T.; Rainò, M.; Shauer, M.; Massaro, R.; Semeraro, T.; Basset, A.; Pinna, M. Applying artificial intelligence (AI) innovative tools for ecological research and monitoring of transitional water ecosystems: A systematic review. Environments 2026, 13, 193. [CrossRef]
- Huang, X.; Song, Y.; Hu, X. Deploying spatial data for coastal community resilience: A review from the managerial perspective. International Journal of Environmental Research and Public Health 2021, 18, 830. [CrossRef]
- Diehr, J.; Ogunyiola, A.; Dada, O. Artificial intelligence and machine learning-powered GIS for proactive disaster resilience in a changing climate. Annals of GIS 2025, 31, 287-300. [CrossRef]
- Page, M.J.; McKenzie, J.E.; Bossuyt, P.M.; Boutron, I.; Hoffmann, T.C.; Mulrow, C.D.; Shamseer, L.; Tetzlaff, J.M.; Akl, E.A.; Brennan, S.E.; et al. The PRISMA 2020 statement: An updated guideline for reporting systematic reviews. BMJ 2021, 372, n71. [CrossRef]
- European Space Agency. Sentinel-1: Radar Vision for Copernicus. Available online: https://www.esa.int/Applications/Observing_the_Earth/Copernicus/Sentinel-1 (accessed on 23 June 2026).
- Copernicus Data Space Ecosystem. Sentinel-2. Available online: https://dataspace.copernicus.eu/data-collections/copernicus-sentinel-missions/sentinel-2 (accessed on 23 June 2026).
- U.S. Geological Survey. Landsat 8-9 Operational Land Imager/Thermal Infrared Sensor Collection 2 Level-2 Science Products. Available online: https://www.usgs.gov/centers/eros/science/usgs-eros-archive-landsat-archives-landsat-8-9-olitirs-collection-2-level-2 (accessed on 23 June 2026).
- NASA Earthdata. Moderate Resolution Imaging Spectroradiometer (MODIS). Available online: https://www.earthdata.nasa.gov/data/instruments/modis (accessed on 23 June 2026).
- Breiman, L. Random forests. Machine Learning 2001, 45, 5-32. [CrossRef]
- Chen, T.; Guestrin, C. XGBoost: A scalable tree boosting system. In Proceedings of the 22nd ACM SIGKDD International Conference on Knowledge Discovery and Data Mining, San Francisco, CA, USA, 13-17 August 2016; pp. 785-794. [CrossRef]
- Ronneberger, O.; Fischer, P.; Brox, T. U-Net: Convolutional networks for biomedical image segmentation. In Medical Image Computing and Computer-Assisted Intervention - MICCAI 2015; Navab, N.; Hornegger, J.; Wells, W.M.; Frangi, A.F., Eds.; Springer: Cham, Switzerland, 2015; pp. 234-241. [CrossRef]
- Zhu, X.X.; Tuia, D.; Mou, L.; Xia, G.-S.; Zhang, L.; Xu, F.; Fraundorfer, F. Deep learning in remote sensing: A review. IEEE Geoscience and Remote Sensing Magazine 2017, 5, 8-36. [CrossRef]
- Shamsolmoali, P.; Zareapoor, M.; Wang, R.; Zhou, H.; Yang, J. A novel deep structure U-Net for sea-land segmentation in remote sensing images. IEEE Journal of Selected Topics in Applied Earth Observations and Remote Sensing 2019, 12, 3219-3232. [CrossRef]
- Mahmoud, A.S.; Mohamed, S.A.; Helmy, A.K.; Nasr, A.H. BDCN_UNet: Advanced shoreline extraction techniques integrating deep learning. Earth Science Informatics 2025, 18, 187. [CrossRef]
- Xu, C.; Wang, J.; Sang, Y.; Li, K.; Liu, J.; Yang, G. An effective deep learning model for monitoring mangroves: A case study of the Indus Delta. Remote Sensing 2023, 15, 2220. [CrossRef]
- Osondu, I.; Imoni, O.; Chukwuemeka, P.; Amos, M.D.; Ajibade, D.I.; Mene-Ejegi, O.O.; Mogo, C.F.; Eteh, D.R.; Nwadoziokwu, E.O.; Akajiaku, C.U. Machine learning-based shoreline change prediction and erosion analysis: A case study of Ogu/Bolo, Nigeria. Discover Civil Engineering 2025, 2, 230. [CrossRef]
- Hajji, S.; Krimissa, S.; Abdelrahman, K.; Boudhar, A.; Elaloui, A.; Ismaili, M.; El Bouzekraoui, M.; Chikh Essbiti, M.; Kahal, A.Y.; Mondal, B.K.; et al. Enhancing flood prediction through remote sensing, machine learning, and Google Earth Engine. Frontiers in Water 2025, 7, 1514047. [CrossRef]
- Islam, T.; Zeleke, E.B.; Afroz, M.; Melesse, A.M. A systematic review of urban flood susceptibility mapping: Remote sensing, machine learning, and other modeling approaches. Remote Sensing 2025, 17, 524. [CrossRef]
- Feizbahr, M.; Brake, N.; Arbabkhah, H.; Hariri Asli, H.; Woods, K. Flood susceptibility mapping using machine learning and geospatial-Sentinel-1 SAR integration for enhanced early warning systems. Remote Sensing 2025, 17, 3471. [CrossRef]
- Nearing, G.; Cohen, D.; Dube, V.; Gauch, M.; Gilon, O.; Harrigan, S.; Hassidim, A.; Klotz, D.; Kratzert, F.; Metzger, A.; et al. Global prediction of extreme floods in ungauged watersheds. Nature 2024, 627, 559-563. [CrossRef]
- Lundberg, S.M.; Lee, S.-I. A unified approach to interpreting model predictions. In Advances in Neural Information Processing Systems 30; Curran Associates: Red Hook, NY, USA, 2017; pp. 4765-4774.
- Lam, R.; Sanchez-Gonzalez, A.; Willson, M.; Wirnsberger, P.; Fortunato, M.; Alet, F.; Ravuri, S.; Ewalds, T.; Eaton-Rosen, Z.; Hu, W.; et al. Learning skillful medium-range global weather forecasting. Science 2023, 382, 1416-1421. [CrossRef]
- Reichstein, M.; Camps-Valls, G.; Stevens, B.; Jung, M.; Denzler, J.; Carvalhais, N.; Prabhat. Deep learning and process understanding for data-driven Earth system science. Nature 2019, 566, 195-204. [CrossRef]
- Karpatne, A.; Atluri, G.; Faghmous, J.H.; Steinbach, M.; Banerjee, A.; Ganguly, A.R.; Shekhar, S.; Samatova, N.; Kumar, V. Theory-guided data science: A new paradigm for scientific discovery from data. IEEE Transactions on Knowledge and Data Engineering 2017, 29, 2318-2331. [CrossRef]
- Damoah, B.; Adu, E.; Ofori, E.; Apraku, A. Aggravation of climate change crisis in Gulf Regions of United States: A Review of Anthropogenic Factors. Journal of Ecohumanism 2024, 3, 438-449. [CrossRef]
- Damoah, B.; Khalo, X. Extreme Temperature Variability in the Southeastern United States: Trends in Mississippi State. International Journal of Environmental, Sustainability, and Social Science 2024, 5, 1991-2002. [CrossRef]
- Damoah, B. Reimagining Climate Change Education As a Panacea to Climate Emergencies. International Journal of Environmental, Sustainability, and Social Science 2023, 4, 977-987. [CrossRef]
- Damoah, B.; Keengwe, S.; Owusu, S.; Yeboah, C.; Kekessie, F. The Global Climate and Environmental Protest: Student Environmental Activism as a Transformative Defiance. International Journal of Environmental, Sustainability, and Social Science 2023, 4, 1180-1198. [CrossRef]
Figure 1.
PRISMA 2020-informed flow diagram of study selection. The flow reconciles all records from identification through final thematic synthesis.
Figure 1.
PRISMA 2020-informed flow diagram of study selection. The flow reconciles all records from identification through final thematic synthesis.
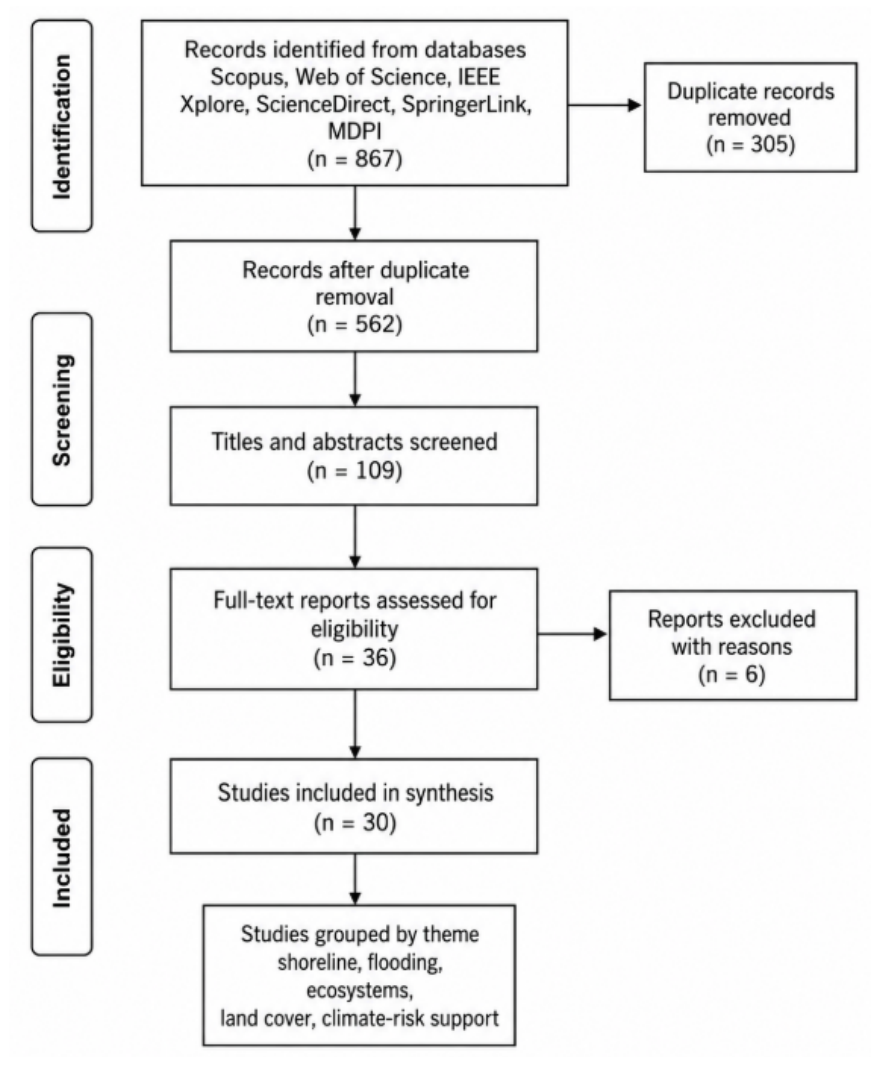
Figure 2.
Major application domains synthesized in the review: shoreline extraction and erosion monitoring; flood, storm-surge, and overtopping risk; mangrove, wetland, and habitat monitoring; land-cover change and coastal urbanization; and GIS decision support for adaptation planning.
Figure 2.
Major application domains synthesized in the review: shoreline extraction and erosion monitoring; flood, storm-surge, and overtopping risk; mangrove, wetland, and habitat monitoring; land-cover change and coastal urbanization; and GIS decision support for adaptation planning.
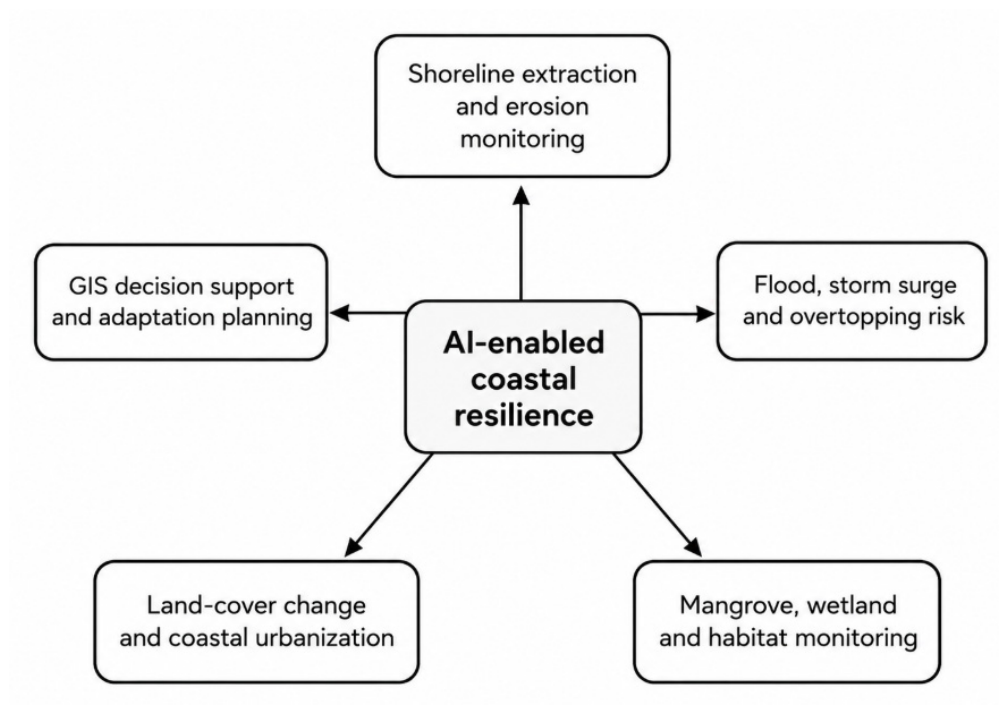
Figure 3.
Integrated AI, remote sensing, and GIS workflow for coastal resilience decision support. The workflow links Earth observation, contextual data, ground truth, preprocessing, feature engineering, governance, AI modeling, validation, explainability, implementation, and equity considerations.
Figure 3.
Integrated AI, remote sensing, and GIS workflow for coastal resilience decision support. The workflow links Earth observation, contextual data, ground truth, preprocessing, feature engineering, governance, AI modeling, validation, explainability, implementation, and equity considerations.
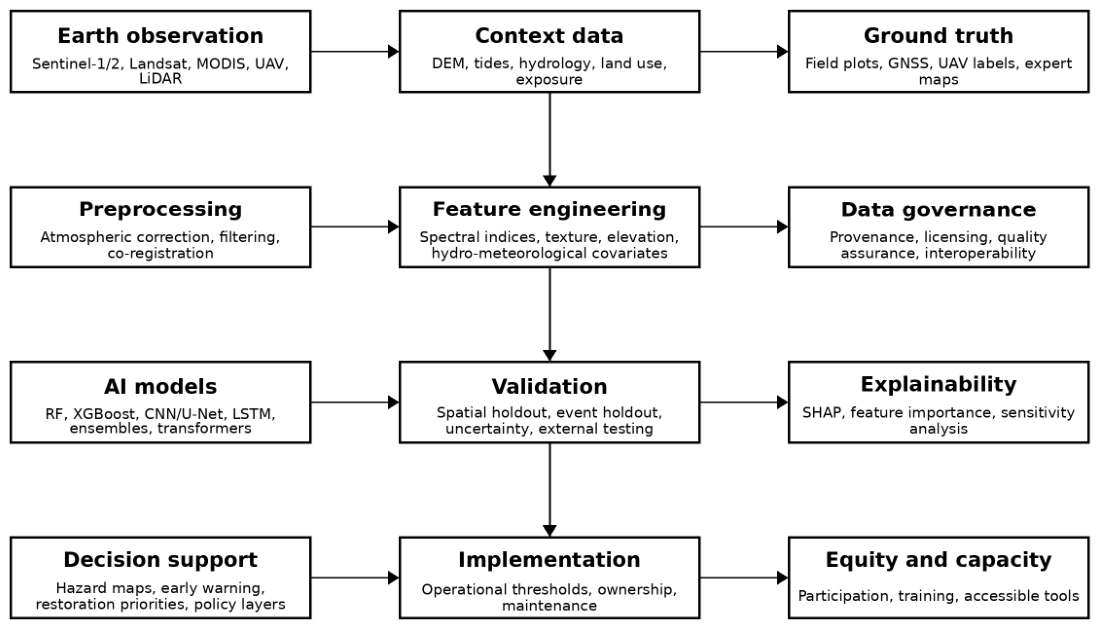
Table 3.
Common Earth observation and geospatial data sources for AI-enabled coastal resilience.
| Data Source | Primary Value for Coastal Applications | Common Limitations |
| Sentinel-1 SAR | All-weather, day-night radar observations are useful for flood mapping, wetland inundation, storm impact assessment, and shoreline interpretation under cloud cover. | Speckle noise, geometric distortions, lower intuitive interpretability, and a need for SAR preprocessing expertise. |
| Sentinel-2 MSI | Multispectral imagery with 13 bands at 10/20/60 m; useful for shoreline extraction, vegetation indices, mangrove monitoring, land-cover change, and water mapping. | Cloud contamination, mixed land-water pixels, adjacency effects, and sensitivity to tidal stage and turbidity. |
| Landsat 8/9 OLI/TIRS | Long-term archive suitable for multi-decadal shoreline, urbanization, ecosystem, and land-surface-temperature analyses. | Coarser spatial detail than UAV or very-high-resolution imagery for narrow coastal features. |
| MODIS | High-frequency global observations useful for broad environmental monitoring, ocean/coastal variables, fire, vegetation, and hazards. | Coarse spatial resolution limits mapping of local shorelines, wetlands, and urban edges. |
| UAV and LiDAR | High-resolution validation, restoration monitoring, dune and shoreline morphology, vegetation structure, and ground-truth support. | Limited coverage, regulations, weather constraints, processing burden, and unequal access. |
Table 5.
Evaluation metrics and common reporting cautions in AI-enabled coastal remote sensing.
| Output Type | Useful Metrics | Reporting Cautions |
| Shoreline or coastline boundary | Boundary-distance error, Hausdorff distance, mean absolute positional error, IoU for masks, visual comparison against independent labels. | Report shoreline proxy, tide or water-level context, image date, and whether the metric evaluates the boundary or the full image. |
| Flood susceptibility or inundation | AUC, F1-score, precision, recall, confusion matrix, event-based validation, calibration plots, spatial error maps. | Do not describe a retrospective susceptibility map as an operational warning system without real-time testing and threshold validation. |
| Mangrove, wetland, or habitat map | Class-specific precision and recall, F1-score, balanced accuracy, field-plot agreement, expert-label assessment. | Avoid relying only on overall accuracy when small habitat classes carry high ecological value. |
| Land-cover change product | Confusion matrix by year, area-adjusted accuracy, change-detection error, class transition uncertainty. | Distinguish mapped change from classification noise and report whether validation is independent across time. |
| GIS decision-support product | Model accuracy, uncertainty communication, user validation, update reliability, decision threshold performance. | Assess whether the output supports an actual decision and whether users understand uncertainty and limitations. |
Table 7.
Priority research gaps and recommended directions for AI-enabled coastal resilience research.
Table 7.
Priority research gaps and recommended directions for AI-enabled coastal resilience research.
| Research Gap | Why It Matters | Recommended Direction |
| Limited open benchmarks | Without shared labels and evaluation protocols, model comparisons remain inconsistent. | Develop open coastal benchmark datasets across sandy beaches, deltas, wetlands, rocky coasts, urban coasts, and small islands. |
| Weak transferability testing | Models trained in one coastline type may fail elsewhere. | Use cross-region validation, domain adaptation, transfer learning, and external test sites. |
| Insufficient uncertainty communication | Decision-makers may over-trust visually persuasive maps. | Report error maps, uncertainty intervals, sensitivity analysis, and decision thresholds. |
| Black-box modeling | Opaque predictions reduce trust and make policy uptake harder. | Use SHAP, interpretable features, physics-informed constraints, and documented model cards. |
| Operational gap | Many models remain one-off research demonstrations. | Design workflows with agencies and communities, update schedules, maintenance plans, and dashboard integration. |
| Unequal capacity | Vulnerable coastal regions may lack computing, labeling, training, or field-validation capacity. | Invest in open workflows, training, cloud platforms, participatory mapping, and equitable data governance. |
Disclaimer/Publisher’s Note: The statements, opinions and data contained in all publications are solely those of the individual author(s) and contributor(s) and not of MDPI and/or the editor(s). MDPI and/or the editor(s) disclaim responsibility for any injury to people or property resulting from any ideas, methods, instructions or products referred to in the content. |
© 2026 by the authors. Licensee MDPI, Basel, Switzerland. This article is an open access article distributed under the terms and conditions of the Creative Commons Attribution (CC BY) license (http://creativecommons.org/licenses/by/4.0/).
Copyright: This open access article is published under a Creative Commons CC BY 4.0 license, which permit the free download, distribution, and reuse, provided that the author and preprint are cited in any reuse.


