

Submitted:
01 July 2026
Posted:
03 July 2026
You are already at the latest version
Abstract
Ultrasonic welding is a process for joining plastic components with localized heating, very short welding times and a high process efficiency. It is significantly influenced by the process parameters and the tolerances of the parts to be joined. At the same time, welding theories and material models are reaching their limits with ultrasonic welding. This makes it hard to predict weld quality for an individual part. The weld seam quality is typically assessed by subsequent destructive testing of the weld seam. In the present study, we are showing that acoustic monitoring of the ultrasonic welding process allows predictions to be made about the weld seam quality during the process. For that approach, the acoustic monitoring of the mechanical vibration effects occurring in the process is examined using piezo elements, a laser microphone and a laser vibrometer. Besides sound energy density and the non-linear vibration behavior occurring in the process, the weld seam quality is characterized using conventional tensile tests. In the results, both the level of the acoustic energy density and, in particular, the course of the non-linearity during the process show a correlation with the resulting weld seam quality, thus allowing for a non-destructive quality monitoring in real-time.
Keywords:
acoustic monitoring
; ultrasonic welding of plastics
; quality assessment
; sound energy density
; nonlinearity
1. Introduction
Ultrasonic welding is a joining process used for thermoplastic parts, in which the material is melted by high-frequency mechanical vibration and heat generated by internal and interfacial friction. Parts can be welded together in less than a second, allowing for short cycle times. Besides that, it is valued in industrial production for its low energy demand, good automation potential, and comparatively low process costs [1]. However, weld quality depends on many complex processes occurring simultaneously in the heat-affected zone during welding [2]. As a result, critical parameters such as welding amplitude, welding time, and contact force are often still determined empirically and evaluated using destructive testing [3]. For this reason, sensor-based process monitoring is increasingly relevant, as it offers the potential to assess weld quality directly during the welding operation and reduce reliance on post-process testing.
2. Ultrasonic Welding of Plastics
Ultrasonic welding systems consist of an ultrasonic generator, a transducer, a booster, a sonotrode, and an anvil [1], as shown schematically in Figure 1. The ultrasonic generator converts the power input into high-frequency electrical oscillations in the low ultrasonic range between 20 kHz and 70 kHz which are converted by the transducer into mechanical vibrations of the same frequency. Commercial converters use a ceramic piezoelectric element or a magnetostrictive element for this purpose. The downstream booster is a passive, resonant component that mechanically amplifies the mechanical vibrations with amplitudes of welding systems typically ranging from 20 µm to 100 µm. The mechanical vibrations are then transmitted via the sonotrode into the component to be welded. The components to be welded often feature an energy-directing feature, called the energy director, to ensure a defined energy input into the weld zone. The counterpart to the sonotrode is the anvil, which serves to position and hold the component to be welded.
2.1. Process Parameters
To ensure high weld seam quality, the process parameters for ultrasonic welding must be matched to the specific application. Thus, the decisive factors in determining welding amplitude and contact force are the material and the joint design. For the amplitude, amorphous plastics typically require amplitudes between 15 µm and 35 µm at an operating frequency of 20 kHz, while semi-crystalline plastics require higher amplitudes of 25 µm to 50 µm at the same operating frequency. The relationship between the volumetric heat flux and the vibration amplitude during ultrasonic welding can be described as shown in Equation 1.
In this, describes the material-dependent loss modulus, represents the strain and the angular frequency, both of which are dependent on the welding process. is proportional to the selected amplitudes of the process. This yields the relationship between the viscoelastic heat flux and the amplitude shown in Equation 2. The peak sound energy density and the amplitude are related via Equation 3.
In ultrasonic welding, the contact force directly affects energy conversion, with higher contact forces resulting in shorter welding times. In addition, high contact forces have a positive effect on weld strength, although excessively high forces can reduce weld quality. In this case, a large portion of the polymer melt is forced out of the welding zone, reducing the seam thickness and strength. In practice, contact pressure and amplitude must be matched to each other and are selected based on general guidelines, often combining small amplitudes with high contact pressures and large amplitudes with low contact pressures. The required welding time depends on the amplitude and the contact pressure in the process. If the welding time is too long or too short, the weld quality will be poor. Since the formation of a homogenous weld is critical to the quality of the joint, optimal welding times are typically determined through a series of tests. The welding time is kept as short as possible to maximize productivity and prevent thermal degradation of the material in the weld area.
2.2. Process Monitoring
There are several methods available for process monitoring. Methods either focus on machine parameters [4,5] or include the incorporation of additional sensors near the welding area [6,7]. For acoustic monitoring, piezoelectric sensors are a suitable option for acquiring additional measurement data from the ultrasonic welding process. They consist of piezoelectric crystals or ceramics that generate an electrical charge when mechanically stressed. This direct piezoelectric effect can be used to convert mechanical vibrations into an electrical signal and allows for higher-harmonic frequencies in the lower 100 kHz range to be detected. For signal analysis, the Fast Fourier Transform (FFT) can be used to decompose a signal into its individual frequencies. Using the generated amplitude-frequency spectrum, the sound energy density at the piezo element can be calculated using Equation 4. The amplitude corresponds to the mechanical amplitude of the piezo element and is determined using the conversion factor and the electrical amplitude according to Equation 4.
The conversion factor can be determined using laser Doppler vibrometry. In this procedure, the piezoelectric element is driven by a frequency generator at the respective frequency and voltage amplitude, and the resulting displacement is measured. The conversion factor can be determined using the linear relation between voltage and mechanical displacement. To assess the total sound energy, any higher harmonics must also be considered in addition to the fundamental frequency, as shown in Equation 5. It represents the sum of the peak sound energy densities for multiple frequencies based on their amplitude. Here, denotes the amplitude of the vibration, denotes the density of the anvil, and the index denotes the number of the higher harmonic. In the present case, the density of the anvil material made of stainless steel is approximated as 8000 kg/m³.
The sound energy density is therefore an indicator to assess the energy input and the welding process. It can both be evaluated for individual sensors and frequencies or as the total, summed value of frequency components. Higher sound energy density can generally be associated with more effective coupling and better joint formation, and vice-versa.
2.3. Nonlinear Mechanisms
In the ultrasonic welding process, nonlinear acoustic effects have the potential for being a sensitive indicator of process condition and material response. In an oscillating system, nonlinear behavior can lead to the formation of higher harmonic oscillations. These oscillations have frequencies that are integer multiples of the excitation frequency. Other nonlinear effects include intermodulation and the formation of subharmonics [8]. The nonlinear effects range from the interatomic level in completely homogeneous materials to the meso- and macro-levels in the presence of defects and inhomogeneities [9,10,11]. This makes nonlinear analysis more sensitive than conventional ultrasonic evaluation in many applications of defect-detection as shown in [8,9,12,13,14,15,16,17]. To cast the nonlinear behavior into a quantitative measure, the nonlinearity ratio can be used. For the present investigations, the definition according to Equation 6 is applied. There, is the vibration velocity at the fundamental frequency, and is the vibration velocity at the respective higher harmonic frequencies. The vibration velocity is determined using Equation 7.
The high sensitivity of nonlinear ultrasound to differences in both the macrostructure and microstructure makes this method particularly suitable for inspecting welded joints, as small irregularities during the welding process could lead to a significant reduction in weld quality. In this context, inspection during ultrasonic welding is particularly interesting, since ultrasonic excitation is already an integral part of the process. The nonlinear effects may arise from the dynamics of solids and from viscoelastic behavior in the melt, and they can be amplified by cracks, pores, and microstructural inhomogeneities. In the joint gap, the following mechanisms in particular may come into play.
- Acoustic contact nonlinearity (CAN, [18]):
Clapping or rubbing of weakly bound elements on the contact surfaces.
- Hertzian nonlinearity (HN, [19]):
A change in contact stress due to an increase in the area of the preloaded contact elements on rough contact surfaces.
- Nonlinearity of the polymer melt [20]:
Absorption in the viscoelastic melt, similar to a damping, highly absorbent viscous fluid.
In the different phases of the welding process, some or all of these effects are acting at the same time. As a result of that, any measurements done during the process and parameters derived show a superposition of them.
3. Experimental Acoustic Monitoring Setup
For the experiments, a HIQ 4800 ultrasonic welding system from Hermann Ultraschall GmbH & Co. KG, Karlsbad, Germany was used. It has an operating frequency range of 20 kHz to 35 kHz and was operated at 20 kHz for all test series. The test specimens used comply with the specifications of the German Association for Welding and Related Processes (DVS) and were injection-molded from polyamide 6 (PA6) and polypropylene (PP). The distance between the sonotrode and the joint gap is 3 mm for the geometry, classifying the process as near-field welding. The experimental setup is shown in Figure 2. To monitor the welding process, the vibration behavior is measured using two piezo sensors that are attached to the anvil using a thin layer of wax and are sampled at a rate of 1 MS/s using a digital oscilloscope. They are capturing oscillations that are transmitted from the sonotrode down to the anvil and are, in part, reflected back into the welding area. To measure the freely oscillating sonotrode of the system without any load, a laser Doppler vibrometer of type SWIR from Optomet GmbH, Darmstadt, Germany in combination with a mirror optic is used, projecting the measuring laser onto the downward face.
Based on preliminary tests, welding times of 0.3 s and 0.6 s are used. Contact forces are systematically varied from 400 N to 650 N dependent on the specific test series. In the same way, the amplitude is varied in a range from 33 µm to 39 µm. All other welding parameters were kept constant throughout the experiments to ensure good comparability, and reasonable values were selected based on empirical data. For the tensile tests, the specimens were tested at a constant rate of 0.5 mm/min using a universal testing machine of type 1455 from ZwickRoell GmbH & Co. KG, Ulm, Germany and a special set of dies for the circular geometry.
4. Results and Discussion
Figure 3a shows the frequency spectrum of the measurement signal from a piezoelectric element during welding. The higher harmonic oscillations occurring during the process are clearly visible and demonstrate that there is a high degree of nonlinearity in the actual welding process. Figure 3b shows the FFT of a laser Doppler vibrometer measurement taken on the freely oscillating sonotrode of the ultrasonic welding system without load. The FFT shows that the sonotrode oscillates, with good approximation, only at its operating frequency of 20 kHz, and that no significant higher harmonics occur on the excitation side besides a peak at 60 kHz. That however is lower by two orders of magnitude compared to the operating frequency of 20 kHz. A comparison of the spectra shows that nonlinearity occurs in the welding process. The clear formation of higher harmonics reaffirms the consideration of both the sound energy density and the nonlinearity ratio for a quality assessment.
4.1. Sound Energy Density and Nonlinearity Ratio as Scalar Values
Figure 4 shows the sound energy density and nonlinearity ratio of PA6 and PP specimens welded for 0.3 s with varying amplitude and contact force settings. In this case, the values are calculated and given as averages over the full welding time, and the error bars indicate the standard deviation of three specimens per parameter set. The linear trend is only intended to visualize the overall trend of the respective values with increasing intensity of the welding parameters.
For both materials, the sound energy density increases with increasing process intensity, whereas the nonlinearity ratio decreases. This trend indicates that higher amplitude and force improve acoustic coupling and frictional energy transfer at the interface, thereby increasing the mechanical work input and the heat generated in the weld zone. This is consistent with the fact that higher amplitudes increase the vibration velocity. The resulting rise in local temperature increases the mobility of the polymer chains and eventually the polymer melt formation, which in turn should enhance weld strength. Accordingly, the overall lower nonlinearity ratio at higher settings suggests that the process becomes dominated by the viscoelastic and viscous dissipation mechanisms, while the intermittent contact effects and other nonlinearities contribute less to the measured spectrum. PA6 generally exhibits higher values than PP with both parameters, which can be attributed to differences both in acoustic impedance, stiffness, damping behavior, and melt response under ultrasonic excitation.
A comparison of sound energy density and tensile strength for the PA6 specimens is shown in Figure 5. As with the mean sound energy density, the mean tensile strength increases with increasing intensity of the welding parameters. This further indicates a clear positive relationship between the two values, with overall good correlation for the given sets of parameters. For the 36 µm amplitude, the tensile strength values are however less consistent than the sound energy density trend would suggest. This shows specimen-to-specimen differences, likely in alignment, melt formation, or interfacial contact.
The trends confirm that both metrics have potential as in-process indicators of weld development, because they change systematically with process intensity and broadly track the transition from insufficient interfacial heating to effective melting and consolidation. In real time, rising sound energy density can signal stronger energy delivery into the joint, while a falling nonlinearity ratio can indicate that the interface is moving from unstable contact and scattered vibration toward a more damped, melt-dominated state. With calibration using tensile tests, the relationship of the signals is not only suited for quality monitoring and trend detection, but also for weld strength prediction. However, the material dependence requires separate threshold windows for PA6 and PP, since their differing acoustic responses shift the sensor baselines and the point at which a satisfactory weld is reached.
4.2. Temporal Nonlinearity Ratio
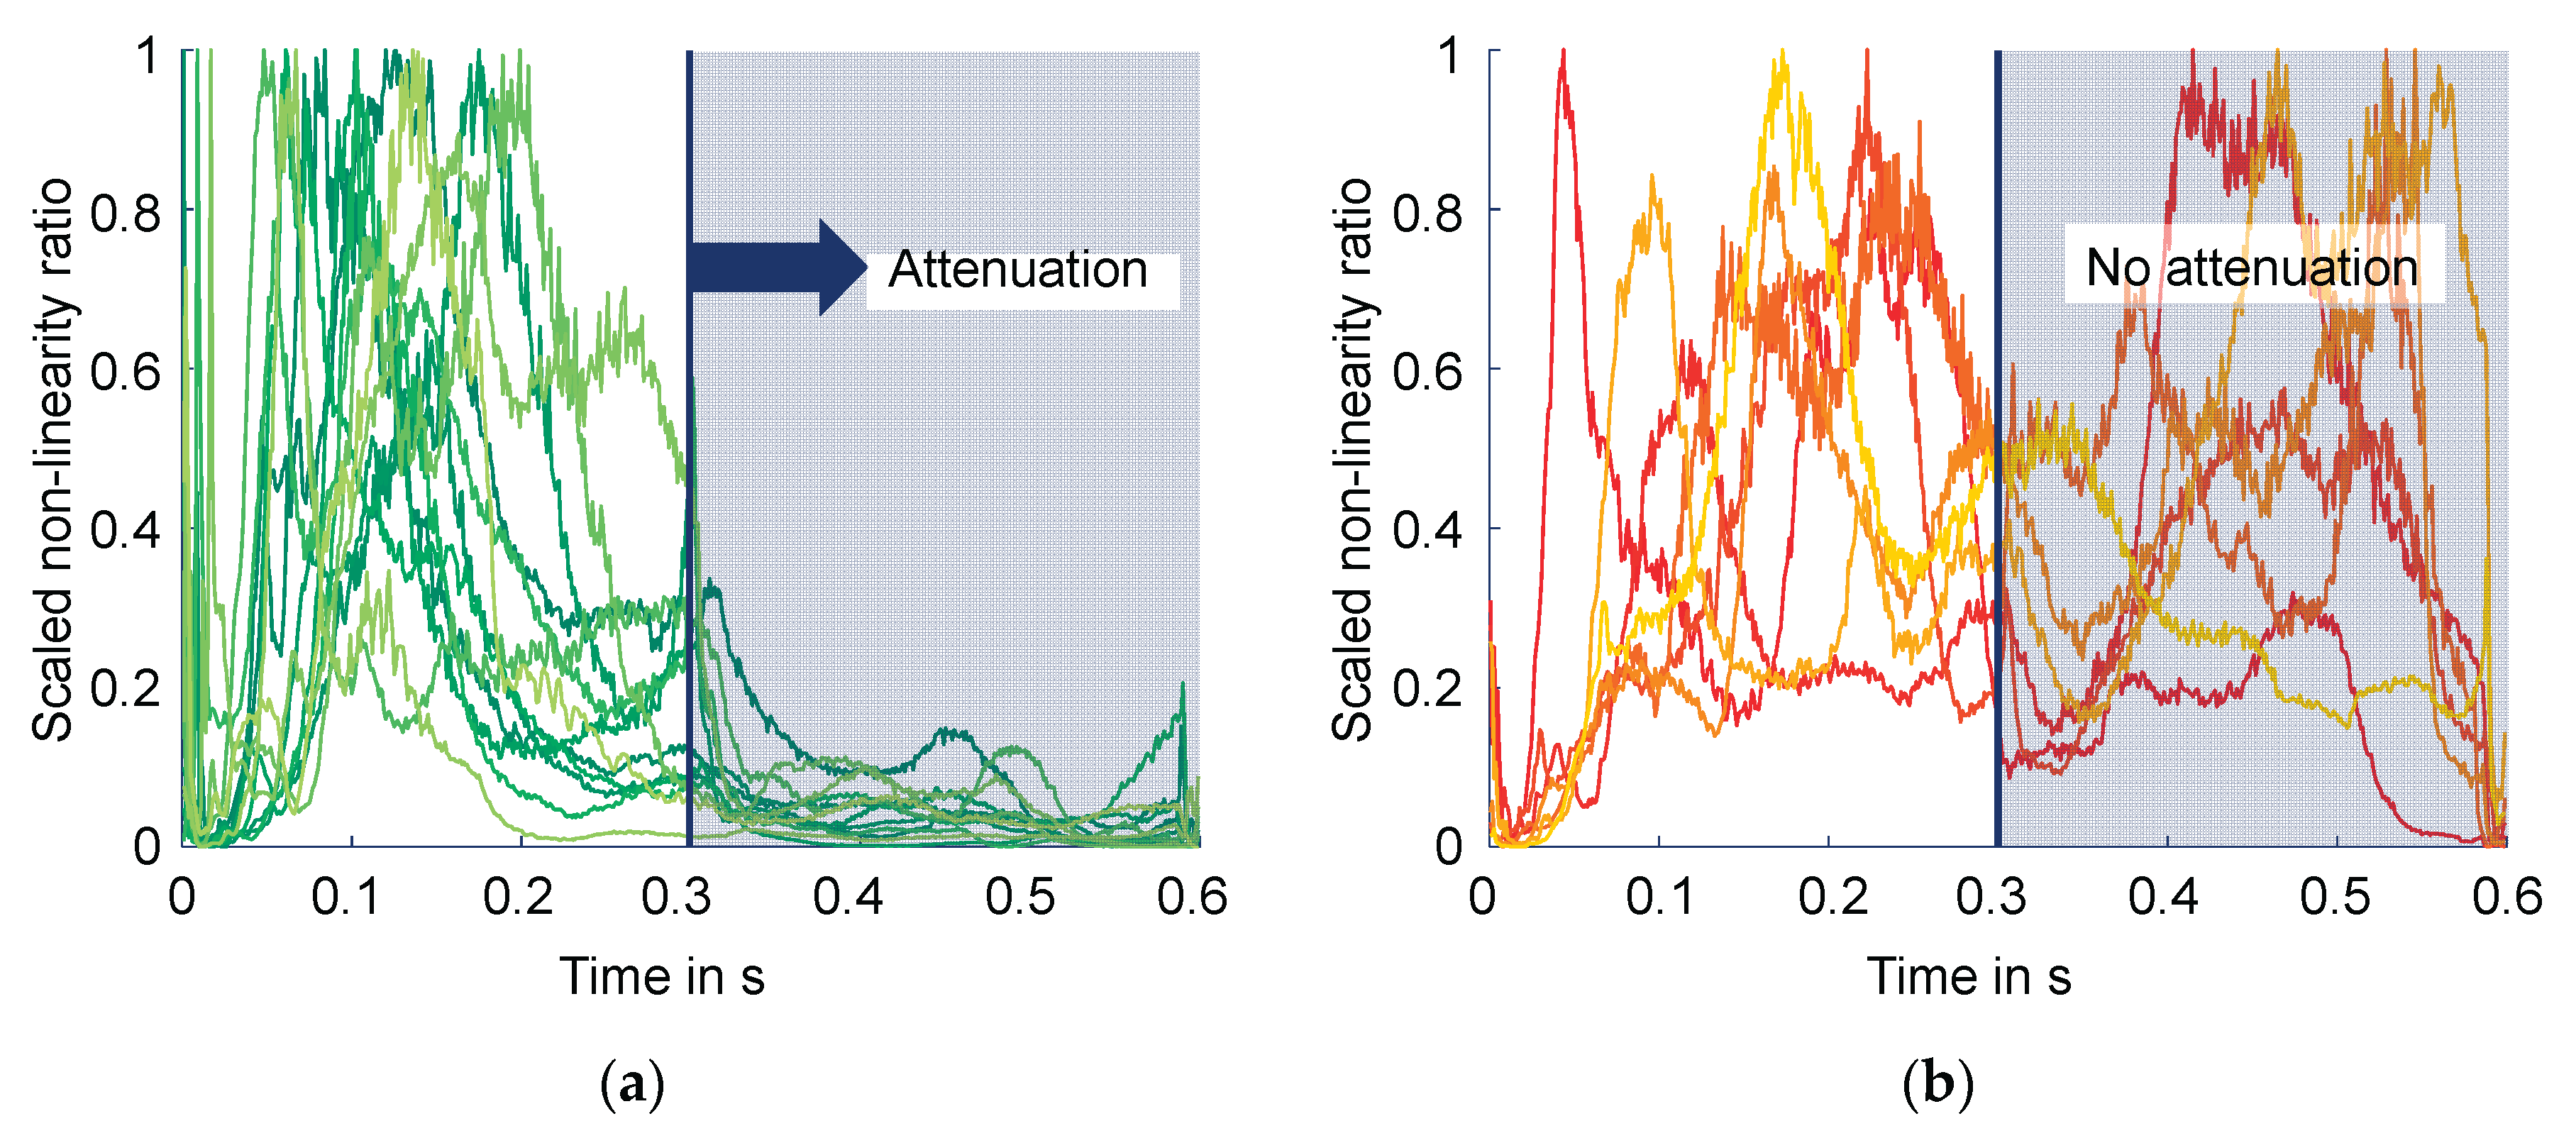
Tests on weld test specimens were also conducted to investigate the temporal nonlinearity ratio over the course of the welding process. For that, test series of 40 specimens each were welded using a constant set of welding parameters. The series shown in Figure 6 is welded for 0.6 s using an amplitude of 35 µm, and a contact force of 400 N. The nonlinearity ratio is calculated with the signal being discretized into 1 ms intervals using a sliding Fourier transform with no overlap. Each specimen curve is scaled to 0–1 based on the minimum and maximum values for comparison. Due to the welding time being doubled compared to the tests described in the previous section, the tensile strengths reached are much higher for these specimens. For the following comparison, they are assigned into classes accordingly, with OK specimens showing especially high values of > 2.8 kN and non-OK specimens showing especially low values of < 2.2 kN out of the test series.
The individual OK specimens, which showed high tensile strengths in the tensile test (Figure 6a), and the non-OK specimens, which showed low tensile strengths (Figure 6b), show distinctively different characteristic curves of the nonlinearity factor over the duration of the welding process. This contrasting nonlinear behavior can be explained by various nonlinearity mechanisms in the stress-strain behavior. The initiation of ultrasonic excitation in the process activates the mechanisms of nonlinearity (CAN or HN, depending on the pre-stress) and causes a sharp increase in nonlinearity in OK specimens at the beginning of the process. The contribution of CAN and HN promotes heat transfer and continues until a certain melt pool forms, which causes a sharp drop in nonlinearity due to the effects of viscosity (Figure 6a, 250–350 ms). Due to high damping, particularly at higher frequencies, the nonlinearity factor decreases again during this phase of the welding process.
With non-OK samples, the initial nonlinear response is significantly weaker, which could indicate excessive contact pre-strain that activates only the less efficient HN mechanism and thus yields less converted heat from the higher harmonic vibrations. Consequently, the melting process does not develop to its full extent, and the damping effect of viscosity on the nonlinear response is minimal. Instead, the nonlinearity factor remains at a high level until the end of the process, which can be associated with a potentially incompletely formed melt pool. Nonlinearity thus plays a dual role: On the one hand, these mechanisms ensure efficient energy conversion into heat; on the other hand, their decline over the course of the process due to melt viscosity indicates the development of a comprehensive melting process. These results underscore the suitability of nonlinear vibration behavior as a characteristic for the course of the ultrasonic welding process and the resulting weld quality.
5. Conclusion and Outlook
The results presented demonstrate the potential of piezoelectric transducers for sensory monitoring of the ultrasonic welding process. By measuring the vibrations generated in the welding process and analyzing the sound energy density in combination with nonlinear acoustic behavior, it is possible to draw conclusions about the resulting weld strength. In a first set of experiments, welding and testing PA6 and PP specimen using different process parameters showed correlations of the parameters with both the sound energy density and the nonlinearity ratio. A comparison of the evaluated sound energy densities with the results from the tensile test also showed the energy density correlating with weld strength. Both for low as well as high welding amplitudes and contact forces, the sound energy density follows the trend of the resulting weld strength, with high energy densities leading to high tensile strengths and vice versa.
In further experiments, the evolution and development of nonlinear vibration effects over the course of the welding process was investigated using the temporal nonlinearity ratio. For that, samples classified as OK and non-OK based on tensile strength samples were observed. The data showed some characteristic features caused by the mechanisms of nonlinearity acting in the welding zone, especially in the second half of the process. While the nonlinearity ratio in OK samples decreased over the course of the welding process due to the strong attenuation of the viscoelastic melt forming in the welding zone, the nonlinearity ratio in non-OK samples remains at a similar level and can be associated with a less pronounced melt cushion.
Future work should refine real-time thresholds by calibrating sensor signals using larger datasets, incorporating machine learning for pattern recognition across materials. Integrating complementary metrics could enable a precise OK/non-OK classification without post-weld tensile testing for calibration. Extending to variable weld times, geometries, and materials will further validate the robustness of the approach for industrial inline monitoring.
Author Contributions
All authors have accepted responsibility for the entire content of this manuscript and approved this version.
Funding
The results presented here originate from a research project funded by the German Research Foundation (DFG, Deutsche Forschungsgemeinschaft) – grant 540761969.
Data Availability Statement
The datasets generated and/or analyzed in the current study are available from the corresponding author on request.
Acknowledgments
We would like to thank Herrmann Ultraschalltechnik GmbH & Co. KG, Karlsbad, Germany for providing the ultrasonic welding system.
Conflicts of Interest
The authors declare no conflict of interest.
References
- Bonten, C. Plastics Technology: Introduction and Fundamentals; Hanser: Munich, Germany, 2019; ISBN 978-1-56990-767-2. [Google Scholar]
- Zhi, Q.; Li, Y.; Tan, X.; et al. Ultrasonic Welding of Acrylonitrile–Butadiene–Styrene Thermo plastics without Energy Directors. Materials 2024, 17(15), 3638. [Google Scholar] [CrossRef] [PubMed]
- Raza, S.F.; Khan, S.A.; Mughal, M.P. Optimizing the weld factors affecting ultrasonic welding of thermoplastics. Int. J. Adv. Manuf. Technol. 2019, 103, 2053–2067. [Google Scholar] [CrossRef]
- Ling, S.-F.; Luan, J.; Li, X.; et al. Input electrical impedance as signature for nondestructive evaluation of weld quality during ultrasonic welding of plastics. NDT E Int. 2006, 39(1), 13–18. [Google Scholar] [CrossRef]
- Müller, F.W.; Chen, C.-Y.; Schiebahn, A.; et al. Application of electrical power measurements for process monitoring in ultrasonic metal welding. Weld. World 2023, 67, 395–415. [Google Scholar] [CrossRef]
- Hongoh, M.; Miura, H.; Ueoka, T.; et al. Temperature Rise and Welding Characteristics of Various-Frequency Ultrasonic Plastic Welding Systems. Jpn. J. Appl. Phys. 2006, 45, 4806–4811. [Google Scholar] [CrossRef]
- Müller, F.W.; Mirz, C.; Schiebahn, A.; et al. Influence of quality features, disturbances, sensor data, and measurement time on quality prediction for ultrasonic metal welding. Weld. World 2025, 69, 1961–1989. [Google Scholar] [CrossRef]
- Krohn, N. Nonlinear dynamic material behaviour for defect selective nondestructive testing. In Dissertation; University of Stuttgart, Institut für Kunststoffprüfung und Kunststoffkunde: Stuttgart, 2002. [Google Scholar] [CrossRef]
- Solodov, I.; Kreutzbruck. M. Monitoring of Bonding Quality in CFRP Composite Laminates by Measurements of Local Vibration Nonlinearity. In Structural Health Monitoring 2019; DEStech Publications: Lancaster, PA, USA, 2019; ISBN 978-1-60595-601-5. [Google Scholar]
- Guyer, R.A.; Johnson, P.A. Nonlinear mesoscopic elasticity. The complex behaviour of granular media including rocks and soil; Wiley: Weinheim, Germany, 2009; ISSN ISBN 3527407030. [Google Scholar]
- Solodov, I.; Krohn, N.; Busse, G. CAN: an example of nonclassical acoustic nonlinearity in solids. Ultrasonics 2002, 40(1-8), 621–625. [Google Scholar] [CrossRef] [PubMed]
- Rothenfusser, M.; Mayr, M.; Baumann, J. Acoustic nonlinearities in adhesive joints. Ultrasonics 2000, 38(1-8), 322–326. [Google Scholar] [CrossRef] [PubMed]
- Ohara, Y.; Mihara, T.; Yamanaka, K. Effect of adhesion force between crack planes on subharmonic and DC responses in nonlinear ultrasound. Ultrasonics 2006, 44(2), 194–199. [Google Scholar] [CrossRef] [PubMed]
- Donskoy, D.; Sutin, A.; Ekimov, A. Nonlinear acoustic interaction on contact interfaces and its use for nondestructive testing. NDT E Int. 2001, 34(4), 231–238. [Google Scholar] [CrossRef]
- Zheng, Y.; Maev, R.G.; Solodov, I.Y. Nonlinear acoustic applications for material characterization: A review. Can. J. Phys. 2000, 77(12), 927–967. [Google Scholar] [CrossRef]
- Solodov, I.; Krohn, N.; Busse, G. Nonlinear Ultrasonic NDT for early Defect Recognition and Imaging. 10th European Conference on Non-Destructive Testing (ECNDT), Moscow, 2010, June 7–11. [Google Scholar]
- Solodov, I.; Busse, G. Nonlinear air-coupled emission: The signature to reveal and image microdamage in solid materials. Appl. Phys. Lett. 2007, 91(25), 251910. [Google Scholar] [CrossRef]
- Solodov, I. Nonlinear acoustic response of damage applied for diagnostic Imaging. In Nonlinear ultrasonic and vibro-acoustical techniques for non-destructive evaluation; Kundu, T., Ed.; Springer: Cham, Switzerland, 2019; ISBN 978-3-319-94474-6. [Google Scholar]
- Ostrovsky, L.A.; Johnson, P.A. Dynamic nonlinear elasticity in geomaterials. Riv. Nuovo Cim. 2001, 24(7), 1–46. [Google Scholar] [CrossRef]
- Hamilton, M.F.; Blackstock, D.T. (Eds.) Nonlinear acoustics; Springer: Cham, Switzerland, 2024; ISBN 978-3-031-58963-8. [Google Scholar]
Figure 1.
Schematic diagram of an ultrasonic welding system for plastics including a triangular energy director geometry for defined energy input into the welding zone.
Figure 1.
Schematic diagram of an ultrasonic welding system for plastics including a triangular energy director geometry for defined energy input into the welding zone.
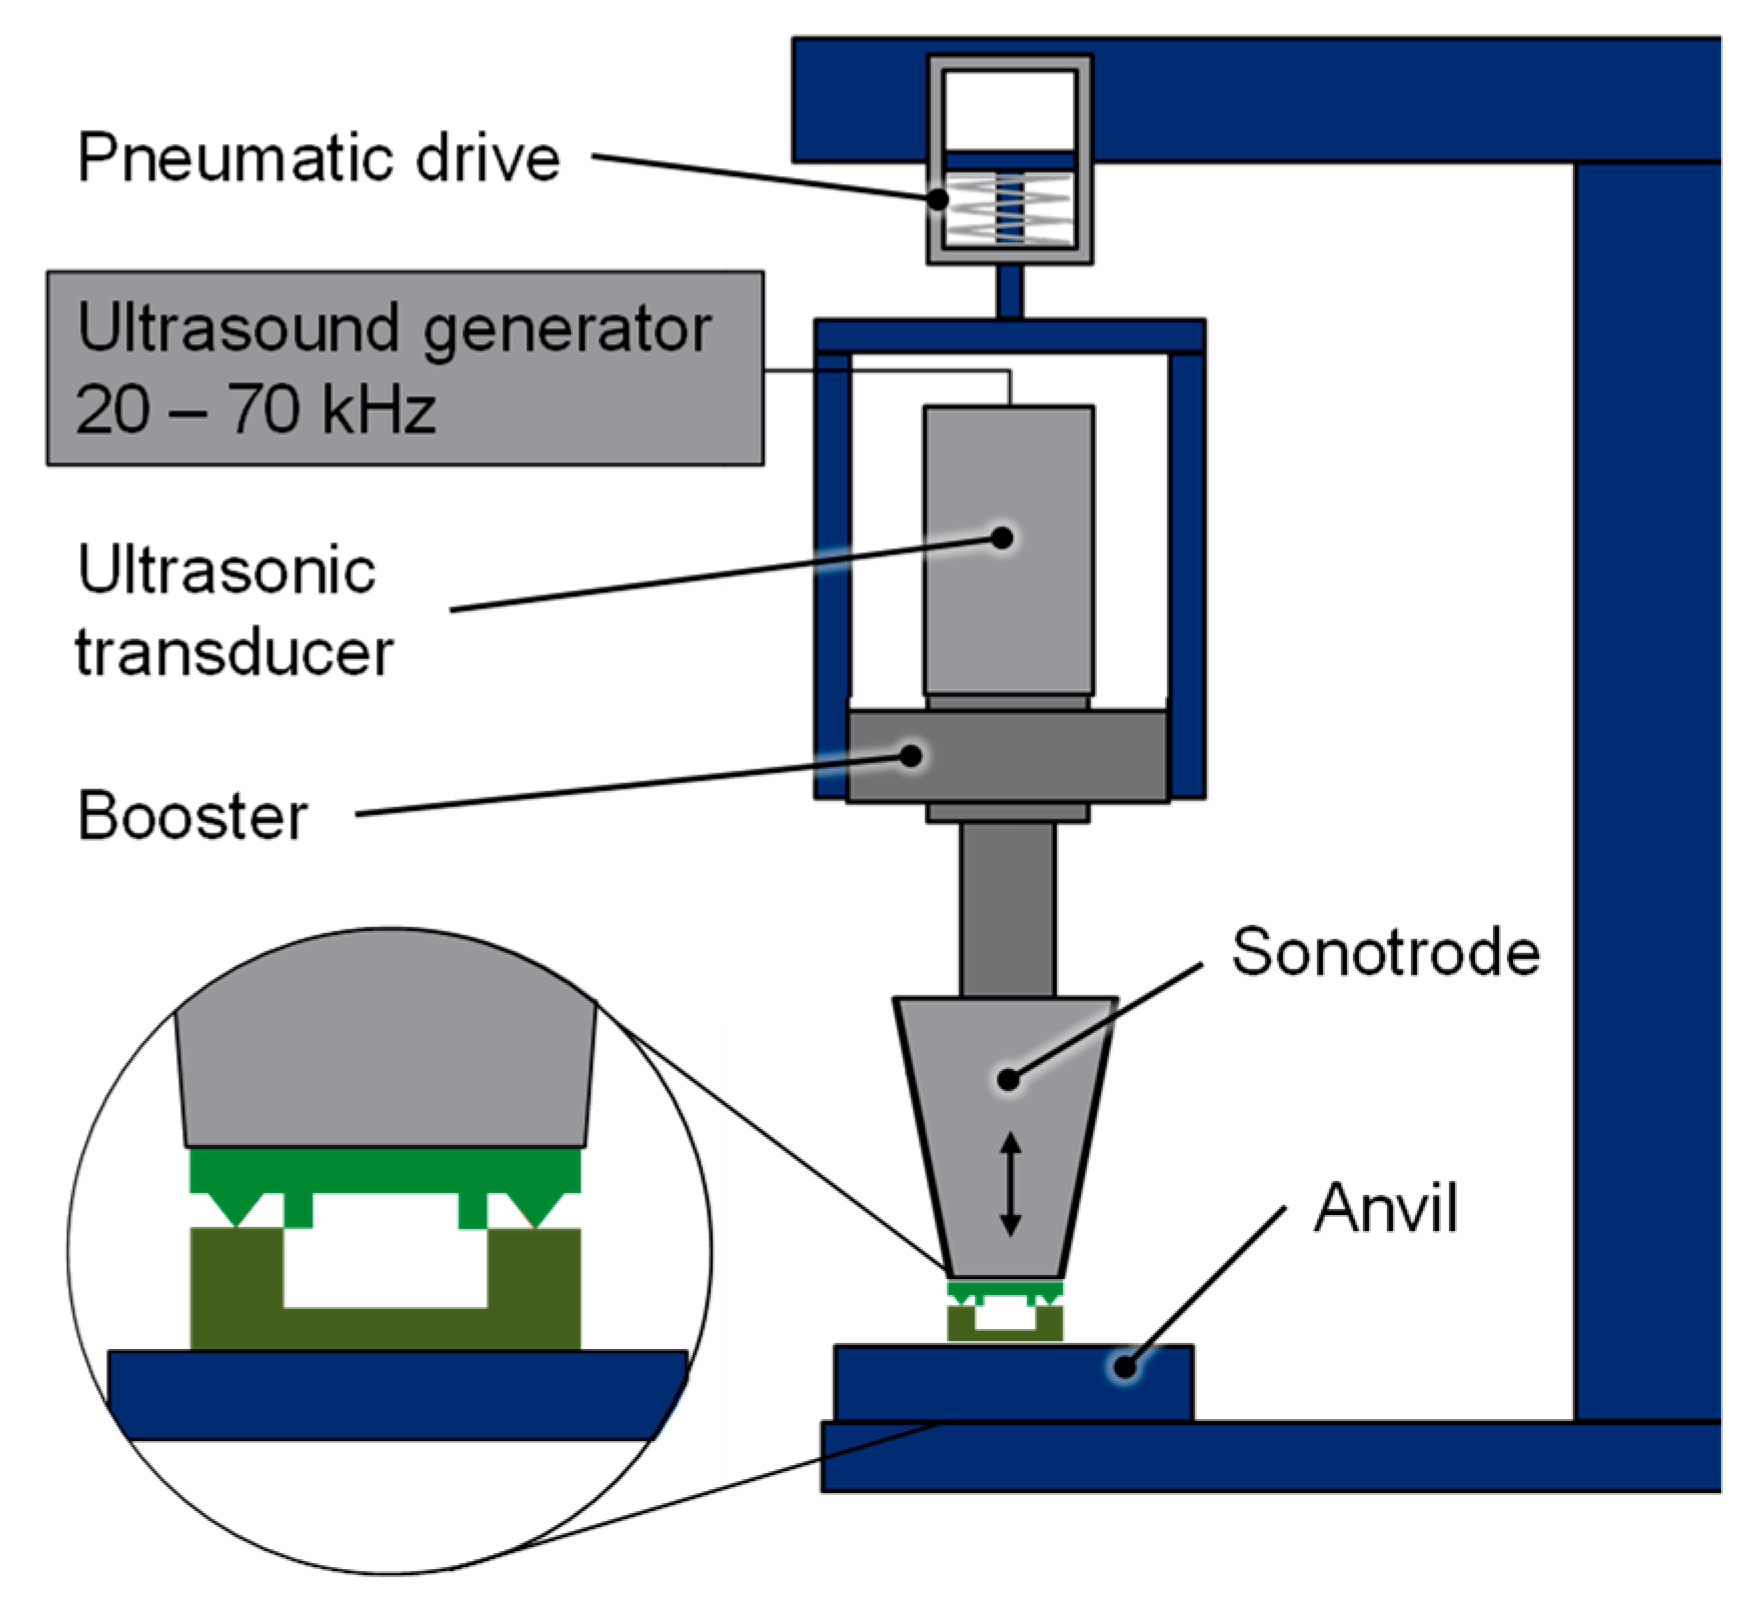
Figure 2.
Experimental setup to monitor the ultrasonic welding process using piezo sensors at the anvil.
Figure 2.
Experimental setup to monitor the ultrasonic welding process using piezo sensors at the anvil.
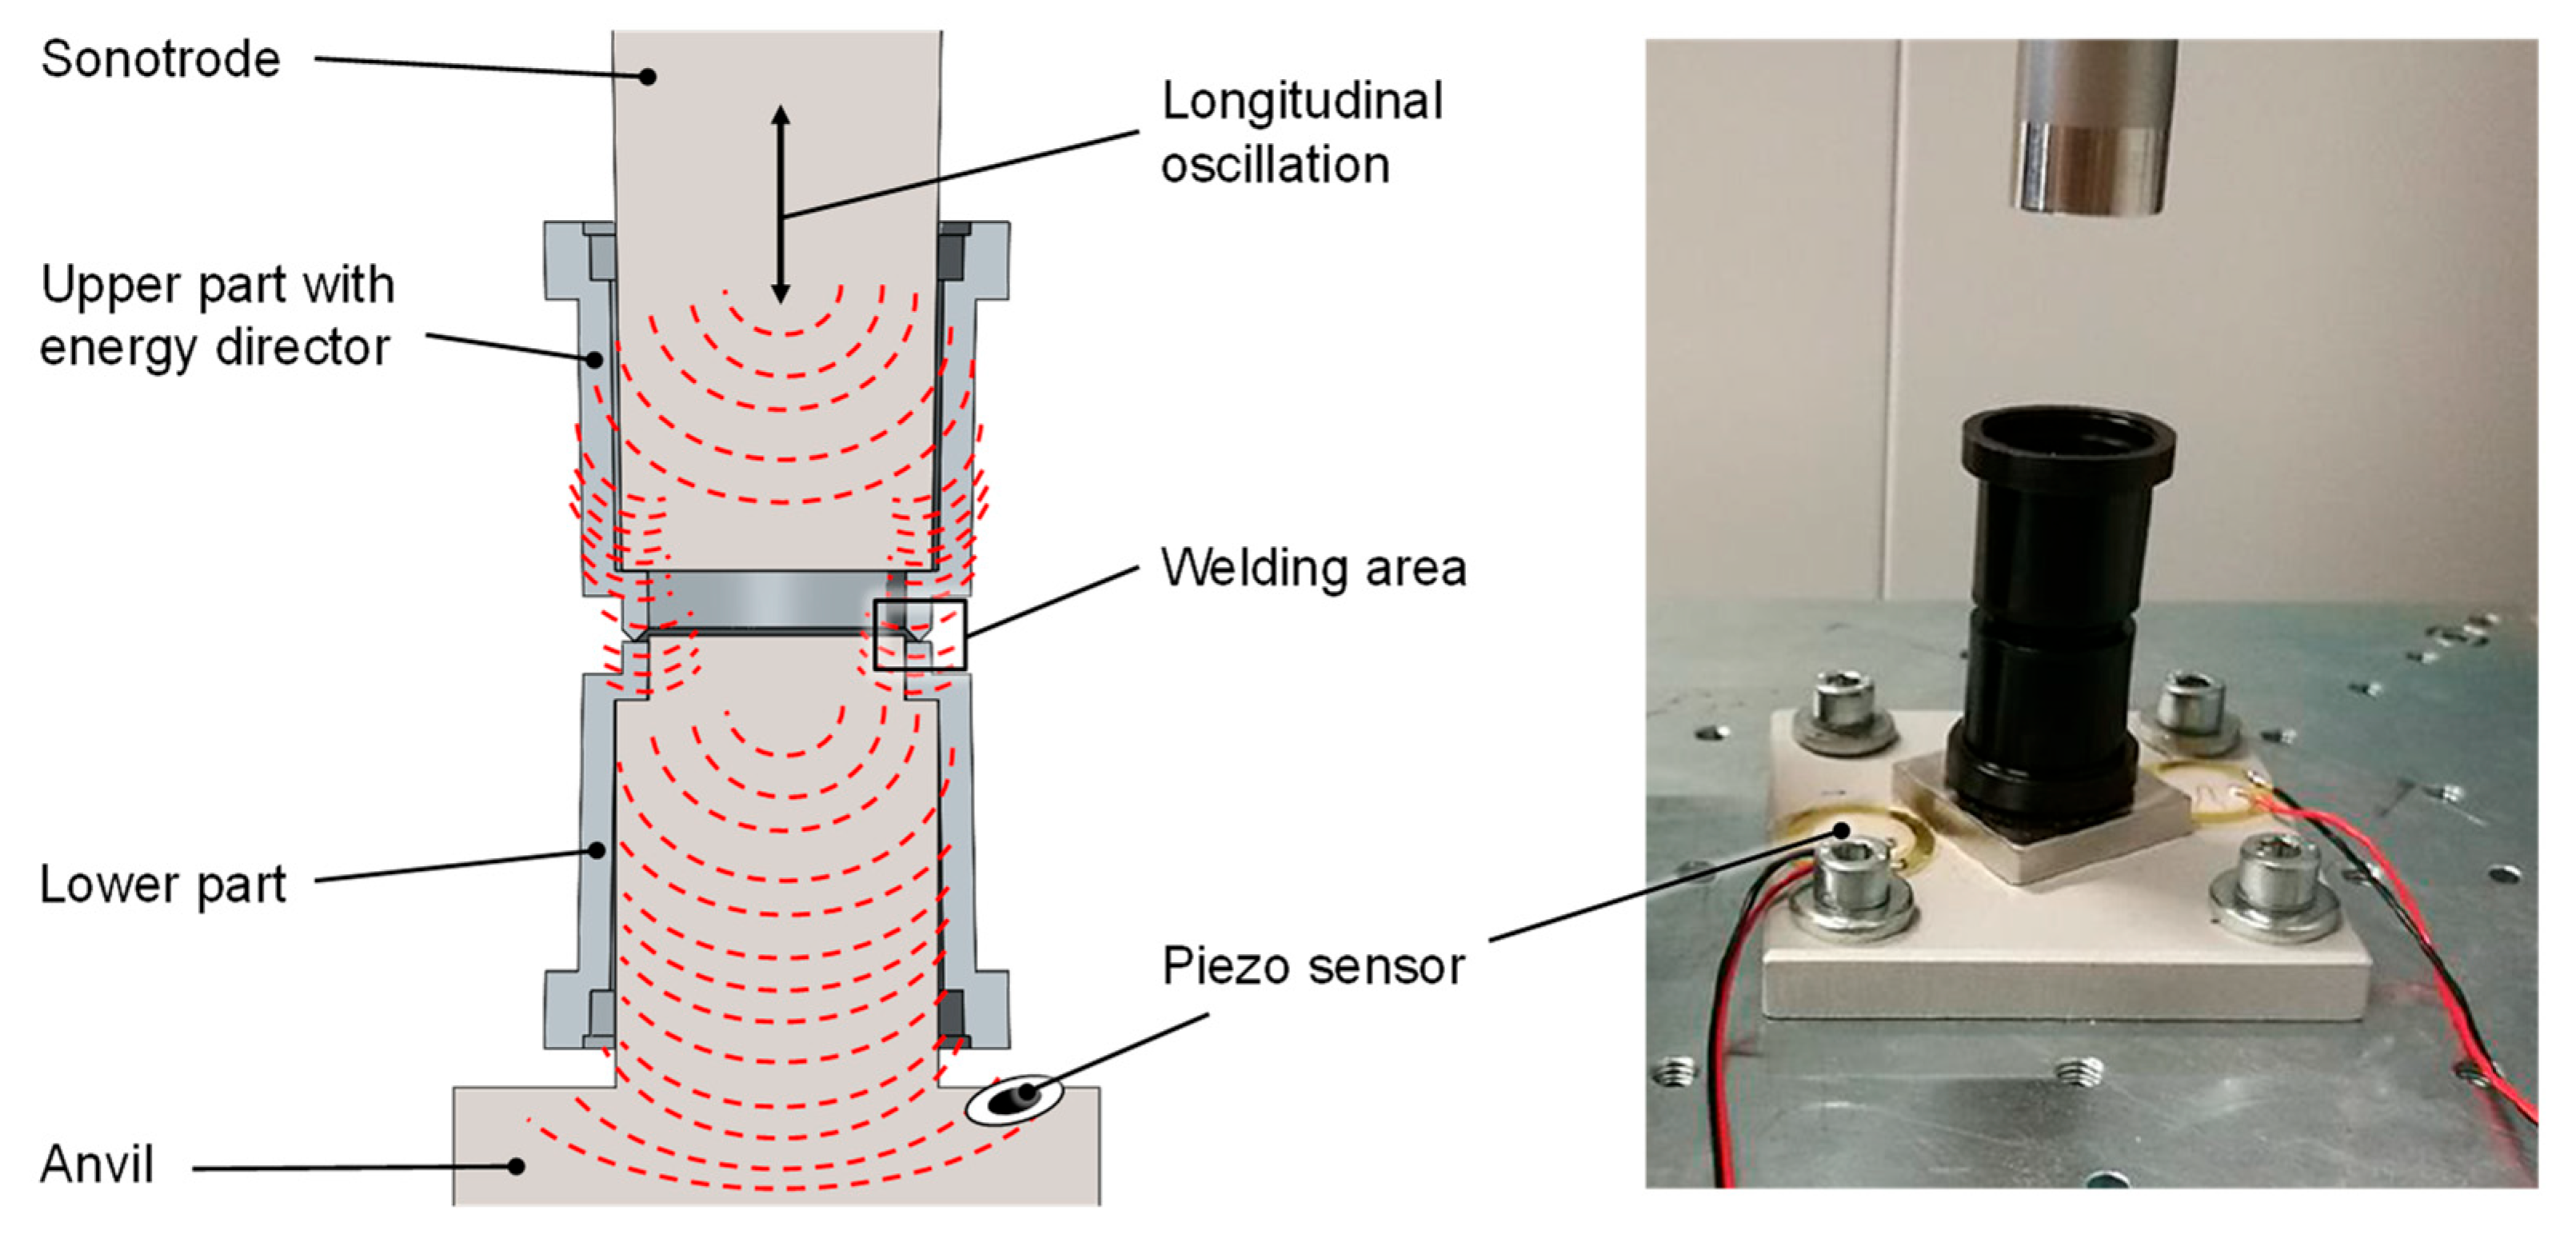
Figure 3.
(a) Frequency spectrum of a piezo sensor measured at the anvil during welding with no window applied; (b) Frequency spectrum of the freely oscillating sonotrode without load measured with the laser Doppler vibrometer using a Hann window for signal continuity.
Figure 3.
(a) Frequency spectrum of a piezo sensor measured at the anvil during welding with no window applied; (b) Frequency spectrum of the freely oscillating sonotrode without load measured with the laser Doppler vibrometer using a Hann window for signal continuity.
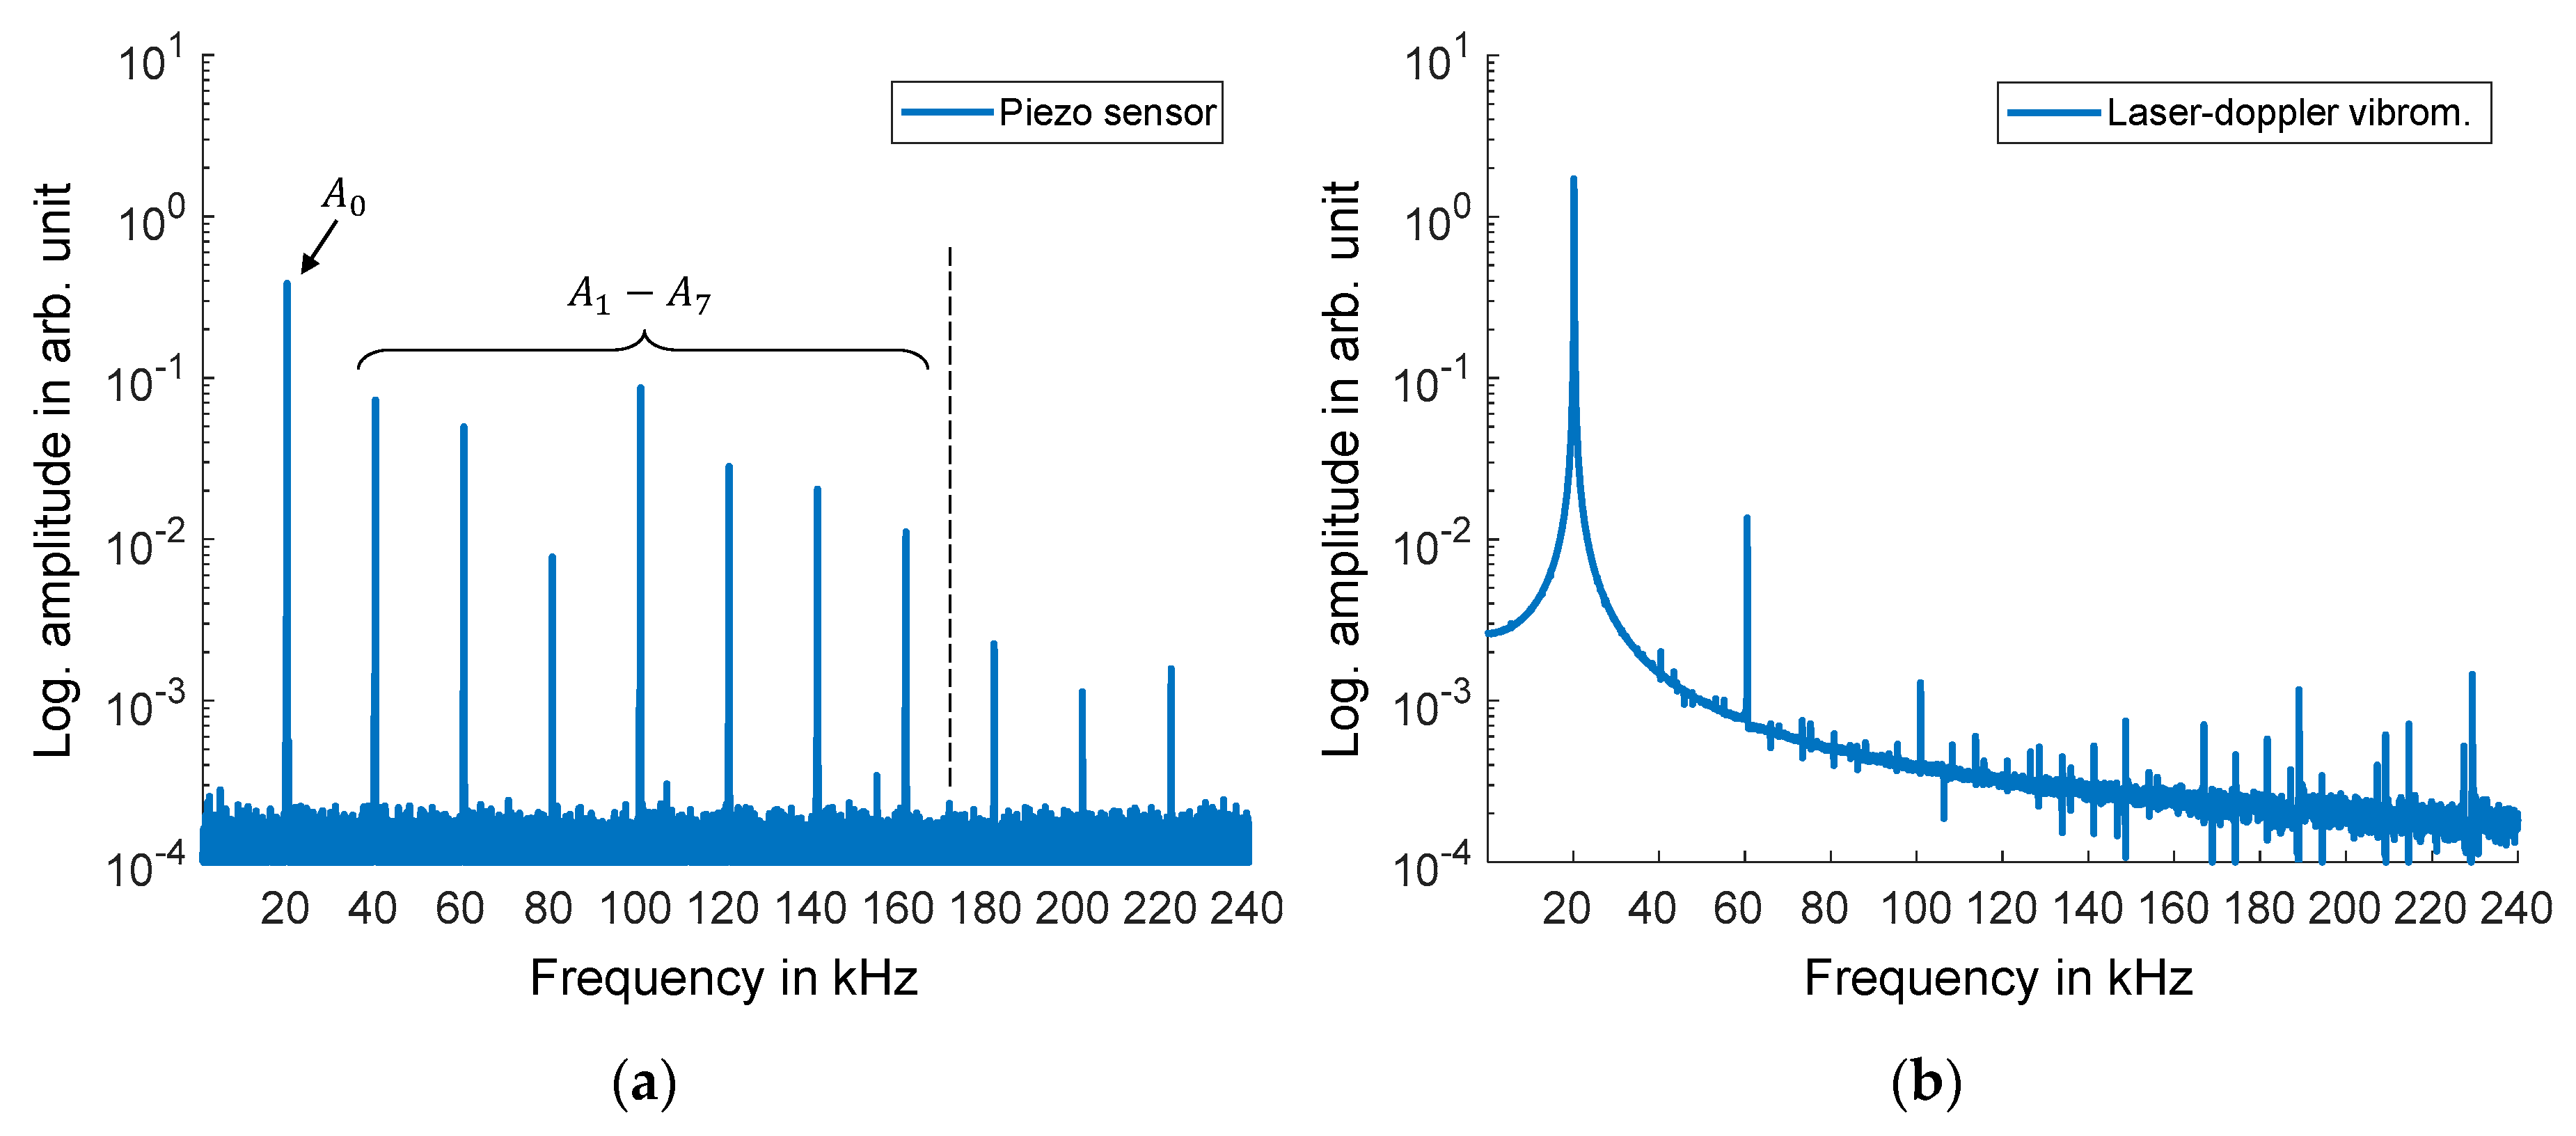
Figure 4.
(a) Sound energy density for PA6 and PP specimens welded for 0.3 s with varying amplitude and contact force; (b) Corresponding nonlinearity ratio for the specimens; the linear trends are for visualization only.
Figure 4.
(a) Sound energy density for PA6 and PP specimens welded for 0.3 s with varying amplitude and contact force; (b) Corresponding nonlinearity ratio for the specimens; the linear trends are for visualization only.
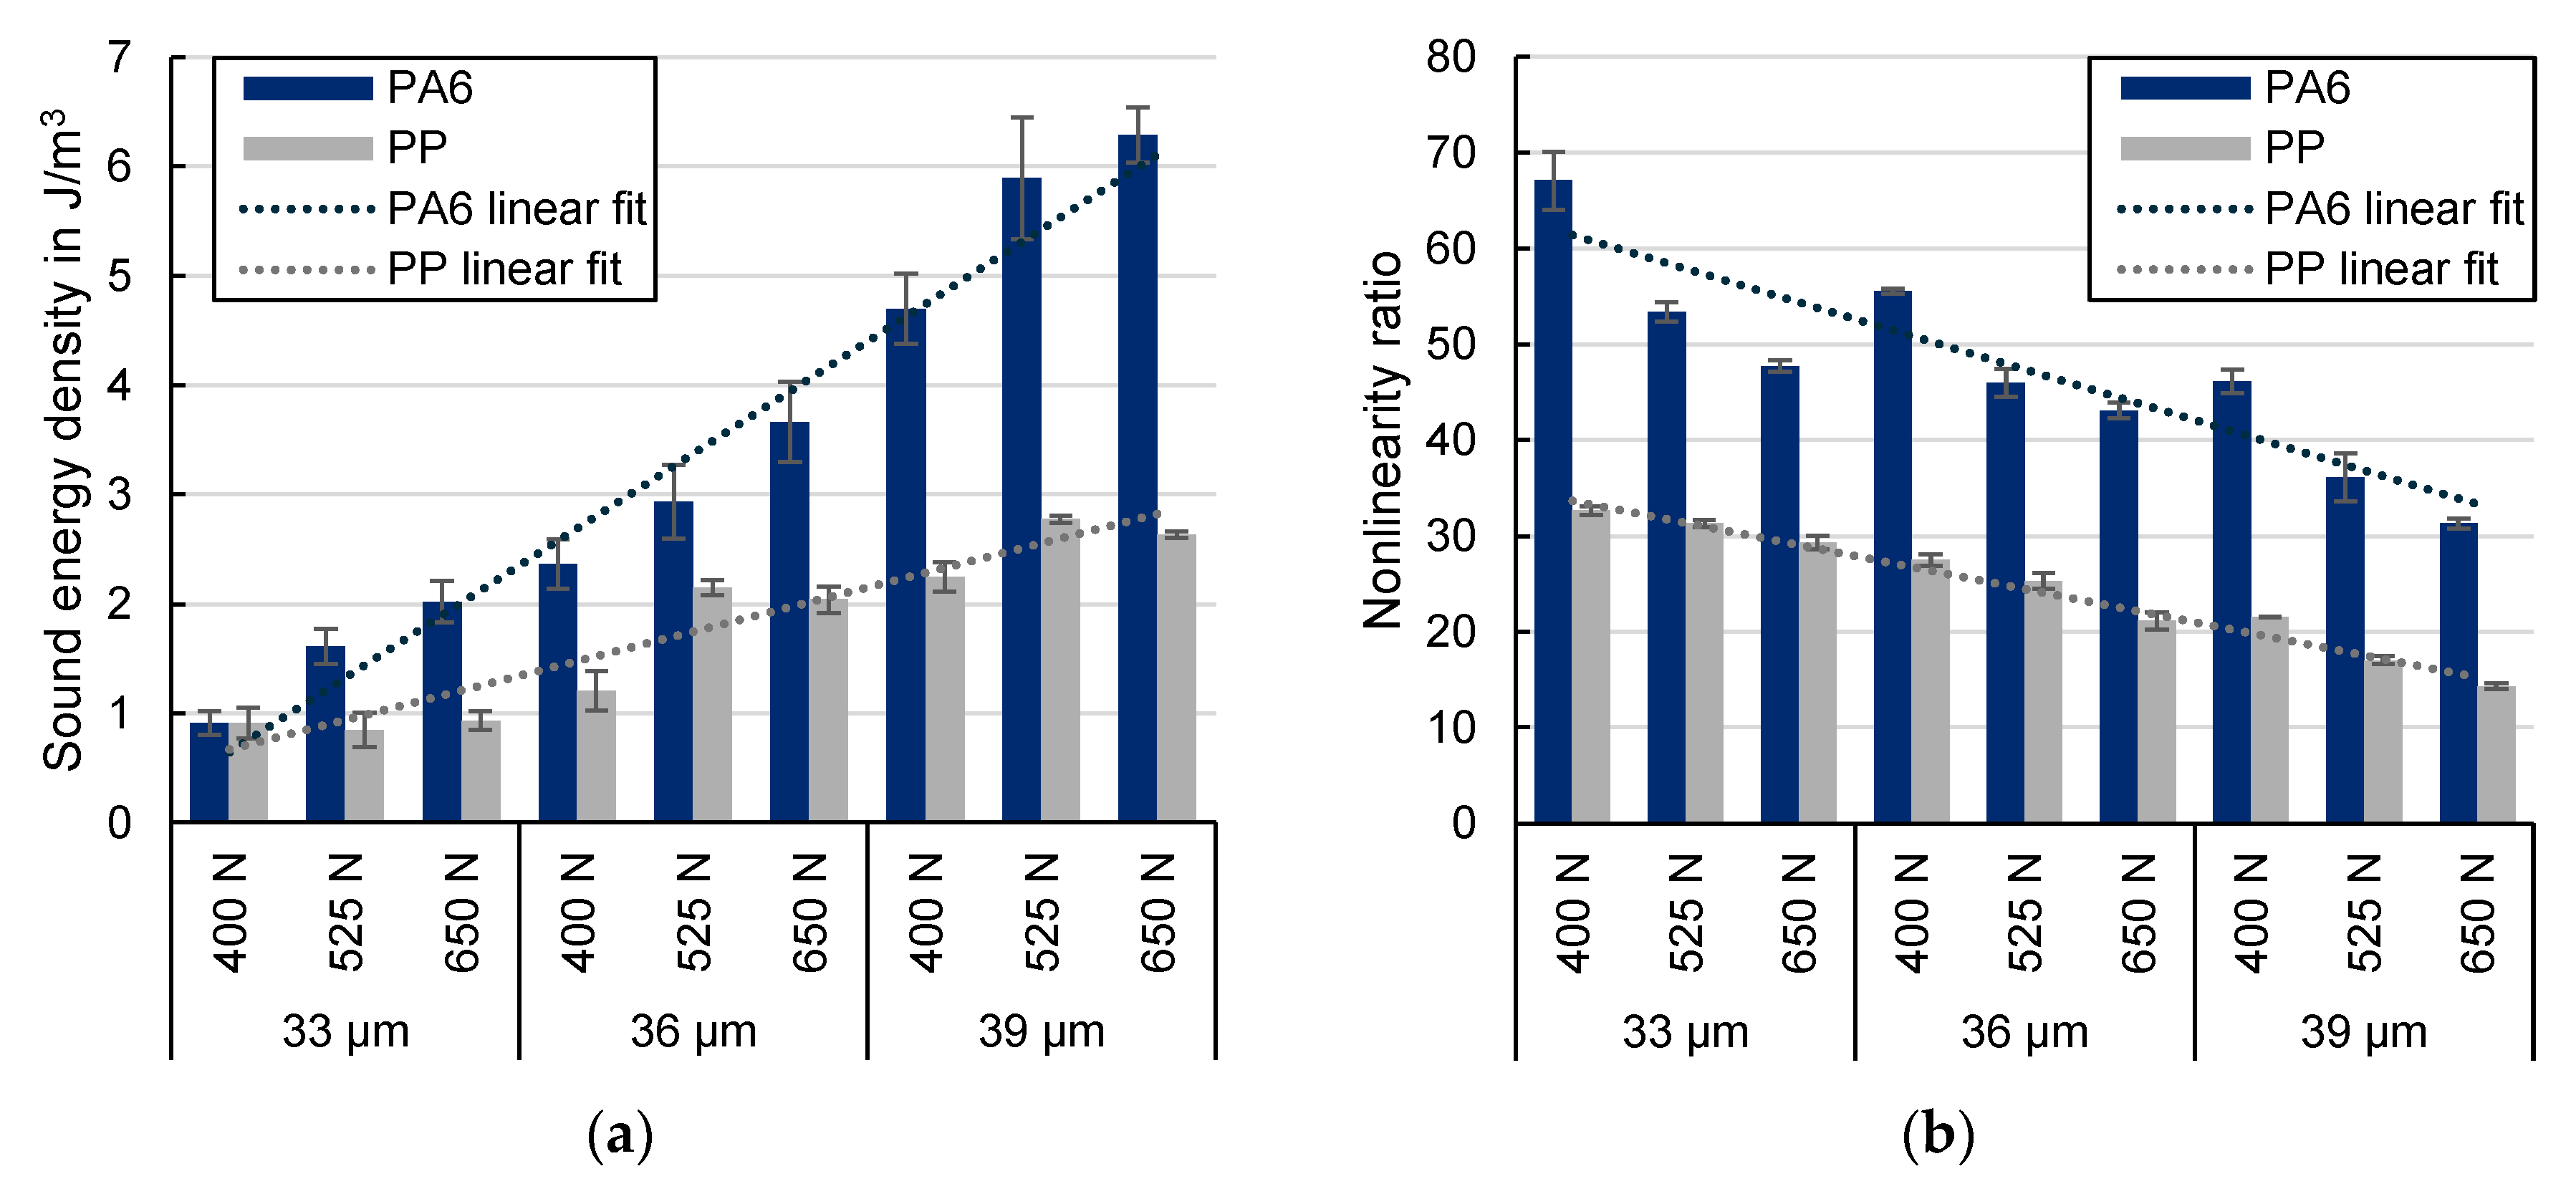
Figure 5.
Comparison of sound energy density and tensile strength for PA6 specimens welded for 0.3 s with varying amplitude and contact force.
Figure 5.
Comparison of sound energy density and tensile strength for PA6 specimens welded for 0.3 s with varying amplitude and contact force.
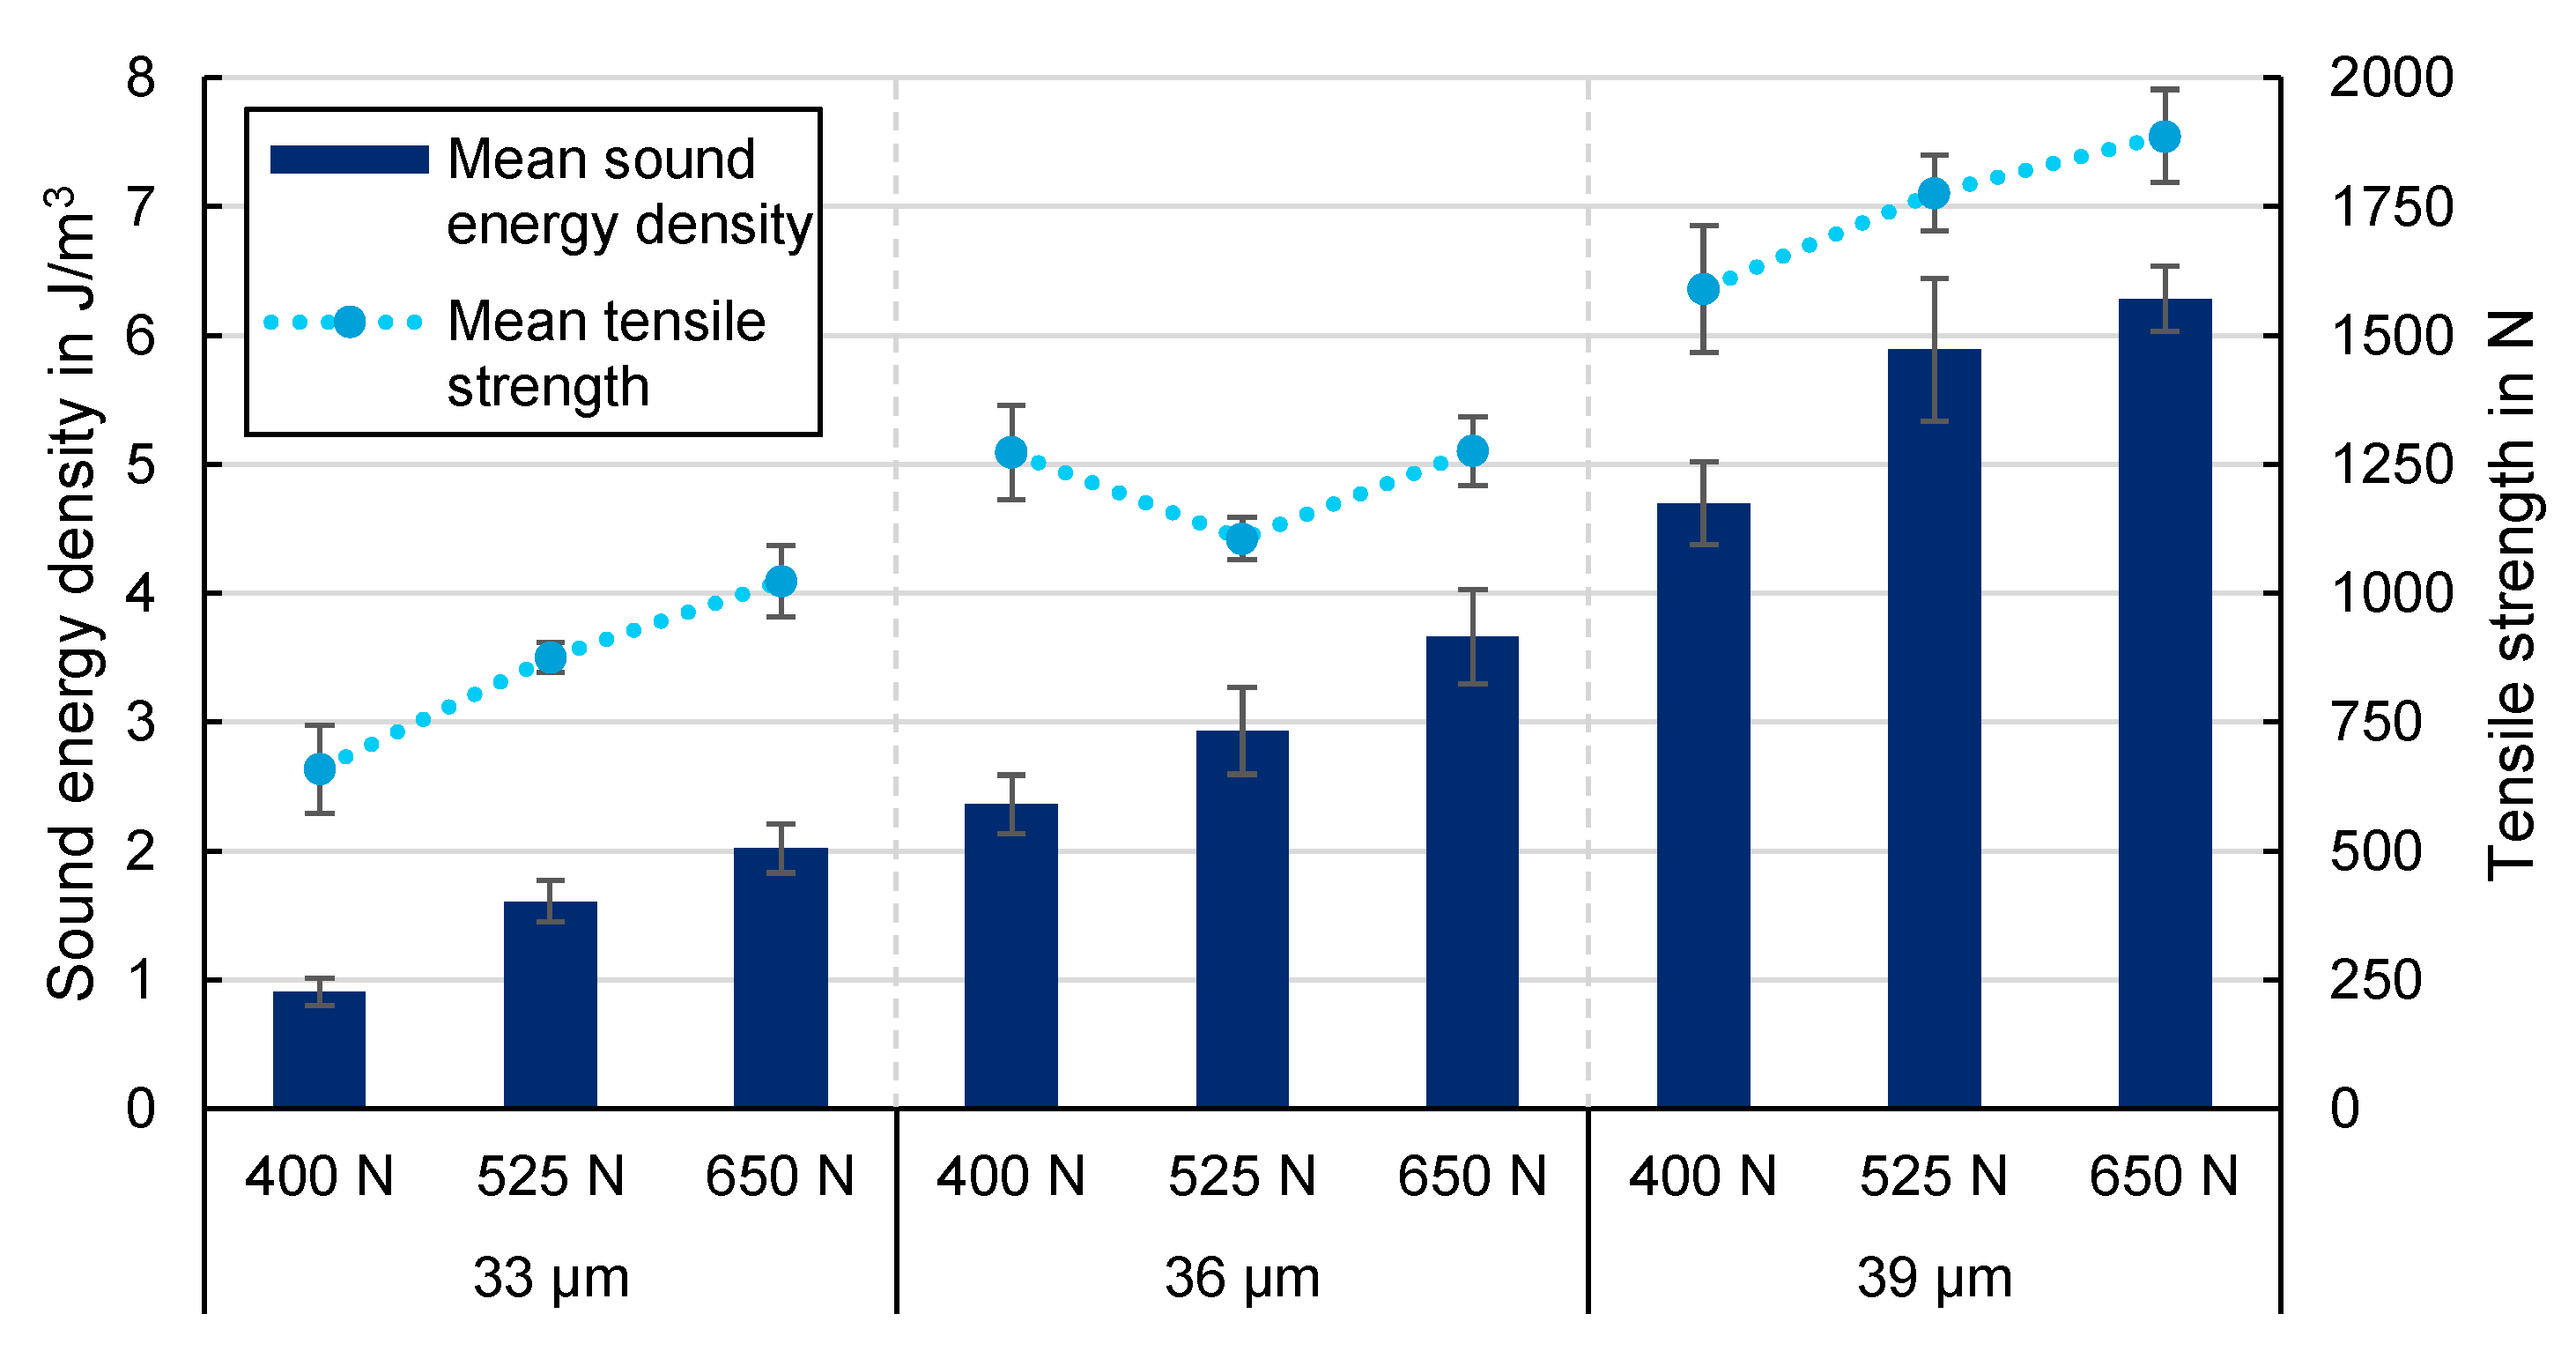
Figure 6.
(a) Temporal nonlinearity ratio over the course of the welding process for OK specimens showing high tensile strength > 2.8 kN out of a test series of 40; (b) Non-OK specimens showing low tensile strength < 2.2 kN.
Figure 6.
(a) Temporal nonlinearity ratio over the course of the welding process for OK specimens showing high tensile strength > 2.8 kN out of a test series of 40; (b) Non-OK specimens showing low tensile strength < 2.2 kN.
Disclaimer/Publisher’s Note: The statements, opinions and data contained in all publications are solely those of the individual author(s) and contributor(s) and not of MDPI and/or the editor(s). MDPI and/or the editor(s) disclaim responsibility for any injury to people or property resulting from any ideas, methods, instructions or products referred to in the content. |
© 2026 by the authors. Licensee MDPI, Basel, Switzerland. This article is an open access article distributed under the terms and conditions of the Creative Commons Attribution (CC BY) license (http://creativecommons.org/licenses/by/4.0/).
Copyright: This open access article is published under a Creative Commons CC BY 4.0 license, which permit the free download, distribution, and reuse, provided that the author and preprint are cited in any reuse.


